Article

A Novel Network-Based Computational Model for Prediction of Potential LncRNA–Disease Association

1
College of Computer Engineering & Applied Mathematics, Changsha University, Changsha 410000, China
2
Key Laboratory of Hunan Province for Internet of Things and Information Security, Xiangtan University, Xiangtan 411100, China
*
Author to whom correspondence should be addressed.
Int. J. Mol. Sci. 2019, 20(7), 1549; https://0-doi-org.brum.beds.ac.uk/10.3390/ijms20071549
Submission received: 18 February 2019 / Revised: 22 March 2019 / Accepted: 25 March 2019 / Published: 28 March 2019
(This article belongs to the Section Molecular Informatics)

Abstract

:
Accumulating studies have shown that long non-coding RNAs (lncRNAs) are involved in many biological processes and play important roles in a variety of complex human diseases. Developing effective computational models to identify potential relationships between lncRNAs and diseases can not only help us understand disease mechanisms at the lncRNA molecular level, but also promote the diagnosis, treatment, prognosis, and prevention of human diseases. For this paper, a network-based model called NBLDA was proposed to discover potential lncRNA–disease associations, in which two novel lncRNA–disease weighted networks were constructed. They were first based on known lncRNA–disease associations and topological similarity of the lncRNA–disease association network, and then an lncRNA–lncRNA weighted matrix and a disease–disease weighted matrix were obtained based on a resource allocation strategy of unequal allocation and unbiased consistence. Finally, a label propagation algorithm was applied to predict associated lncRNAs for the investigated diseases. Moreover, in order to estimate the prediction performance of NBLDA, the framework of leave-one-out cross validation (LOOCV) was implemented on NBLDA, and simulation results showed that NBLDA can achieve reliable areas under the ROC curve (AUCs) of 0.8846, 0.8273, and 0.8075 in three known lncRNA–disease association datasets downloaded from the lncRNADisease database, respectively. Furthermore, in case studies of lung cancer, leukemia, and colorectal cancer, simulation results demonstrated that NBLDA can be a powerful tool for identifying potential lncRNA–disease associations as well.

1. Introduction

In recent years, accumulating evidence studies have shown that non-coding RNAs (ncRNAs) are involved in various biological processes in the human body [1,2,3], and particularly long non-coding RNAs (lncRNAs), as a class of important heterologous ncRNAs with a length greater than 200 nt, play critical roles in various human biological processes such as chromatin modification, cell differentiation, proliferation and apoptosis, translational and post-translational regulation, and so on [4,5,6]. Moreover, mutation and disorder of lncRNAs may cause a broad range of complex human diseases [6,7]. For example, researchers have found that lncRNA-UCA1 will be expressed at high levels in lung cancer, bladder cancer, breast cancer, and colorectal cancer [8]. LncRNA HOTAIR can promote the malignant growth of human liver cancer stem cells by downregulating SETD2 in liver cancer stem cells [9]. Hence, detecting potential lncRNA–disease associations can not only help us understand the pathogenesis of human diseases at the molecular level, but also further facilitate the diagnosis, treatment, and prevention of human diseases [10].
Currently, with the rapid development of bioinformatics, some lncRNA–disease association databases such as LncRNADisease [11] and Lnc2Cancer [12] have been established successively. However, the number of known lncRNA–disease associations in these databases is far from meeting the needs of modern medical researches, due to traditional biological experiment methods for discovering potential relationships between lncRNAs and diseases that are very expensive and time-consuming [13]. Therefore, more and more researchers have devoted efforts to constructing computational models to identify potential relationships between lncRNAs and diseases. For instance, Chen and Yan [14] proposed a semi-supervised learning method called LRLSLDA to identify possible associations between lncRNAs and diseases. Yu et al. [15] presented a computational model which they called NBCLDA based on the naive Bayesian classifier to explore potential relationships between lncRNAs and diseases. In contrast to the above machine learning-based models, according to the assumption that functionally similar lncRNAs show similar interaction patterns with similar diseases, Sun et al. [16] proposed a computational model, RWRlncD, in which a global network was constructed first based on disease similarity, lncRNA functional similarity, and known lncRNA–disease associations, and then a random walk with restart method was implemented on the newly constructed global network to infer potential lncRNA–disease associations. Yao et al. [17] proposed a new computational model called LncPriCNet, in which a heterogeneous random walk was designed on a multi-layer composite network consisting of genes, lncRNAs, phenotypes, and associations between them to prioritize lncRNAs that are potentially associated with diseases. In all the above random walk-based models, it is obvious that only known lncRNA–disease associations are considered. In contrast to that, based on known lncRNA–miRNA and miRNA–disease associations, Chen [18] proposed a novel computational model called HGLDA to calculate potential association probabilities between lncRNAs and diseases, in which a hypergeometric distribution test was applied for each lncRNA–disease pair to indicate whether the lncRNA and disease significantly shared common miRNAs. Zhao et al. [19] developed a distance correlation set-based computational model, DCSMDA, to predict potential miRNA–disease associations, in which a tripartite miRNA–lncRNA–disease network was constructed through integrating disease similarity, miRNA similarity, and lncRNA similarity.
Inspired by the above-mentioned state-of-the-art methods, a network-based computational model NBLDA was proposed for this paper to predict potential lncRNA–disease associations based on the assumption that functionally similar lncRNAs show similar interaction patterns with similar diseases. In NBLDA, two new networks were constructed first based on known lncRNA–disease associations and Gaussian interaction profile kernel similarity for lncRNAs and diseases, and then we assigned an attraction that is proportional to kβ to each node in the network, where k is the degree of the node and β is a freely adjustable parameter. Moreover, considering that traditional mass diffusion-based algorithms focused on unidirectional mass diffusion only, we further applied a consistence-based mass diffusion algorithm via bidirectional diffusion on NBLDA to predict potential lncRNA–disease associations by adopting a label propagation algorithm. Finally, in order to estimate the prediction performance of NBLDA, the framework of leave-one-out cross validation (LOOCV) was implemented, and simulation results show that NBLDA can achieve reliable AUCs of 0.8846, 0.8273, and 0.8075 in LOOCV based on three versions of known lncRNA–disease association datasets downloaded from the lncRNADisease database, respectively, which demonstrates the excellent prediction performance of NBLDA. In addition, in case studies of lung cancer, leukemia, and colorectal cancer, simulation results show that there are 9, 10, and 7 out of the top 10 predicted disease-related lncRNAs of these three kinds of diseases having been validated by evidence from studies in the PubMed literature and Lnc2Cancer database, respectively, which further indicates NBLDA has a satisfactory prediction performance in discovering potential lncRNA–disease associations as well.

2. Results

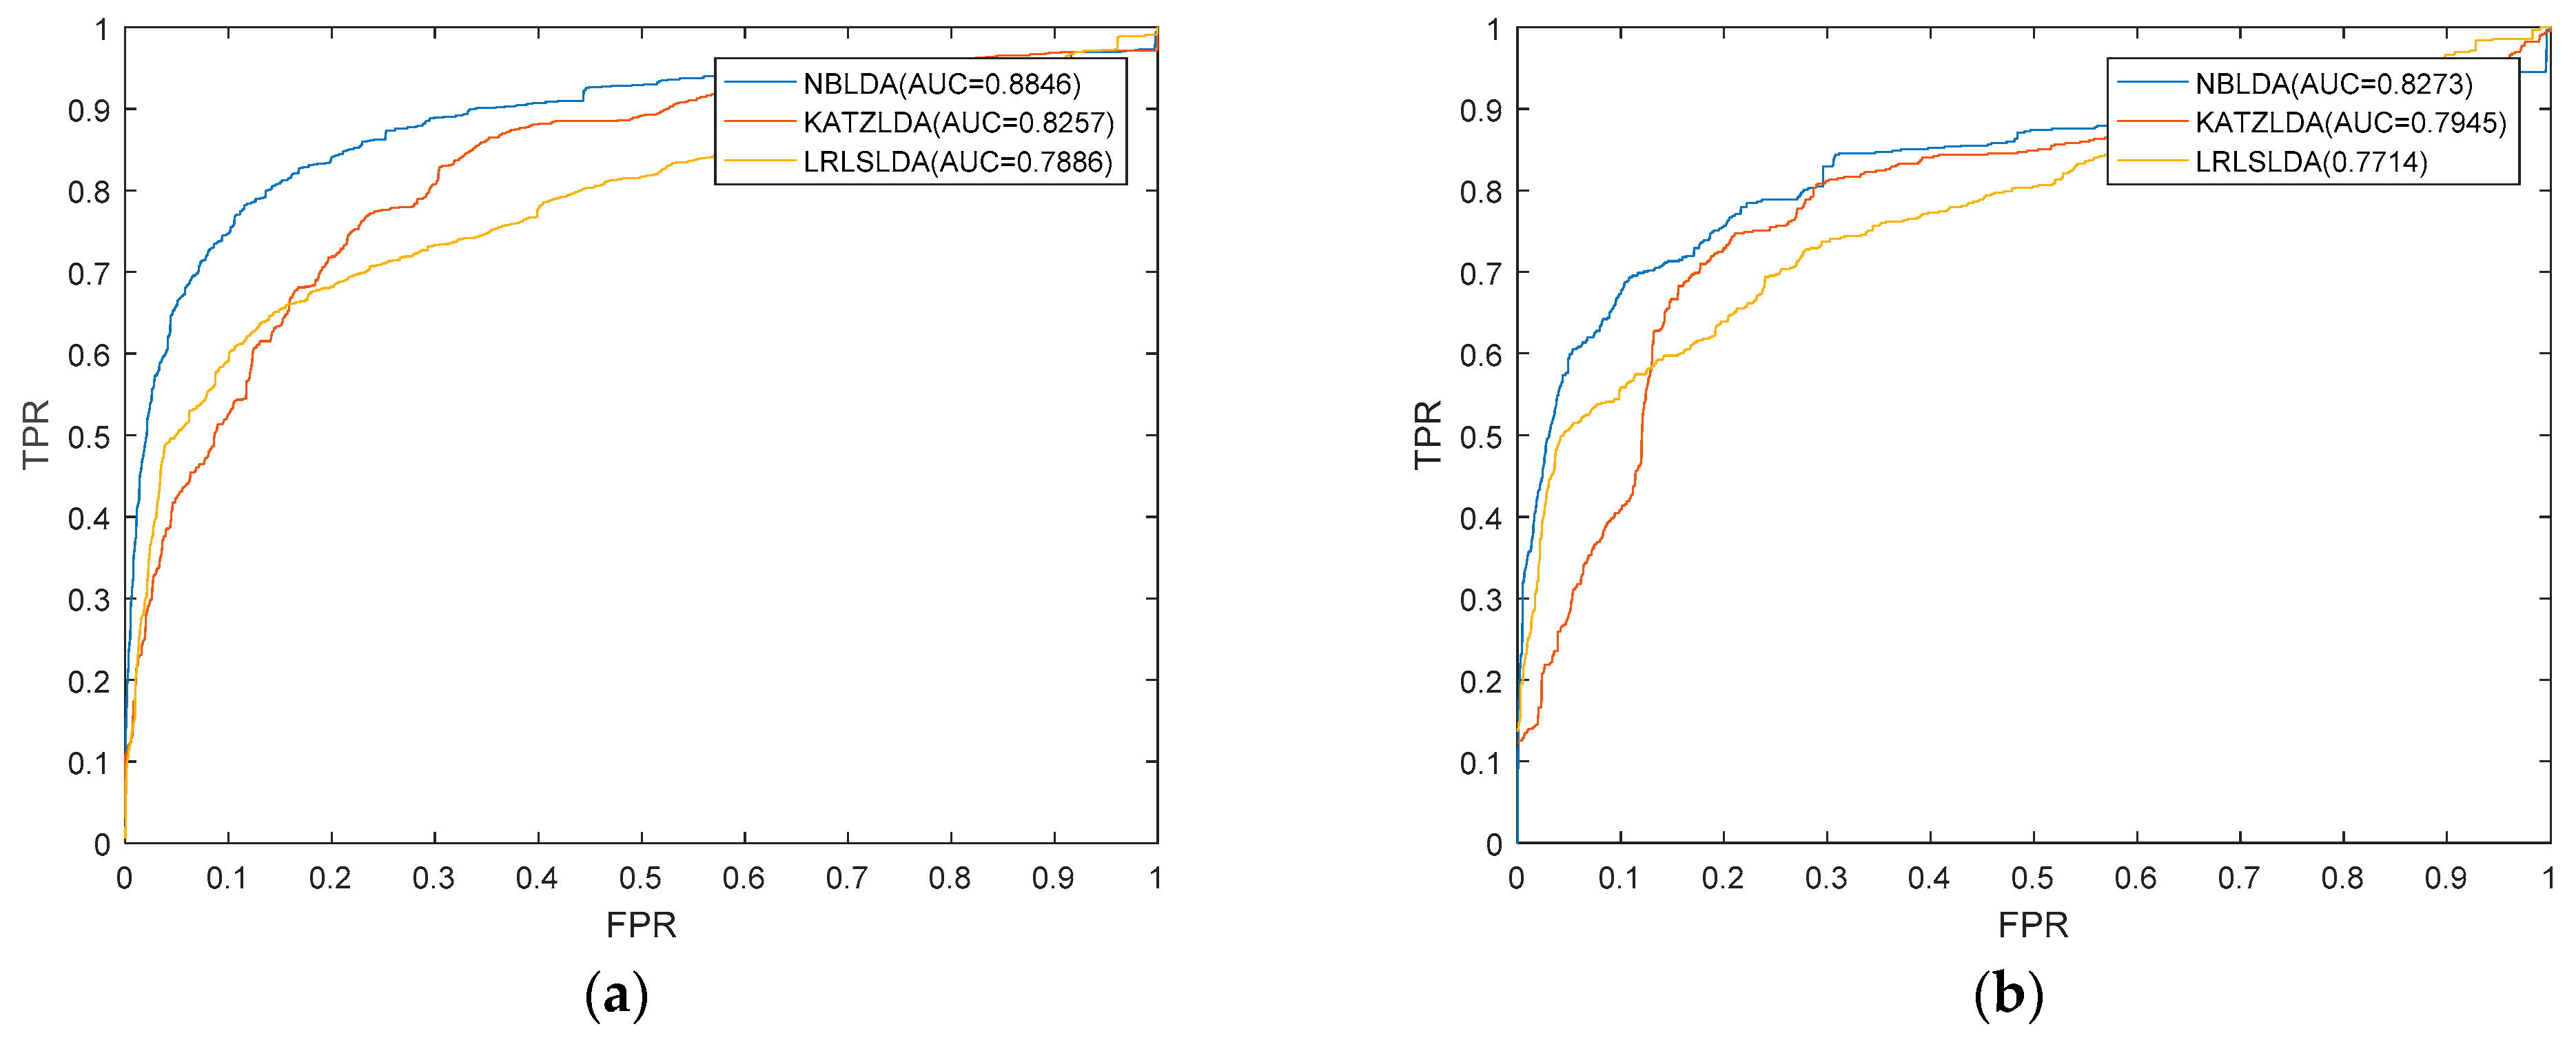
2.1. Performance Evaluation
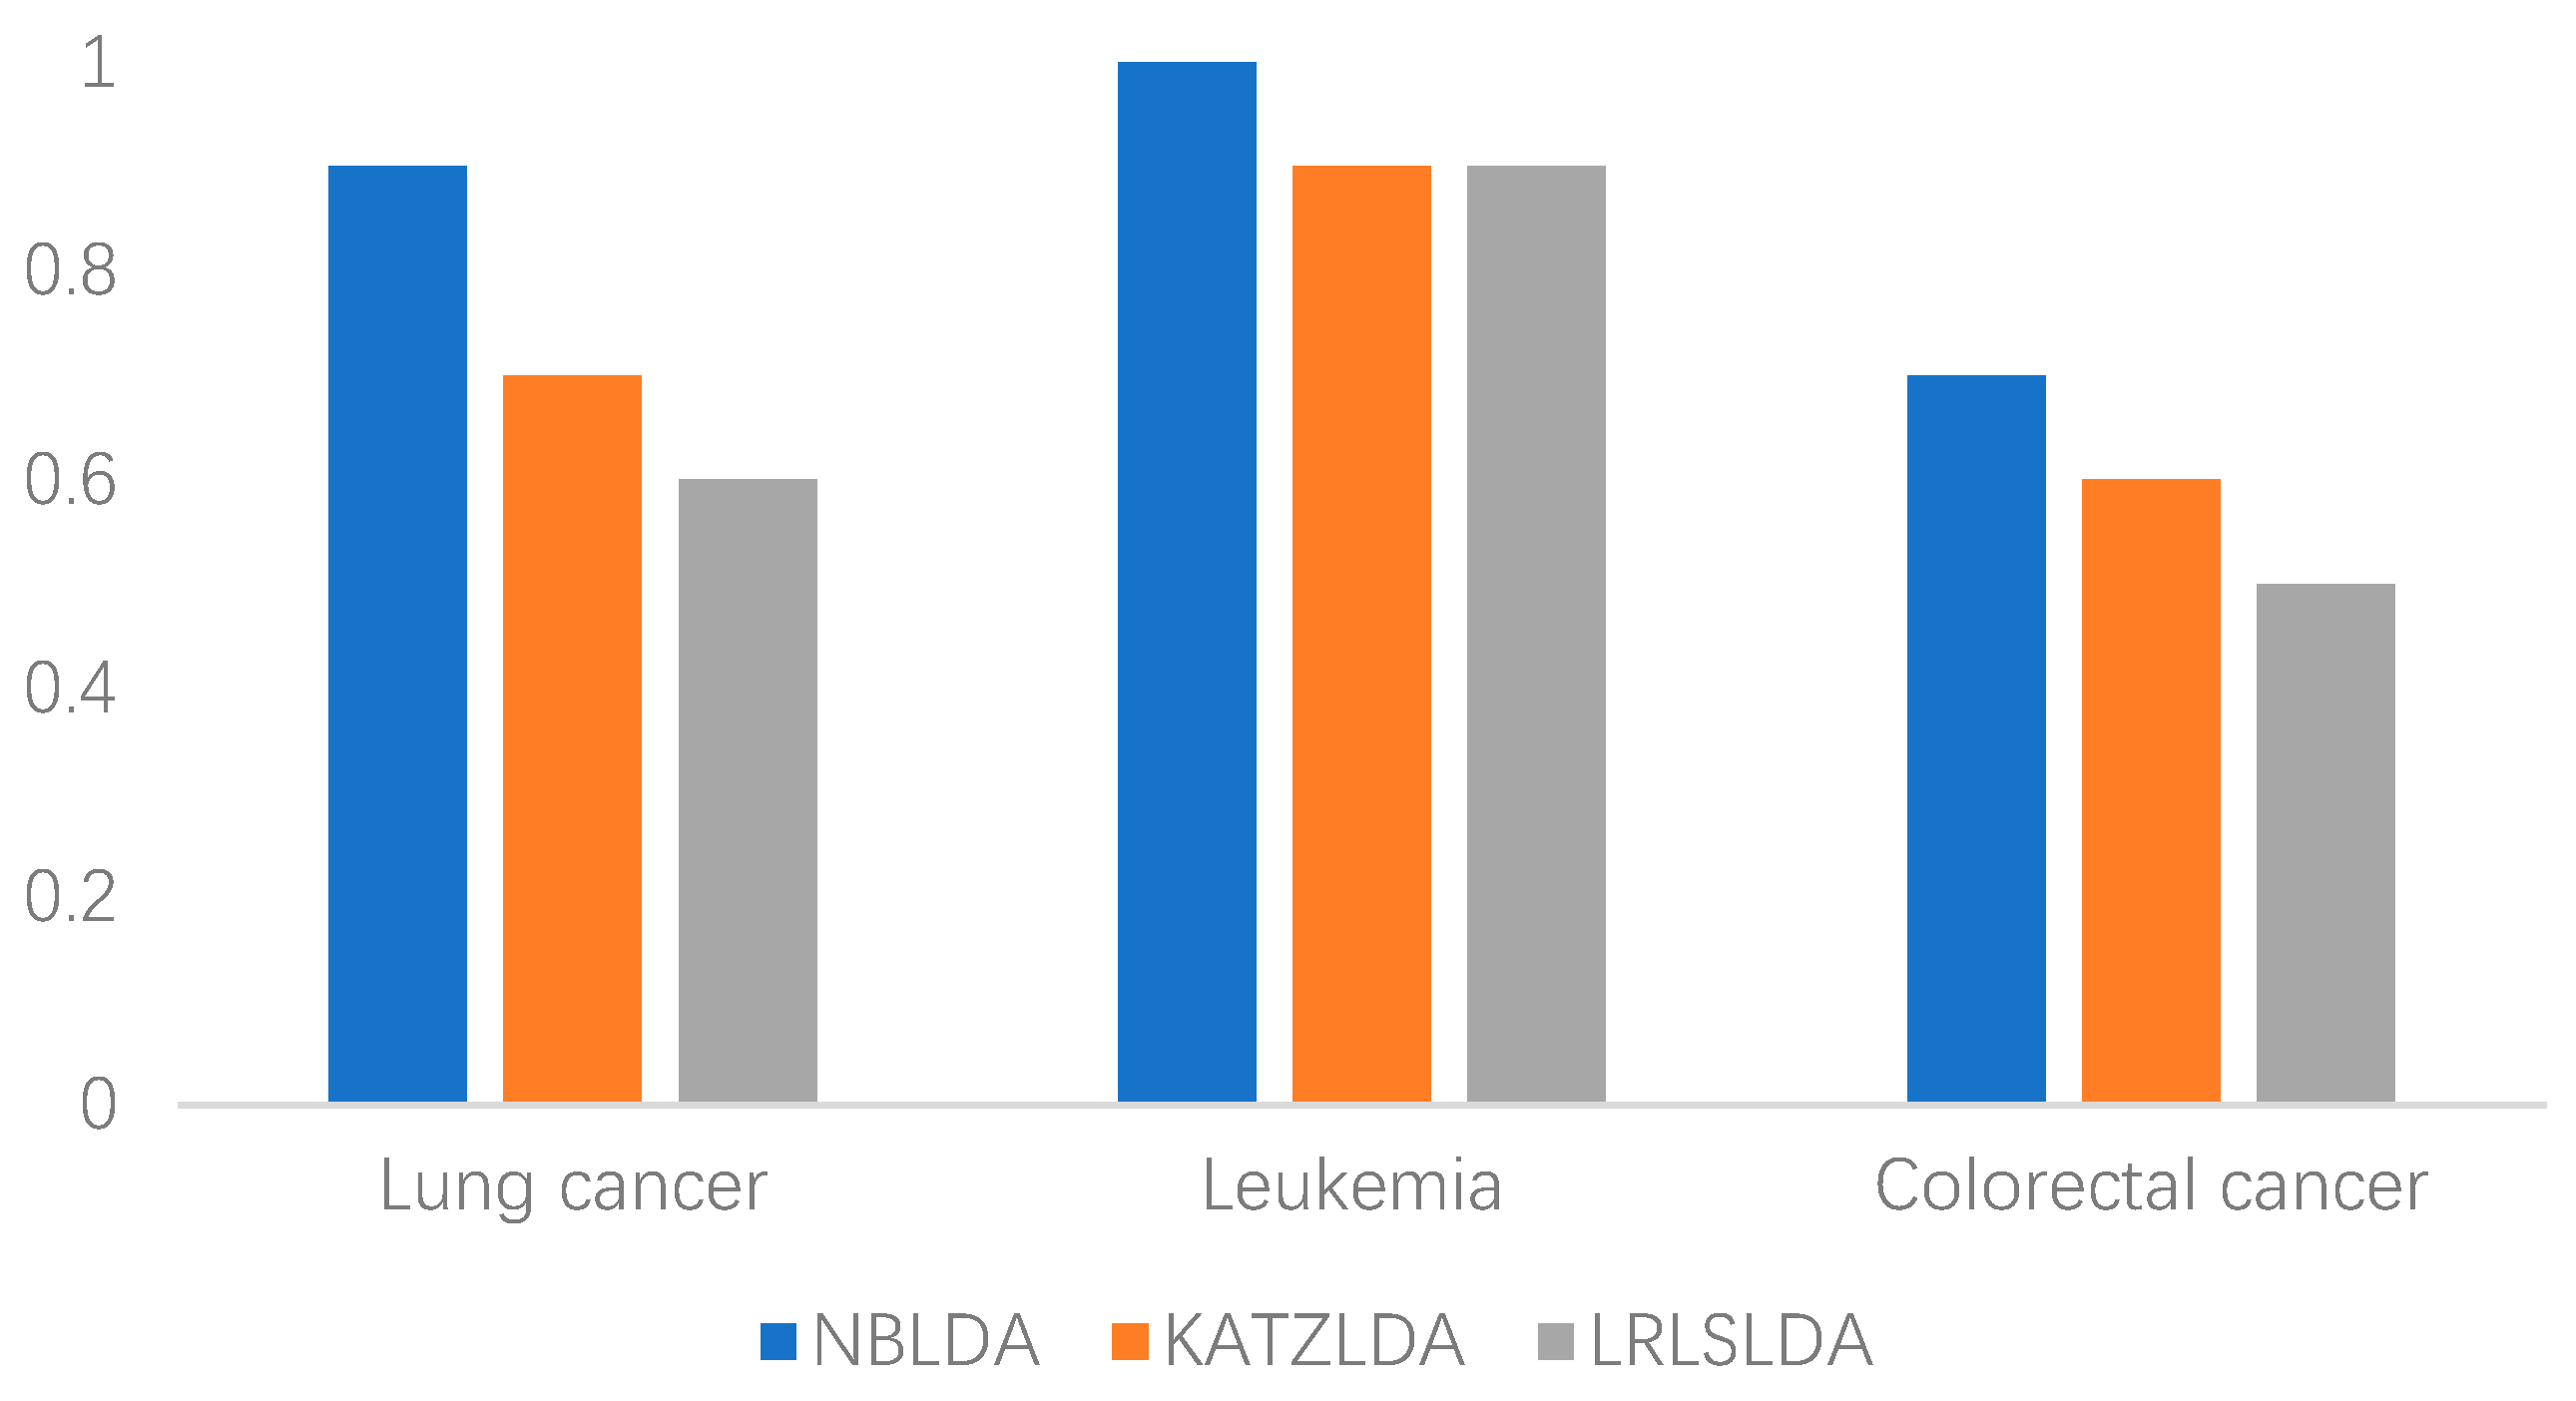
In order to estimate the prediction performance of NBLDA, and described in this section, we implemented LOOCV on NBLDA based on known lncRNA–disease associations downloaded from the LncRNADisease database. While implementing LOOCV, each known lncRNA–disease association was left out in turn as a test sample and the other remaining known lncRNA–disease associations were taken as training samples. Moreover, all lncRNA–disease pairs without known relevance evidences were considered as candidate samples. Thereafter, we obtained the ranking of each test sample within all candidate samples according to their scores predicted by NBLDA, and then, the test sample was regarded as successfully predicted if its ranking exceeded a given threshold. Furthermore, the receiver operating characteristic (ROC) curves were drawn based on true positive rate (TPR, sensitivity) and false positive rate (FPR, 1-specificity) obtained at different thresholds. Here, the sensitivity represents the proportion of test samples with a ranking higher than the given threshold to all positive samples, whereas 1-specifcity indicates the ratio between candidate samples with a ranking above a given threshold and all candidate samples. Then, the areas under the ROC curve (AUCs) were further calculated to evaluate the predictive performance of our model NBLDA, and it is obvious that the larger the value of AUC, the better the prediction performance of NBLDA will be.
We implemented NBLDA on three kinds of datasets under the framework of LOOCV. Moreover, we compared NBLDA with two state-of-the-art computational models such as KATZLDA [20] and LRLSLDA [14] on these three same datasets. Here, KATZLDA is a KATZ measurement model for lncRNA–disease association prediction based on known lncRNA–disease associations, disease similarity, and lncRNA similarity. LRLSLDA is a semi-supervised model that used Laplacian regularized least squares to predict potential lncRNA–disease associations by incorporating lncRNA expression profiles. As a result, NBLDA, KATZLDA, and LRLSLDA achieved AUCs of 0.8846, 0.8257, and 0.7886 on DS1, respectively (Figure 1a), AUCs of 0.8273, 0.7945, and 0.7714 were obtained on DS2, respectively (Figure 1b), and AUCs of 0.8075, 0.7781, and 0.7602 were obtained on DS3, respectively (Figure 2). It is obvious that our model NBLDA had better prediction performance than KATZLDA and LRLSLDA in LOOCV on both of these three kinds of datasets. In addition, during simulation, we found that the best AUCs were obtained at β = 0.1 , which indicates that reducing the attractions of nodes with higher degrees can further improve the prediction accuracy of our model NBLDA, and this conclusion is consistent with previous studies [21].

2.2. Case Studies

Currently, cancer is one of the leading causes of human death worldwide, and is also a problem that modern medicine has not yet overcome [22,23,24]. To further evaluate the predictive performance of NBLDA, we implemented the case studies of lung cancer, leukemia, and colorectal cancer described in this section. During simulation, for any given investigated disease, those related known lncRNA–disease associations in DS1 were used as training samples for model learning. As a result, we list in Table 1 the top 10 disease-related lncRNAs predicted by NBLDA and the evidence to support these predicted results provided by the Lnc2Cancer database and the studies in the PubMed literature. Moreover, we show the accuracy of the top 10 related lncRNAs for the three diseases predicted by NBLDA, KATZLDA, and LRLSLDA, respectively (Figure 3). It is worthwhile to emphasize that only the lncRNA–disease pairs not included in DS1 were considered as verification candidates for simulation in our case studies.
Lung cancer is one of the most common cancers in the world with extremely high morbidity and mortality rates [25]. Over the past 50 years, the morbidity rate and the mortality rate of lung cancer have significantly increased in many countries, and these rates for male patients are the first among all malignant tumors [26,27]. In particular, the five-year survival rate for lung cancer patients is only about 15%, and about 1.4 million people die of lung cancer each year [28]. In order to better and more effectively promote the treatment of lung cancer, more and more studies have focused on the deregulation of protein-coding genes to identify oncogenes and tumor suppressors [29]. Recent studies have shown that lncRNAs are important for the development and progression of lung cancer [30]. We implemented NBLDA to reveal possible lung cancer-associated lncRNAs and, as illustrated in Table 1, simulation results show that there are 9 out of the top 10 predicted lncRNAs having been validated by the Lnc2Cancer database and related studies in the literature. For example, lncRNA PVT1 was expressed at high levels in lung cancer cells, which promoted proliferation of non-small cell lung cancer cells by regulating LATS2 expression [31]. LncRNA NEAT1 expression was significantly upregulated in lung cancer cells, and NEAT1 significantly accelerated tumor growth in vivo [32]. LncRNA TUG1 was expressed at low levels in lung cancer cells, which is involved in lung cancer cell growth by regulating LIMK2b via EZH2 [33].
Leukemia is a malignant clonal disease of hematopoietic stem cells, characterized by the ability of embryonic cells to self-renew, continuously proliferate, and escape apoptosis which ultimately inhibits the normal hematopoietic function of the human body [34,35]. In recent years, the prognosis of leukemia patients has greatly improved. However, the five-year survival rate of patients is still very low due to the high recurrence rate [36], and a more effective treatment method is urgently needed for patients. In recent years, in-depth molecular identification has completely changed our understanding of the mutations that drive disease, and related studies have shown that lncRNA plays a key role in the occurrence and development of leukemia [11]. We applied NBLDA to predict possible leukemia-associated lncRNAs and, as a result, there are 10 out of the top 10 predicted lncRNAs having been successfully confirmed by the Lnc2Cancer database and related studies in the literature (see Table 1). For example, lncRNA H19 expression was significantly upregulated in bone marrow samples from leukemia patients, which regulated ID2 expression by competitive binding to hsa-miR-19a/b [37]. The expression level of lncRNA MALAT1 was upregulated in acute myeloid leukemia, and MALAT1 knockdown in lung cancer cells led to upregulation of miR-101-3p expression, and then miR-101-3p reduced myeloid cell leukemia 1 (MCL1) expression by binding to 3’-UTR. [38]. LncRNA HOTAIR was expressed at high levels in leukemia patients, which promoted an increase in the number of white blood cells and a decrease in the number of hemoglobin and platelets, and its overexpression indicated a poor prognosis in patients [39].
Colorectal cancer (CRC) is one of the most common types of cancer in the United States and the second leading cause of cancer death [40]. The average lifetime risk of developing the disease in the United States is as high as 6% and the percentage of young patients is increasing [41]. With the development of medical technology, the mortality rate of patients with CRC has decreased but it is not satisfactory enough. Recent studies have shown that lncRNAs can be used as potential biomarkers for improving treatment efficacy of CRC [42]. A case study of CRC was implemented on NBLDA to identity potential associated lncRNAs. As illustrated in Table 1 above, it is easy to see that there are 7 out of the top 10 predicted lncRNAs having been validated to have associations with CRC based on the Lnc2Cancer database and the studies in the PubMed literature. For example, lncRNA CCAT2 was expressed at high levels in patients with colorectal cancer. At the same time, knockdown of CCAT2 could induce apoptosis and inhibit cell proliferation, which was a potential therapeutic target for CRC [30,43]. LncRNA XIST could promote the proliferation of CRC cells and act as an oncogene in CRC by targeting miR-132-3p, and its expression level was upregulated in both CRC tissue samples and CRC cells [44]. LncRNA BCYRN1 played an oncogenic role in CRC cells by upregulating NPR3 expression levels. Therefore, BCYRN1 could be used as a promising prognostic biomarker for CRC [45].

3. Discussion

Accumulating evidence studies have shown that lncRNAs are closely related to a variety of biological processes. Identifying potential lncRNA–disease association not only helps us understand the pathogenesis of disease at the molecular level of lncRNA, but also contributes to the diagnosis, treatment, prognosis, and prevention of diseases. In this paper, we presented a computational model NBLDA to reveal potential lncRNA–disease associations based on known lncRNA–disease associations and Gaussian interaction profile kernel similarity for lncRNAs and diseases. We improved the baseline algorithm of bipartite network recommendation based on the network topological similarity of the lncRNA–disease association network and resource allocation strategy of unequal allocation and unbiased consistence. A label propagation algorithm was then used to predict potential lncRNA–disease associations. NBLDA achieved AUCs of 0.8846, 0.8273, and 0.8075 in the validation framework of LOOCV based on three versions of known lncRNA–disease association datasets, which significantly improved the previous classic models. Furthermore, we conducted case studies of lung cancer, leukemia, and colorectal cancer, and simulation results show that there are 9, 10, and 7 out of the top 10 predicted candidate lncRNAs having been confirmed by previous studies in the literature respectively. As a result, both cross validation and case studies have shown that NBLDA has a good performance in potential lncRNA–disease association prediction.
The novel and reliable performance of NBLDA is mainly attributed to the following aspects. First, the method proposed by us is based on a classical approach that has already achieved excellent performance in predicting associations in other biological networks. Second, considering that the lncRNAs (or diseases) which are not associated with a given disease D (or a given lncRNA L) may also contribute resources to D (or L), we then constructed novel networks based on known lncRNA–disease associations and the Gaussian interaction profile kernel similarity for diseases and lncRNAs. Third, we adopted a resource allocation strategy of unequal allocation and unbiased consistence. Certainly, there are still some limitations in NBLDA which must be improved in the future. First of all, the similarity measures for diseases and lncRNAs are relatively simple, and more effective similarity measures such as disease semantic similarity, disease phenotypic similarity, and lncRNA functional similarity can improve the performance of our model. Moreover, although the numbers of lncRNA–disease associations data have increased compared to before, the known lncRNA–disease associations in our dataset are still too sparse, and the performance of NBLDA can be further improved when more lncRNA–disease associations datasets are available and more reliable types of biological datasets are integrated. Last but not least, increasing lncRNA–disease association data can be used as training samples for model learning with the development of biological experimental techniques.

4. Materials and Methods

4.1. Human lncRNA–Disease Associations

Three versions of the datasets were downloaded from the LncRNADisease database (http://www.cuilab.cn/lncrnadisease), respectively (see Supplementary materials). First, we downloaded the 2017 version of the dataset (denoted as DS1) from the LncRNADisease database, and after removing duplicated records and associations that do not belong to human beings, we finally obtained 1695 known lncRNA–disease associations involving 314 diseases and 828 lncRNAs. Next, we downloaded the 2015 version of the dataset (denoted as DS2) from the LncRNADisease database, and after removing duplicated data, we finally obtained 621 known lncRNA–disease associations including 226 diseases and 285 lncRNAs. Finally, we downloaded the 2012 version of the dataset (denoted as DS3) from the LncRNADisease database, and after removing duplicated data, we finally obtained 293 known lncRNA–disease associations including 167 diseases and 118 lncRNAs. Thereafter, we adopted an adjacency matrix Y to indicate known associations between lncRNAs and diseases. In the adjacency matrix Y, if there is a known association between lncRNA li and disease dj, then there is Y(i,j) = 1; otherwise, there is Y(i,j) = 0. Moreover, for convenience, we further introduced ND and NL to denote the number of diseases and lncRNAs collected above, respectively.

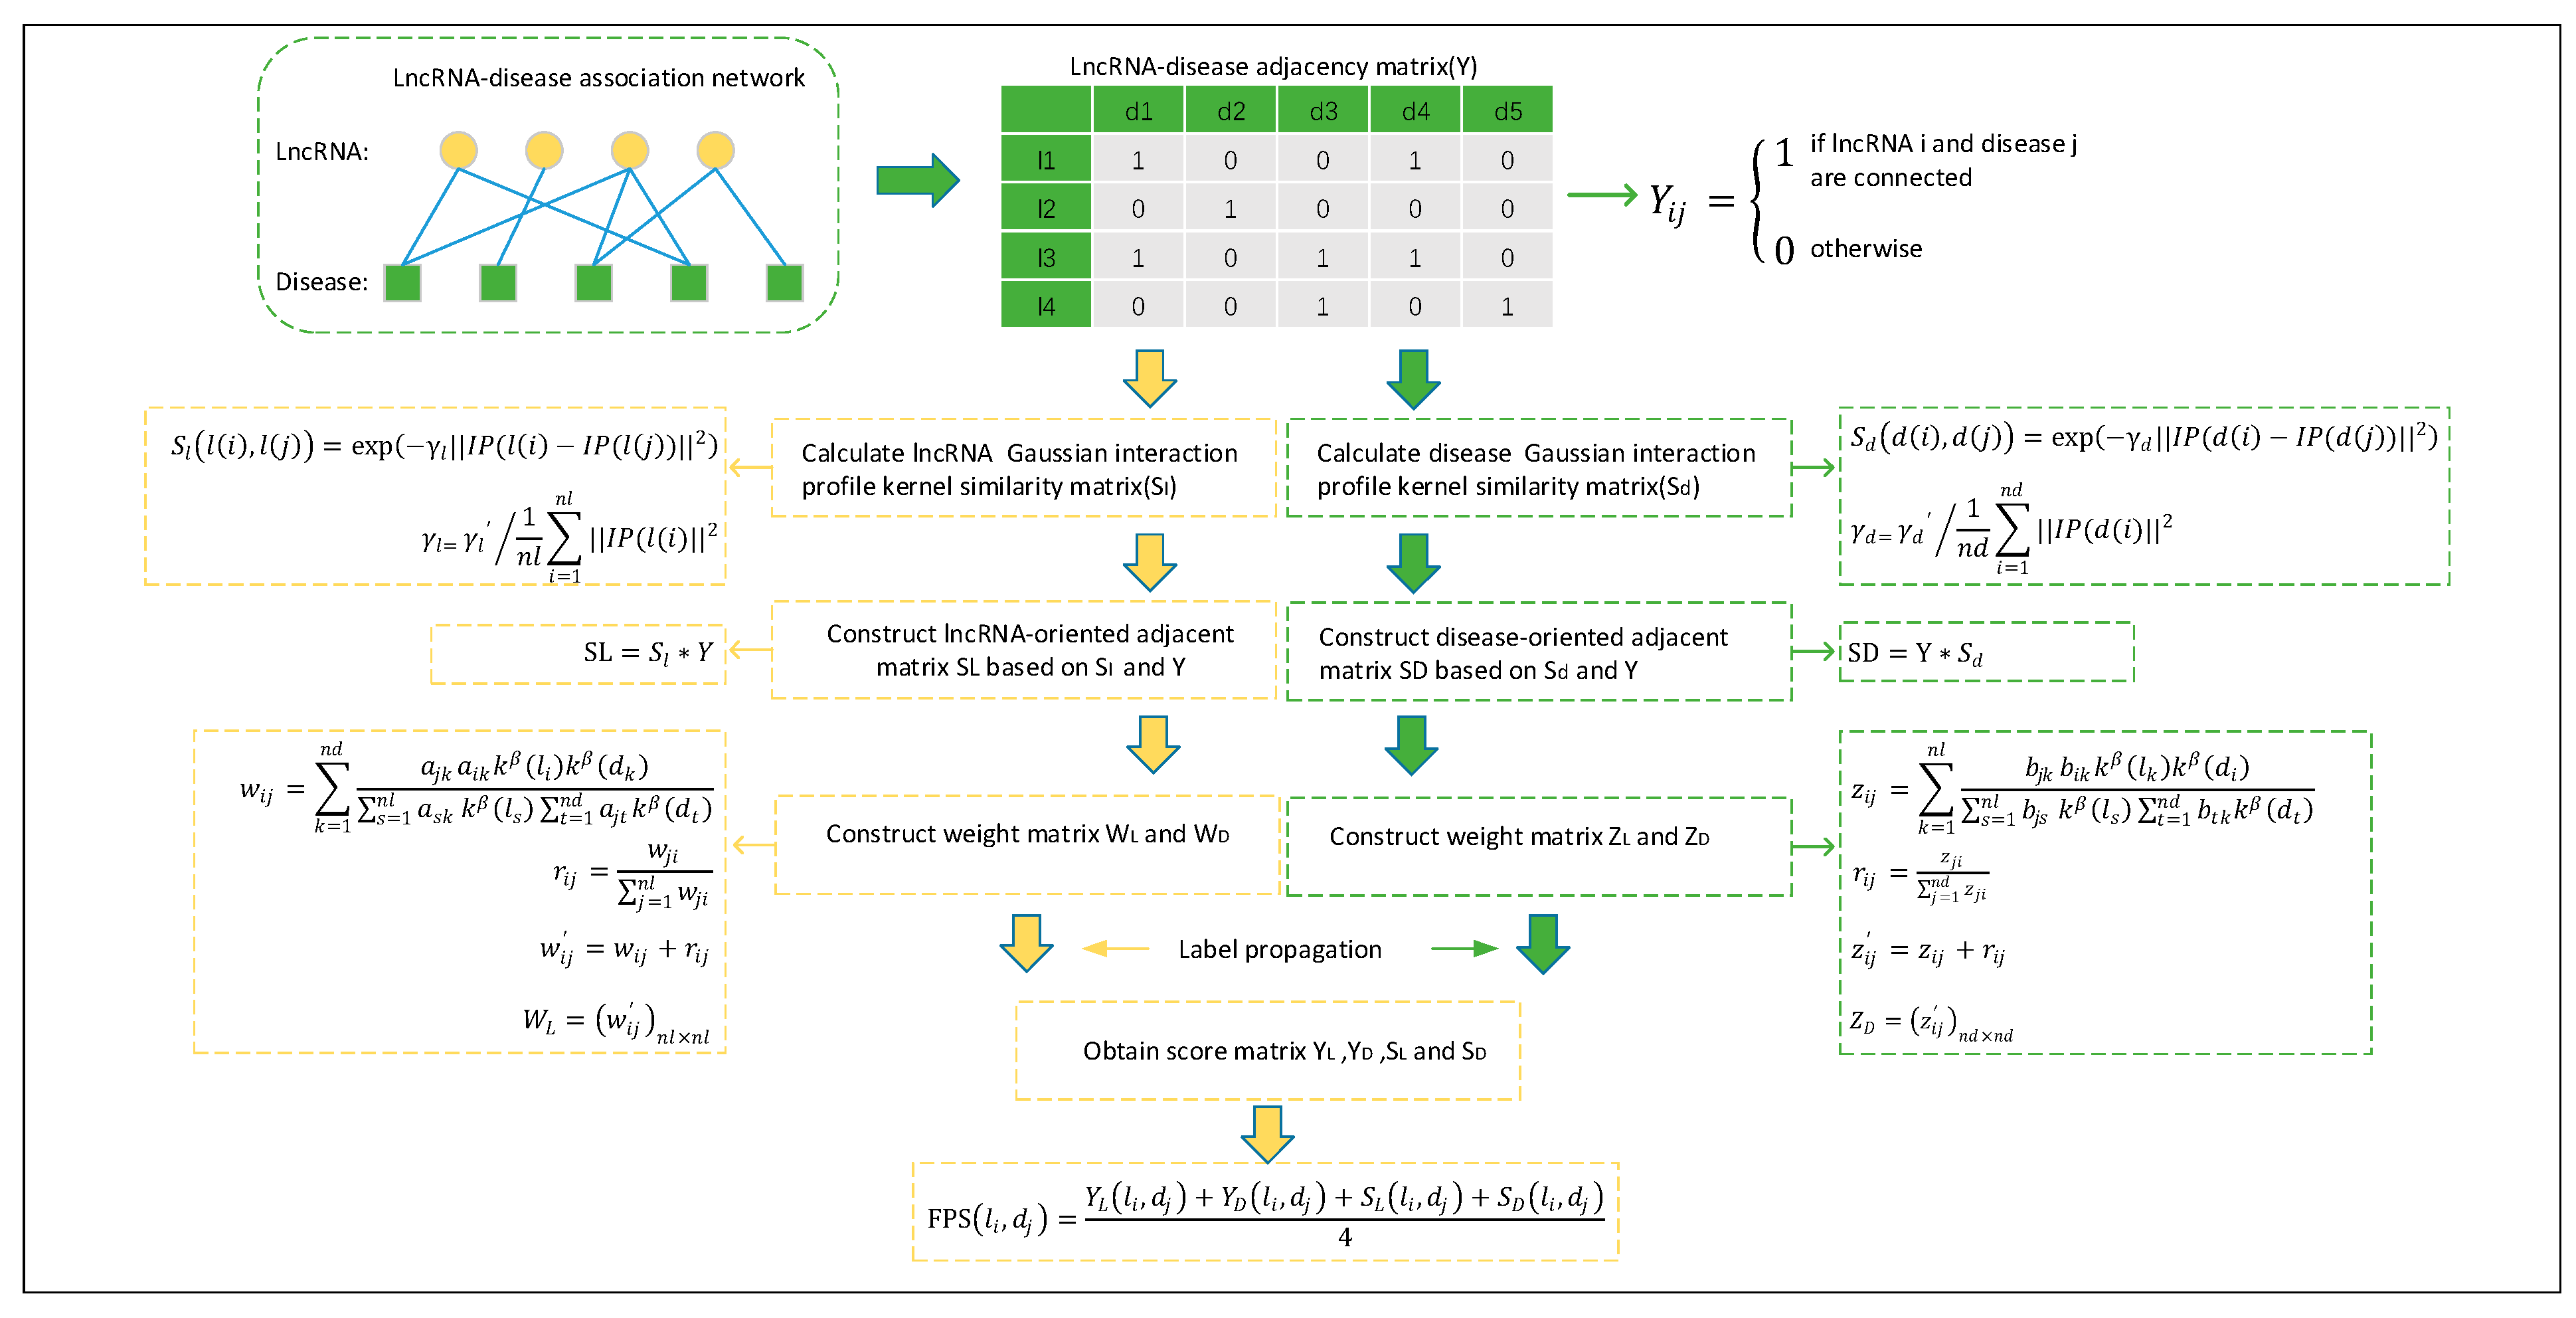
4.2. Gaussian Interaction Profile Kernel Similarity for lncRNAs and Diseases

Based on the hypothesis that functionally similar lncRNAs are always associated with similar diseases [46], for any given lncRNAs li and lj, we can obtain the Gaussian interaction profile kernel similarity between li and lj according to the topologic information of known lncRNA–disease association network as follows:
S l ( l i , l j ) = exp ( γ l | | I P ( l i ) I P ( l j ) | | 2 ) ,
γ l = γ l / 1 N L i = 1 N L | | I P ( l i ) | | 2 ,
where IP(li) is the ith row of the adjacency matrix Y and represents the interaction profile of lncRNA li with all diseases. The parameter γ l is used to control the Gaussian kernel bandwidth, and γ l is a bandwidth parameter that will be set to 1 according to previous work [47]. Obviously, according to Equation (1) above, we can obtain a similarity matrix Sl based on these lncRNAs collected above.
In a similar way, for any given diseases di and dj, we can obtain the Gaussian interaction profile kernel similarity between di and dj according to Equation (3) as follows:
S d ( d i , d j ) = exp ( γ d | | I P ( d i ) I P ( d j ) | | 2 ) ,
γ d = γ d / 1 N D i = 1 N D | | I P ( d i ) | | 2 ,
where IP(di) is the ith column of the adjacency matrix Y and represents the interaction profile of disease di with all lncRNAs. The parameter γ d is used to control the Gaussian kernel bandwidth and γ d is set to 1 [47]. Obviously, according to Equation (3) above, we can obtain a similarity matrix Sd based on these diseases collected above.

4.3. Prediction Model of NBLDA

As illustrated in Figure 4, we can model the prediction problem of potential lncRNA–disease association as the problem of resource allocation on the lncRNA–disease bipartite network. According to the assumption that functionally similar lncRNAs tend to show similar interaction patterns with similar diseases [46], it is reasonable to deduce that each lncRNA (or disease) should contribute resources to a specific disease (lncRNA) along with its similar lncRNAs (diseases). Therefore, we can construct a matrix S L = { a i j } N L × N D and a matrix S D = { b i j } N L × N D based on the matrices Sl, Sd, and Y as follows:
S L = S l Y ,
S D = Y S d .
Obviously, according to the matrix SL, we can construct a bipartite network first, and then, for a randomly given node ψ in the newly constructed bipartite network, supposing that ψ has been assigned an attraction such as kβ(ψ), where k(ψ) represents the degree of node ψ in the bipartite network and β is a freely adjustable parameter, it is obvious that β = 0 means the average allocation of resources, β < 0 means that nodes with lower degrees are more attractive and will obtain more resources, and β > 0 indicates that nodes with higher degrees have greater attraction and will be allocated more resources [21]. Thus, in general, the resource allocation based on the matrix SL can be divided into the following processes:
First, in the newly constructed bipartite network, each lncRNA node will allocate resources to its neighboring disease nodes based on the attractions of its neighboring disease nodes. Here, for a given lncRNA node, its neighboring disease nodes denote all disease nodes that have associations in SL with this given lncRNA node, that is, all these disease nodes that have direct edges with this given lncRNA node in the bipartite network. Thus, for a given lncRNA node lj and one of its neighboring disease node dk, the resource pjk that the disease node dk will obtain from the lncRNA node lj can be calculated as follows:
p j k = a j k k β ( d k ) t = 1 N D a j t k β ( d t ) .
Second, in a similar way as for the disease node dk, let the lncRNA node li be one of its neighboring lncRNA nodes. Here, for a given disease node, its neighboring lncRNA nodes denote all lncRNA nodes that have associations in SL with this given disease node, that is, all these lncRNA nodes that have direct edges with this given disease node in the bipartite network, then the resource qik that the lncRNA node li will obtain from the disease node dk can be calculated as follows:
q i k = a i k k β ( l i ) s = 1 N L a s k k β ( l s ) .
Finally, according to Equations (7) and (8) above, for any two given lncRNA nodes li and lj, we can define the resources that li will obtain from lj as follows:
w i j = k = 1 N D q i k p j k = k = 1 N D a j k a i k k β ( l i ) k β ( d k ) s = 1 N L a s k k β ( l s ) t = 1 N D a j t k β ( d t ) ,
where wij indicates the resource diffusion capability from lj to li, that is, the probability that li will be recommended because lj is selected by given disease. In addition, considering the consistency of capability that resources move in both directions [48], we further define the resource diffusion capability from li to lj as follows:
r i j = w j i j = 1 N L w j i .
Then, according to Equations (9) and (10) above, we can define the sum of contribution from resource allocation between li and lj as follows:
w i j = w i j + r i j .
Hence, according to Equation (11) above, we can obtain a weighted matrix W L = ( w i j ) N L × N L . Then, we can adopt the label propagation algorithm to predict potential lncRNA–disease associations based on the adjacency matrix Y and the weight matrix WL. First for any given disease node di in the bipartite network, let Yi be the ith column of the adjacency matrix Y, then for convenience, we define the lncRNAs in Yi as the initial label information of di. Next, in each iterative process, supposing that each lncRNA node will receive information from its neighboring nodes with probability α and keep its initial label information with probability 1 − α, we can then express the iterative process as follows:
Y i t + 1 = α W L Y i t + ( 1 α ) Y i 0 ,
where Y i 0 = Yi represents the interaction profile of disease di with all lncRNAs before the beginning of the iterative process, and Y i t represents the predicted label information of di at the tth iteration. In addition, let Y 0 = Y, we can then further represent the iteration process in matrix form as follows:
Y t + 1 = α W L Y t + ( 1 α ) Y 0 .
According to Equation (13) above, we will keep updating the label matrix Y t + 1 until it converges to Y L :
Y L = ( 1 α ) ( I α W ) 1 Y 0 ,
where I R N L × N L is an identity matrix.
From the above descriptions, it is easy to see that YL is an lncRNA-oriented lncRNA–disease association score matrix obtained based on the bipartite network that is constructed according to the matrix SL. In a similar way, it is obvious that we can obtain another disease-oriented lncRNA–disease association score matrix YD based on the bipartite network constructed according to the matrix SL. Moreover, in a similar way, we can further obtain an lncRNA-oriented lncRNA–disease association score matrix ZL and a disease-oriented lncRNA–disease association score matrix ZD based on the bipartite network constructed according to the matrix SD as well. Subsequently, based on the above newly obtained matrices such as YL, YD, ZL, and ZD, and for convenience, let F P S ( i , j ) , Y L ( i , j ) , Y D ( i , j ) , Z L ( i , j ) , and Z D ( i , j ) denote F P S ( l i , d j ) , Y L ( i , j ) , Y D ( l i , d j ) , S L ( l i , d j ) , and S D ( l i , d j ) , respectively. We can then construct a final lncRNA–disease association score matrix FPS as follows:
F P S ( i , j ) = Y L ( i , j ) + Y D ( i , j ) + S L ( i , j ) + S D ( i , j ) 4 ,
where i [1, NL] and j [1, ND].

Supplementary Materials

Supplementary materials can be found at https://0-www-mdpi-com.brum.beds.ac.uk/1422-0067/20/7/1549/s1.

Author Contributions

Data curation, X.F.; Formal analysis, H.Z.; Funding acquisition, L.W.; Investigation, Z.X.; Methodology, Y.L.; Project administration, L.W.; Resources, Z.X.; Software, H.Z.; Supervision, L.W.; Validation, X.F. and H.Z.; Visualization, Y.L. and X.F.; Writing—original draft, Y.L.; Writing—review and editing, Z.X.

Funding

This research was funded by the National Natural Science Foundation of China (Nos. 61873221, 61672447, and 61472282), the Natural Science Foundation of Hunan Province (Nos. 2018JJ4058 and 2017JJ5036), and the CERNET Next Generation Internet Technology Innovation Project (Nos. NGII20160305 and NGII20170109).

Acknowledgments

The authors thank the anonymous reviewers for suggestions that helped improve the paper substantially.

Conflicts of Interest

The authors declare no conflict of interest.

Abbreviations

LOOCVleave-one-out cross validation
FPSfinal lncRNA–disease association score matrix
ROCreceiver operating characteristic
TPRtrue positive rate
FPRfalse positive rate
AUCarea under the ROC curve

References

  1. Lv, J.; Huang, Z.; Liu, H.; Liu, H.; Cui, W.; Li, B.; He, H.; Guo, J.; Liu, Q.; Zhang, Y.; et al. Identification and characterization of long intergenic non-coding RNAs related to mouse liver development. Mol. Genet. Genom. 2014, 289, 1225–1235. [Google Scholar] [CrossRef]
  2. Yanofsky, C. Establishing the Triplet Nature of the Genetic Code. Cell 2007, 128, 815–818. [Google Scholar] [CrossRef] [PubMed] [Green Version]
  3. Core, L.J.; Lis, J.T. Nascent RNA sequencing reveals widespread pausing and divergent initiation at human promoters. Science 2008, 322, 1845–1848. [Google Scholar] [CrossRef] [PubMed]
  4. Mercer, T.R.; Dinger, M.E.; Mattick, J.S. Long non-coding RNAs: Insights into functions. Nat. Rev. Genet. 2009, 10, 155–159. [Google Scholar] [CrossRef]
  5. Guttman, M.; Russell, P.; Ingolia, N.T.; Weissman, J.S.; Lander, E.S. Ribosome Profiling Provides Evidence that Large Noncoding RNAs Do Not Encode Proteins. Cell 2013, 154, 240–251. [Google Scholar] [CrossRef]
  6. Wapinski, O.; Chang, H.Y. Long noncoding RNAs and human disease. Trends Cell Biol. 2011, 21, 354–361. [Google Scholar] [CrossRef]
  7. Ponting, C.P.; Oliver, P.L.; Reik, W. Evolution and functions of long noncoding RNAs. Cell 2009, 136, 629–641. [Google Scholar] [CrossRef]
  8. Wang, H.M.; Lu, J.H.; Chen, W.Y.; Gu, A.Q. Upregulated lncRNA-UCA1 contributes to progression of lung cancer and is closely related to clinical diagnosis as a predictive biomarker in plasma. Int. J. Clin. Exp. Med. 2015, 8, 11824–11830. [Google Scholar] [PubMed]
  9. Li, H.; An, J.; Wu, M.; Zheng, Q.; Gui, X.; Li, T.; Pu, H.; Lu, D. LncRNA HOTAIR promotes human liver cancer stem cell malignant growth through downregulation of SETD2. Oncotarget 2015, 6, 27847–27864. [Google Scholar] [CrossRef] [Green Version]
  10. Spizzo, R.; Almeida, M.I.; Colombatti, A.; Calin, G.A. Long non-coding RNAs and cancer: A new frontier of translational research? Oncogene 2012, 31, 4577–4587. [Google Scholar] [CrossRef]
  11. Chen, G.; Wang, Z.; Wang, D.; Qiu, C.; Liu, M.; Chen, X.; Zhang, Q.; Yan, G.; Cui, Q. LncRNADisease: A database for long-non-coding RNA-associated diseases. Nucleic Acids Res. 2013, 41, D983–D986. [Google Scholar] [CrossRef] [PubMed]
  12. Ning, S.; Zhang, J.; Wang, P.; Zhi, H.; Wang, J.; Liu, Y.; Gao, Y.; Guo, M.; Yue, M.; Wang, L.; et al. Lnc2Cancer: A manually curated database of experimentally supported lncRNAs associated with various human cancers. Nucleic Acids Res. 2016, 44, D980–D985. [Google Scholar] [CrossRef] [PubMed]
  13. Gu, C.; Liao, B.; Li, X.; Cai, L.; Li, Z.; Li, K.; Yang, J. Global network random walk for predicting potential human lncRNA-disease associations. Sci. Rep. 2017, 7, 12442. [Google Scholar] [CrossRef] [Green Version]
  14. Chen, X.; Yan, G.Y. Novel human lncRNA-disease association inference based on lncRNA expression profiles. Bioinformatics 2013, 29, 2617–2624. [Google Scholar] [CrossRef]
  15. Yu, J.; Ping, P.; Wang, L.; Kuang, L.; Li, X.; Wu, Z. A Novel Probability Model for LncRNA–Disease Association Prediction Based on the Naïve Bayesian Classifier. Genes 2018, 9, 345. [Google Scholar] [CrossRef] [PubMed]
  16. Sun, J.; Shi, H.; Wang, Z.; Zhang, C.; Liu, L.; Wang, L.; He, W.; Hao, D.; Liu, S.; Zhou, M. Inferring novel lncRNA-disease associations based on a random walk model of a lncRNA functional similarity network. Mol. Biosyst. 2014, 10, 2074–2081. [Google Scholar] [CrossRef] [PubMed]
  17. Yao, Q.; Wu, L.; Li, J.; Yang, L.G.; Sun, Y.; Li, Z.; He, S.; Feng, F.; Li, H.; Li, Y. Global Prioritizing Disease Candidate lncRNAs via a Multi-level Composite Network. Sci. Rep. 2017, 7, 39516. [Google Scholar] [CrossRef] [PubMed] [Green Version]
  18. Chen, X. Predicting lncRNA-disease associations and constructing lncRNA functional similarity network based on the information of miRNA. Sci. Rep. 2015, 5, 13186. [Google Scholar] [CrossRef] [Green Version]
  19. Zhao, H.; Kuang, L.; Wang, L.; Ping, P.; Xuan, Z.; Pei, T.; Wu, Z. Prediction of microRNA-disease associations based on distance correlation set. BMC Bioinform. 2018, 19, 141. [Google Scholar] [CrossRef]
  20. Chen, X. KATZLDA: KATZ measure for the lncRNA-disease association prediction. Sci. Rep. 2014, 5, 16840. [Google Scholar] [CrossRef]
  21. Liu, R.R.; Liu, J.G.; Jia, C.X.; Wang, B.H. Personal recommendation via unequal resource allocation on bipartite networks. Phys. A Stat. Mech. Its Appl. 2010, 389, 3282–3289. [Google Scholar] [CrossRef]
  22. Spiess, P.E.; Dhillon, J.; Baumgarten, A.S.; Johnstone, P.A.; Giuliano, A.R. Pathophysiological basis of human papillomavirus in penile cancer: Key to prevention and delivery of more effective therapies. CA Cancer J. Clin. 2016, 66, 481–495. [Google Scholar] [CrossRef]
  23. Ruprecht, B.; Zaal, E.A.; Zecha, J.; Wu, W.; Berkers, C.R.; Kuster, B.; Lemeer, S. Lapatinib resistance in breast cancer cells is accompanied by phosphorylation-mediated reprogramming of glycolysis. Cancer Res. 2017, 77, 1842–1853. [Google Scholar] [CrossRef]
  24. Barton, M.K. Local consolidative therapy may be beneficial in patients with oligometastatic non-small cell lung cancer. CA Cancer J. Clin. 2017, 67, 89–90. [Google Scholar] [CrossRef] [PubMed]
  25. Greenlee, R.T.; Murray, T.; Bolden, S.; Wingo, P.A. Cancer statistics, 2000. CA Cancer J. Clin. 2000, 50, 7–33. [Google Scholar] [CrossRef] [Green Version]
  26. White, N.M.; Cabanski, C.R.; Silva-Fisher, J.M.; Dang, H.X.; Govindan, R.; Maher, C.A. Transcriptome sequencing reveals altered long intergenic non-coding RNAs in lung cancer. Genome Biol. 2014, 15, 429. [Google Scholar] [CrossRef] [PubMed] [Green Version]
  27. Liu, J.; Lee, W.; Jiang, Z.; Jhunjhunwala, S.; Haverty, P.M.; Gnad, F.; Guan, Y.; Gilbert, H.N.; Stinson, J.; Klijn, C.; et al. Genome and transcriptome sequencing of lung cancers reveal diverse mutational and splicing events. Genome Res. 2012, 22, 2315–2327. [Google Scholar] [CrossRef] [Green Version]
  28. Beasley, M.B.; Brambilla, E.; Travis, W.D. The 2004 World Health Organization classification of lung tumors. Semin. Roentgenol. 2005, 40, 90–97. [Google Scholar] [CrossRef] [PubMed]
  29. Prensner, J.R.; Chinnaiyan, A.M. The Emergence of lncRNAs in Cancer Biology. Cancer Discov. 2011, 1, 391–407. [Google Scholar] [CrossRef] [PubMed]
  30. Gutschner, T.; Diederichs, S. The hallmarks of cancer: A long non-coding RNA point of view. RNA Biol. 2012, 9, 703–719. [Google Scholar] [CrossRef]
  31. Yang, Y.R.; Zang, S.Z.; Zhong, C.L.; Li, Y.X.; Zhao, S.S.; Feng, X.J. Increased expression of the lncRNA PVT1 promotes tumorigenesis in non-small cell lung cancer. Int. J. Clin. Exp. Pathol. 2014, 7, 6929–6935. [Google Scholar] [PubMed]
  32. Sun, C.; Li, S.; Zhang, F.; Xi, Y.; Wang, L.; Bi, Y.; Li, D. Long non-coding RNA NEAT1 promotes non-small cell lung cancer progression through regulation of miR-377-3p-E2F3 pathway. Oncotarget 2016, 7, 51784–51814. [Google Scholar] [CrossRef] [PubMed] [Green Version]
  33. Niu, Y.; Ma, F.; Huang, W.; Fang, S.; Li, M.; Wei, T.; Guo, L. Long non-coding RNA TUG1 is involved in cell growth and chemoresistance of small cell lung cancer by regulating LIMK2b via EZH2. Mol. Cancer 2017, 16, 5. [Google Scholar] [CrossRef] [PubMed]
  34. Larrosa-Garcia, M.; Baer, M.R. FLT3 Inhibitors in Acute Myeloid Leukemia: Current Status and Future Directions. Mol. Cancer Ther. 2017, 16, 991–1001. [Google Scholar] [CrossRef]
  35. Franca, R.; Favretto, D.; Granzotto, M.; Decorti, G.; Rabusin, M.; Stocco, G. Epratuzumab and Blinatumomab as Therapeutic Antibodies for Treatment of Pediatric Acute Lymphoblastic Leukemia: Current Status and Future Perspectives. Curr. Med. Chem. 2017, 24, 1050–1065. [Google Scholar] [CrossRef]
  36. Yang, D.; Zhang, X.; Zhang, X.; Xu, Y. The progress and current status of immunotherapy in acute myeloid leukemia. Ann. Hematol. 2017, 96, 1965–1982. [Google Scholar] [CrossRef] [PubMed]
  37. Zhao, T.F.; Jia, H.Z.; Zhang, Z.Z.; Zhao, X.S.; Zou, Y.F.; Zhang, W.; Wan, J.; Chen, X.F. LncRNA H19 regulates ID2 expression through competitive binding to hsa-miR-19a/b in acute myelocytic leukemia. Mol. Med. Rep. 2017, 16, 3687–3693. [Google Scholar] [CrossRef] [PubMed]
  38. Ahmadi, J.; Kaviani Gebelli, S.; Atashi, A. Evaluation of MALAT1 gene expression in AML and ALL cell lines. Koomesh 2015, 17, 179–186. [Google Scholar]
  39. Wu, S.; Zheng, C.; Chen, S.; Cai, X.; Shi, Y.; Lin, B.; Chen, Y. Overexpression of long non?coding RNA HOTAIR predicts a poor prognosis in patients with acute myeloid leukemia. Oncol. Lett. 2015, 10, 2410–2414. [Google Scholar] [CrossRef]
  40. Sahin, I.H.; Garrett, C.R. Current State-of-the-Science Adjuvant and Neoadjuvant Therapy in Surgically Resected Colorectal Cancer; IntechOpen Limited: London, UK, 2014. [Google Scholar]
  41. Bond, J.H. Colorectal cancer update. Prevention, screening, treatment, and surveillance for high-risk groups. Med. Clin. N. Am. 2000, 84, 1163–1182. [Google Scholar] [CrossRef]
  42. Xin, Y.; Li, Z.; Zheng, H.; Chan, M.T.V.; Ka, K.; Wu, W. CCAT2: A novel oncogenic long non-coding RNA in human cancers. Cell Prolif. 2017, 50, 255–260. [Google Scholar] [CrossRef] [PubMed]
  43. Shaker, O.G.; Senousy, M.A.; Elbaz, E.M. Association of rs6983267 at 8q24, HULC rs7763881 polymorphisms and serum lncRNAs CCAT2 and HULC with colorectal cancer in Egyptian patients. Sci. Rep. 2017, 7, 16246. [Google Scholar] [CrossRef] [Green Version]
  44. Song, H.; He, P.; Shao, T.; Li, Y.; Li, J.; Zhang, Y. Long non-coding RNA XIST functions as an oncogene in human colorectal cancer by targeting miR-132-3p. J. Buon Off. J. Balk. Union Oncol. 2017, 22, 696–703. [Google Scholar]
  45. Gu, L.; Lu, L.; Zhou, D.; Liu, Z. Long Noncoding RNA BCYRN1 Promotes the Proliferation of Colorectal Cancer Cells via Up-Regulating NPR3 Expression. Cell. Physiol. Biochem. 2018, 2337–2349. [Google Scholar] [CrossRef] [PubMed]
  46. Lu, M.; Zhang, Q.; Deng, M.; Miao, J.; Guo, Y.; Gao, W.; Cui, Q. An Analysis of Human MicroRNA and Disease Associations. PLoS ONE 2008, 3, e3420. [Google Scholar] [CrossRef]
  47. Van Laarhoven, T.; Nabuurs, S.B.; Marchiori, E. Gaussian interaction profile kernels for predicting drug–target interaction. Bioinformatics 2011, 27, 3036–3043. [Google Scholar] [CrossRef] [PubMed] [Green Version]
  48. Zhu, X.; Tian, H.; Zhang, P.; Hu, Z.; Zhou, T. Personalized recommendation based on unbiased consistence. EPL 2015, 111, 48007. [Google Scholar] [CrossRef]
Figure 1. We compared the prediction performance of NBLDA with two classical methods for lncRNA-disease association prediction (KATZLDA and LRLSLDA). (a) Areas under the ROC curve (AUCs) achieved by NBLDA, KATZLDA, and LRLSLDA based on the dataset of DS1; (b) AUCs achieved by NBLDA, KATZLDA, and LRLSLDA based on the dataset of DS2.
Ijms 20 01549 g001
Figure 2. AUCs achieved by NBLDA, KATZLDA, and LRLSLDA based on the dataset of DS3.
Ijms 20 01549 g002
Figure 3. The accuracy of the top 10 related lncRNAs for lung cancer, leukemia, and colorectal cancer predicted by NBLDA, KATZLDA, and LRLSLDA, respectively.
Ijms 20 01549 g003
Figure 4. Flowchart of NBLDA, in which the weighted matrix WD and ZL can be calculated in a similar way as ZD and WL, respectively.
Ijms 20 01549 g004
Table 1. Top 10 potential lung cancer, leukemia, and colorectal cancer-related lncRNAs predicted by NBLDA and confirmations for these predicted associations provided by the Lnc2Cancer database and the studies in the PubMed literature.
DiseaseLncRNAEvidence (PMID)Rank
Lung cancerPVT126493997,28731781,28972861,27904703,291331271
Lung cancerNEAT125818739,29152741,28295289,28615056,290955262
Lung cancerTUG128069000,24853421,29277771,28121347,274854393
Lung cancerXIST29130102,29339211,26339353,29337100,282489284
Lung cancerHULC305759125
Lung cancerLINC-ROR28459375,28516515,290280926
Lung cancerPANDAR28121347,257192497
Lung cancerMIAT29487526,28843520,29228680,29795987,279815518
Lung cancerHNF1A-AS127981551,292898339
LeukemiaH1915645136,29703210,24685695,28765931,296439431
LeukemiaMALAT1287139132
LeukemiaHOTAIR27748863,26622861,27875938,25979172,262616183
LeukemiaMEG328407691,28190319,19595458,14602737,290294244
LeukemiaPVT129510227,265453645
LeukemiaGAS5279517306
LeukemiaUCA127854515,29762824,26053097,296635007
LeukemiaTUG1296543988
LeukemiaXIST79816279
LeukemiaSNHG528861326,2991718410
Colorectal cancerCCAT229181105,27875818,28838211,26853146,237969521
Colorectal cancerXIST29495975,29137332,17143621,28730777,294843952
Colorectal cancerBCYRN1301146903
Colorectal cancerHNF1A-AS128791380,291451644
Colorectal cancerMIAT296865375
Colorectal cancerATB257502896
Colorectal cancerTUSC727683121,28214867,23680400,2897967810

