Co-Expression Network Analysis of Spleen Transcriptome in Rock Bream (Oplegnathus fasciatus) Naturally Infected with Rock Bream Iridovirus (RBIV)

 , , and
Abstract
:1. Introduction
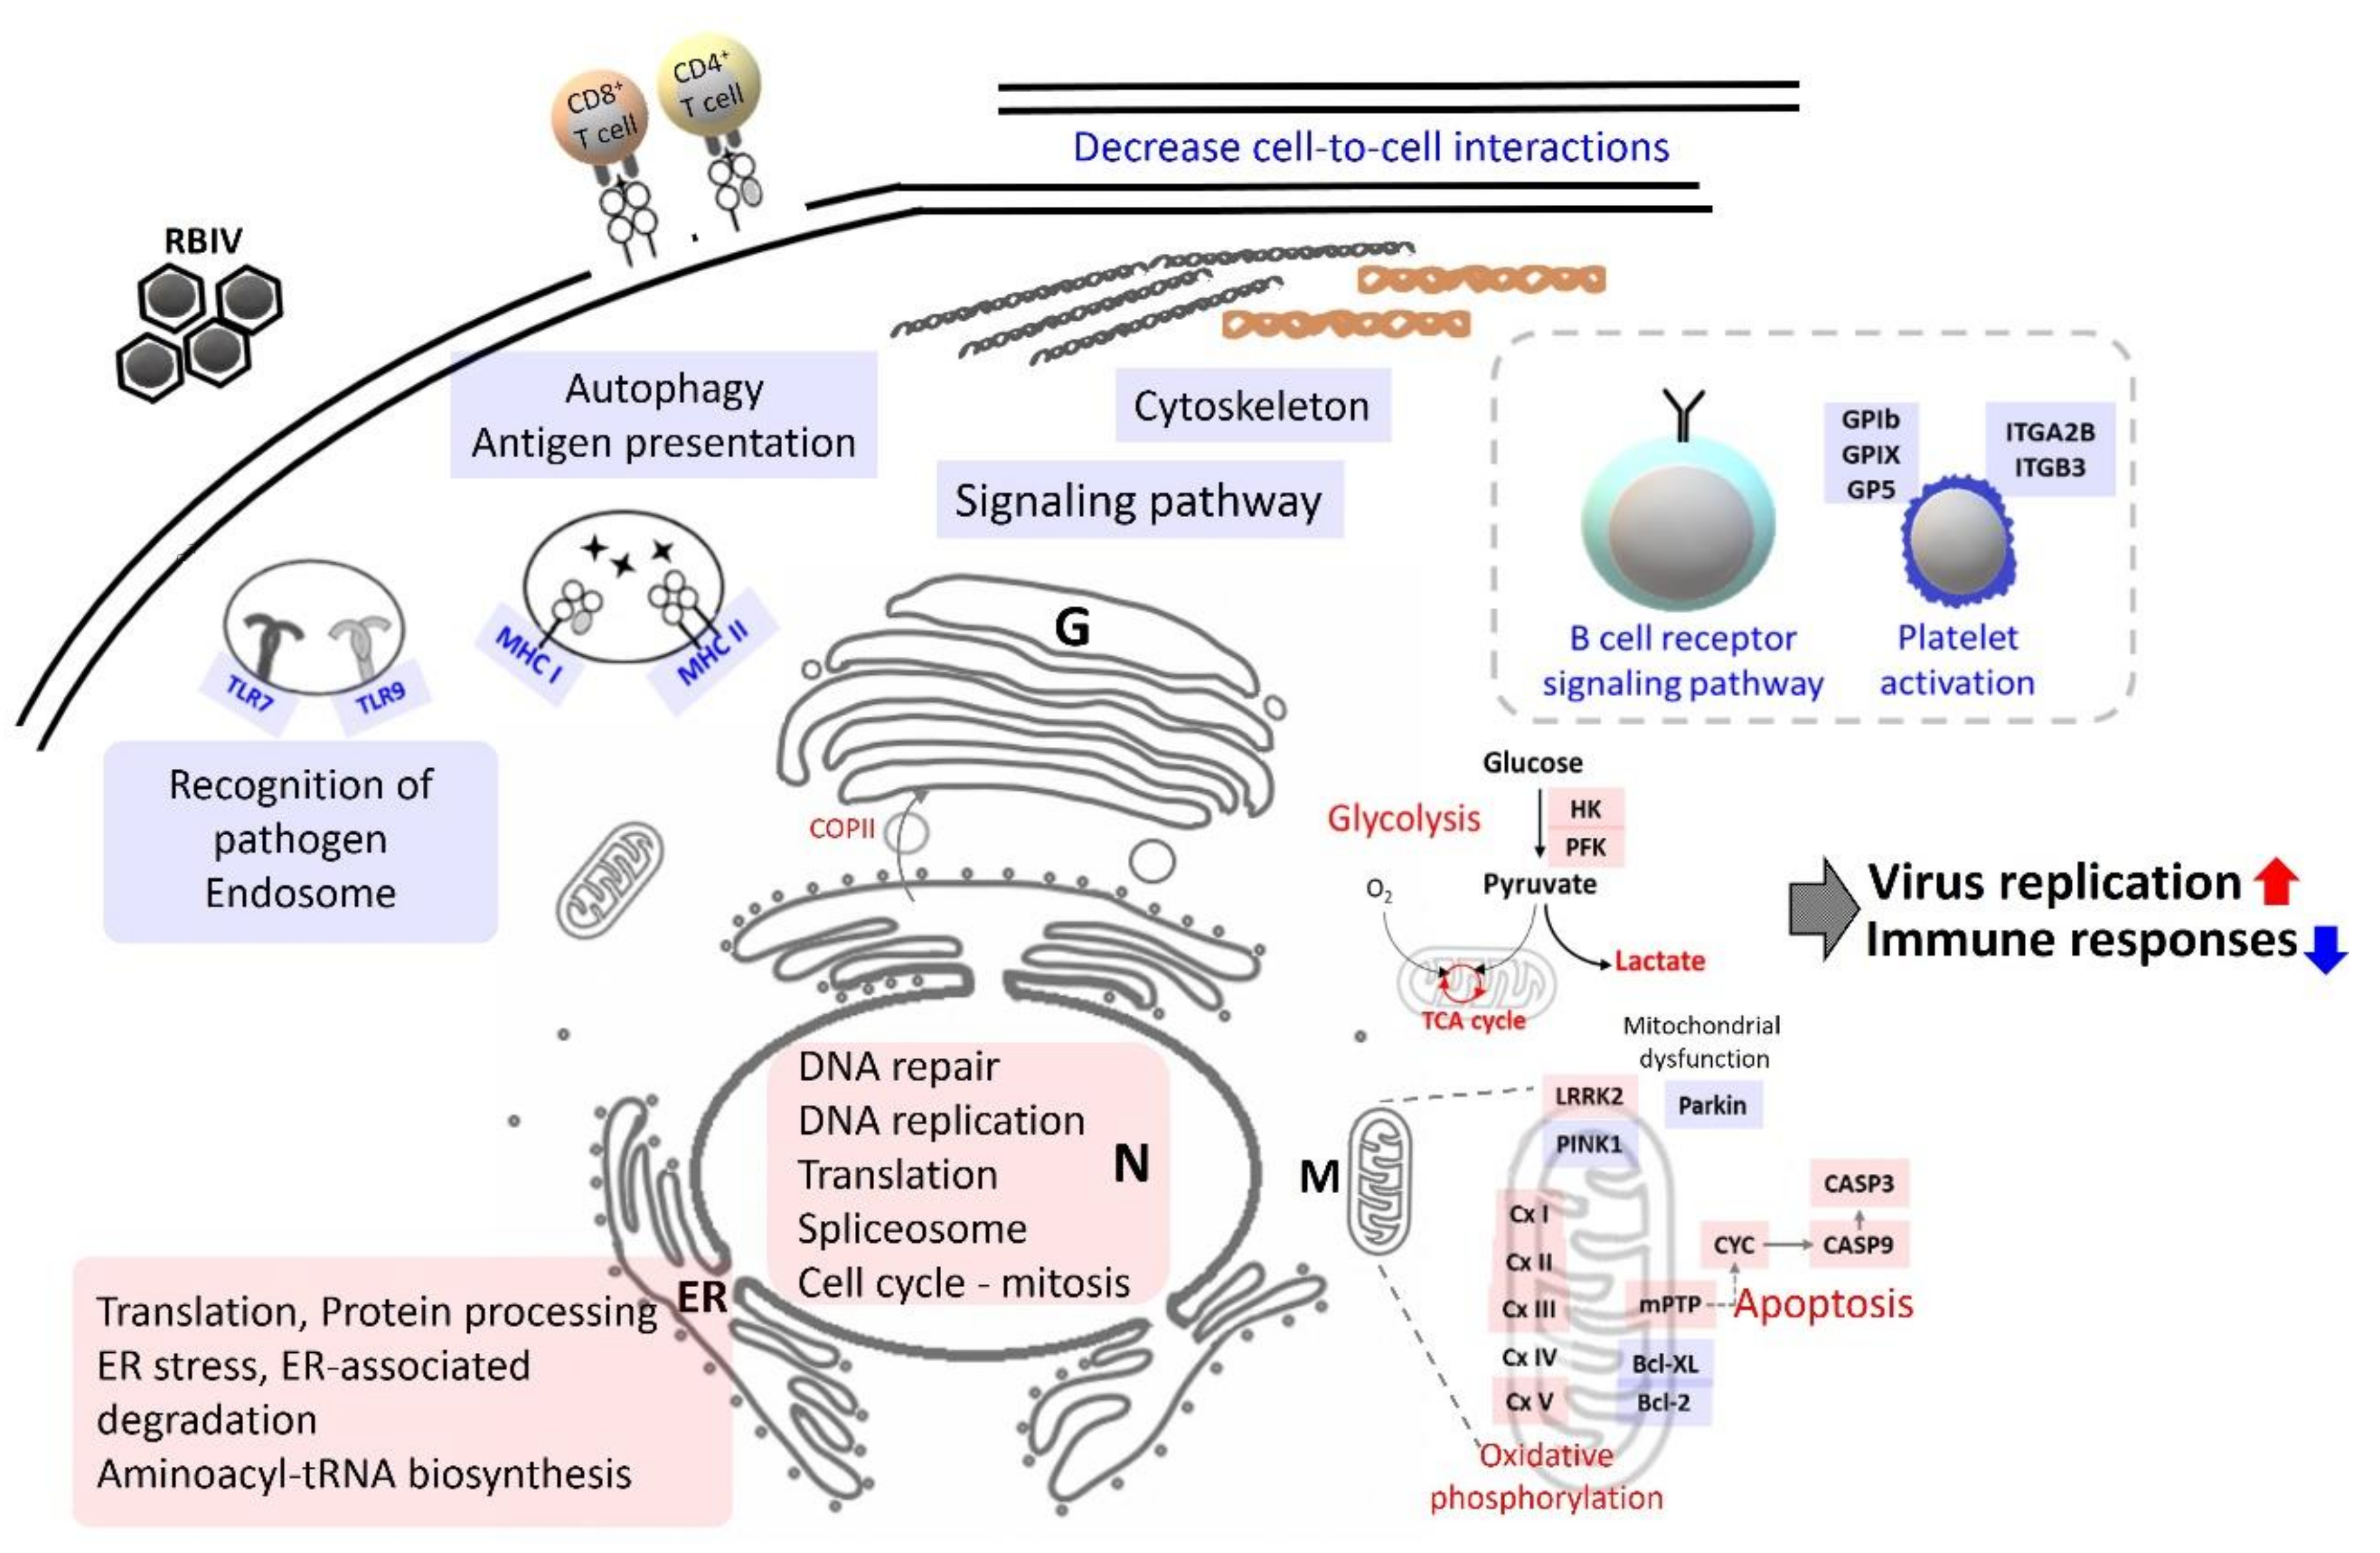
2. Results
2.1. Clinical Traits
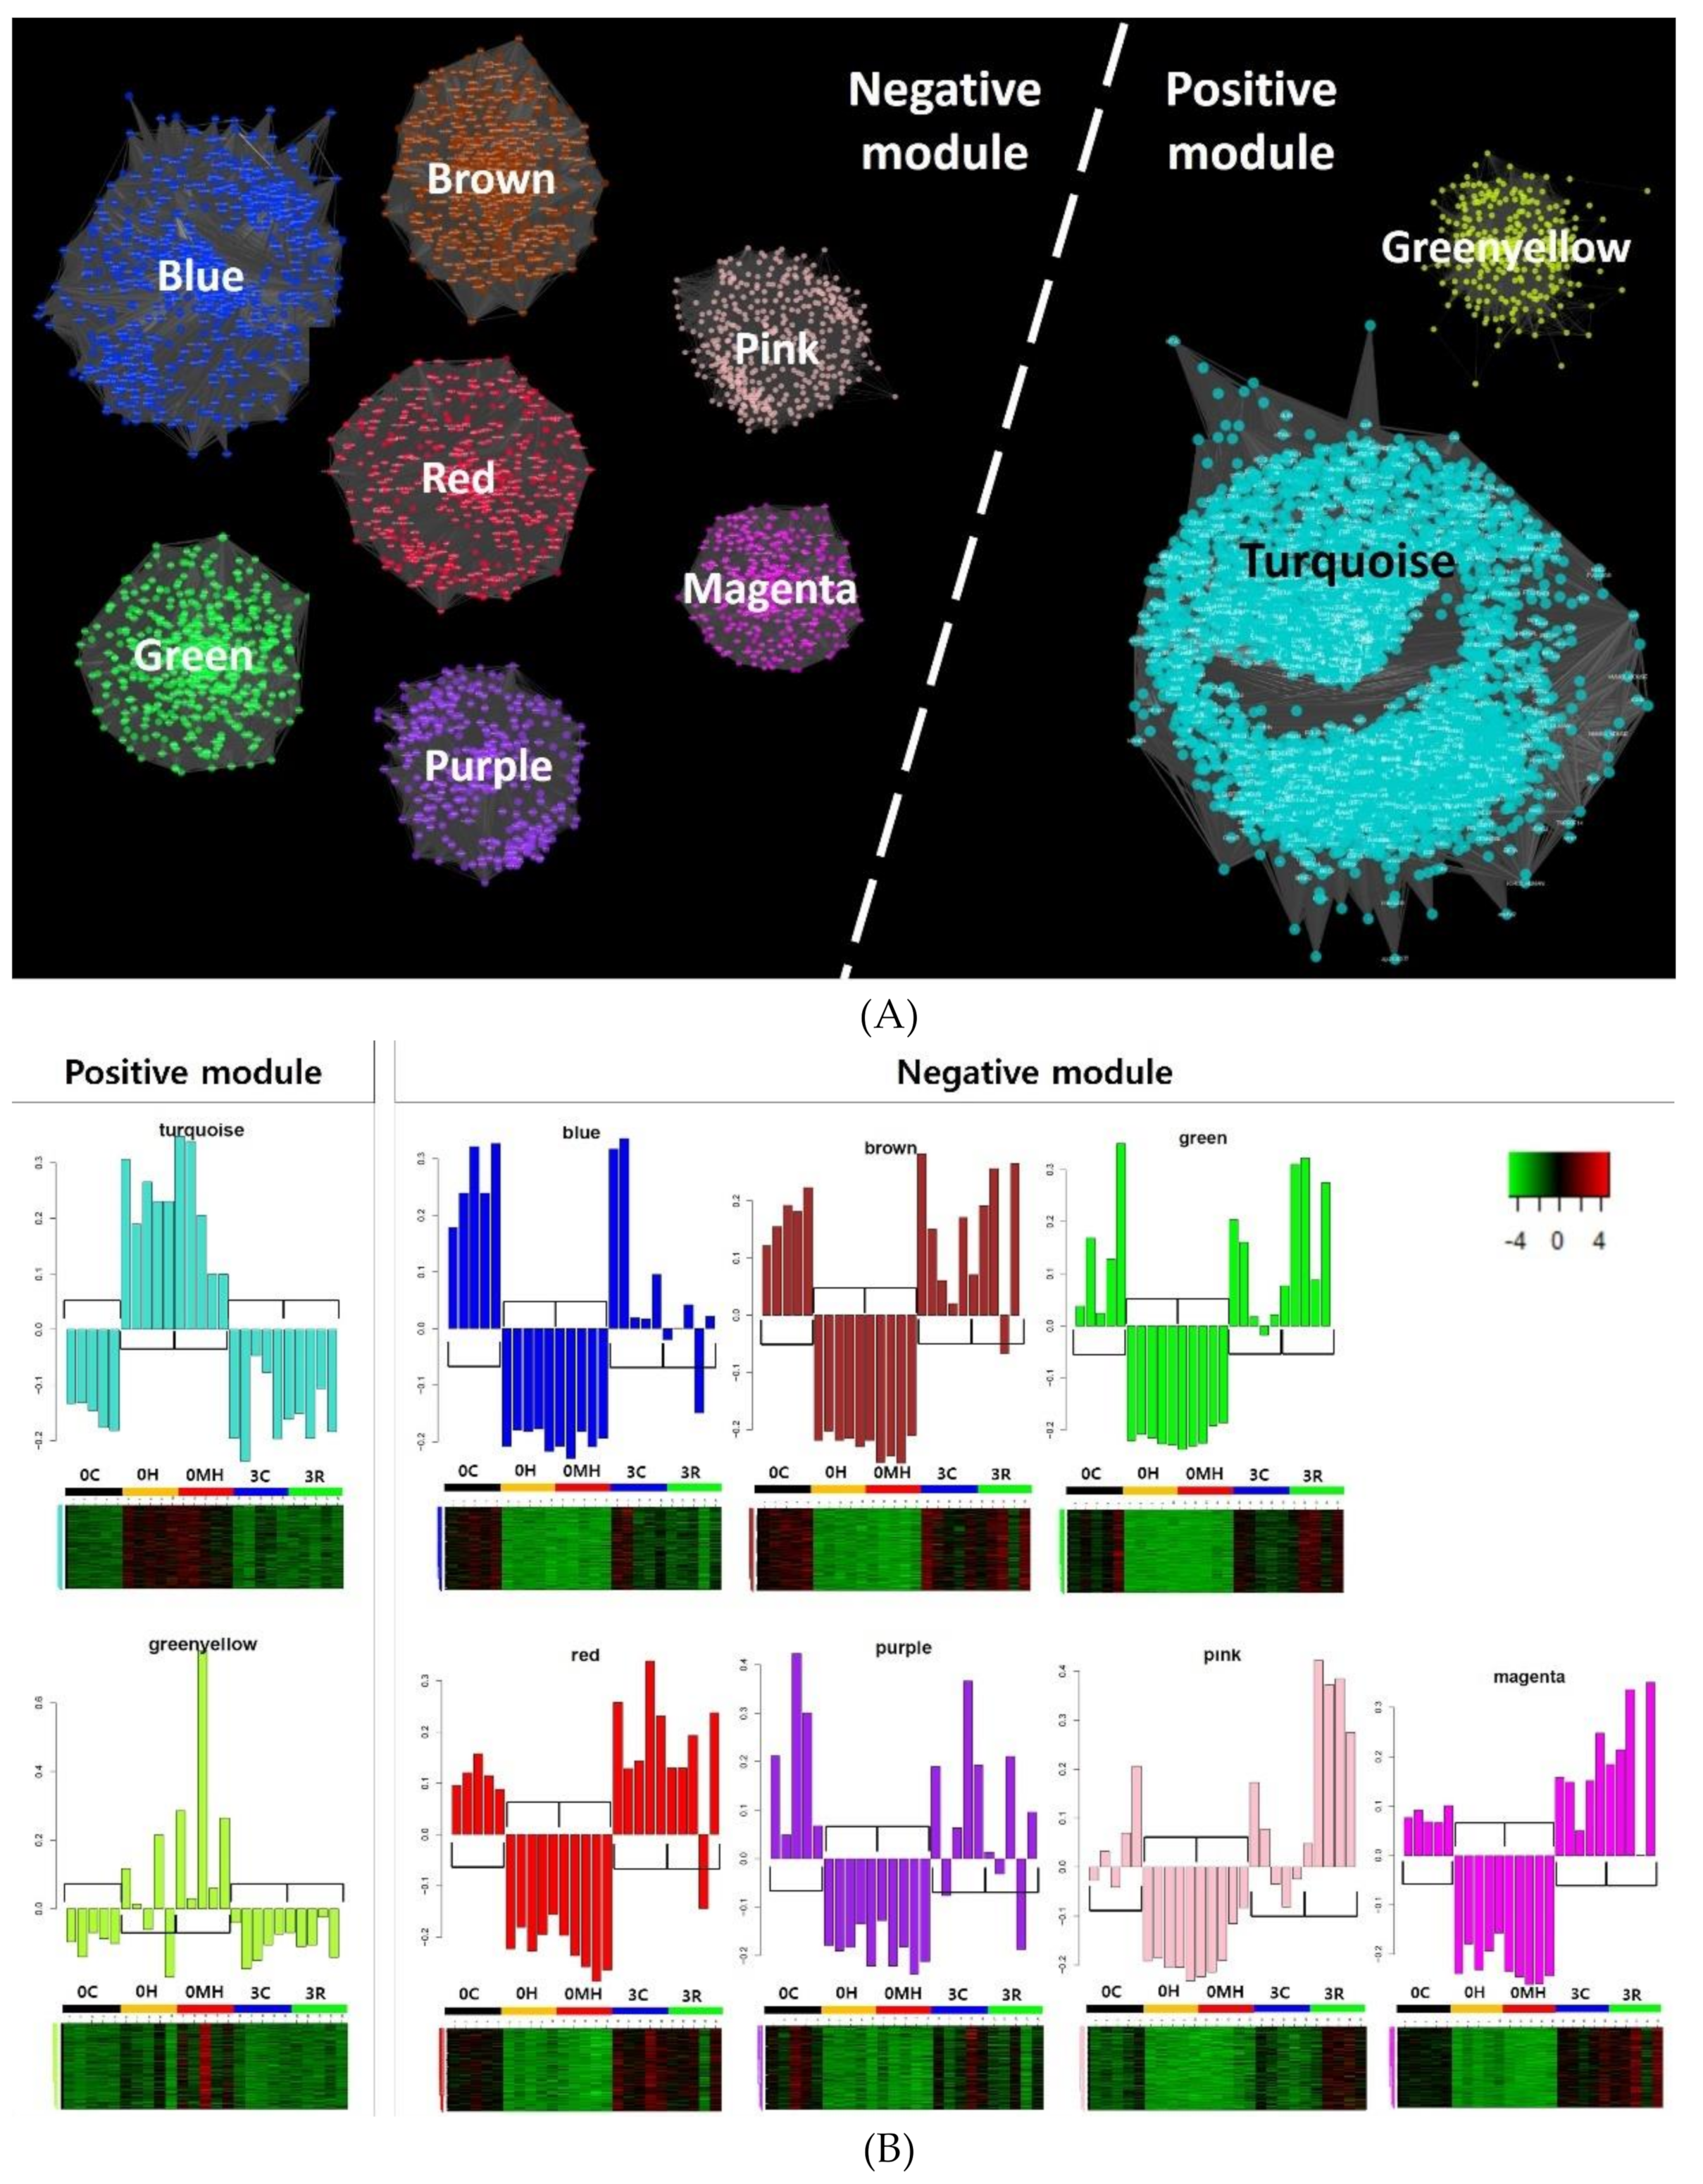
2.2. Module Detection Highly Correlated with RBIV Infection by WGCNA
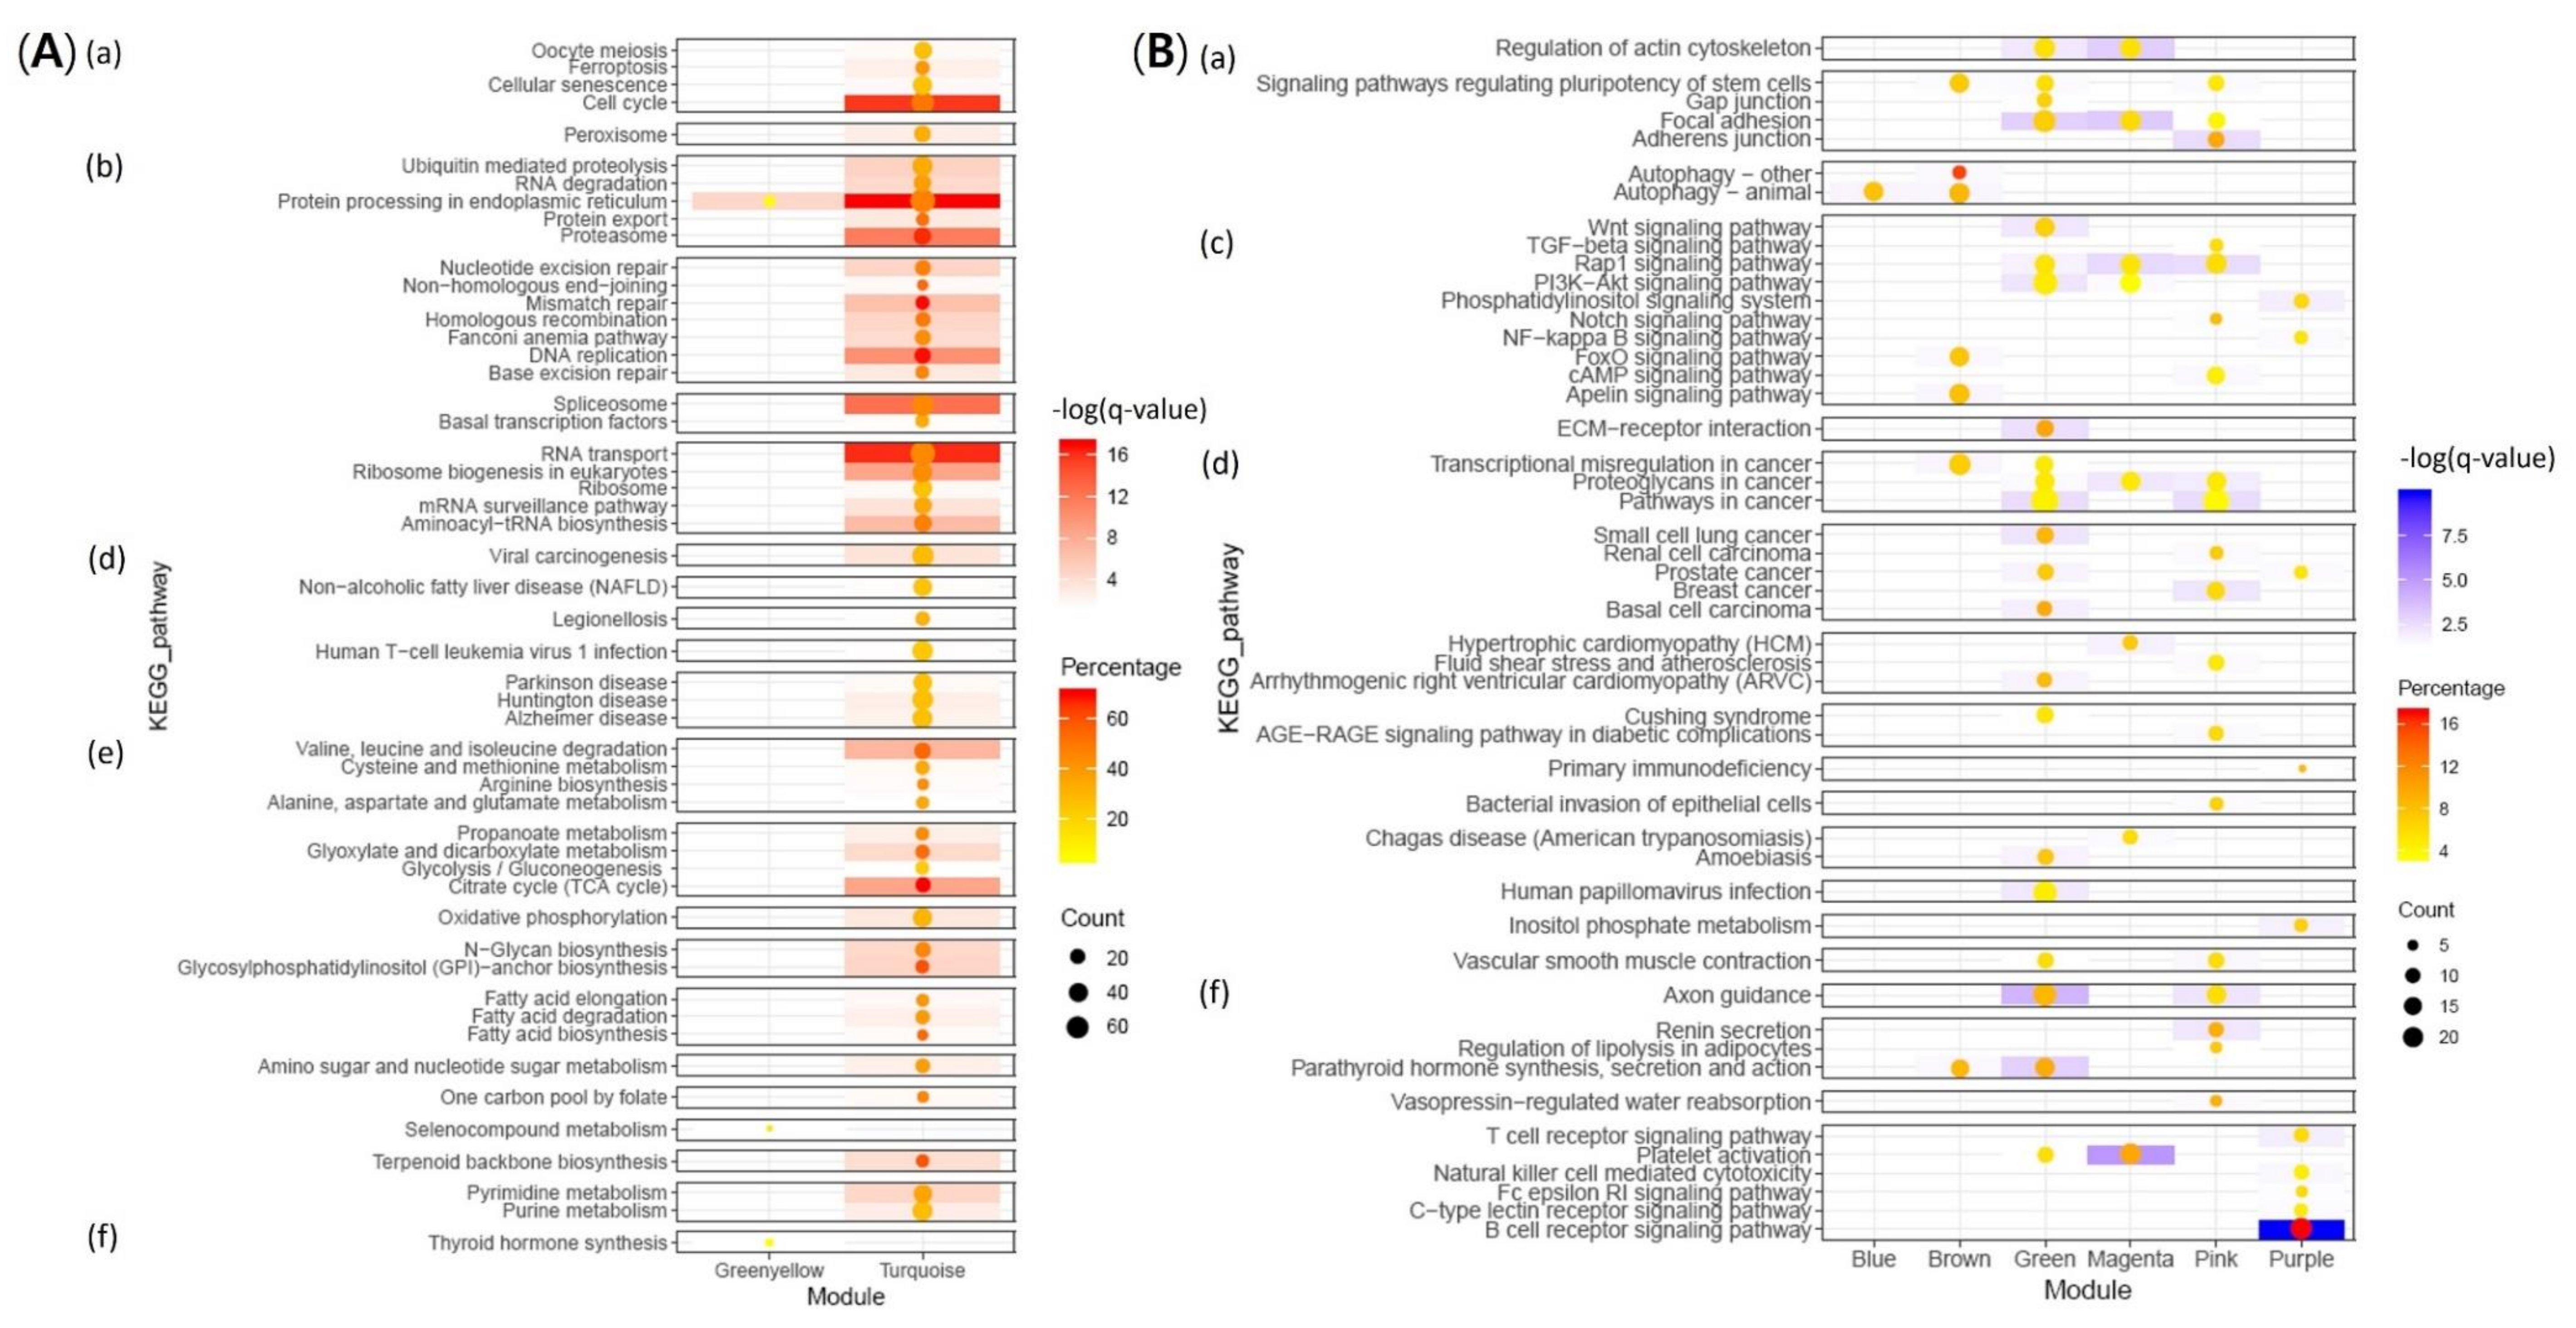
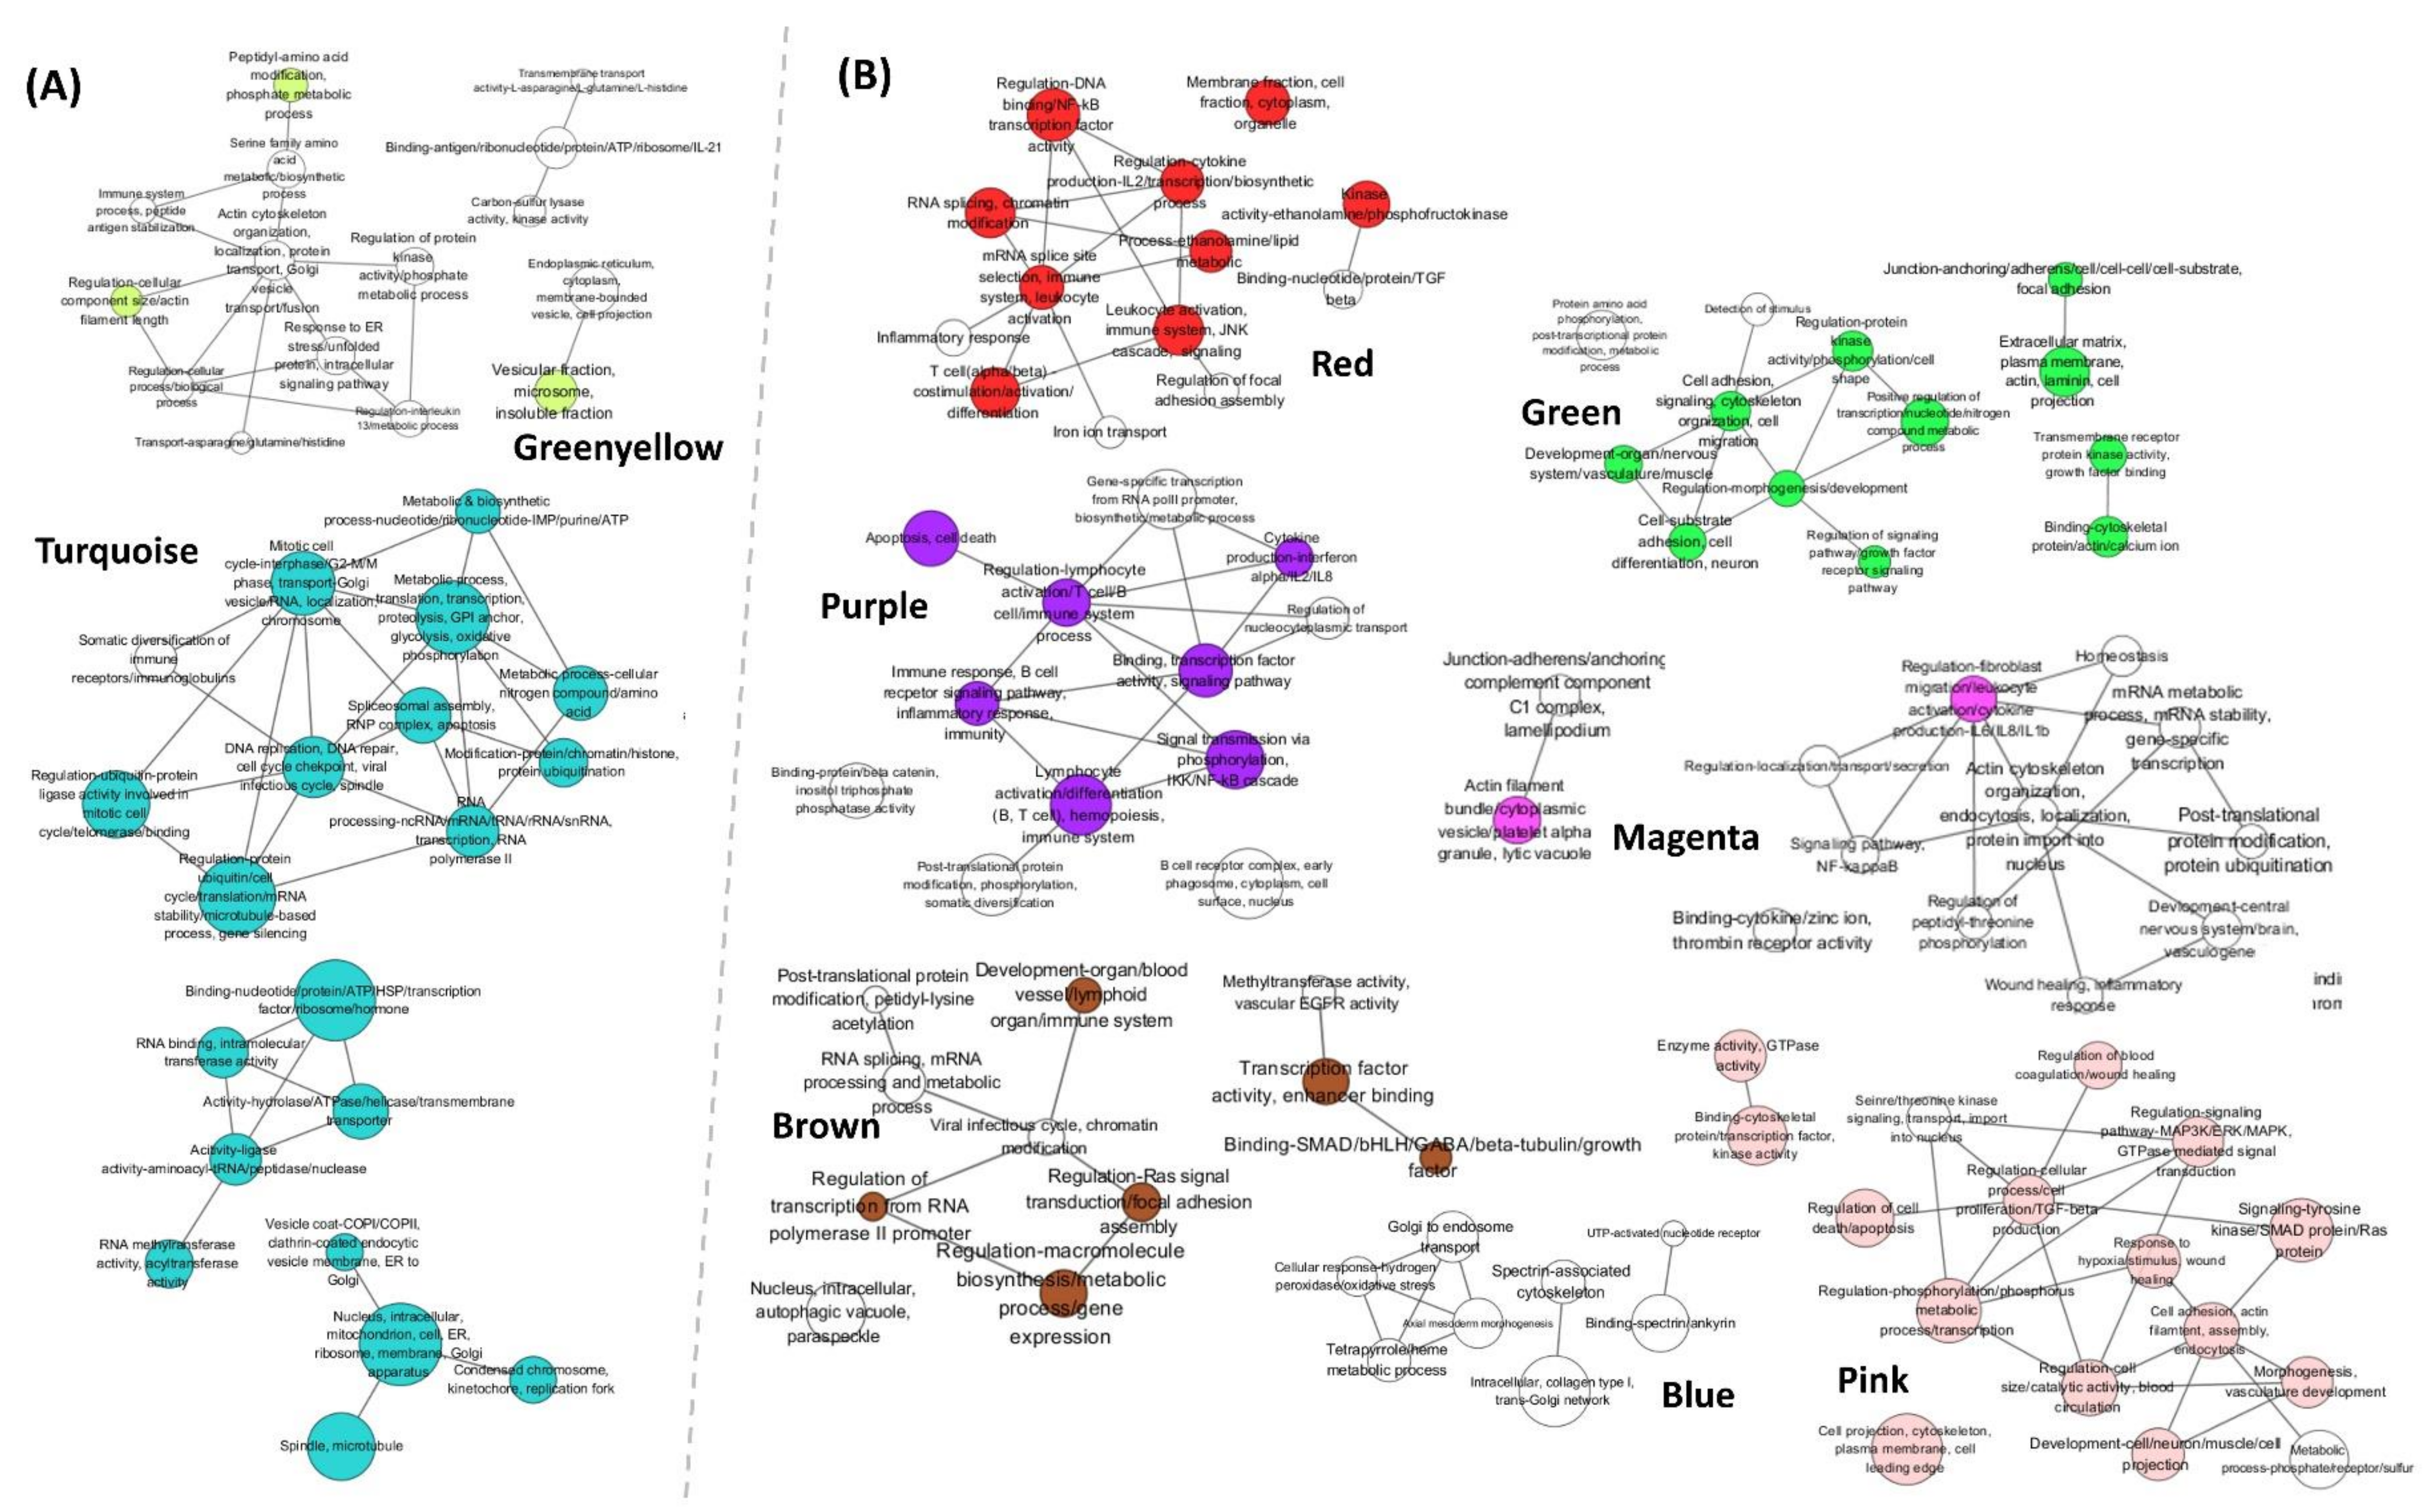
2.3. Functional Enrichment Analysis of Modules
2.3.1. Up-Regulation of Genes Involved in Proliferation of RBIV in Spleen
- (1)
- Cell Cycle, DNA Replication, and Cell Proliferation
- (2)
- Transcription and Translation
- (3)
- Protein Processing in Endoplasmic Reticulum (ER)
- (4)
- Metabolism
- (5)
- Apoptosis
2.3.2. Host Immune Defense Failure against Virus Infection
- (1)
- Decreased Platelet Activation
- (2)
- Immune Systems
- (3)
- Disrupted Cytoskeleton and Cell-To-cell Interaction
- (4)
- Signaling Pathways
2.4. Hub Genes Analysis in Selected Modules
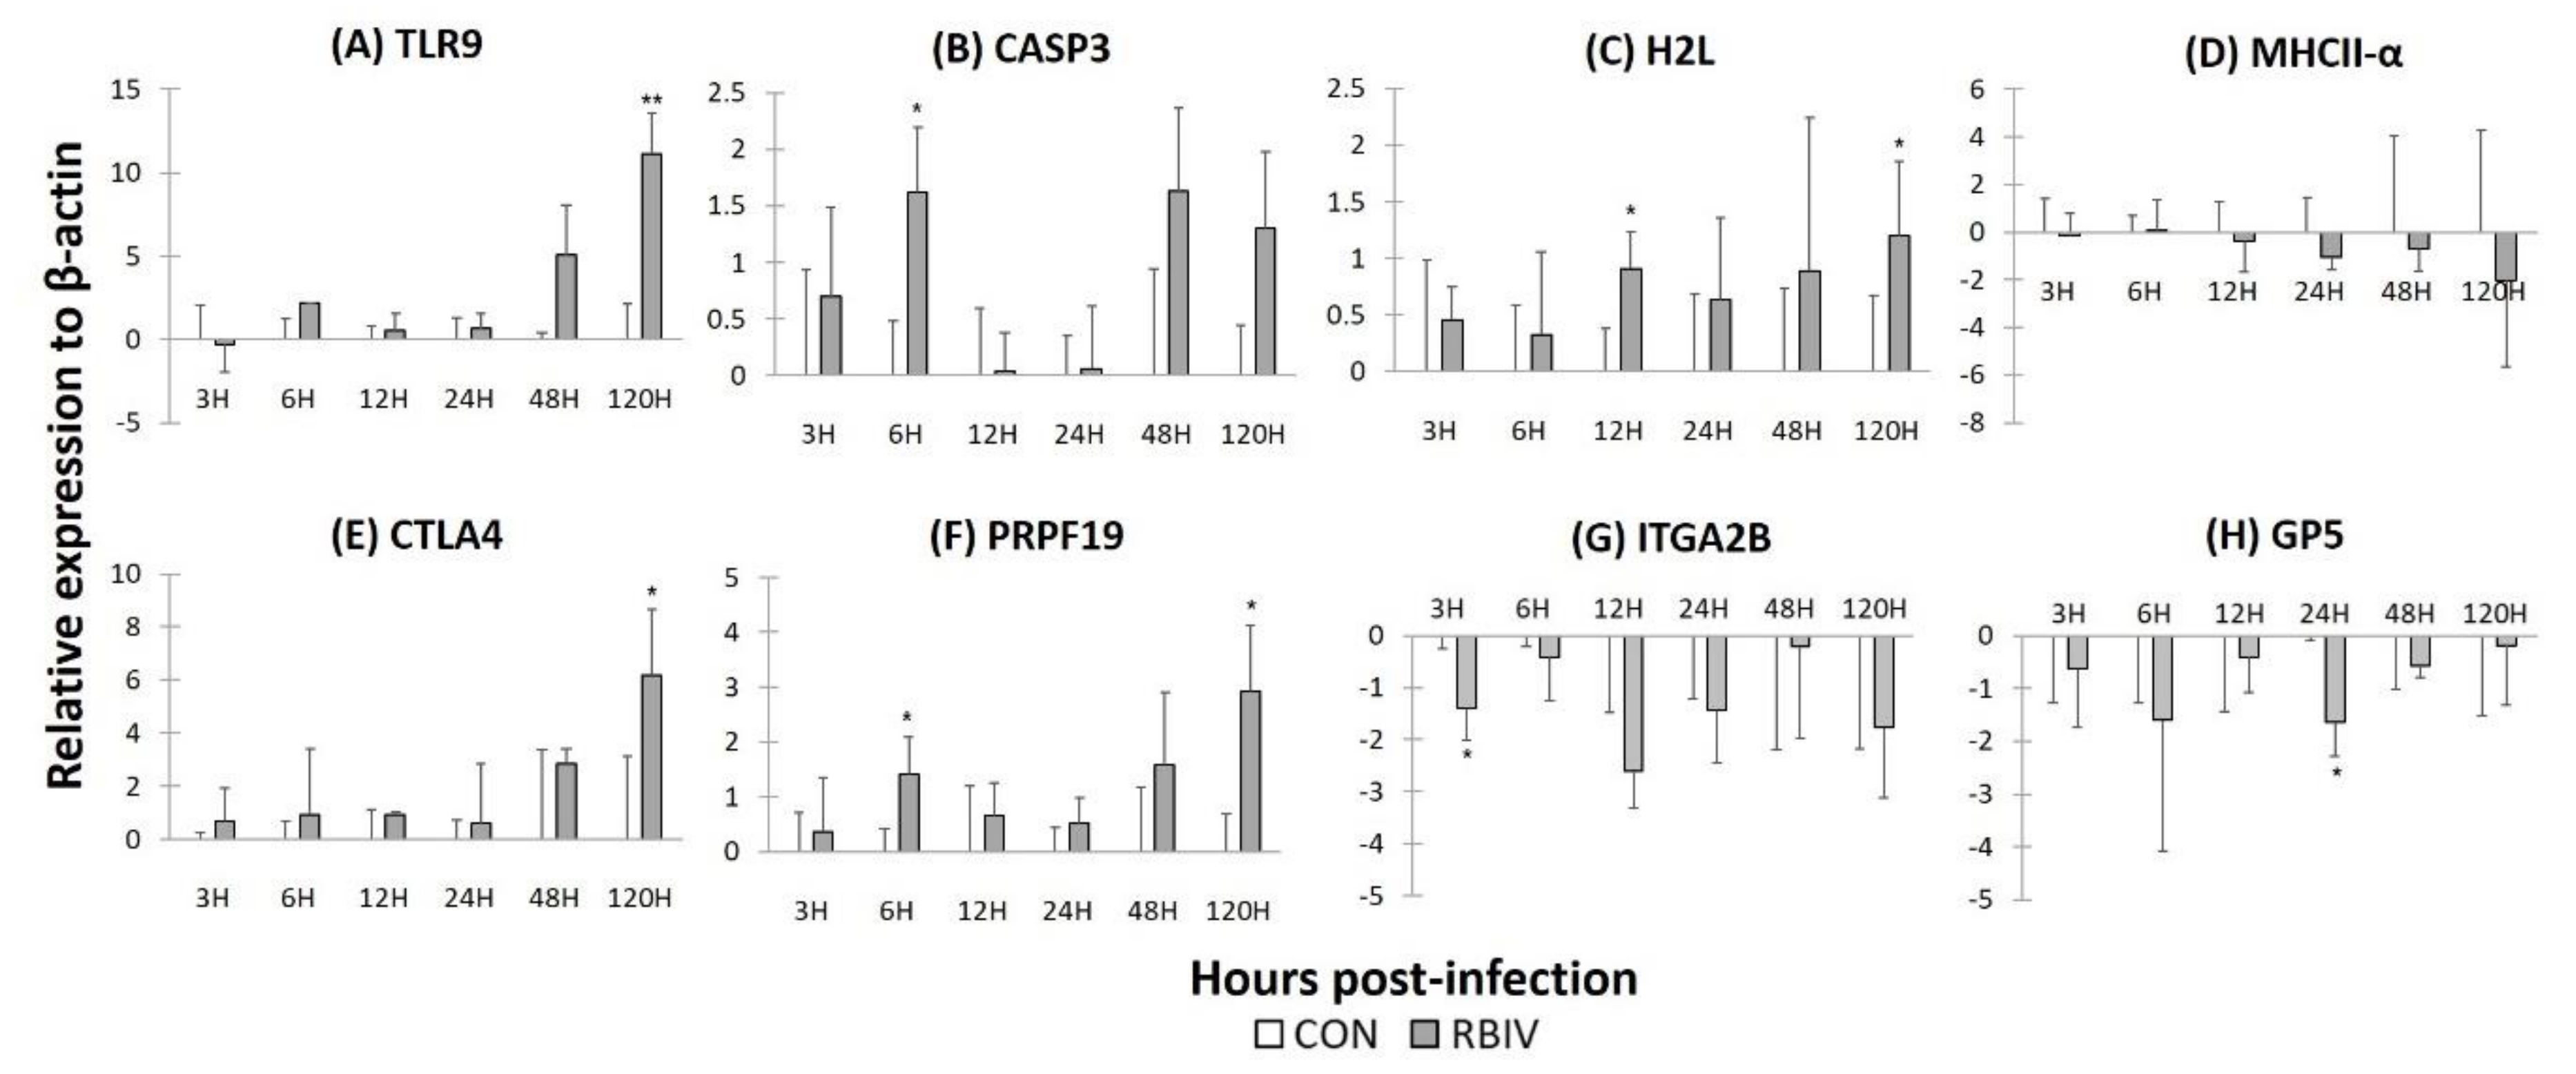
2.5. Gene Expression in Rock Bream Blood Cells Infected with RBIV
3. Discussion
4. Materials and Methods
4.1. Ethical Statement
4.2. Sample Collection and Preparation
4.3. RNA Extraction for Next Generation Sequencing (NGS)
4.4. cDNA Library Construction and Illumina Sequencing
4.5. De Novo Assembly, Functional Annotation, and Differentially Expressed Gene (DEG) Analysis
4.6. Weighted Gene Co-Expression Network Analysis (WGCNA)
4.7. Gene Expression Analysis in Rock Bream Blood Cells Infected with RBIV
4.8. Data Accessibility
5. Conclusions
Supplementary Materials
Author Contributions
Funding
Conflicts of Interest
Abbreviations
| RBIV | Rock bream iridovirus |
| WGCNA | Weighted gene correlation network analysis |
| RNA-seq | RNA-sequencing |
| NGS | Next-generation sequencing |
| FPKM | Fragments per kilo-base per million reads |
| GS | Gene significance |
| MM | Module membership |
| GO | Gene ontology |
| KEGG | Kyoto encyclopedia of genes and genomes |
| NMR | Nuclear magnetic resonance |
References
- Imajoh, M.; Ikawa, T.; Oshima, S. Characterization of a new fibroblast cell line from a tail fin of red sea bream, Pagrus major, and phylogenetic relationships of a recent RSIV isolate in Japan. Virus Res. 2007, 126, 45–52. [Google Scholar] [CrossRef]
- Jung, S.J.; Oh, M.J. Iridovirus-like infection associated with high mortalities of striped beakperch, Oplegnathus fasciatus (Temminck et Schlegel), in southern coastal areas of the Korean peninsula. J. Fish Dis. 2000, 23, 223–226. [Google Scholar] [CrossRef]
- Do, J.W.; Moon, C.H.; Kim, H.J.; Ko, M.S.; Kim, S.B.; Son, J.H.; Kim, J.S.; An, E.J.; Kim, M.K.; Lee, S.K.; et al. Complete genomic DNA sequence of rock bream iridovirus. Virology 2004, 325, 351–363. [Google Scholar] [CrossRef] [Green Version]
- Kurita, J.; Nakajima, K. Megalocytiviruses. Viruses 2012, 4, 521–538. [Google Scholar] [CrossRef] [Green Version]
- Matsuoka, S.; Inouye, K.; Nakajima, K. Cultured Fish Species Affected by Red Sea Bream Iridoviral Disease from 1991 to 1995. Fish Pathol. 1996, 31, 233–234. [Google Scholar] [CrossRef] [Green Version]
- Nakajima, K.; Maeno, Y.; Honda, A.; Yokoyama, K.; Tooriyama, T.; Manabe, S. Effectiveness of a vaccine against red sea bream iridoviral disease in a field trial test. Dis. Aquat. Organ. 1999, 36, 73–75. [Google Scholar] [CrossRef]
- Behjati, S.; Tarpey, P.S. What is next generation sequencing? Arch. Dis. Child Educ. Pract. Ed. 2013, 98, 236–238. [Google Scholar] [CrossRef]
- Mutz, K.O.; Heilkenbrinker, A.; Lonne, M.; Walter, J.G.; Stahl, F. Transcriptome analysis using next-generation sequencing. Curr. Opin. Biotechnol. 2013, 24, 22–30. [Google Scholar] [CrossRef]
- Oulas, A.; Pavloudi, C.; Polymenakou, P.; Pavlopoulos, G.A.; Papanikolaou, N.; Kotoulas, G.; Arvanitidis, C.; Iliopoulos, I. Metagenomics: tools and insights for analyzing next-generation sequencing data derived from biodiversity studies. Bioinform. Biol. Insights 2015, 9, 75–88. [Google Scholar] [CrossRef] [Green Version]
- Sudhagar, A.; Kumar, G.; El-Matbouli, M. Transcriptome Analysis Based on RNA-Seq in Understanding Pathogenic Mechanisms of Diseases and the Immune System of Fish: A Comprehensive Review. Int. J. Mol. Sci. 2018, 19, 245. [Google Scholar] [CrossRef] [Green Version]
- Wang, Z.; Gerstein, M.; Snyder, M. RNA-Seq: a revolutionary tool for transcriptomics. Nat. Rev. Genet. 2009, 10, 57–63. [Google Scholar] [CrossRef]
- Whitley, S.K.; Horne, W.T.; Kolls, J.K. Research Techniques Made Simple: Methodology and Clinical Applications of RNA Sequencing. J. Invest Dermatol. 2016, 136, e77–e82. [Google Scholar] [CrossRef] [Green Version]
- Costa-Silva, J.; Domingues, D.; Lopes, F.M. RNA-Seq differential expression analysis: An extended review and a software tool. PLoS ONE 2017, 12, e0190152. [Google Scholar] [CrossRef] [Green Version]
- Jin, J.-W.; Cho, H.-J.; Kim, K.-I.; Jeong, J.-B.; Park, G.-H.; Jeong, H.-D. Quantitative analysis of the clinical signs in marine fish induced by Megalocytivirus infection. J. Fish Pathol. 2011, 24, 53–64. [Google Scholar] [CrossRef]
- Zhang, B.C.; Zhang, M.; Sun, B.G.; Fang, Y.; Xiao, Z.Z.; Sun, L. Complete genome sequence and transcription profiles of the rock bream iridovirus RBIV-C1. Dis. Aquat. Organ. 2013, 104, 203–214. [Google Scholar] [CrossRef] [Green Version]
- Elvitigala, D.A.; Whang, I.; Premachandra, H.K.; Umasuthan, N.; Oh, M.J.; Jung, S.J.; Yeo, S.Y.; Lim, B.S.; Lee, J.H.; Park, H.C.; et al. Caspase 3 from rock bream (Oplegnathus fasciatus): genomic characterization and transcriptional profiling upon bacterial and viral inductions. Fish Shellfish Immunol. 2012, 33, 99–110. [Google Scholar] [CrossRef]
- Jung, M.H.; Nikapitiya, C.; Song, J.Y.; Lee, J.H.; Lee, J.; Oh, M.J.; Jung, S.J. Gene expression of pro- and anti-apoptotic proteins in rock bream (Oplegnathus fasciatus) infected with megalocytivirus (family Iridoviridae). Fish Shellfish Immunol. 2014, 37, 122–130. [Google Scholar] [CrossRef]
- Hong, S.; Jin, J.W.; Park, J.H.; Kim, J.K.; Jeong, H.D. Analysis of proinflammatory gene expression by RBIV infection in rock bream, Oplegnathus faciatus. Fish Shellfish Immunol. 2016, 50, 317–326. [Google Scholar] [CrossRef]
- Zhang, M.; Xiao, Z.-z.; Hu, Y.-h.; Sun, L. Characterization of a megalocytivirus from cultured rock bream, Oplegnathus fasciatus (Temminck & Schlege), in China. Aquac. Res. 2012, 43, 556–564. [Google Scholar] [CrossRef]
- Jung, M.H.; Nikapitiya, C.; Jung, S.J. DNA vaccine encoding myristoylated membrane protein (MMP) of rock bream iridovirus (RBIV) induces protective immunity in rock bream (Oplegnathus fasciatus). Vaccine 2018, 36, 802–810. [Google Scholar] [CrossRef]
- Fan, Y.; Chang, M.X.; Ma, J.; LaPatra, S.E.; Hu, Y.W.; Huang, L.; Nie, P.; Zeng, L. Transcriptomic analysis of the host response to an iridovirus infection in Chinese giant salamander, Andrias davidianus. Vet Res. 2015, 46, 136. [Google Scholar] [CrossRef] [Green Version]
- Huang, Y.; Huang, X.; Yan, Y.; Cai, J.; Ouyang, Z.; Cui, H.; Wang, P.; Qin, Q. Transcriptome analysis of orange-spotted grouper (Epinephelus coioides) spleen in response to Singapore grouper iridovirus. BMC Genom. 2011, 12, 556. [Google Scholar] [CrossRef] [Green Version]
- Liu, C.C.; Ho, L.P.; Yang, C.H.; Kao, T.Y.; Chou, H.Y.; Pai, T.W. Comparison of grouper infection with two different iridoviruses using transcriptome sequencing and multiple reference species selection. Fish Shellfish Immunol. 2017, 71, 264–274. [Google Scholar] [CrossRef]
- Van Dam, S.; Vosa, U.; van der Graaf, A.; Franke, L.; de Magalhaes, J.P. Gene co-expression analysis for functional classification and gene-disease predictions. Brief Bioinform 2018, 19, 575–592. [Google Scholar] [CrossRef]
- Li, J.; Zhou, D.; Qiu, W.; Shi, Y.; Yang, J.J.; Chen, S.; Wang, Q.; Pan, H. Application of Weighted Gene Co-expression Network Analysis for Data from Paired Design. Sci. Rep. 2018, 8, 622. [Google Scholar] [CrossRef] [Green Version]
- Eisen, M.B.; Spellman, P.T.; Brown, P.O.; Botstein, D. Cluster analysis and display of genome-wide expression patterns. Proc. Natl. Acad. Sci. USA 1998, 95, 14863–14868. [Google Scholar] [CrossRef] [Green Version]
- D’Haeseleer, P. How does gene expression clustering work? Nat. Biotechnol. 2005, 23, 1499–1501. [Google Scholar] [CrossRef]
- Jiang, D.; Tang, C.; Zhang, A. Cluster analysis for gene expression data: a survey. IEEE Trans. Knowledge Data Eng. 2004, 16, 1370–1386. [Google Scholar] [CrossRef]
- Saelens, W.; Cannoodt, R.; Saeys, Y. A comprehensive evaluation of module detection methods for gene expression data. Nat. Commun. 2018, 9, 1090. [Google Scholar] [CrossRef]
- Mason, M.J.; Fan, G.; Plath, K.; Zhou, Q.; Horvath, S. Signed weighted gene co-expression network analysis of transcriptional regulation in murine embryonic stem cells. BMC Genomics 2009, 10, 327. [Google Scholar] [CrossRef] [Green Version]
- Kogelman, L.J.; Cirera, S.; Zhernakova, D.V.; Fredholm, M.; Franke, L.; Kadarmideen, H.N. Identification of co-expression gene networks, regulatory genes and pathways for obesity based on adipose tissue RNA Sequencing in a porcine model. BMC Med. Genom. 2014, 7, 57. [Google Scholar] [CrossRef] [Green Version]
- Voigt, E.A.; Grill, D.E.; Zimmermann, M.T.; Simon, W.L.; Ovsyannikova, I.G.; Kennedy, R.B.; Poland, G.A. Transcriptomic signatures of cellular and humoral immune responses in older adults after seasonal influenza vaccination identified by data-driven clustering. Sci. Rep. 2018, 8, 739. [Google Scholar] [CrossRef] [Green Version]
- Langfelder, P.; Horvath, S. WGCNA: an R package for weighted correlation network analysis. BMC Bioinform. 2008, 9, 559. [Google Scholar] [CrossRef] [Green Version]
- Westermann, A.J.; Gorski, S.A.; Vogel, J. Dual RNA-seq of pathogen and host. Nat. Rev. Microbiol. 2012, 10, 618–630. [Google Scholar] [CrossRef]
- Sharon, D.; Tilgner, H.; Grubert, F.; Snyder, M. A single-molecule long-read survey of the human transcriptome. Nat. Biotechnol. 2013, 31, 1009–1014. [Google Scholar] [CrossRef]
- Abdel-Ghany, S.E.; Hamilton, M.; Jacobi, J.L.; Ngam, P.; Devitt, N.; Schilkey, F.; Ben-Hur, A.; Reddy, A.S. A survey of the sorghum transcriptome using single-molecule long reads. Nat. Commun. 2016, 7, 11706. [Google Scholar] [CrossRef] [Green Version]
- Jo, I.-H.; Lee, J.; Hong, C.; Lee, D.; Bae, W.; Park, S.-G.; Ahn, Y.; Kim, Y.; Kim, J.; Lee, J.; et al. Isoform Sequencing Provides a More Comprehensive View of the Panax ginseng Transcriptome. Genes 2017, 8, 228. [Google Scholar] [CrossRef] [Green Version]
- Shen, Y.; Wang, D.; Zhao, J.; Chen, X. Fish red blood cells express immune genes and responses. Aquac. Fish. 2018, 3, 14–21. [Google Scholar] [CrossRef]
- Jung, M.H.; Chico, V.; Ciordia, S.; Mena, M.C.; Jung, S.J.; Ortega-Villaizan, M.D.M. The Megalocytivirus RBIV Induces Apoptosis and MHC Class I Presentation in Rock Bream (Oplegnathus fasciatus) Red Blood Cells. Front. Immunol. 2019, 10, 160. [Google Scholar] [CrossRef] [Green Version]
- Assinger, A. Platelets and infection - an emerging role of platelets in viral infection. Front. Immunol. 2014, 5, 649. [Google Scholar] [CrossRef] [Green Version]
- Bagga, S.; Bouchard, M.J. Cell Cycle Regulation During Viral Infection. Methods Mol. Biol. 2014, 1170, 165–227. [Google Scholar] [CrossRef]
- Fukumori, T.; Akari, H.; Yoshida, A.; Fujita, M.; Koyama, A.H.; Kagawa, S.; Adachi, A. Regulation of cell cycle and apoptosis by human immunodeficiency virus type 1 Vpr. Microbes Infect. 2000, 2, 1011–1017. [Google Scholar] [CrossRef]
- Middleton, K.; Peh, W.; Southern, S.; Griffin, H.; Sotlar, K.; Nakahara, T.; El-Sherif, A.; Morris, L.; Seth, R.; Hibma, M.; et al. Organization of human papillomavirus productive cycle during neoplastic progression provides a basis for selection of diagnostic markers. J. Virol. 2003, 77, 10186–10201. [Google Scholar] [CrossRef] [Green Version]
- Davy, C.; Doorbar, J. G2/M cell cycle arrest in the life cycle of viruses. Virology 2007, 368, 219–226. [Google Scholar] [CrossRef] [Green Version]
- Matheson, C.J.; Backos, D.S.; Reigan, P. Targeting WEE1 Kinase in Cancer. Trends Pharmacol. Sci. 2016, 37, 872–881. [Google Scholar] [CrossRef]
- Boutros, R.; Lobjois, V.; Ducommun, B. CDC25 phosphatases in cancer cells: key players? Good targets? Nat. Rev. Cancer 2007, 7, 495–507. [Google Scholar] [CrossRef]
- Dubois, J.; Terrier, O.; Rosa-Calatrava, M. Influenza viruses and mRNA splicing: doing more with less. MBio 2014, 5, e00070–e00114. [Google Scholar] [CrossRef] [Green Version]
- Schmid, M.; Speiseder, T.; Dobner, T.; Gonzalez, R.A. DNA virus replication compartments. J. Virol. 2014, 88, 1404–1420. [Google Scholar] [CrossRef] [Green Version]
- Boudreault, S.; Martenon-Brodeur, C.; Caron, M.; Garant, J.M.; Tremblay, M.P.; Armero, V.E.; Durand, M.; Lapointe, E.; Thibault, P.; Tremblay-Letourneau, M.; et al. Global Profiling of the Cellular Alternative RNA Splicing Landscape during Virus-Host Interactions. PLoS ONE 2016, 11, e0161914. [Google Scholar] [CrossRef] [Green Version]
- Romero-Brey, I.; Bartenschlager, R. Endoplasmic Reticulum: The Favorite Intracellular Niche for Viral Replication and Assembly. Viruses 2016, 8, 160. [Google Scholar] [CrossRef] [Green Version]
- Ravindran, M.S.; Bagchi, P.; Cunningham, C.N.; Tsai, B. Opportunistic intruders: how viruses orchestrate ER functions to infect cells. Nat. Rev. Microbiol. 2016, 14, 407–420. [Google Scholar] [CrossRef] [PubMed]
- Chinchar, V.G.; Hyatt, A.; Miyazaki, T.; Williams, T. Family Iridoviridae: poor viral relations no longer. Curr. Top Microbiol. Immunol. 2009, 328, 123–170. [Google Scholar] [CrossRef] [PubMed]
- Chinchar, V.G.; Yu, K.H.; Jancovich, J.K. The molecular biology of frog virus 3 and other iridoviruses infecting cold-blooded vertebrates. Viruses 2011, 3, 1959–1985. [Google Scholar] [CrossRef] [PubMed] [Green Version]
- Liu, Y.; Tran, B.N.; Wang, F.; Ounjai, P.; Wu, J.; Hew, C.L. Visualization of Assembly Intermediates and Budding Vacuoles of Singapore Grouper Iridovirus in Grouper Embryonic Cells. Sci. Rep. 2016, 6, 18696. [Google Scholar] [CrossRef] [Green Version]
- Ma, J.; Zeng, L.; Zhou, Y.; Jiang, N.; Zhang, H.; Fan, Y.; Meng, Y.; Xu, J. Ultrastructural morphogenesis of an amphibian iridovirus isolated from Chinese giant salamander (Andrias davidianus). J. Comp. Pathol. 2014, 150, 325–331. [Google Scholar] [CrossRef]
- Vazquez, A.; Liu, J.; Zhou, Y.; Oltvai, Z.N. Catabolic efficiency of aerobic glycolysis: the Warburg effect revisited. BMC Syst. Biol. 2010, 4, 58. [Google Scholar] [CrossRef] [Green Version]
- Papandreou, I.; Cairns, R.A.; Fontana, L.; Lim, A.L.; Denko, N.C. HIF-1 mediates adaptation to hypoxia by actively downregulating mitochondrial oxygen consumption. Cell Metab. 2006, 3, 187–197. [Google Scholar] [CrossRef] [Green Version]
- Vander Heiden, M.G.; Cantley, L.C.; Thompson, C.B. Understanding the Warburg effect: the metabolic requirements of cell proliferation. Science 2009, 324, 1029–1033. [Google Scholar] [CrossRef] [Green Version]
- Sanchez, E.L.; Lagunoff, M. Viral activation of cellular metabolism. Virology 2015, 479, 609–618. [Google Scholar] [CrossRef] [Green Version]
- Imajoh, M.; Sugiura, H.; Oshima, S. Morphological changes contribute to apoptotic cell death and are affected by caspase-3 and caspase-6 inhibitors during red sea bream iridovirus permissive replication. Virology 2004, 322, 220–230. [Google Scholar] [CrossRef] [Green Version]
- Bellucci, S.; Caen, J. Molecular basis of Glanzmann’s Thrombasthenia and current strategies in treatment. Blood Rev. 2002, 16, 193–202. [Google Scholar] [CrossRef]
- López, J.A.; Andrews, R.K.; Afshar-Kharghan, V.; Berndt, M.C. Bernard-Soulier Syndrome. Blood 1998, 91, 4397–4418. [Google Scholar] [CrossRef] [PubMed]
- Jeong, J.-M.; An, C.M.; Kim, M.-C.; Park, C.-I. Cooperation of erythrocytes with leukocytes in immune response of a teleost Oplegnathus fasciatus. Genes Genom. 2016, 38, 931–938. [Google Scholar] [CrossRef]
- Nagasawa, T.; Nakayasu, C.; Rieger, A.M.; Barreda, D.R.; Somamoto, T.; Nakao, M. Phagocytosis by Thrombocytes is a Conserved Innate Immune Mechanism in Lower Vertebrates. Front. Immunol. 2014, 5, 445. [Google Scholar] [CrossRef] [Green Version]
- Choi, Y.; Bowman, J.W.; Jung, J.U. Autophagy during viral infection - a double-edged sword. Nat. Rev. Microbiol. 2018, 16, 341–354. [Google Scholar] [CrossRef]
- Koutsakos, M.; McWilliam, H.E.G.; Aktepe, T.E.; Fritzlar, S.; Illing, P.T.; Mifsud, N.A.; Purcell, A.W.; Rockman, S.; Reading, P.C.; Vivian, J.P.; et al. Downregulation of MHC Class I Expression by Influenza A and B Viruses. Front. Immunol. 2019, 10, 1158. [Google Scholar] [CrossRef]
- Mankouri, J.; Harris, M. Viruses and the fuel sensor: the emerging link between AMPK and virus replication. Rev. Med. Virol. 2011, 21, 205–212. [Google Scholar] [CrossRef]
- Huang, X.; Huang, Y.; Ouyang, Z.; Xu, L.; Yan, Y.; Cui, H.; Han, X.; Qin, Q. Singapore grouper iridovirus, a large DNA virus, induces nonapoptotic cell death by a cell type dependent fashion and evokes ERK signaling. Apoptosis 2011, 16, 831–845. [Google Scholar] [CrossRef]
- Huang, X.; Wang, W.; Huang, Y.; Xu, L.; Qin, Q. Involvement of the PI3K and ERK signaling pathways in largemouth bass virus-induced apoptosis and viral replication. Fish Shellfish Immunol. 2014, 41, 371–379. [Google Scholar] [CrossRef]
- Stork, P.J.; Dillon, T.J. Multiple roles of Rap1 in hematopoietic cells: complementary versus antagonistic functions. Blood 2005, 106, 2952–2961. [Google Scholar] [CrossRef] [Green Version]
- Sakaguchi, S.; Wing, K.; Onishi, Y.; Prieto-Martin, P.; Yamaguchi, T. Regulatory T cells: how do they suppress immune responses? Int. Immunol. 2009, 21, 1105–1111. [Google Scholar] [CrossRef] [PubMed]
- Mothes, W.; Sherer, N.M.; Jin, J.; Zhong, P. Virus cell-to-cell transmission. J. Virol. 2010, 84, 8360–8368. [Google Scholar] [CrossRef] [PubMed] [Green Version]
- Jia, K.T.; Liu, Z.Y.; Guo, C.J.; Xia, Q.; Mi, S.; Li, X.D.; Weng, S.P.; He, J.G. The potential role of microfilaments in host cells for infection with infectious spleen and kidney necrosis virus infection. Virol. J. 2013, 10, 77. [Google Scholar] [CrossRef] [PubMed] [Green Version]
- Zhang, R.; Zhang, C.; Zhao, Q.; Li, D. Spectrin: structure, function and disease. Sci. China Life Sci. 2013, 56, 1076–1085. [Google Scholar] [CrossRef] [PubMed] [Green Version]
- Andolfo, I.; Russo, R.; Gambale, A.; Iolascon, A. New insights on hereditary erythrocyte membrane defects. Haematologica 2016, 101, 1284–1294. [Google Scholar] [CrossRef] [Green Version]
- Shafizadeh, E.; Paw, B.H.; Foott, H.; Liao, E.C.; Barut, B.A.; Cope, J.J.; Zon, L.I.; Lin, S. Characterization of zebrafish merlot-chablis as non-mammalian vertebrate models for severe congenital anemia due to protein 4.1 deficiency. Devlopment 2002, 129, 4359–4370. [Google Scholar]
- Grote, M.; Wolf, E.; Will, C.L.; Lemm, I.; Agafonov, D.E.; Schomburg, A.; Fischle, W.; Urlaub, H.; Luhrmann, R. Molecular architecture of the human Prp19/CDC5L complex. Mol. Cell Biol. 2010, 30, 2105–2119. [Google Scholar] [CrossRef] [Green Version]
- Song, E.J.; Werner, S.L.; Neubauer, J.; Stegmeier, F.; Aspden, J.; Rio, D.; Harper, J.W.; Elledge, S.J.; Kirschner, M.W.; Rape, M. The Prp19 complex and the Usp4Sart3 deubiquitinating enzyme control reversible ubiquitination at the spliceosome. Genes Dev. 2010, 24, 1434–1447. [Google Scholar] [CrossRef] [Green Version]
- Montecucco, A.; Biamonti, G. Pre-mRNA processing factors meet the DNA damage response. Front. Genet. 2013, 4, 102. [Google Scholar] [CrossRef] [Green Version]
- Li, B.; Dewey, C.N. RSEM: accurate transcript quantification from RNA-Seq data with or without a reference genome. BMC Bioinform. 2011, 12, 323. [Google Scholar] [CrossRef] [Green Version]
- Altschul, S.F.; Gish, W.; Miller, W.; Myers, E.W.; Lipman, D.J. Basic local alignment search tool. J. Mol. Biol. 1990, 215, 403–410. [Google Scholar] [CrossRef]
- Zdobnov, E.M.; Apweiler, R. InterProScan—An integration platform for the signature-recognition methods in InterPro. Bioinformatics 2001, 17, 847–848. [Google Scholar] [CrossRef] [PubMed] [Green Version]
- Moriya, Y.; Itoh, M.; Okuda, S.; Yoshizawa, A.C.; Kanehisa, M. KAAS: an automatic genome annotation and pathway reconstruction server. Nucleic Acids Res. 2007, 35, W182–W185. [Google Scholar] [CrossRef] [PubMed] [Green Version]
- Sun, J.; Nishiyama, T.; Shimizu, K.; Kadota, K. TCC: an R package for comparing tag count data with robust normalization strategies. BMC Bioinformatics 2013, 14, 219. [Google Scholar] [CrossRef] [PubMed] [Green Version]
- Zhang, B.; Horvath, S. A general framework for weighted gene co-expression network analysis. Stat Appl. Genet. Mol. Biol. 2005, 4. Article 17. [Google Scholar] [CrossRef] [PubMed]
- Ramskold, D.; Wang, E.T.; Burge, C.B.; Sandberg, R. An abundance of ubiquitously expressed genes revealed by tissue transcriptome sequence data. PLoS Comput. Biol. 2009, 5, e1000598. [Google Scholar] [CrossRef]
- Trakhtenberg, E.F.; Pho, N.; Holton, K.M.; Chittenden, T.W.; Goldberg, J.L.; Dong, L. Cell types differ in global coordination of splicing and proportion of highly expressed genes. Sci. Rep. 2016, 6, 32249. [Google Scholar] [CrossRef] [Green Version]
- Shannon, P.; Markiel, A.; Ozier, O.; Baliga, N.S.; Wang, J.T.; Ramage, D.; Amin, N.; Schwikowski, B.; Ideker, T. Cytoscape: a software environment for integrated models of biomolecular interaction networks. Genome Res. 2003, 13, 2498–2504. [Google Scholar] [CrossRef]
- Kamburov, A.; Stelzl, U.; Lehrach, H.; Herwig, R. The ConsensusPathDB interaction database: 2013 update. Nucleic Acids Res. 2013, 41, D793–D800. [Google Scholar] [CrossRef]
- Zhang, B.C.; Sun, L.; Xiao, Z.Z.; Hu, Y.H. Quantitative real time RT-PCR study of pathogen-induced gene expression in rock bream (Oplegnathus fasciatus): Intern. Controls Data Norm. Mar 2014, 15, 75–84. [Google Scholar] [CrossRef]
- Whang, I.; Lee, Y.; Kim, H.; Jung, S.J.; Oh, M.J.; Choi, C.Y.; Lee, W.S.; Kim, S.J.; Lee, J. Characterization and expression analysis of the myeloid differentiation factor 88 (MyD88) in rock bream Oplegnathus fasciatus. Mol. Biol. Rep. 2011, 38, 3911–3920. [Google Scholar] [CrossRef] [PubMed]
- Bathige, S.D.; Whang, I.; Umasuthan, N.; Lim, B.S.; Park, M.A.; Kim, E.; Park, H.C.; Lee, J. Interferon regulatory factors 4 and 8 in rock bream, Oplegnathus fasciatus: structural and expressional evidence for their antimicrobial role in teleosts. Fish Shellfish Immunol. 2012, 33, 857–871. [Google Scholar] [CrossRef] [PubMed]
- Bathige, S.D.; Whang, I.; Umasuthan, N.; Wickramaarachchi, W.D.; Wan, Q.; Lim, B.S.; Park, M.A.; Lee, J. Three complement component 1q genes from rock bream, Oplegnathus fasciatus: genome characterization and potential role in immune response against bacterial and viral infections. Fish Shellfish Immunol. 2013, 35, 1442–1454. [Google Scholar] [CrossRef]
- Livak, K.J.; Schmittgen, T.D. Analysis of relative gene expression data using real-time quantitative PCR and the 2(-Delta Delta C(T)) Method. Methods 2001, 25, 402–408. [Google Scholar] [CrossRef] [PubMed]
- Huang, Y.; Niu, B.; Gao, Y.; Fu, L.; Li, W. CD-HIT Suite: a web server for clustering and comparing biological sequences. Bioinformatics 2010, 26, 680–682. [Google Scholar] [CrossRef] [PubMed]
- Haas, B.J.; Papanicolaou, A.; Yassour, M.; Grabherr, M.; Blood, P.D.; Bowden, J.; Couger, M.B.; Eccles, D.; Li, B.; Lieber, M.; et al. De novo transcript sequence reconstruction from RNA-seq using the Trinity platform for reference generation and analysis. Nat. Protoc. 2013, 8, 1494–1512. [Google Scholar] [CrossRef]
- Kamburov, A.; Cavill, R.; Ebbels, T.M.; Herwig, R.; Keun, H.C. Integrated pathway-level analysis of transcriptomics and metabolomics data with IMPaLA. Bioinformatics 2011, 27, 2917–2918. [Google Scholar] [CrossRef]
- Jin, J.W.; Kim, Y.K.; Hong, S.; Kim, Y.C.; Kwon, W.J.; Jeong, H.D. Identification and Characterization of Megalocytivirus Type 3 Infection with Low Mortality in Starry Flounder, Platichthys stellatus, in Korea. J. World Aquac. Soc. 2018, 49, 229–239. [Google Scholar] [CrossRef]
- Kim, K.I.; Jin, J.W.; Kim, Y.C.; Jeong, H.D. Detection and Genetic Differentiation of Megalocytiviruses in Shellfish, via High-Resolution Melting (HRM) Analysis. Korean J. Fish. Aquat. Sci. 2014, 47, 241–246. [Google Scholar] [CrossRef] [Green Version]
- Nikapitiya, C.; Jung, S.-J.; Jung, M.-H.; Song, J.-Y.; Lee, J.; Lee, J.-H.; Oh, M.-J. Identification and Molecular Characterization of Z/ZE Lineage MHC Class I Heavy Chain Homologue and beta;2-microglobulin from Rock Bream Oplegnathus Fasciatus. Fish Pathol. 2014, 49, 93–112. [Google Scholar] [CrossRef] [Green Version]


| Modules | KEGG (q-Value < 0.05) | GO (Adjusted p-Value < 0.05) | |||||
|---|---|---|---|---|---|---|---|
| Gene Cluster | No. of Genes | GS vs. MM Correlation | p-Value | ||||
| Positive | 1 | Turquoise | 5136 | 0.53 | < 1 × 10−200 | Protein processing in ER Cell cycle, RNA transport Proteasome Spliceosome DNA replication | Nucleus, Spliceosome, Mitochondria, Intracellular, Vesicle (COPI/COPII), Transcription, Translation, tRNA, Metabolic process, Mitotic cell cycle, Glycolysis, DNA replication-repair, Protein ubiquitin |
| 2 | Greenyellow | 312 | 0.74 | 2.50 × 10−55 | Protein processing in ER | Amino acid modification, ER stress, Antigen binding, Vesicular fraction | |
| Negative | 3 | Blue | 682 | −0.68 | 1.00 × 10−93 | Autophagy | Spectrin-associated cytoskeleton, Golgi to endosome transport |
| 4 | Brown | 665 | −0.56 | 3.70 × 10−56 | Autophagy | Macromolecule biosynthesis, Transcription factor activity, Gene expression | |
| 5 | Green | 550 | −0.51 | 9.50 × 10−38 | Axon guidance Focal adhesion | Cell adhesion, Extracellular matrix | |
| 6 | Red | 503 | −0.52 | 3.40 × 10−36 | No hit | Regulation (cellular process, signaling pathway, DNA binding), Membrane fraction, RNA splicing, T cell costimulation, Leukocyte activation, Cytokine | |
| 7 | Purple | 325 | −0.60 | 3.70 × 10⁻³³ | B cell receptor signaling pathway | Lymphocyte activation (B/T cell), B cell immune system, Binding | |
| 8 | Pink | 415 | −0.53 | 2.00 × 10⁻³¹ | Rap1 signaling pathway,Adherens junction | Development, Morphogenesis, Signaling process, Cytoskeleton, Ras protein, Apoptosis, Wound healing | |
| 9 | Magenta | 377 | −0.53 | 1.10 × 10⁻²⁸ | Platelet activation, Focal adhesion, Regulation of actin cytoskeleton | Junction, C1 complex, Actin, Platelet alpha granule, Wound healing, Vesicle | |
| Total | 8965 | ||||||
© 2020 by the authors. Licensee MDPI, Basel, Switzerland. This article is an open access article distributed under the terms and conditions of the Creative Commons Attribution (CC BY) license (http://creativecommons.org/licenses/by/4.0/).
Share and Cite
Kim, A.; Yoon, D.; Lim, Y.; Roh, H.J.; Kim, S.; Park, C.-I.; Kim, H.-S.; Cha, H.-J.; Choi, Y.H.; Kim, D.-H. Co-Expression Network Analysis of Spleen Transcriptome in Rock Bream (Oplegnathus fasciatus) Naturally Infected with Rock Bream Iridovirus (RBIV). Int. J. Mol. Sci. 2020, 21, 1707. https://0-doi-org.brum.beds.ac.uk/10.3390/ijms21051707
Kim A, Yoon D, Lim Y, Roh HJ, Kim S, Park C-I, Kim H-S, Cha H-J, Choi YH, Kim D-H. Co-Expression Network Analysis of Spleen Transcriptome in Rock Bream (Oplegnathus fasciatus) Naturally Infected with Rock Bream Iridovirus (RBIV). International Journal of Molecular Sciences. 2020; 21(5):1707. https://0-doi-org.brum.beds.ac.uk/10.3390/ijms21051707
Chicago/Turabian StyleKim, Ahran, Dahye Yoon, Yunjin Lim, Heyong Jin Roh, Suhkmann Kim, Chan-Il Park, Heui-Soo Kim, Hee-Jae Cha, Yung Hyun Choi, and Do-Hyung Kim. 2020. "Co-Expression Network Analysis of Spleen Transcriptome in Rock Bream (Oplegnathus fasciatus) Naturally Infected with Rock Bream Iridovirus (RBIV)" International Journal of Molecular Sciences 21, no. 5: 1707. https://0-doi-org.brum.beds.ac.uk/10.3390/ijms21051707