RNA:DNA Ratio and Other Nucleic Acid Derived Indices in Marine Ecology

Abstract
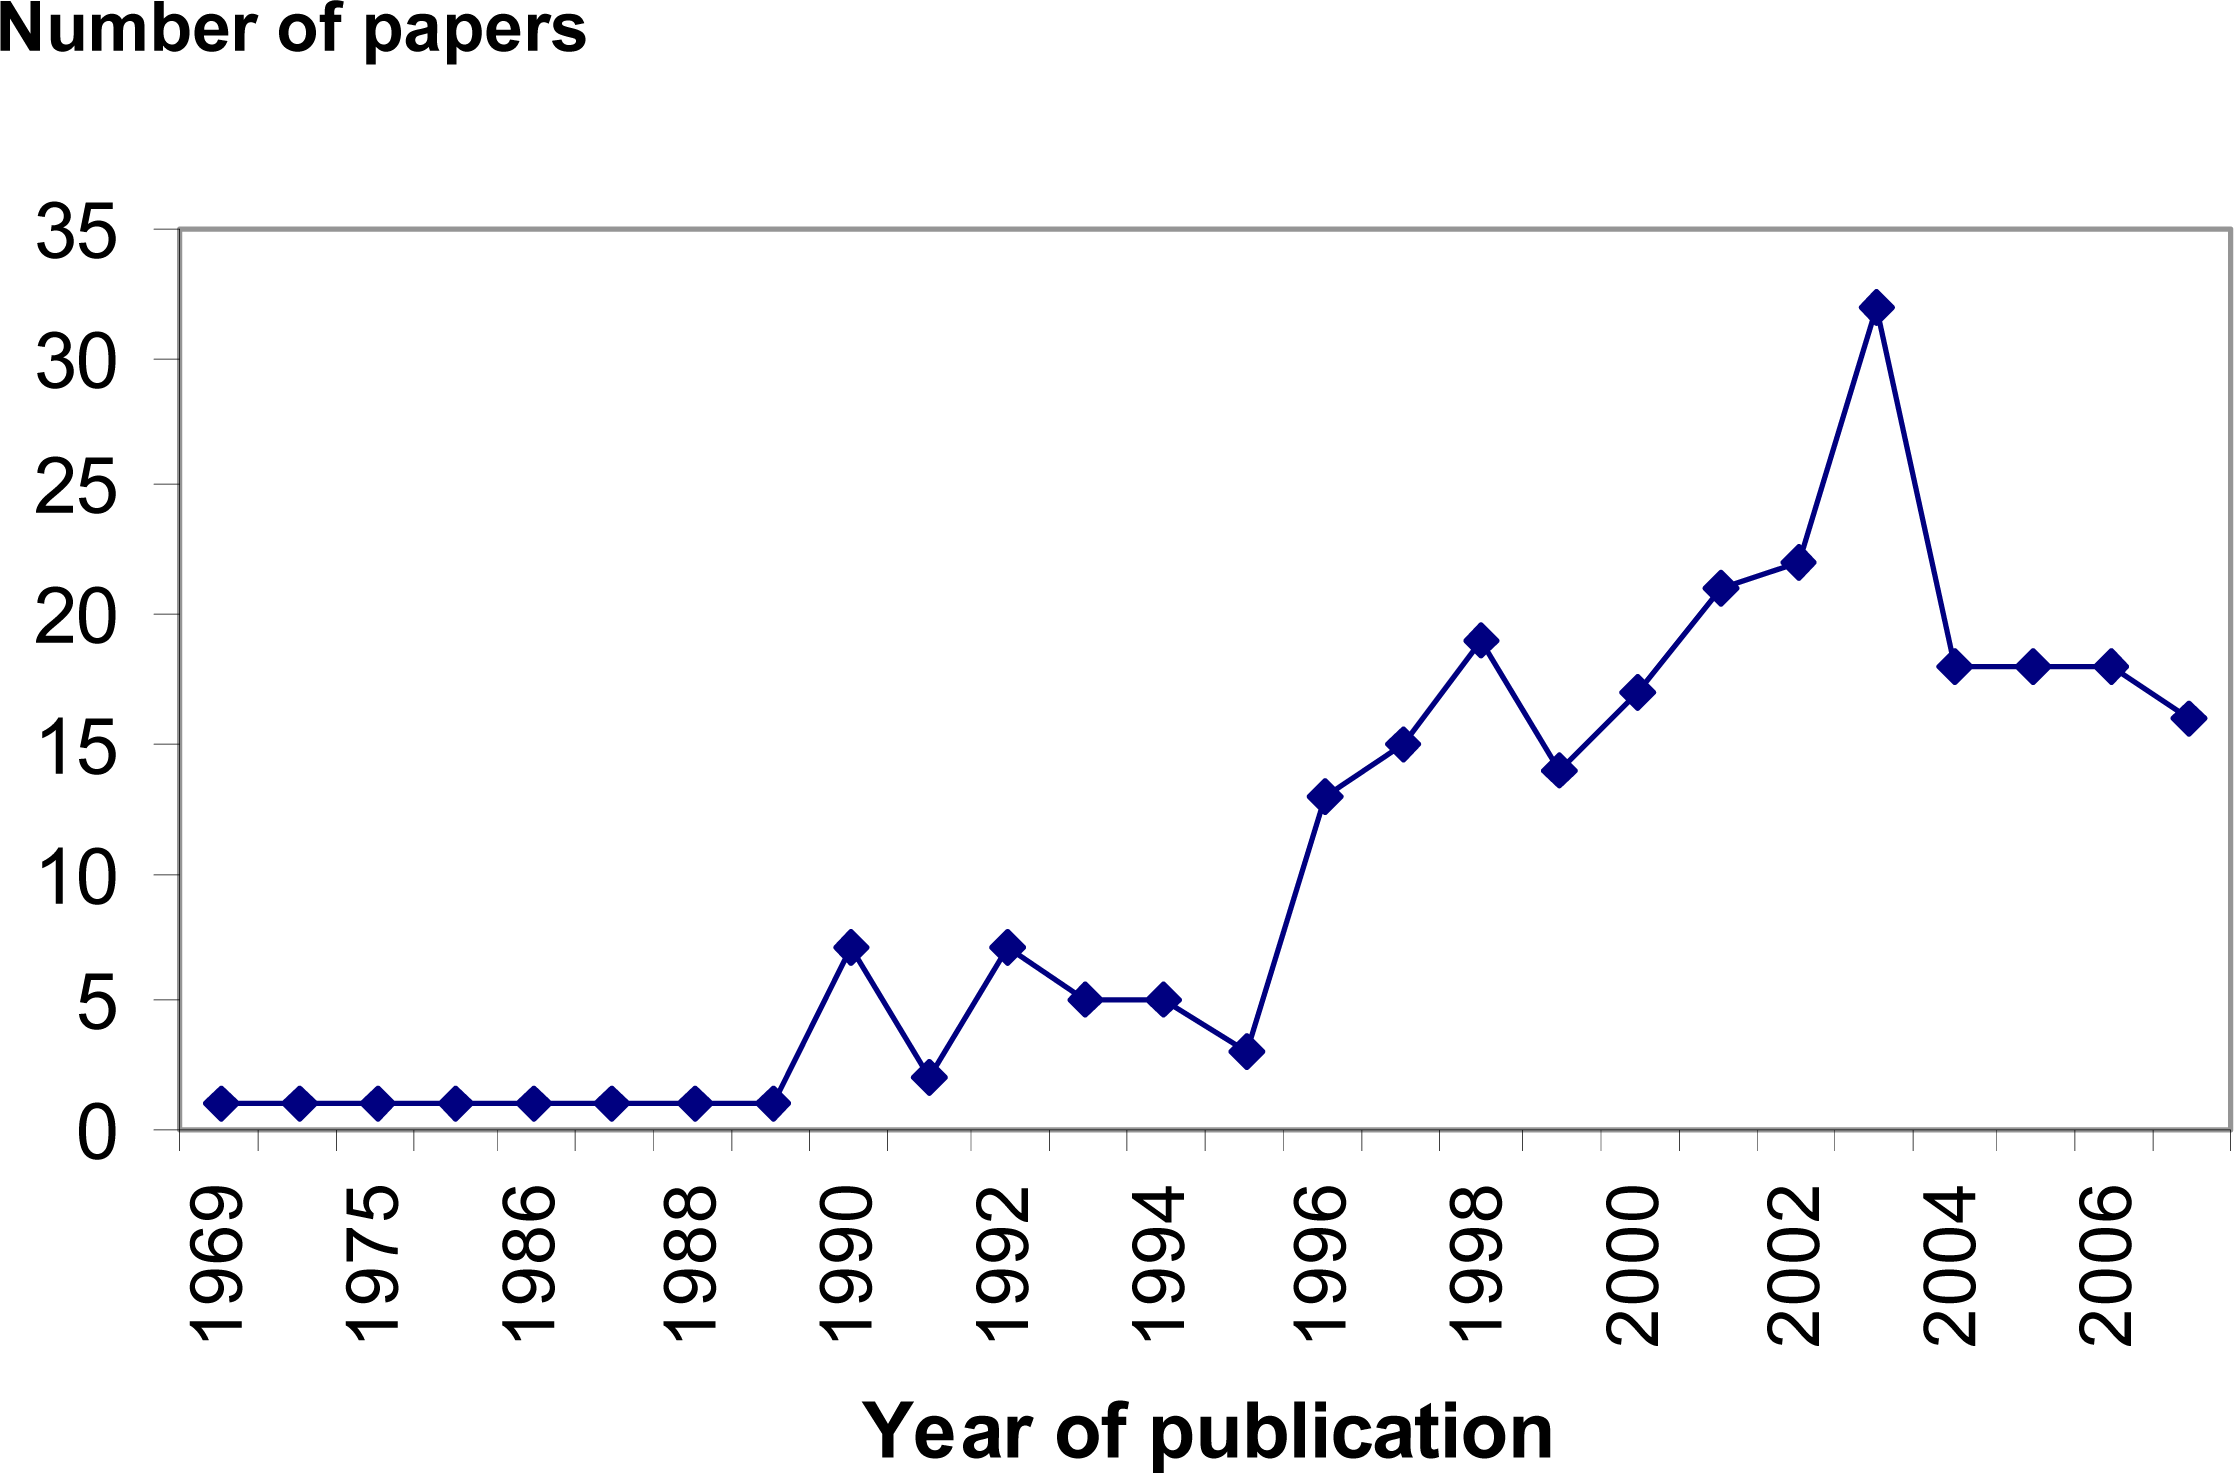
:1. Introduction
2. Analysis of nucleic derived indices
2.1. Organism level indices: RNA:DNA ratio, DNA:dry weight and RNA:protein
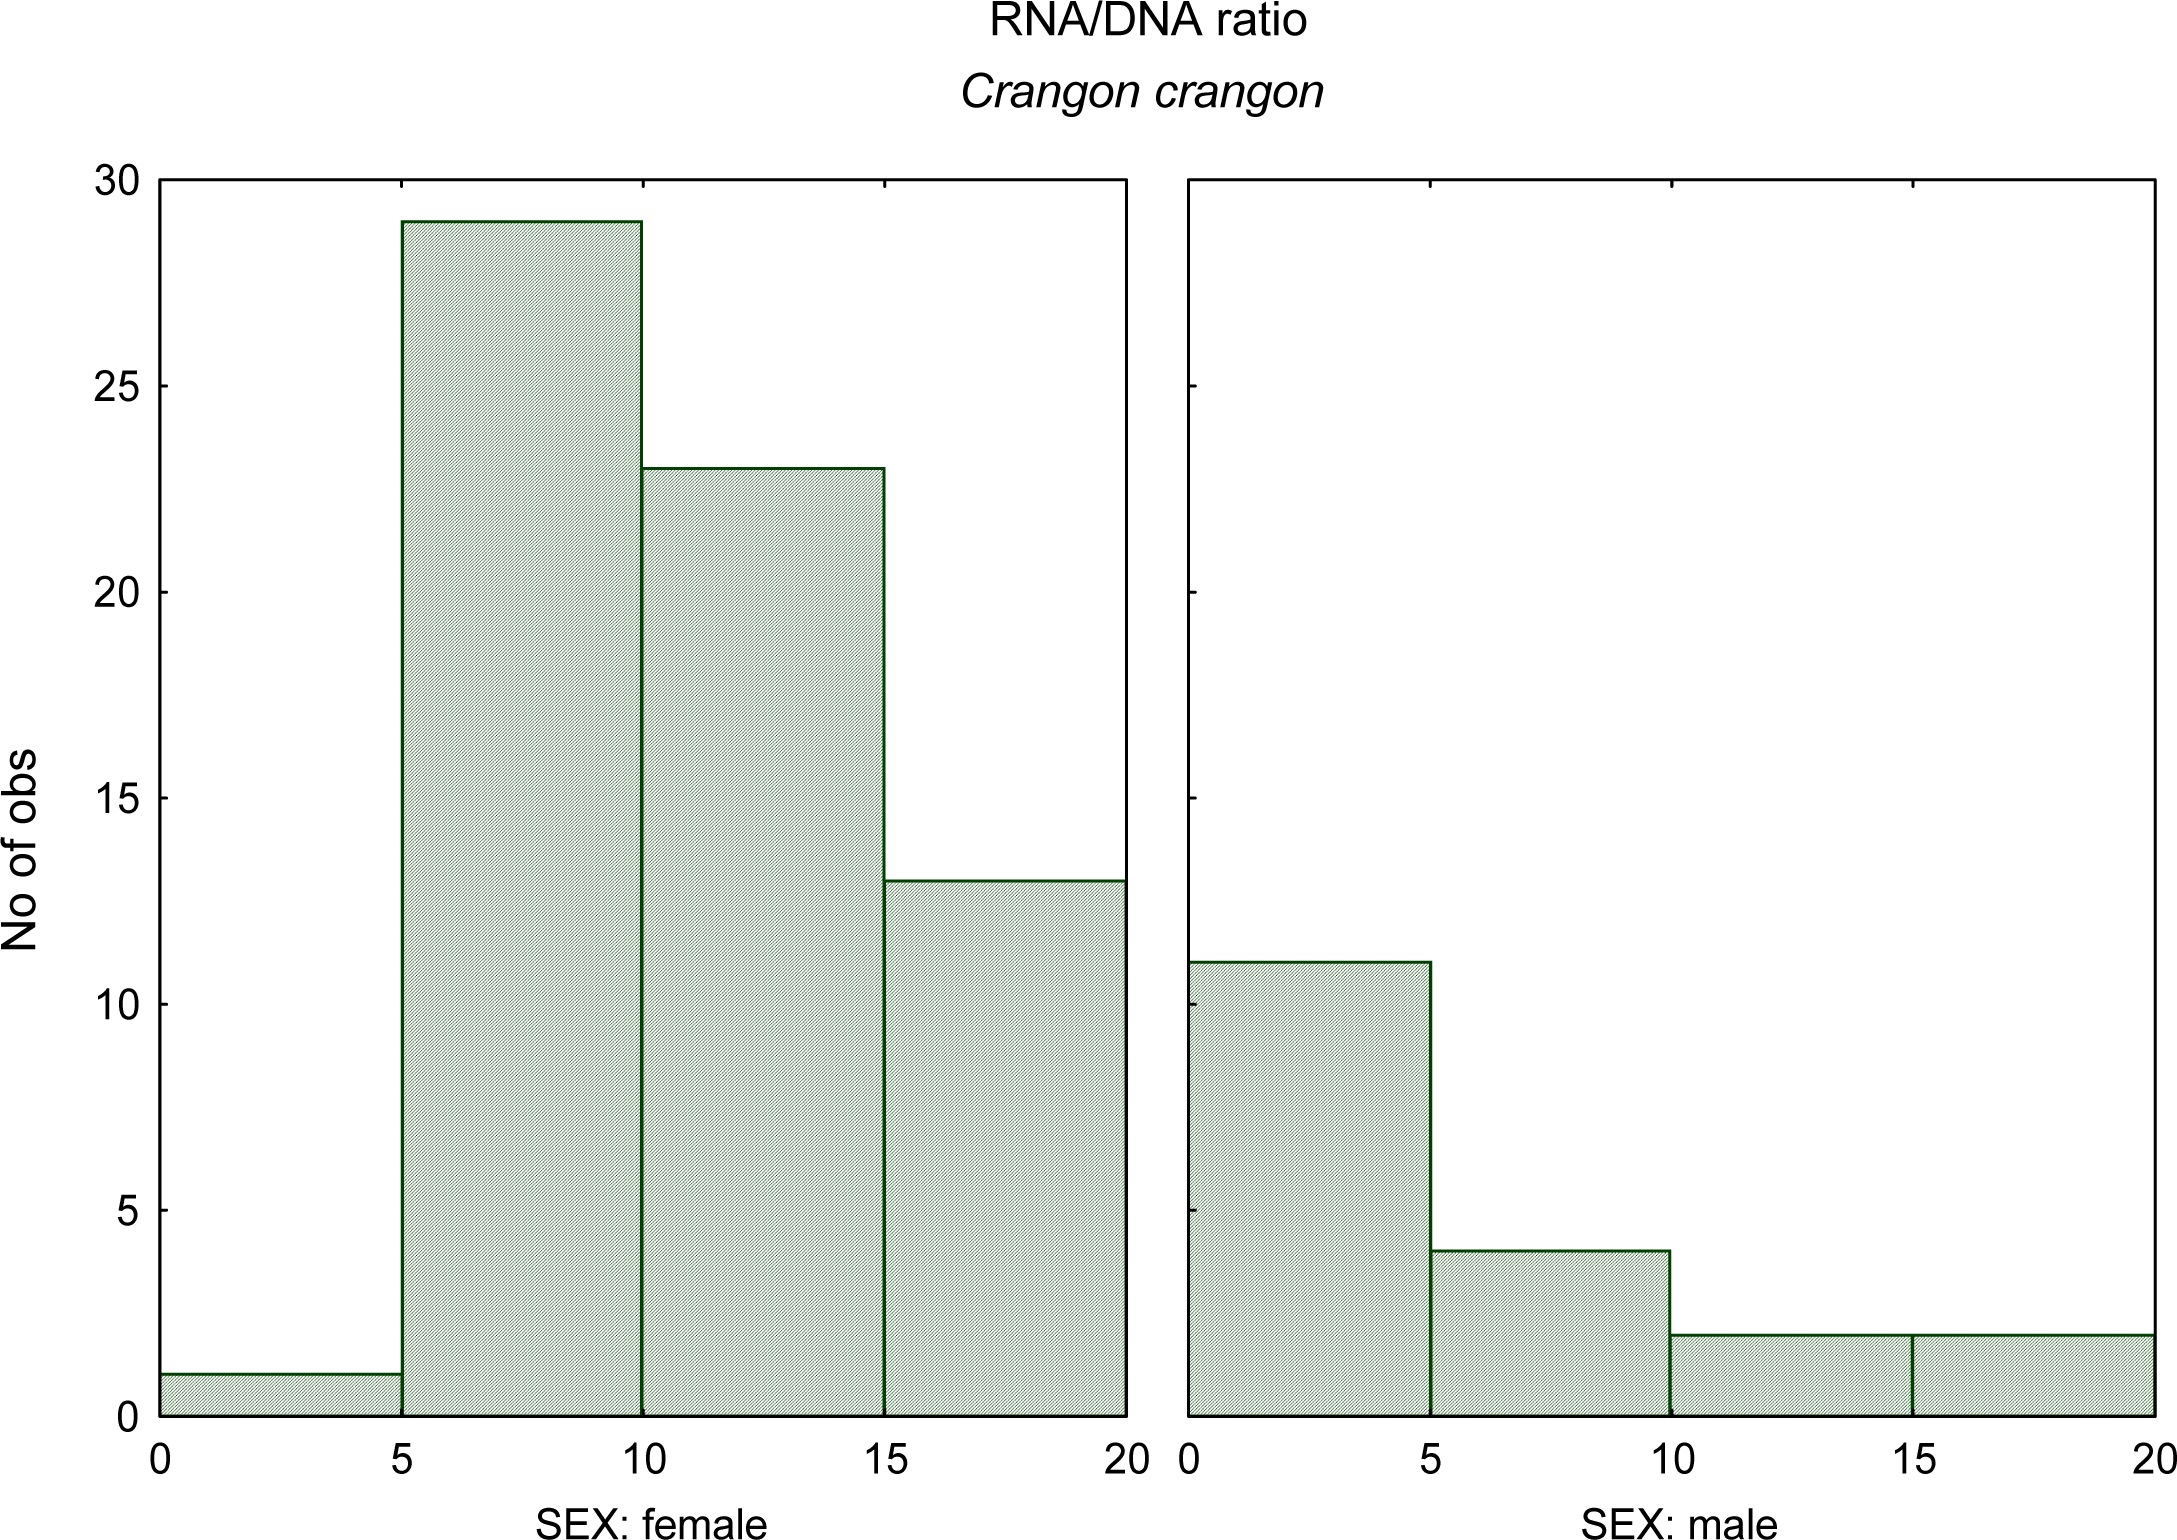
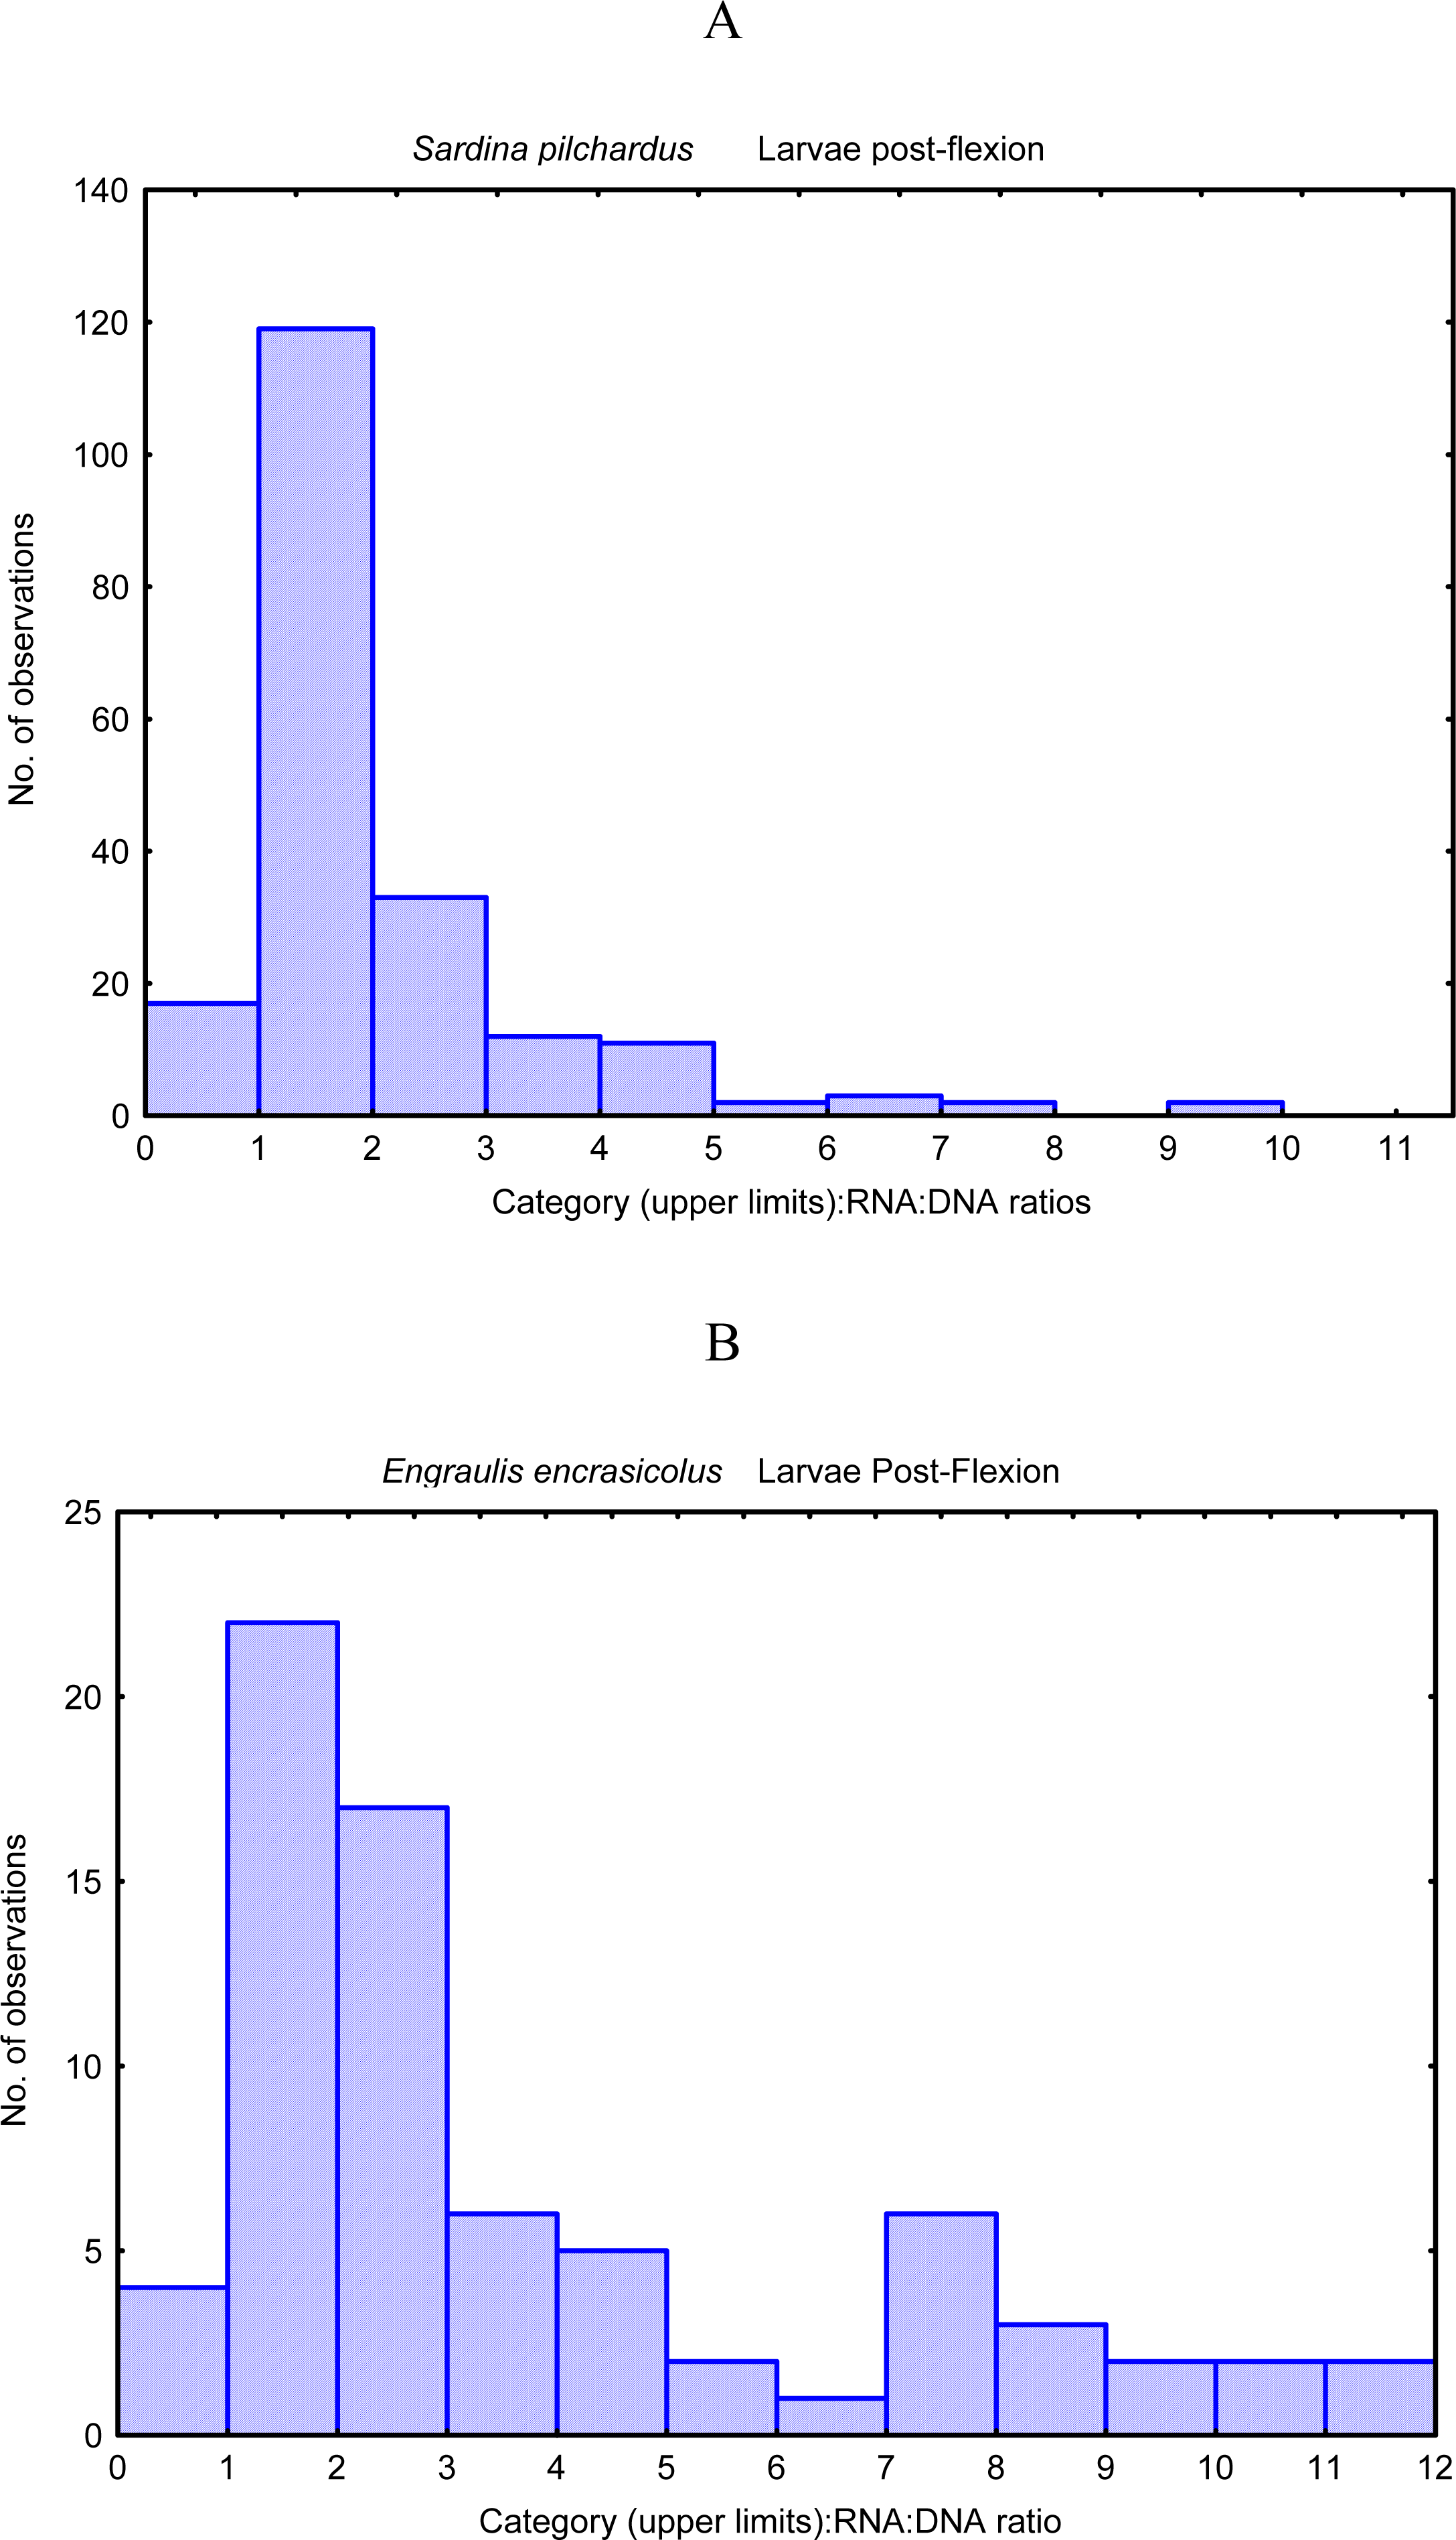
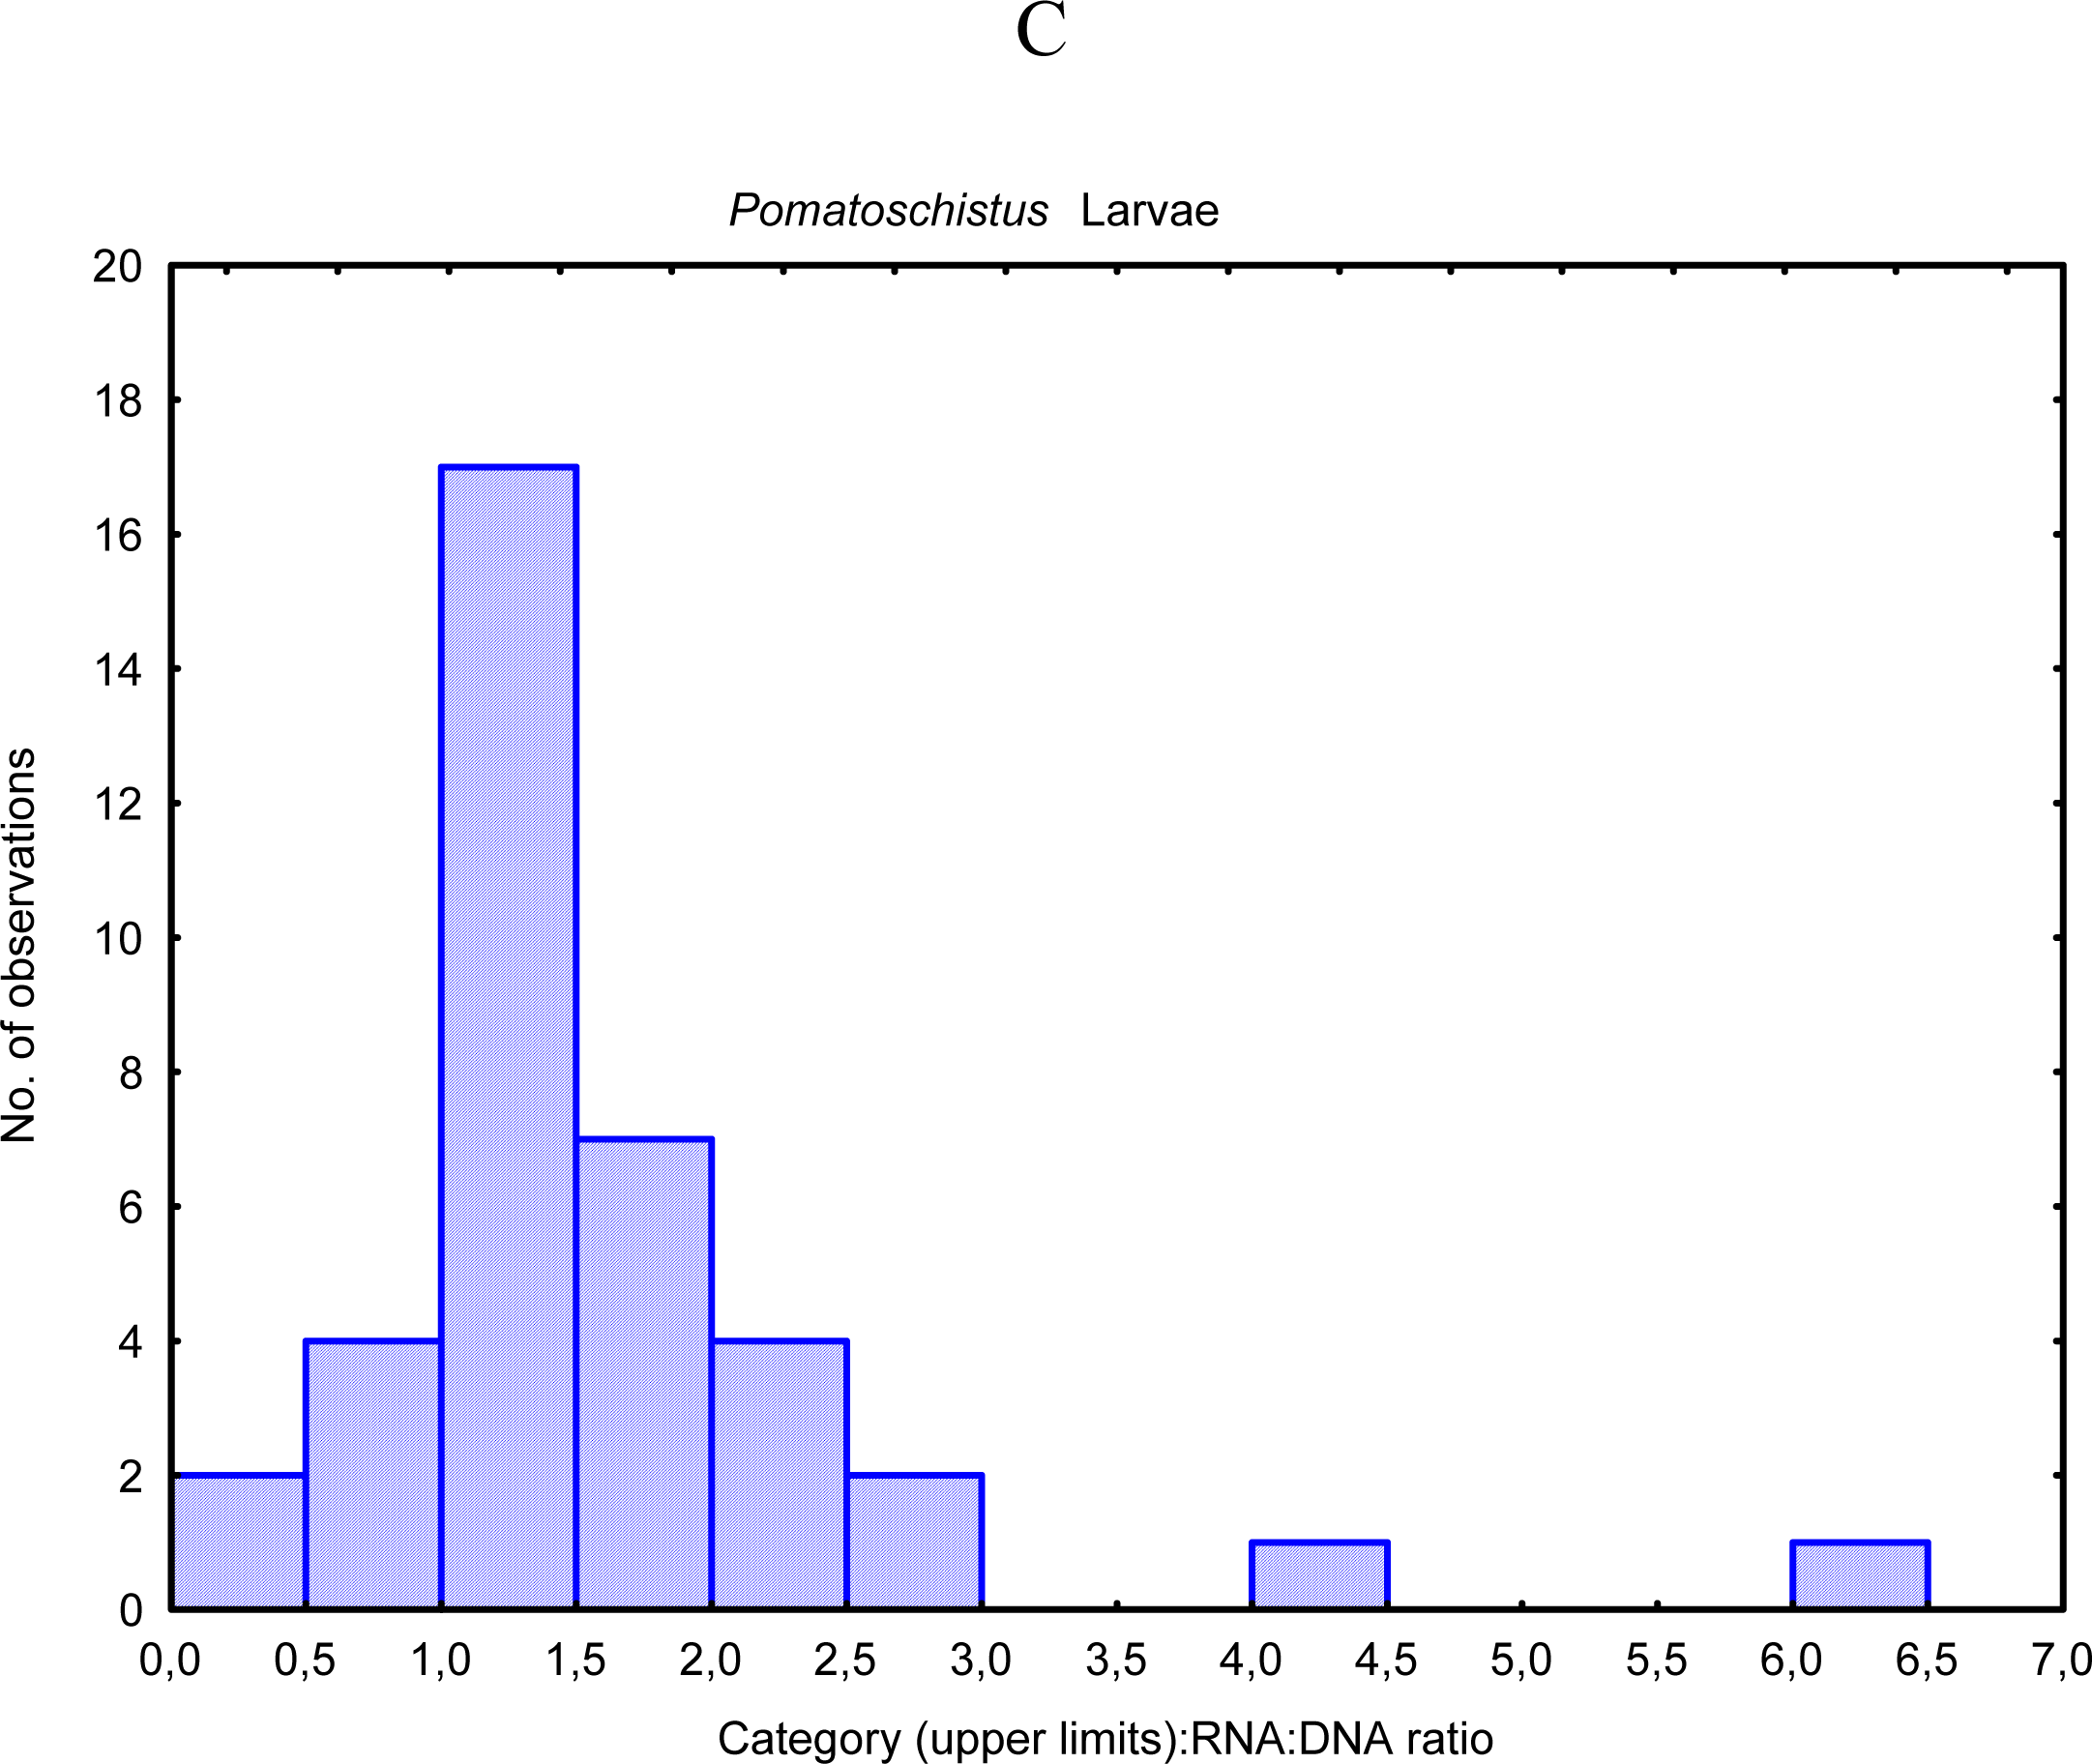
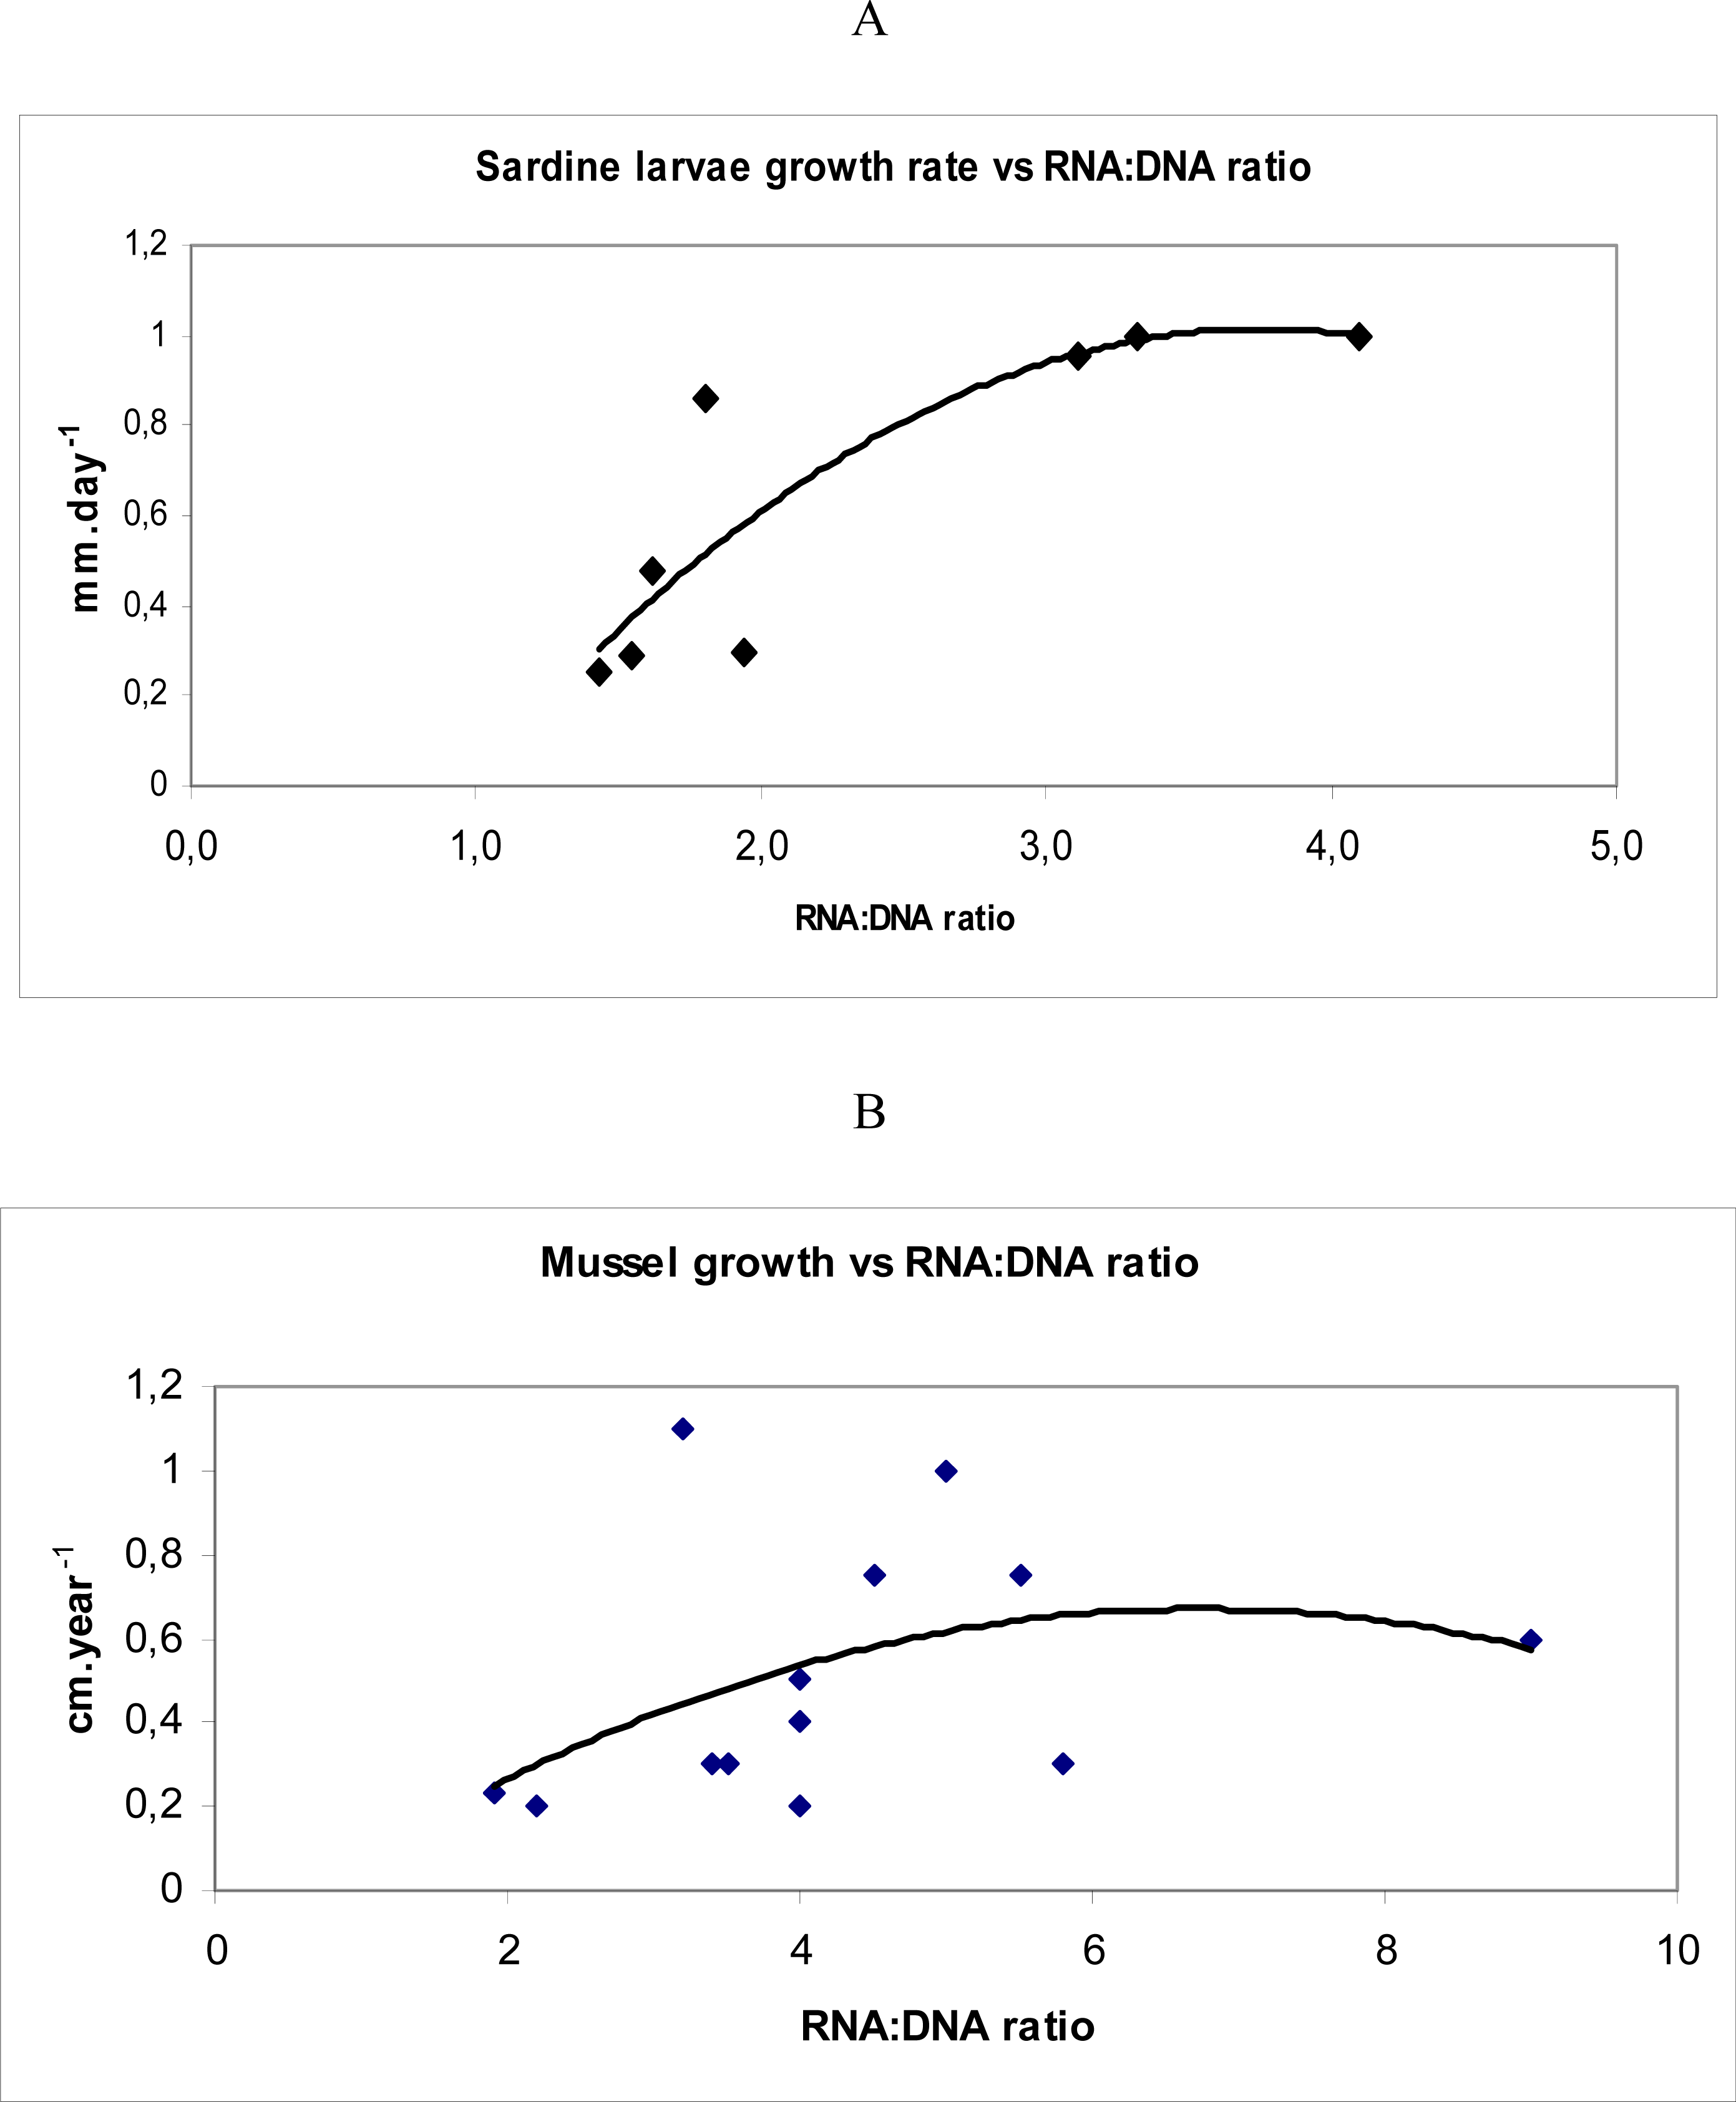
2.2. Population indicators: growth rate, starvation incidence and fisheries impact
2.3. Community level: trophic interactions, biomass, prey identification and exergy indices
3. Conclusions
Acknowledgments
References
- Dahlhoff, EP. Biochemical indicators of stress and metabolism: Applications for Marine Ecological Studies. Annu. Rev. Physiol 2004, 66, 183–207. [Google Scholar]
- Bergeron, JP. Nucleic acids in ichthyoplankton ecology: A review, with emphasis on recent advances for new perspectives. J. Fish Biol 1997, 51, 284–302. [Google Scholar]
- Nejstgaard, JC; Frischer, ME; Raule, CL; Gruebel, R; Kohlberg, KE; Verity, PG. Molecular detection of algal prey in copepod guts and fecal pellets. Limnol. Oceanogr. Methods 2003, 1, 29–38. [Google Scholar]
- Berdalet, E; Roldan, C; Olivar, MP; Lysnes, K. Quantifying RNA and DNA in planktonic organisms with SYBR Green II and nucleases Part A. Optimisation of the assay. Sci. Mar 2005, 69, 1–16. [Google Scholar]
- Holm-Hansen, O; Sutcliffe, WH, Jr; Sharp, J. Measurement of the deoxyribonucleic acid in the ocean and its ecological significance. Limnol. Oceanogr 1968, 13, 507–514. [Google Scholar]
- Bulow, JF. RNA-DNA ratios as indicators of recent growth rates of fish. J. Fish. Res. Bd. Canada 1970, 27, 2343–2349. [Google Scholar]
- Bulow, JF. RNA-DNA ratios as indicators of growth rates in fish: A review. In The age and growth of fish; Summerfelt, RC, Hall, GE, Eds.; The Iowa State University Press: Ames, Iowa, 1987; pp. 45–64. [Google Scholar]
- Clemmesen, C. The effect of food availability, age or size on the RNA:DNA of individually measured herring larvae: Laboratory calibration. Mar. Biol 1994, 118, 377–382. [Google Scholar]
- Chícharo, MA; Chícharo, L; López-Jamar, E; Valdes, L; Ré, P. Estimation of starvation and diel variation of the RNA/DNA ratios of field caught Sardina pilchardus larvae off north of Spain. Mar. Ecol. Prog. Ser 1998, 164, 273–283. [Google Scholar]
- Berdalet, E; Roldan, C; Olivar, MP. Quantifying RNA and DNA in planktonic organisms with SYBR Green II and nucleases Part B. Quantification in natural samples. Sci. Mar 2005, 69, 17–30. [Google Scholar]
- Dortch, Q; Roberts, TL; Clayton, JR, Jr; Ahmed, SI. RNA/DNA ratios and DNA concentrations as indicators of growth rate and biomass in planktonic organisms. Mar. Ecol. Prog. Ser 1983, 13, 61–71. [Google Scholar]
- Buckley, L. RNA:DNA ratio: an index of larval fish growth in the sea. Mar. Biol 1984, 80, 291–298. [Google Scholar]
- Wagner, M; Durbin, E; Buckley, L. RNA:DNA ratios as indicators of nutritional condition in the copepod Calanus finmarchicus. Mar. Ecol. Prog. Ser 1998, 162, 173–181. [Google Scholar]
- Chícharo, L; Chícharo, MA; Alves, F; Amaral, A; Pereira, A; Regala, J. Diel variation of the RNA:DNA ratios in Crassostrea angulata (Lamarck) and Ruditapes decussatus (Linnaeus 1758) (Mollusca, Bivalvia). J. Exp. Mar. Biol. Ecol 2001, 259, 121–129. [Google Scholar]
- Garcia, A; Cortes, D; Ramirez, T; Giradez, A; Carpena, A. Contribution of larval growth rate variability to the recruitment of the Bay of Malaga anchovy (SW Mediterranean) during the 2000–2001 spawning seasons. Sci. Mar 2003, 67, 477–490. [Google Scholar]
- Garcia, A; Cortes, D; Ramirez, T; Guisande, C; Quintanilla, J; Alemany, F; Rodriguez, JM; Alvarez, JP; Carperna, A. Field comparison of sardine post-flexion larval growth and biochemical composition from three sites in the W Mediterranean (Ebro River coast, Bays of Almeria and Malaga). Sci. Mar 2006, 70, 79–91. [Google Scholar]
- Pepin, P. Predation and starvation of larval fish: A numeric experiment of size and growth dependent survival. Biol. Oceanogr 1989, 6, 23–44. [Google Scholar]
- Pepin, P; Evans, GT; Shears, TH. Patterns of RNA/DNA ratios in larval fish and their relationship to survival in the field. ICES J. Mar. Sci 1999, 56, 697–706. [Google Scholar]
- Robinson, SM; Ware, D. Ontogenetic development of growth rates in larval Pacific herring, Clupea harengus pallasi, measured with RNA/DNA ratios in the Strait of Georgia, British Columbia. Can. J. Fish. Aquat. Sci 1988, 45, 1422–1429. [Google Scholar]
- Dagg, MJ; Littlepage, JL. Relationships between growth rate and RNA, DNA, protein and dry weight in Artemia salina and Euchaeta elongata. Mar. Biol 1972, 17, 162–170. [Google Scholar]
- Lucas, A; Beninger, PG. The use of physiological condition indices in marine bivalve aquaculture. Aquaculture 1985, 44, 187–200. [Google Scholar]
- Buckley, LJ; Caldarone, E; Ong, TL. RNA-DNA ratio and other nucleic acid-based indicators for growth and condition of marine fishes. Hydrobiology 1999, 401, 265–277. [Google Scholar]
- Sutcliffe, WH, Jr. Growth estimates from ribonucleic acid content in some small organisms. Limnol. Oceanogr 1965, 10(Suppl), R253–R258. [Google Scholar]
- Ikeda, T; San, F; Yamaguchi, A; Matsuishi, T. RNA:DNA ratios of calanoid copepods from the epipelagic through abyssopelagic zones of the North Pacific Ocean. Aquatic Biol 2007, 1, 99–108. [Google Scholar]
- Caldarone, EM; Onge-Burns, JM; St Buckley, LJ. Relationship of RNA/DNA ratio and temperature to growth in larvae of Atlantic cod, Gadus morhua. Mar. Ecol. Prog. Ser 2003, 262, 229–421. [Google Scholar]
- Thorpe, JE; Talbot, C; Villarreal, C. Bimodality of growth and smolting in Atlantic salmon, Salmo salar L. Aquaculture 1982, 28, 123–132. [Google Scholar]
- Grémare, A; Vétion, G. Comparison of several spectrofluorometric methods for measuring RNA and DNA concentrations in the deposit-feeding bivalve Abra ovata. Comp. Biochem. Physiol 1994, 107B, 297–308. [Google Scholar]
- Chícharo, L; Chícharo, MA. The RNA:DNA ratio as useful indicator of the nutritional condition in juveniles of Ruditapes decussatus. Sci. Mar 1995, 59(Supl. 1), 95–101. [Google Scholar]
- Clarke, A; Rodhouse, PG; Holmes, LJ; Pascoe, PL. Growth rate and nucleic acid ratio in cultured cuttlefish, Sepia officinalis (Mollusca: Cephalopda). J. Exp. Mar. Biol. Ecol 1989, 133, 229–240. [Google Scholar]
- Sykes, A; Domingues, P; Andrade, JP. Nucleic acid derived indices or instantaneous growth rate as tools to determine different nutritional condition in cuttlefish (Sepia officinalis, Linnaeus 1758) hatchlings. J. Shell. Res 2004, 23, 585–591. [Google Scholar]
- Chícharo, MA; Chícharo, L; Amaral, A; Morais, P. Sex effect on ratios and concentrations of DNA and RNA three in marine organisms. Mar. Ecol. Prog. Ser 2007, 332, 241–245. [Google Scholar]
- Lemos, D; Garcia-Carren, FL; Hernandez, P; Toro, AN. Ontogenetic variation in digestive proteinase activity, RNA and DNA content of larval and postlarval white shrimp Litopenaeus schmitti. Aquaculture 2002, 214, 363–380. [Google Scholar]
- Caldarone, EM; Clemmesen, MC; Berdalet, E; Miller, TJ; Folkvord, A; Holt, GJ; Olivar, MP; Suthers, IM. Intercalibration of four spectrofluorometric protocols for measuring RNA:DNA ratios in larval and juvenile fish Limnol. Oceanogr.: Methods 2006, 4, 153–163. [Google Scholar]
- Rooker, JR; Holt, GJ. Application of RNA-DNA ratios to evaluate the condition and growth of larvae and juvenile red drum. Sciaenops ocellatus. Mar. Freshwat. Res 1996, 4782, 283–290. [Google Scholar]
- Suthers, IM. Spatial variability of recent otolith growth and RNA indices in pelayic juvenile Diaphus kapalae (hlyctophidae): An effect of flow disturbance near an Island? Mar. Freshwat. Res 1996, 4, 237–283. [Google Scholar]
- Houlihan, D; Waring, CP; Mathers, E; Cray, C. Protein synthesis and oxygen consumption of the shore crab Carcinus maenas after a meal. Physiol. Zool 1990, 63, 735–756. [Google Scholar]
- Houlihan, DF; Hall, SJ; Gray, C; Noble, BS. Growth rates and protein turnover in Atlantic cod, Gadus morhua. Can. J. Fish Aquat. Sci 1988, 45, 951–964. [Google Scholar]
- Bergeron, JP. Effect of strong winds on the nutritional condition of anchovy (Engraulis encrasicolus L.) larvae in the Bay of Biscay, Northeast Atlantic, as inferred from an early field application of the DNA/C index. ICES J. Mar. Sci 2000, 57, 249–255. [Google Scholar]
- Hovenkamp, F. Growth differences in larval plaice Pleuronectes platessa in the southern Bight of the North Sea as indicated by otolith increments and RNA-DNA ratios. Mar. Ecol. Prog. Ser 1990, 58, 205–215. [Google Scholar]
- Peterson, I; Wroblewski, JS. Mortality rates of fish in the pelagic ecosystem. Can. J. Fish Aquat. Sci 1984, 41, 1117–1120. [Google Scholar]
- Chícharo, MA. Nutritional condition and starvation in field caught Sardina pilchardus larvae from southern Portugal compared with some environmental factors. J. Exp. Mar. Biol. Ecol 1998, 225, 123–137. [Google Scholar]
- Malzahn, AM; Clemmesen, C; Rosenthal, H. Temperature effects on growth and nucleic acids in laboratory-reared larval coregonid fish. Mar. Ecol. Prog. Ser 2003, 259, 285–293. [Google Scholar]
- Díaz, E; Txurruka, JM; Villate, F. Biochemical composition and condition in anchovy larvae Engraulis encrasicolus during growth. Mar. Ecol. Prog. Ser 2008, 361, 227–238. [Google Scholar]
- Fonseca, V; Vinagre, FC; Cabral, HN. Growth variability of juvenile soles Solea solea and Solea senegalensis, and comparison with RNA:DNA ratios in the Tagus estuary, Portugal. J. Fish Biol 2006, 68, 1551–1562. [Google Scholar]
- Vinagre, C; Fonseca, V; Cabral, HN. Habitat specific growth rates and condition indices for the sympatric soles Solea solea (Linnaeus, 1758) and Solea senegalensis (Kaup 1858), in the Tagus estuary, Portugal, based on otolith daily increments and RNA-DNA ratio. J. Appl. Ichthyol. 2008, 24, 163–169. [Google Scholar]
- Chícharo, L; Faria, A; Amaral, A; Morais, P; Mendes, JC; Chicharo, MA. Comparisons between catches from ichthyoplankton net and light traps in temperate coastal ecosystems. Sci. Mar. in press..
- Buckley, LJ; Bulow, FJ. Techniques for estimation of RNA, DNA, and protein in fish. In Age and Growth of Fish; Summerfelt, RC, Hall, GE, Eds.; Iowa State University Press: Ames, IA, 1987; pp. 345–354. [Google Scholar]
- Mathers, EM; Houlihan, DF; Burren, LJ. RNA, DNA and protein concentrations in fed and starved herring Clupea harengus larvae. Mar. Ecol. Prog. Ser 1994, 107, 223–231. [Google Scholar]
- Saiz, E; Calbet, A; Fara, A; Berdalet, E. RNA content of copepods as a tool for determining adult growth rates in the field. Limnol. Oceanogr 1998, 43, 465–470. [Google Scholar]
- Loughna, PT; Goldspink, G. The effects of starvation upon protein turnover in red and white myotomal muscle of rainbow trout, Salmo gairdneri Richardson. J. Fish Biol 1984, 25, 223–230. [Google Scholar]
- Blaxter, JHS. Reared and wild fish-how do they compare? 10th European Symposium on Marine Biology, Ostend, Belgium, Sep. 17–23, 1979 1, 11–12.
- Chícharo, MA. Starvation percentages in field caught Sardina pilchardus larvae off southern Portugal. Sci. Mar 1997, 61, 507–516. [Google Scholar]
- Chicharo, MA; Amaral, A; Condinho, S; Alves, F; Regala, J; Gaspar, M; Chicharo, L. Adenylic-derived indices and reburying time as indicators of the effects of dredging-induced stress on the clam Spisula solida. Mar. Biol 2003a, 142, 1113–1117. [Google Scholar]
- Morton, B. The Subsidiary Impacts of Dredging (and Trawling) on a Subtidal Benthic Molluscan Community in the Southern Waters of Hong Kong. Mar. Pollut. Bull 1996, 32, 701–710. [Google Scholar]
- Coll, M; Bahamon, NF; Sardà, F; Palomera, I; Tudela, S; Suuronen, P. Improved trawl selectivity: Effects on the ecosystem in the South Catalan Sea (NW Mediterranean). Mar. Ecol. Prog. Ser 2008, 355, 131–147. [Google Scholar]
- Chicharo, MA; Chicharo, L; Amaral, A; Condinho, S; Gaspar, M. Chronic effects of dredging-induced stress on the clam (Spisula solida): Nucleic acid and lipid composition. Fish. Res 2003b, 63, 447–452. [Google Scholar]
- Oksane, L; Fretwell, SD; Arruda, J; Niemela, P. Exploitation ecosystems in gradients of primary productivity. Am. Nat 1981, 118, 240–261. [Google Scholar]
- Menge, BA; Olson, AM; Dahlhoff, EP. Environmental stress, bottom-up effects, and community dynamics: Integrating molecular-physiological and ecological approaches. Integr. Comp. Biol 2002, 42, 892–908. [Google Scholar]
- Banse, K. Zooplankton: Pivotal role in the control of ocean production. ICES J. Mar. Sci 1995, 52, 3–4. [Google Scholar]
- Cushing, DH. Plankton production and year-class strength in fish populations: An update of the match/mismatch hypothesis. Adv. Mar. Biol 1990, 26, 249–293. [Google Scholar]
- Symondson, WOC. Molecular identification of prey in predator diets. Mol. Ecol 2002, 11, 627–641. [Google Scholar]
- Jørgensen, SE; Patten, BC; Straskraba, M. Ecosystem emerging IV: growth. Ecol. Model 2000, 126, 249–284. [Google Scholar]
- Fonseca, JC; Marques, JC; Paiva, AA; Freitas, AM; Madeira, VMC; Jørgensen, SE. Nuclear DNA in the determination of weighing factors to estimate exergy from organisms biomass. Ecol. Model 2000, 126, 179–189. [Google Scholar]
- Marques, JC; Pardal, MA; Nielsen, SN; Jørgensen, SE. Analysis of the properties of exergy and biodiversity along an estuarine gradient of eutrophication. Ecol. Model 1997, 102, 155–168. [Google Scholar]
- Clemmesen, C. Laboratory studies on RNA/DNA ratios of starved and fed herring (Clupea harengus) and turbot (Scophthalmus maximus) larvae. J. Cons. Int. Explor. Mer 1987, 43, 122–128. [Google Scholar]


| Two way ANOVA | df effectA | MS effectB | Df error | F | p |
|---|---|---|---|---|---|
| 1 | 1 | 35.076 | 99 | 4.42 | 0.03 |
| 2 | 1 | 79.952 | 99 | 10.09 | 0.001 |
© 2008 by the authors; licensee Molecular Diversity Preservation International, Basel, Switzerland. This article is an open-access article distributed under the terms and conditions of the Creative Commons Attribution license ( http://creativecommons.org/licenses/by/3.0/). This article is an open-access article distributed under the terms and conditions of the Creative Commons Attribution license ( http://creativecommons.org/licenses/by/3.0/).
Share and Cite
Chícharo, M.A.; Chícharo, L. RNA:DNA Ratio and Other Nucleic Acid Derived Indices in Marine Ecology. Int. J. Mol. Sci. 2008, 9, 1453-1471. https://0-doi-org.brum.beds.ac.uk/10.3390/ijms9081453
Chícharo MA, Chícharo L. RNA:DNA Ratio and Other Nucleic Acid Derived Indices in Marine Ecology. International Journal of Molecular Sciences. 2008; 9(8):1453-1471. https://0-doi-org.brum.beds.ac.uk/10.3390/ijms9081453
Chicago/Turabian StyleChícharo, Maria Alexandra, and Luis Chícharo. 2008. "RNA:DNA Ratio and Other Nucleic Acid Derived Indices in Marine Ecology" International Journal of Molecular Sciences 9, no. 8: 1453-1471. https://0-doi-org.brum.beds.ac.uk/10.3390/ijms9081453