
Full-Length SMRT Transcriptome Sequencing and SSR Analysis of Bactrocera dorsalis (Hendel)


Guangxi Key Laboratory of Agric-Environment and Agric-Products Safety, College of Agriculture, Guangxi University, Nanning 530004, China
*
Author to whom correspondence should be addressed.
Insects 2021, 12(10), 938; https://0-doi-org.brum.beds.ac.uk/10.3390/insects12100938
Submission received: 6 September 2021
/
Revised: 7 October 2021
/
Accepted: 8 October 2021
/
Published: 14 October 2021
(This article belongs to the Section Insect Molecular Biology and Genomics)
Abstract
:Simple Summary
In this study, a full-length transcriptome was analyzed with single-molecule real-time (SMRT) sequencing, which was first used to discover simple sequence repeat (SSR) genetic markers from B. dorsalis. Moreover, SSR markers from isoforms were screened for the identification of species diversity. These results could provide molecular biology methods for further population research.
Abstract
Bactrocera dorsalis (Hendel), as one of the most notorious and destructive invasive agricultural pests in the world, causes damage to over 250 different types of fruits and vegetables throughout tropical and subtropical areas. PacBio single-molecule real-time (SMRT) sequencing was used to generate the full-length transcriptome data of B. dorsalis. A total of 40,319,890 subreads (76.6 Gb, clean reads) were generated, including 535,241 circular consensus sequences (CCSs) and 386,916 full-length non-concatemer reads (FLNCs). Transcript cluster analysis of the FLNC reads revealed 22,780 high-quality reads (HQs). In total, 12,274 transcripts were functionally annotated based on four different databases. A total of 1978 SSR loci were distributed throughout 1714 HQ transcripts, of which 1926 were complete SSRs and 52 were complex SSRs. Among the total SSR loci, 2–3 nucleotide repeats were dominant, occupying 83.62%, of which di- and tri- nucleotide repeats were 39.38% and 44.24%, respectively. We detected 105 repeat motifs, of which AT/AT (50.19%), AC/GT (39.15%), CAA/TTG (32.46%), and ACA/TGT (10.86%) were the most common in di- and tri-nucleotide repeats. The repeat SSR motifs were 12–190 bp in length, and 1638 (88.02%) were shorter than 20 bp. According to the randomly selected microsatellite sequence, 80 pairs of primers were designed, and 174 individuals were randomly amplified by PCR using primers. The number of primers that had amplification products with clear bands and showed good polymorphism came to 41, indicating that this was a feasible way to explore SSR markers from the transcriptomic data of B. dorsalis. These results lay a foundation for developing highly polymorphic microsatellites for researching the functional genomics, population genetic structure, and genetic diversity of B. dorsalis.
1. Introduction
Bactrocera dorsalis (Hendel) (Diptera: Tephritidae), known as the oriental fruit fly, is one of the most devastating and highly invasive agricultural pests in the world, causing severe damage to over 250 species of commercial fruits and vegetables [1,2,3,4,5]. The broad range of distribution, the large number of host plants, and the complex interactions between B. dorsalis and diverse environments may be due to its high genetic variation, which makes it challenging to manage this pest. China’s Guangxi Zhuang Autonomous Region is an excellent vegetable- and fruit-growing region because of its superior natural geographical conditions. Moreover, Guangxi is located in the south of China, which makes B. dorsalis a serious pest with invasive problems and domestic outbreaks.
Simple sequence repeats (SSRs), also known as microsatellites or short tandem repeats (STRs), are tandem repeats of 1–6 nucleotides. SSR markers commonly present high levels of intra- and inter-specific variations. Because of their characteristics of assay technique, reproducibility, multi-allelic nature, codominant inheritance, abundance, and genome-wide coverage, they have been extensively applied to genetic diversity, genetic structure analysis, and paternity testing in arthropods [6,7,8,9]. In recent years, the thysanopteran insect Frankliniella occidentalis [10,11], coleopteran insects Caleruca daurica [12] and Eucryptorrhynchus chinensis [13], the orthopteran insect Locusta migratoria [14], hemipteran insects Stephanitis nashi and Sclomina erinacea [15], and dipteran insects including Bactrocera tryoni [16], Glossina palpalis [17,18], Anopheles sinensis [19], Ceratitis capitata [20], and Aedes aegypti [21] have been analyzed using SSRs. There have been 28,201 insect microsatellite sequences included in the National Center for Biotechnology Information (NCBI), of which 8539 belong to Order Diptera and 1670 are in Tephritidae. Existing genetic resources for B. dorsalis are scarce. Only 81 entries were found in the public database (NCBI 2020) under “Bactrocera dorsalis” as of 21 July 2020 (http://0-www-ncbi-nlm-nih-gov.brum.beds.ac.uk/, accessed on 1 July 2020). The known number of microsatellite markers for B. dorsalis population is still relatively low, which poses a barrier to explaining the genetic characteristics of the B. dorsalis population. Therefore, the development of more microsatellites that are suitable for B. dorsalis population remains to be solved. The origin of the SSR causes it to be classified as genomic-SSR (G-SSR) or expressed sequence tag-SSR (EST-SSR), which indicates whether the SSR is either in a noncoding region or a translated region [22]. In terms of SSR site development, shallow genome sequencing is more efficient than transcriptome sequencing [23], and genomic data may be mature and commonly employed in species with low polymorphism, and they can comprehensively reflect variations in a species’ DNA in coding and noncoding regions. SSR loci derived from the whole genome are generally polymorphic [24,25]; however, many species could not be sequenced at the genome level because of the high expenses. Thus, the low cost has made the development of SSRs based on RNA-seq data a mature and commonly employed method [26,27,28]. Moreover, transcriptome data may result in longer loci that are more amenable to design primers, and the primers may be more transferable to related species [23].
There is a novel third-generation sequencing technology (TGS) called the single-molecule real-time (SMRT) sequencing technology, which could generate longer reads compared to second-generation sequencing (SGS) and could meet requirements for unsolved problems in genome, transcriptome, and epigenetics research [29,30]. In addition, third-generation sequencing technology has been superior in large datasets, long sequence reads, and full-length gene transcripts, and it does not require sequence splicing and assembly at the same time. These advantages can be used in exploring new genes and discovering new SSR sites [31]. However, this technology has not previously been used in B. dorsalis.
A full-length transcriptomic analysis of mixed B. dorsalis samples at four developmental stages by using SMRT sequencing was performed. Based on the constructed transcriptome database of B. dorsalis, the microsatellites were explored in high throughput, aiming to lay a foundation for developing extremely polymorphic microsatellite primers and studying the functional genomics, population genetic structure, and population genetic diversity of B. dorsalis.
2. Materials and Methods
2.1. Transcriptome Sample Preparation
B. dorsalis insects were reared at the Institute of Entomology at Guangxi University (Nanning, China). Eggs were collected using a plastic cup with banana pulp and placed on moist filter paper. Larvae were subjected to a banana diet, whereas adult flies were fed with an artificial diet made from yeast extract and sugar (4:1). All of the life stages were cultured in cages at 26 ± 2 °C and 65 ± 10% humidity under a 14 h light/10 h dark photoperiod. Mixed samples of B. dorsalis with different insect stages were used. For further experiments, all samples were frozen in liquid nitrogen and then stored at −80 °C.
2.2. RNA Extraction and SMRT Sequencing
Total RNA was extracted by grinding mixed samples of B. dorsalis in TRIzol reagent (Life Technologies, Carlsbad, CA, USA) on ice and processed according to the protocol provided by the manufacturer. The integrity of the RNA was determined with an Agilent 2100 bioanalyzer through agarose gel electrophoresis. The purity and concentration of the RNA were determined with a Nanodrop micro-spectrophotometer (Thermo Fisher, Waltham, MA, USA). The mRNA enriched using Oligo (dT) magnetic beads was reverse-transcribed into cDNA using a Clontech SMARTer PCR cDNA synthesis kit (NO634926). The optimal amplification cycle number for downstream large-scale PCR reactions was determined through PCR cycle optimization. The optimized cycle number was used to generate double-stranded cDNA. In addition, >5 kb size selection was performed with a BluePippinTM Size-Selection System, and this was mixed equally with the no-size-selection cDNA. Large-scale PCR was performed for SMRT bell library construction. cDNAs were DNA damage-repaired, end-repaired, and ligated to sequencing adapters. The SMRT bell template was annealed to a sequencing primer, bound to polymerase, and sequenced on a PacBio Sequel II platform by Gene De novo Biotechnology Co (Guangzhou, China). The raw sequencing reads of the cDNA libraries were classified and clustered into transcript consensus with the SMRT Link v5.0.1 pipeline [32] supported by Pacific Biosciences. Briefly, circular consensus sequence (CCS) reads were extracted from subread BAM files with a minimum complete pass of 1 and minimum read score of 0.65. The integrity of the transcripts was evaluated according to whether the CCS reads contained 5′ primer, 3′ primer, and poly-A structures. The sequences containing all three structures are called full-length sequences (FLs). Afterwards, primers, barcodes, and the poly-A tail trimming of complete passes were removed to produce full-length nonchimeric (FLNC) reads. Reads shorter than 50 bp were discarded. Subsequently, the entire isoform was generated by clustering the FLNC reads. A consistency sequence (rough consensus isoforms) was obtained by hierarchically clustering similar FLNC reads with minimap2. Then, the quiver algorithm was used to correct the consistency sequence. For improving the accuracy of PacBio reads, we used two strategies. First, we used non-full-length reads to polish the obtained cluster consensus isoforms with the Quiver software to produce FL, polished, high-quality consensus sequences (accuracy of ≥99%). Second, Illumina short reads were obtained from the same samples with the LoRDEC tool v0.8 [33] to further correct low-quality isoforms.
2.3. Functional Annotation and Structure Analysis
A reference genome (ncbi_GCF_000789215.1) sequence was used to measure the accuracy of the generated Iso-Seq reads. Then, we mapped the corrected high-quality consensus sequences to the reference genome with GMAP [34], and redundant transcripts were collapsed with a minimum identity of 95% and minimum coverage of 99%. We compared the finally obtained isoforms with the reference genome annotation and then classified them into three groups: known, novel, and new isoforms. The new isoforms were BLAST analyzed against the NCBI non-redundant protein (Nr) database (http://www.ncbi.nlm.nih.gov, accessed on 1 October 2019), Swiss-Port protein database (http://www.expasy.ch/sprot, accessed on 1 October 2019), and the Kyoto Encyclopedia of Genes and Genomes (KEGG) database (http://www.genome.jp/kegg, accessed on 1 October 2019) with the BLASTx program (http://0-www-ncbi-nlm-nih-gov.brum.beds.ac.uk/BLAST/, accessed on 1 October 2019) at an E-value threshold of 1e−5 for the evaluation of their sequence similarity with the genes of other species and investigation of their functions. Gene Ontology (GO) annotation was analyzed with the Blast2GO [35] software with the Nr annotation results of the isoforms. We selected the isoforms that were not shorter than 33 high-scoring segment pair hits to conduct the Blast2GO analysis and then used WEGO software to perform functional classification of isoforms [36].
Long-chain noncoding RNA (LncRNA) candidates were identified using CPC [37], a predictor of messenger RNAs based on the CNCI v2.0 [38]. LncRNA with >200 nucleotides was selected. ANGEL [39] was used to identify open reading frames (ORFs) in the full-length transcriptome of B. dorsalis. A previously described method was used to align all non-redundant HQ transcripts. Candidate (alternative splicing) AS events were identified using the SUPPA [40].
2.4. EST-SSR Detection and Primer Design
To identify microsatellites in the functional isoforms, we used the MicroSAtellite identification tool (MISA) v1.0 (http://pgrc.ipk-gatersleben.de/misa/, accessed on 1 October 2019). The SSR loci were identified based on the minimum number of repetitions of each unit size, which were 2–6, 3–5, 4–4, 5–4, and 6–4. In an interrupted composite microsatellite, the maximum number of bases for two SSRs was 100. EST-SSR primers were designed using Primer 3.0 (release 1.1.4). Mononucleotide repeats were not selected for subsequent trial analysis due to the possibility of mismatching during sequencing. The primer was designed with the following four principles. Firstly, the optimal primer length was 20 bp and could extend to 18–27 bp if needed; secondly, the optimal temperature was 60 °C and could extend to 57–63 °C; meanwhile, the difference in Tm values with upstream and downstream primers had to be less than 5 °C. Thirdly, the optimal GC content was 50% and could extend to 30–70%; fourthly, the PCR amplicon should have had a length of 100–300 bp [41].
2.5. Amplification and Validation of EST-SSRs
In the primer polymorphism verification experiments, nondenaturing polyacrylamide gel was used. In order to screen out primers with polymorphisms, the 80 primer pairs mentioned above were synthesized by the Shanghai Biological Engineering (Shanghai) Company. Polymerase chain reaction (PCR) was performed in a 10 μL reaction volume containing 5 µL of 2×Taq PCR MasterMix (TIANGEN Co., Ltd. Shanghai, China), configuring the PCR system according to the reagent instructions. The PCR system also included 1 μL of template DNA (Table 1), 0.5 μL of each primer (10 μmol/L), and 3 μL of ddH2O. PCR amplification was performed using the following temperature program in PCR Amplifier (T100TM Thermal Cycler, BIO-RAD, Hercules, CA, USA): melting at 94 °C for 3 min; 32 cycles of denaturation at 94 °C for 30 s, with an annealing temperature depending on the primer for 30 s, and extension at 72 °C for 30 s; extension at 72 °C for 5 min; preservation at 4 °C. We used 8% nondenaturing polyacrylamide gel to run the PCR amplification products on a vertical plate electrophoresis apparatus when selecting polymorphic primers.
3. Results
3.1. SMRT Sequencing
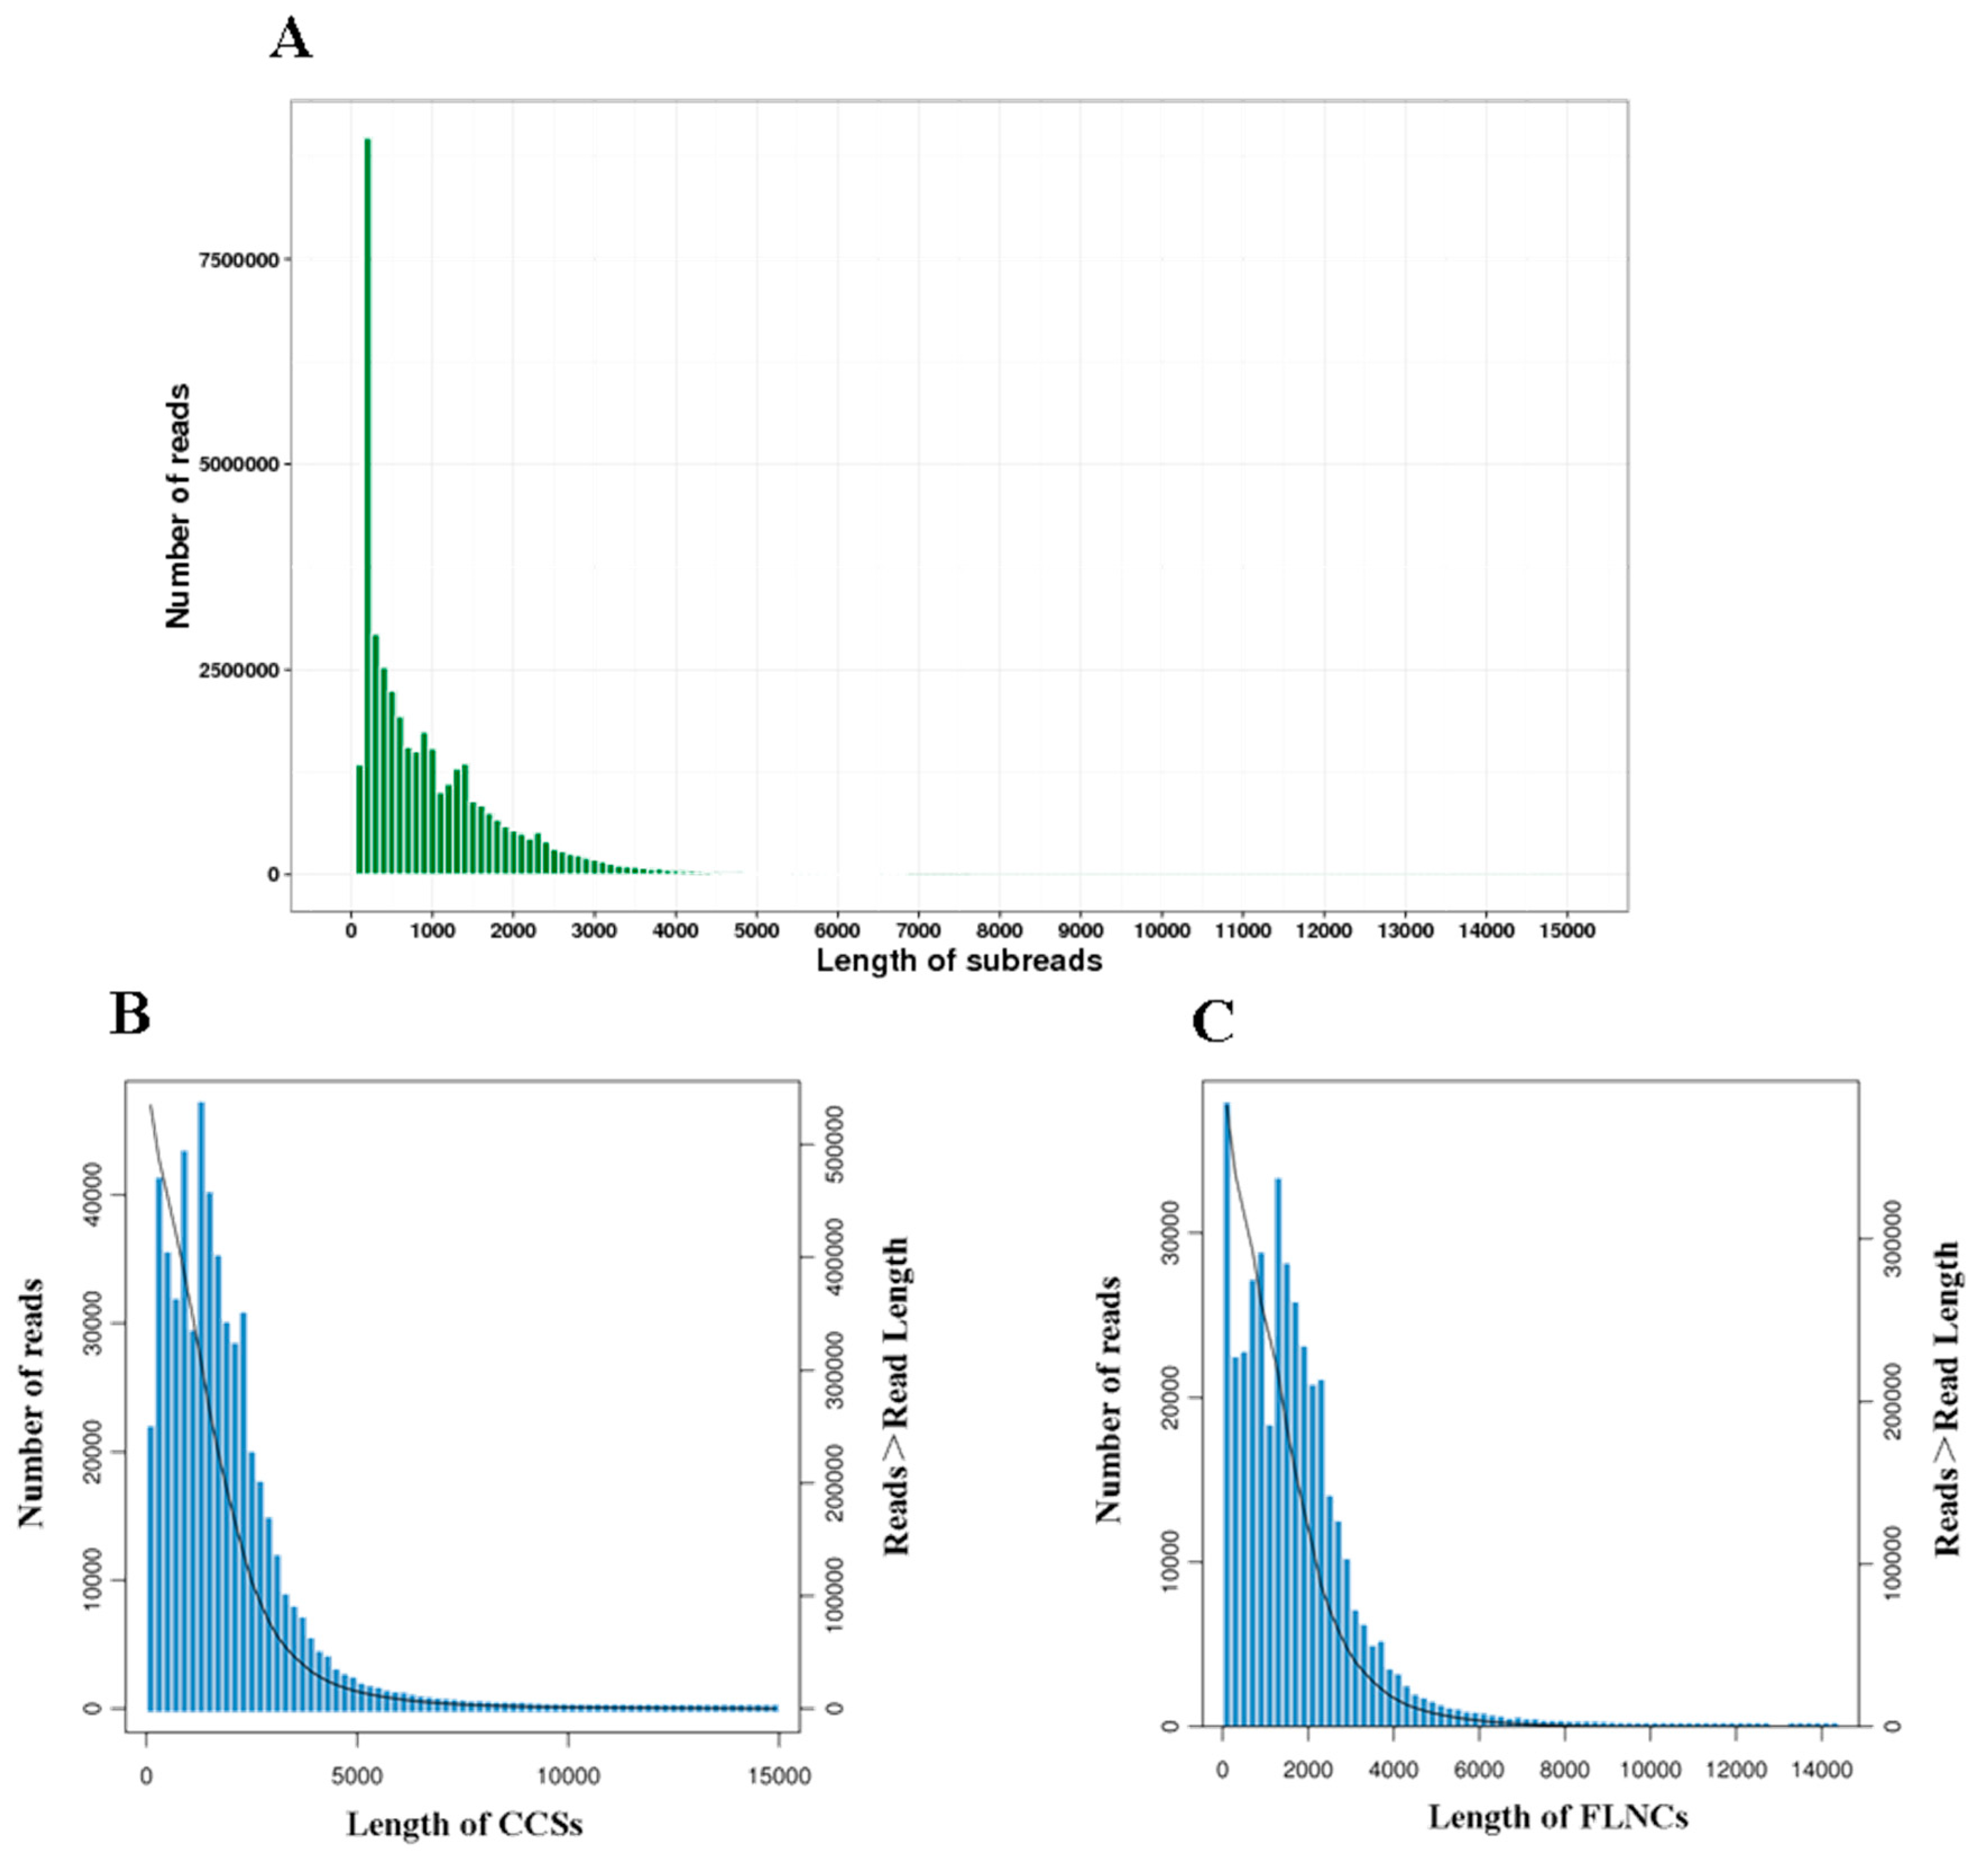
The PacBio Sequel system generated a total of 40,319,890 subreads with an average read length of 1009 bp. The N50 was 1659 bp. After self-correction and merging, 535,241 circular consensus sequences (CCSs) (Figure 1A) with a mean length of 1756 bp were formed. The subreads also generated 386,916 full-length non-chimeric sequences (FLNCs) (Figure 1B) with an average length of 1622 bp. A total of 22,780 high-quality (HQ) isoforms with ≥99% accuracy were obtained after clustering and removing redundant sequences (Figure 1C). These isoforms were identified and mapped to 12,274, corresponding to 5365 known isoforms and 5321 new isoforms that were not annotated previously (Table 2).
3.2. Functional Annotation
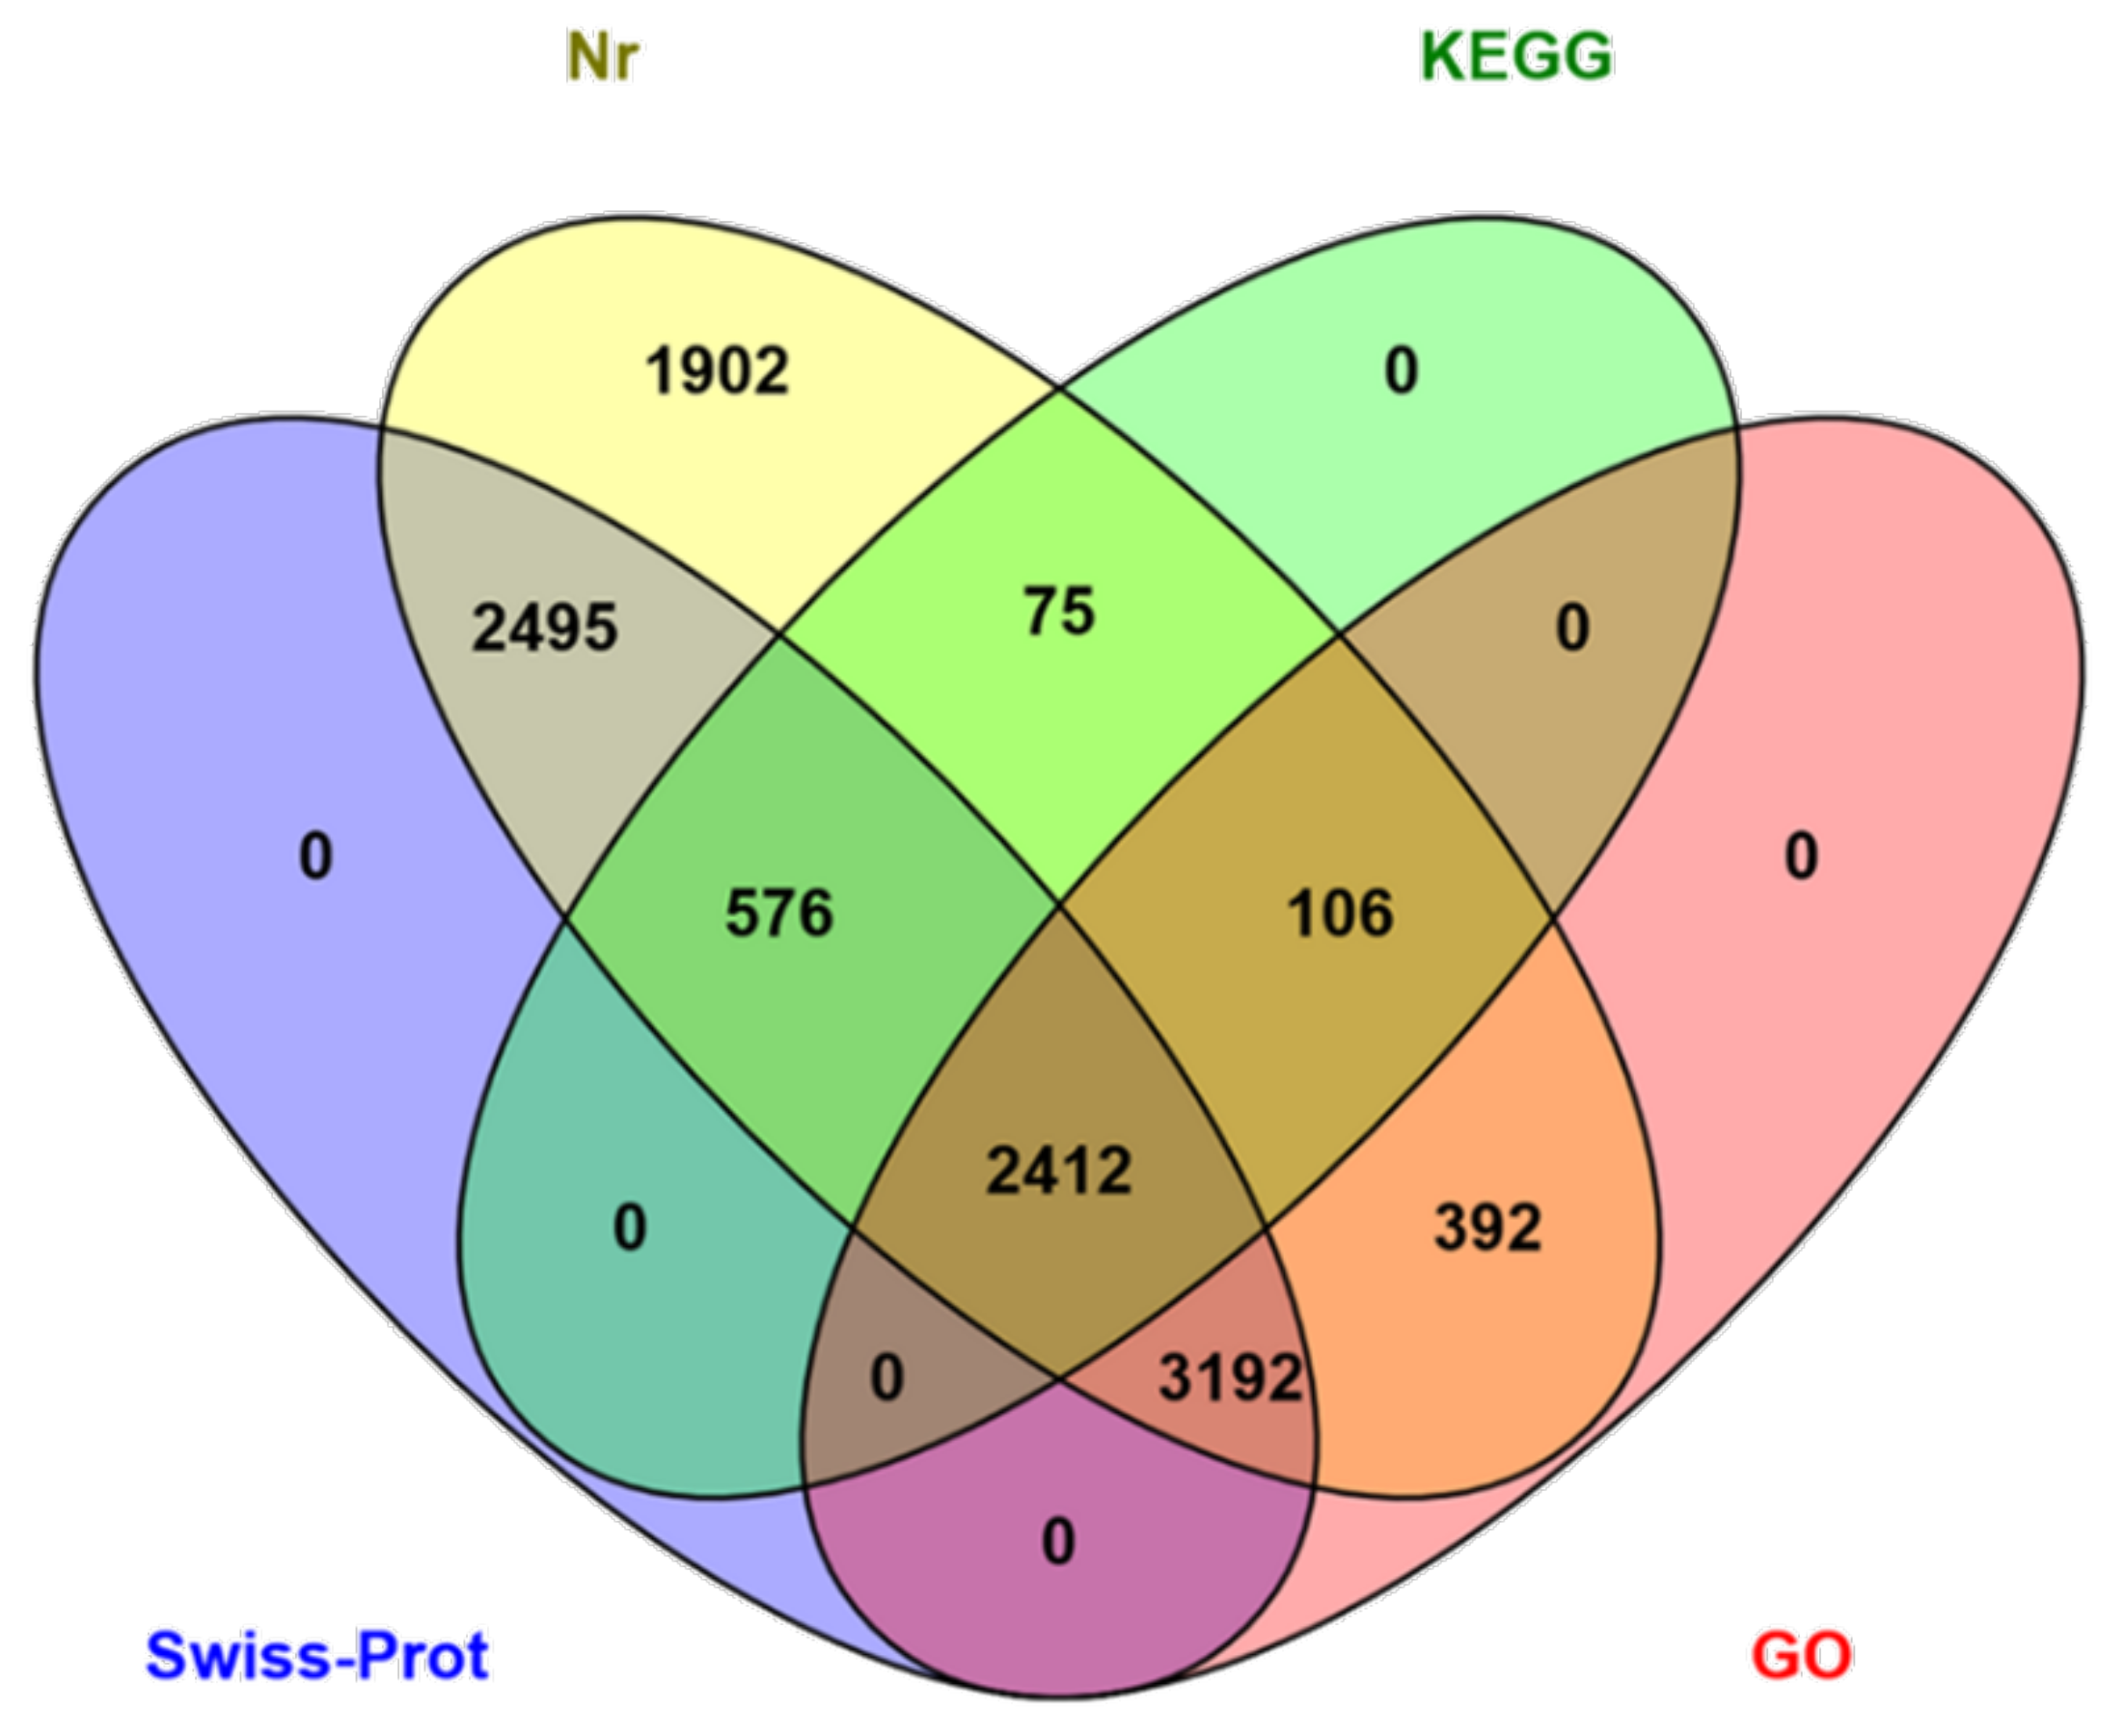
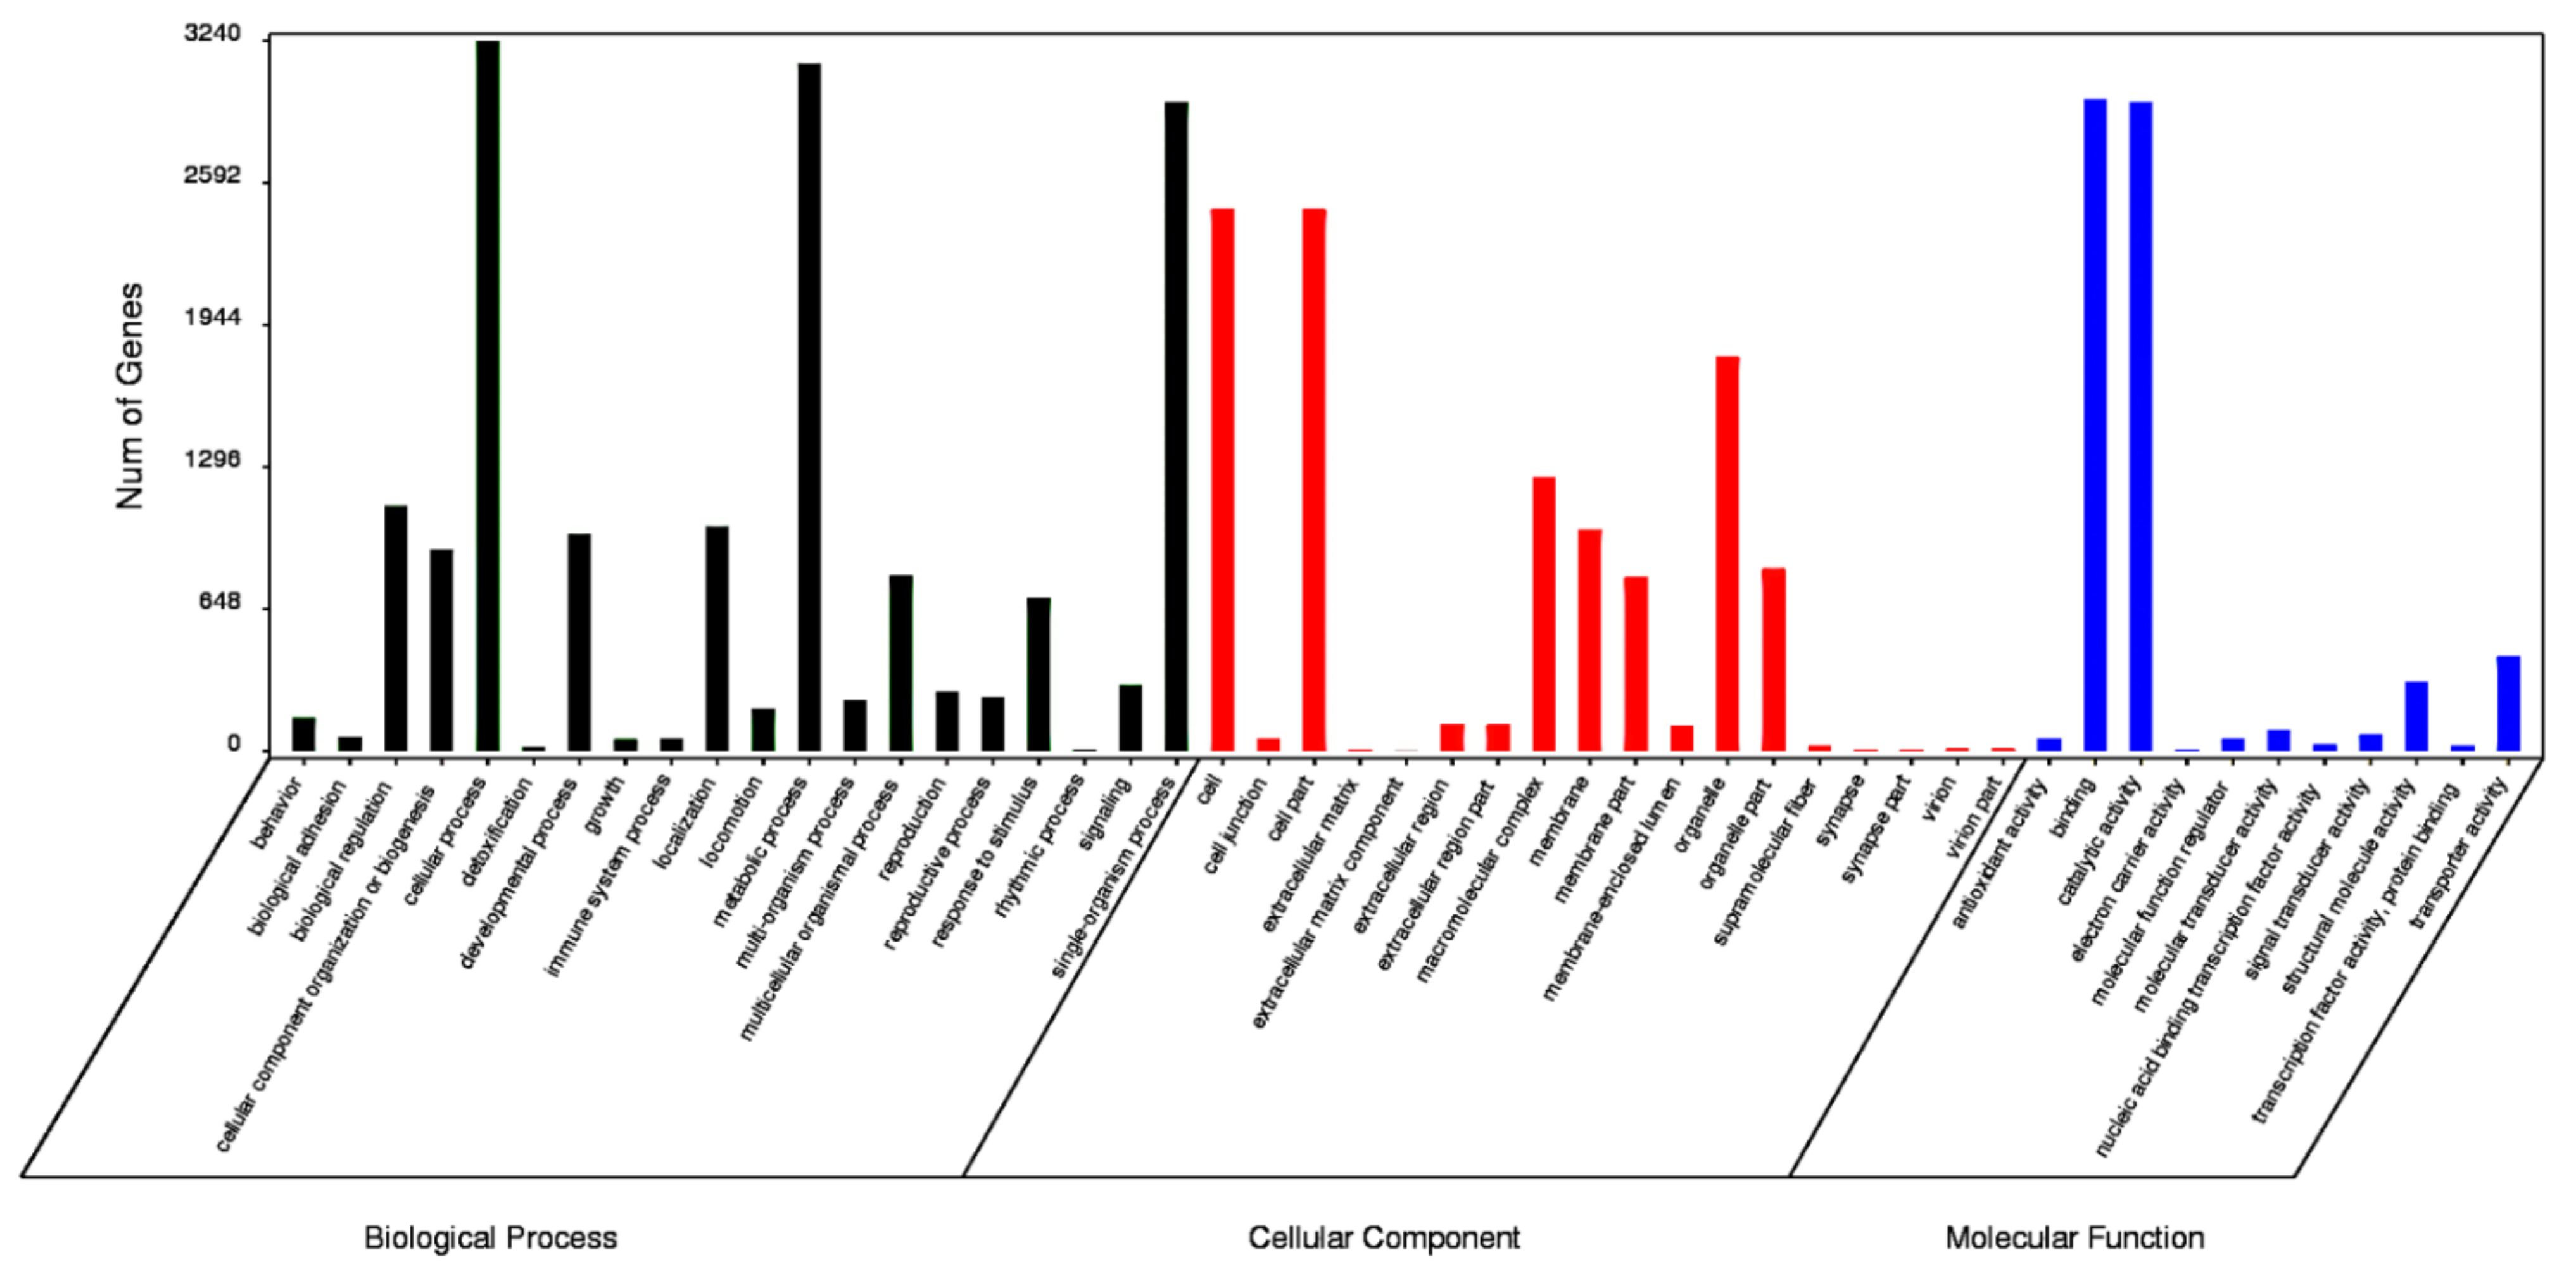
The functions of the HQ transcripts were annotated; then, the clusters of the Nr, Swiss-Port, GO, and KEGG annotations were used to elucidate the functions of the non-redundant isoforms. Of the 12,274 transcripts analyzed, 1124 could not be functionally annotated to any of the used databases, and 2412 were shared among the four databases (Figure 2). After that, all transcripts were aligned to the NCBI non-redundant protein database (Nr). With its comprehensive content and the inclusion of species information in the annotated results, the Nr database is a non-redundant protein database that can be used to classify homologous species. The results showed that 11,150 (90.84%) HQ transcripts were annotated using Nr and exhibited homology with known proteins of various species, including B. dorsalis (4663, 41.82%), B. cucurbitae (178, 1.60%), and C. capitata (164, 1.47%) (Table 3). Moreover, Bactrocera was the dominant genus by far, accounting for approximately half of all Nr annotation results. In total, 6102 (49.71%) isoforms were annotated into 49 sub-categories of the three main GO categories: biological processes (BPs), cellular components (CCs), and molecular functions (MFs) (Figure 3). Among them, 20 sub-categories, 18 sub-categories, and 11 sub-categories were annotated in BPs, CCs, and MFs. The top ten sub-categories were cellular processes (3240), metabolic processes (3138), binding (2972), catalytic activity (2962), single-organism processes (2961), cells (2472), cell parts (2472), organelles (1798), macromolecular complexes (1251), and biological regulation (1118). In addition, 3169 (25.82%) isoforms were identified in the Kyoto Encyclopedia of Genes and Genomes (KEGG) database and grouped into 162 KEGG pathways that were categorized into five broad categories: metabolism (1832, 57.81%), cellular processes (364, 11.49%), organismal systems (173, 5.46%), environmental information processing (276, 8.71%), and genetic information processing (1039, 32.79%) (Table 4). Among all of the sub-categories, ‘metabolic pathways’, ‘biosynthesis of secondary metabolites’, and ‘oxidative phosphorylation’ were the top three. Using Swiss-Port, 8,675 isoforms were annotated. Then, the CPC (http://cpc.cbi.pku.edu.cn/, accessed on 1 October 2019) and CNCI were used to predict the coding ability of the new genes and transcripts.
3.3. Predictive Analysis of SSRs
Among the 12,274 evaluated sequences, 1978 SSRs were identified from the 1714 SSR-containing sequences. The frequency of occurrence of SSRs was 13.96% (total number of HQ transcripts containing SSRs/total number of HQ transcripts examined). The distance of the average distribution was 11.00 kb (total length/total number of independent genes used to find SSRs), and the SSRs appeared at a frequency of 16.12% (total number of SSRs identified/total number of HQ transcripts examined). The number of repetitive SSR motifs was 105. The identification results showed that there were a total of 286 transcript sequences with more than one EST-SSR locus, and a total of 52 SSRs were presented in compound form. Mononucleotide repeats are prone to mismatch during sequencing, leading to low sequencing quality, so they could not be selected in subsequent experimental analyses.
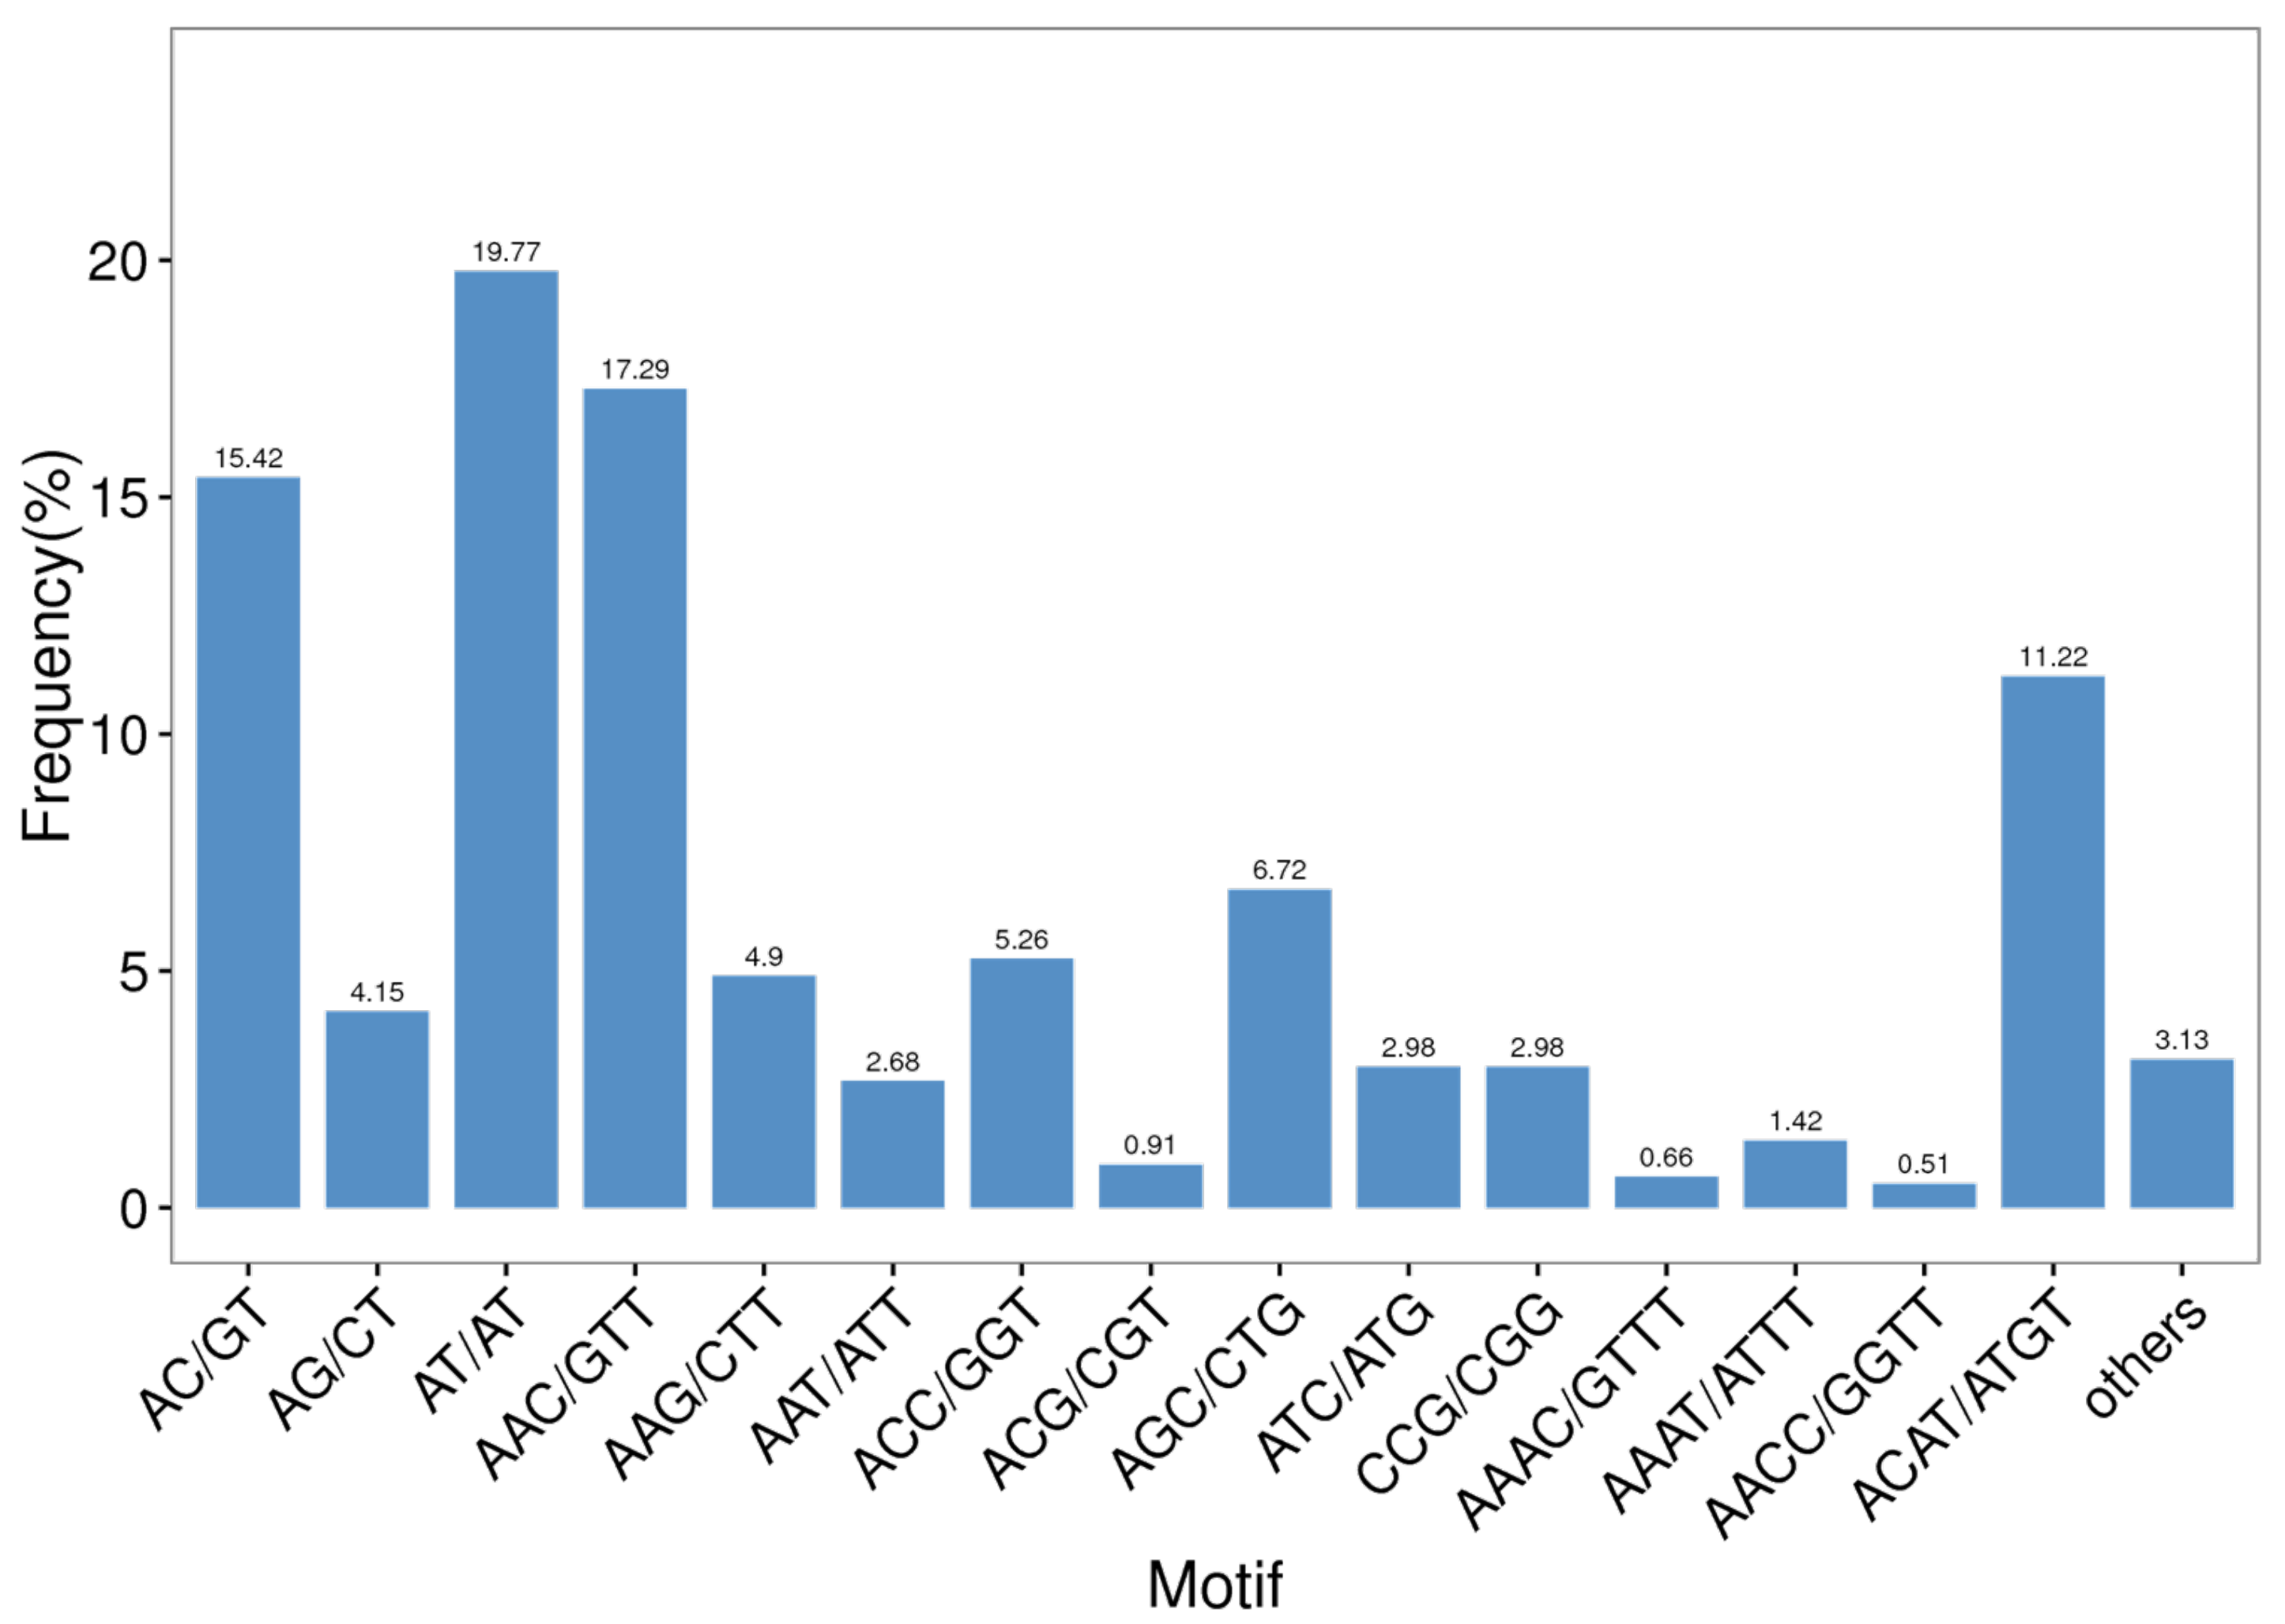
Among all of the SSR repeat types, AT/AT dinucleotide repeats repeated the most, accounting for 19.77% of all repeat motifs, followed by AAC/GTT (17.29%) and AC/GT (15.42%) (Figure 4). Furthermore, trinucleotide repeats contained the most repeat types—up to 38—and the main repeat types consisted of AAC/GTT (17.29%), AGC/CTG (6.72%), and ACC/GGT (5.26%). The following tetranucleotide repeats also included 35 repeat types. As shown in Table 5, the highest number of identified SSRs were trinucleotide repeats (875, 44.24%), followed by dinucleotide repeats (779, 39.38%) and tetranucleotide repeats (302, 15.27%). The rarest type of EST-SSR was the pentanucleotide type (0.46%), but not the hexanucleotide type (0.66%).
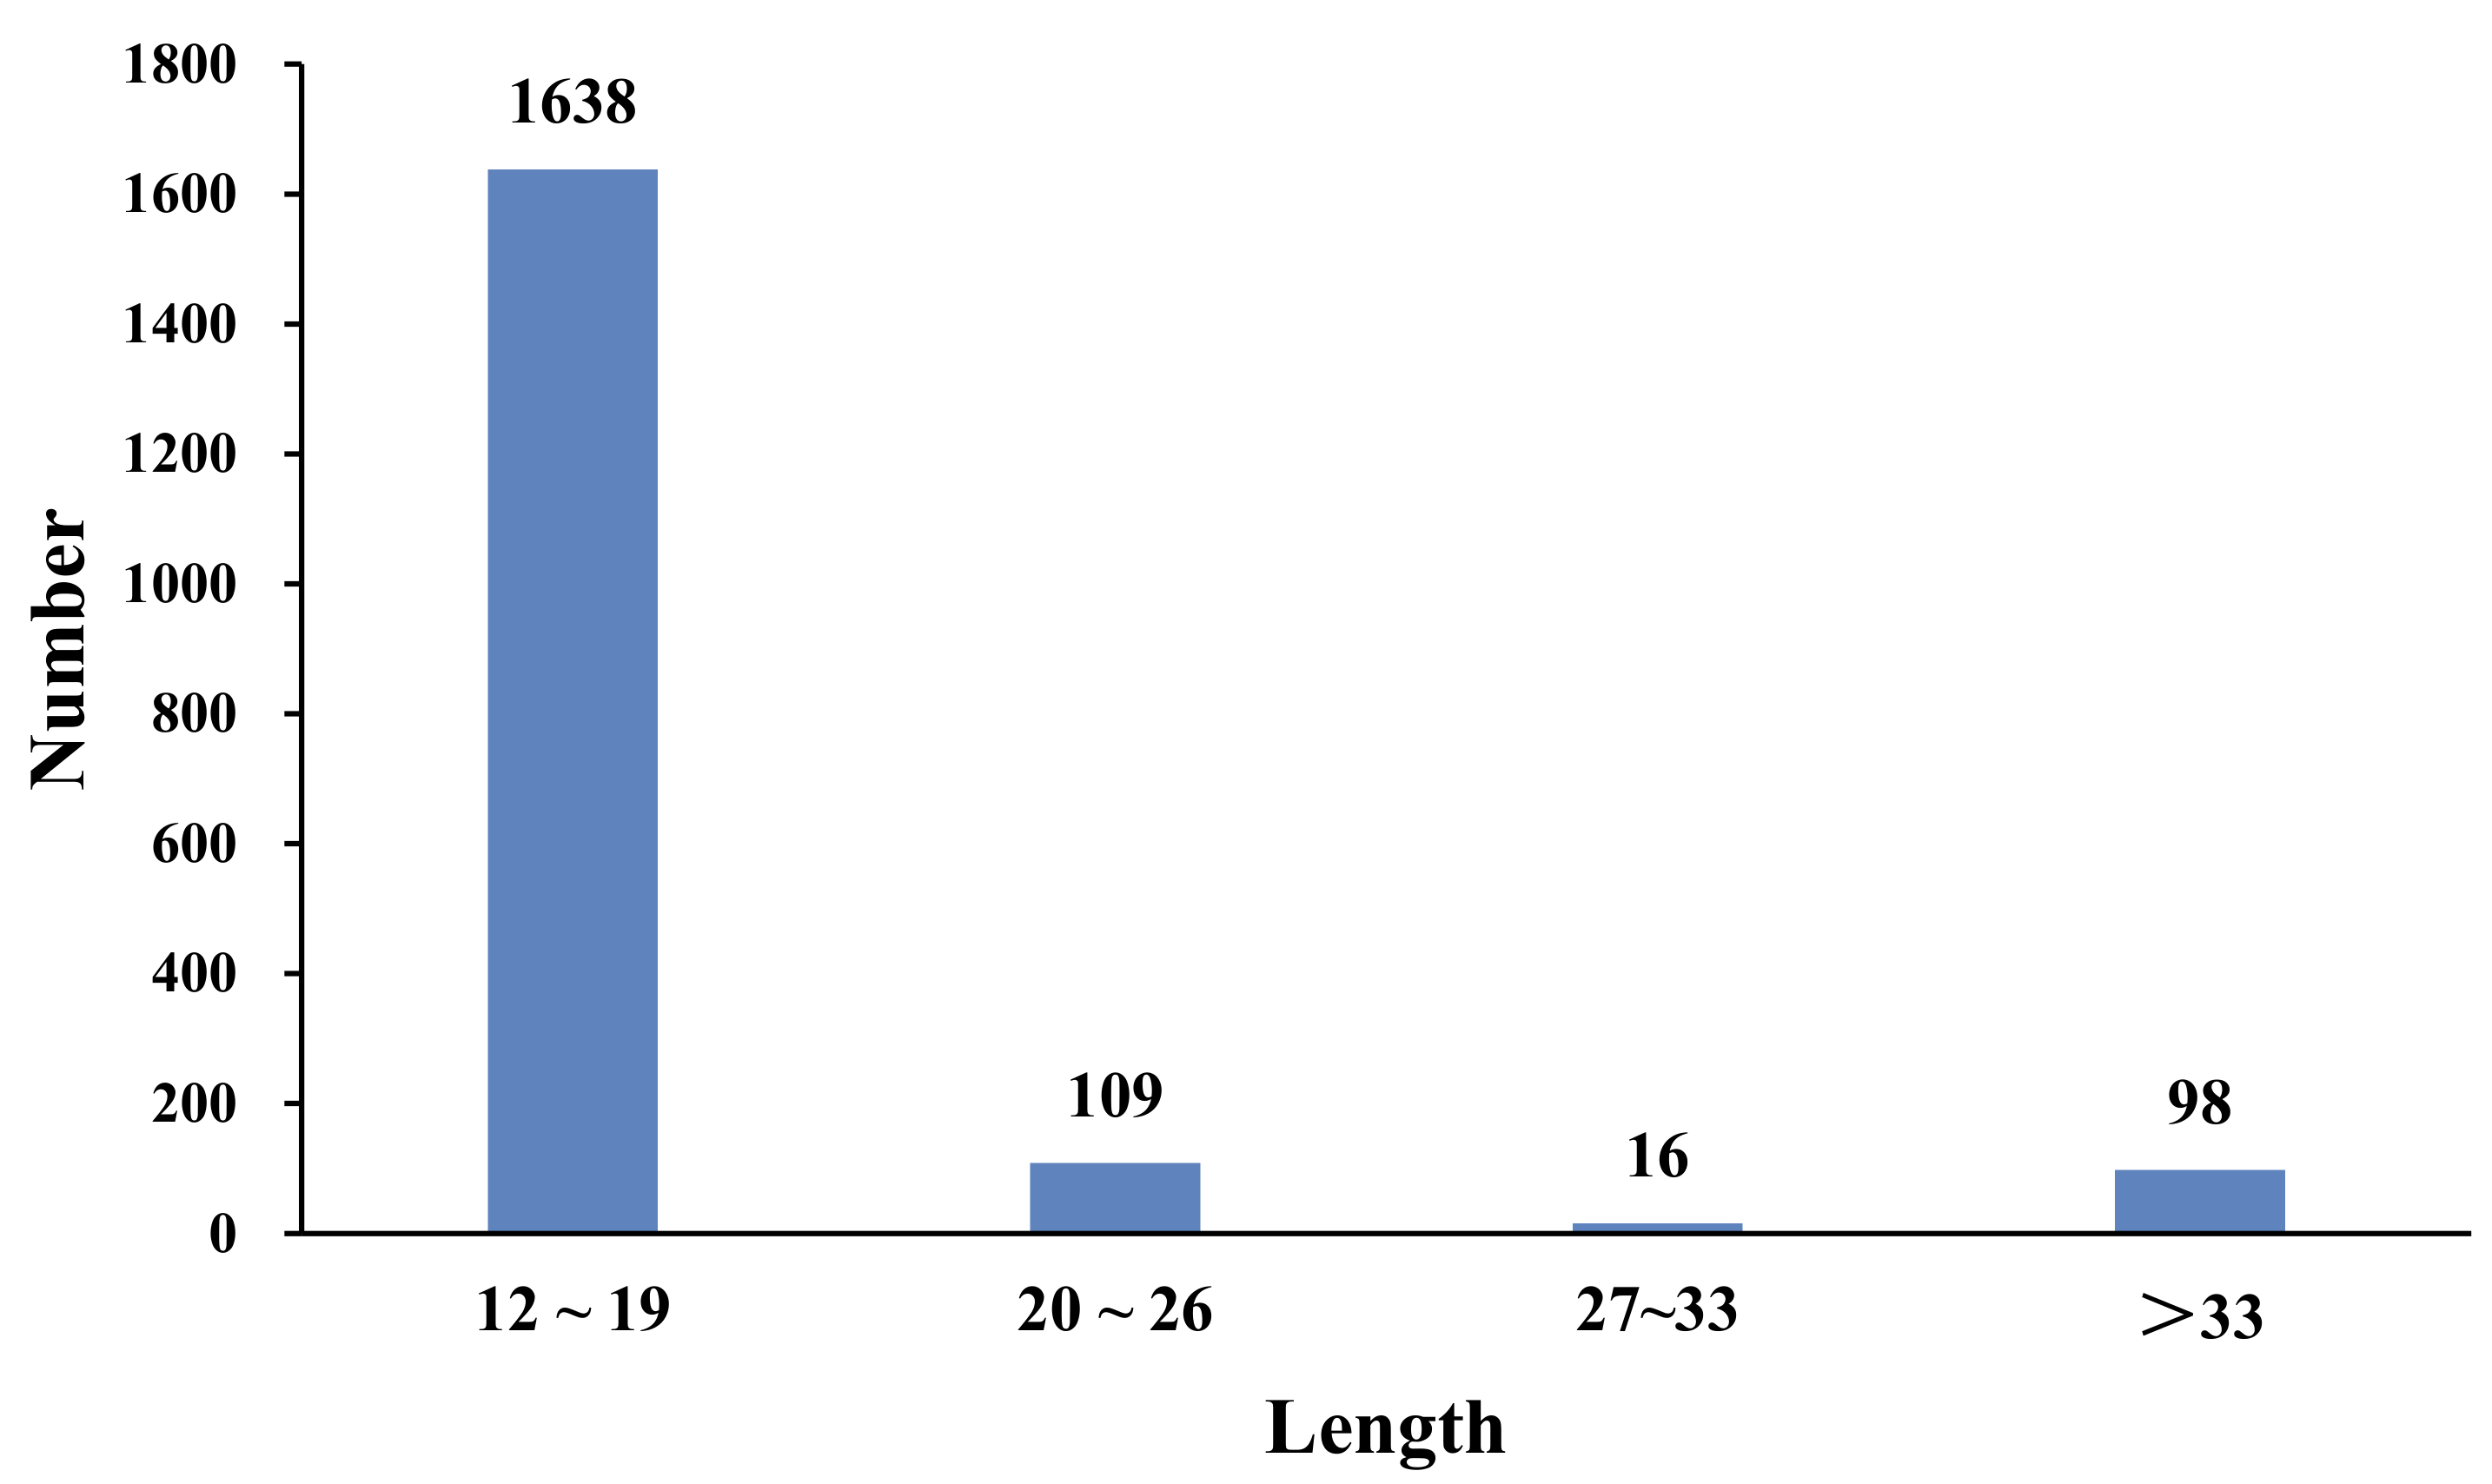
Among all of the SSR repeat motif lengths, the lengths ranged from 12 to 190 bp. A total of 1638 SSRs were mainly concentrated in the 12–18 bp region (88.02%), 109 SSRs were 20–26 bp long (5.86%), 16 SSRs were 27–33 bp long (0.86%), and 98 SSRs were longer than 33 bp (5.27%) (Figure 5).
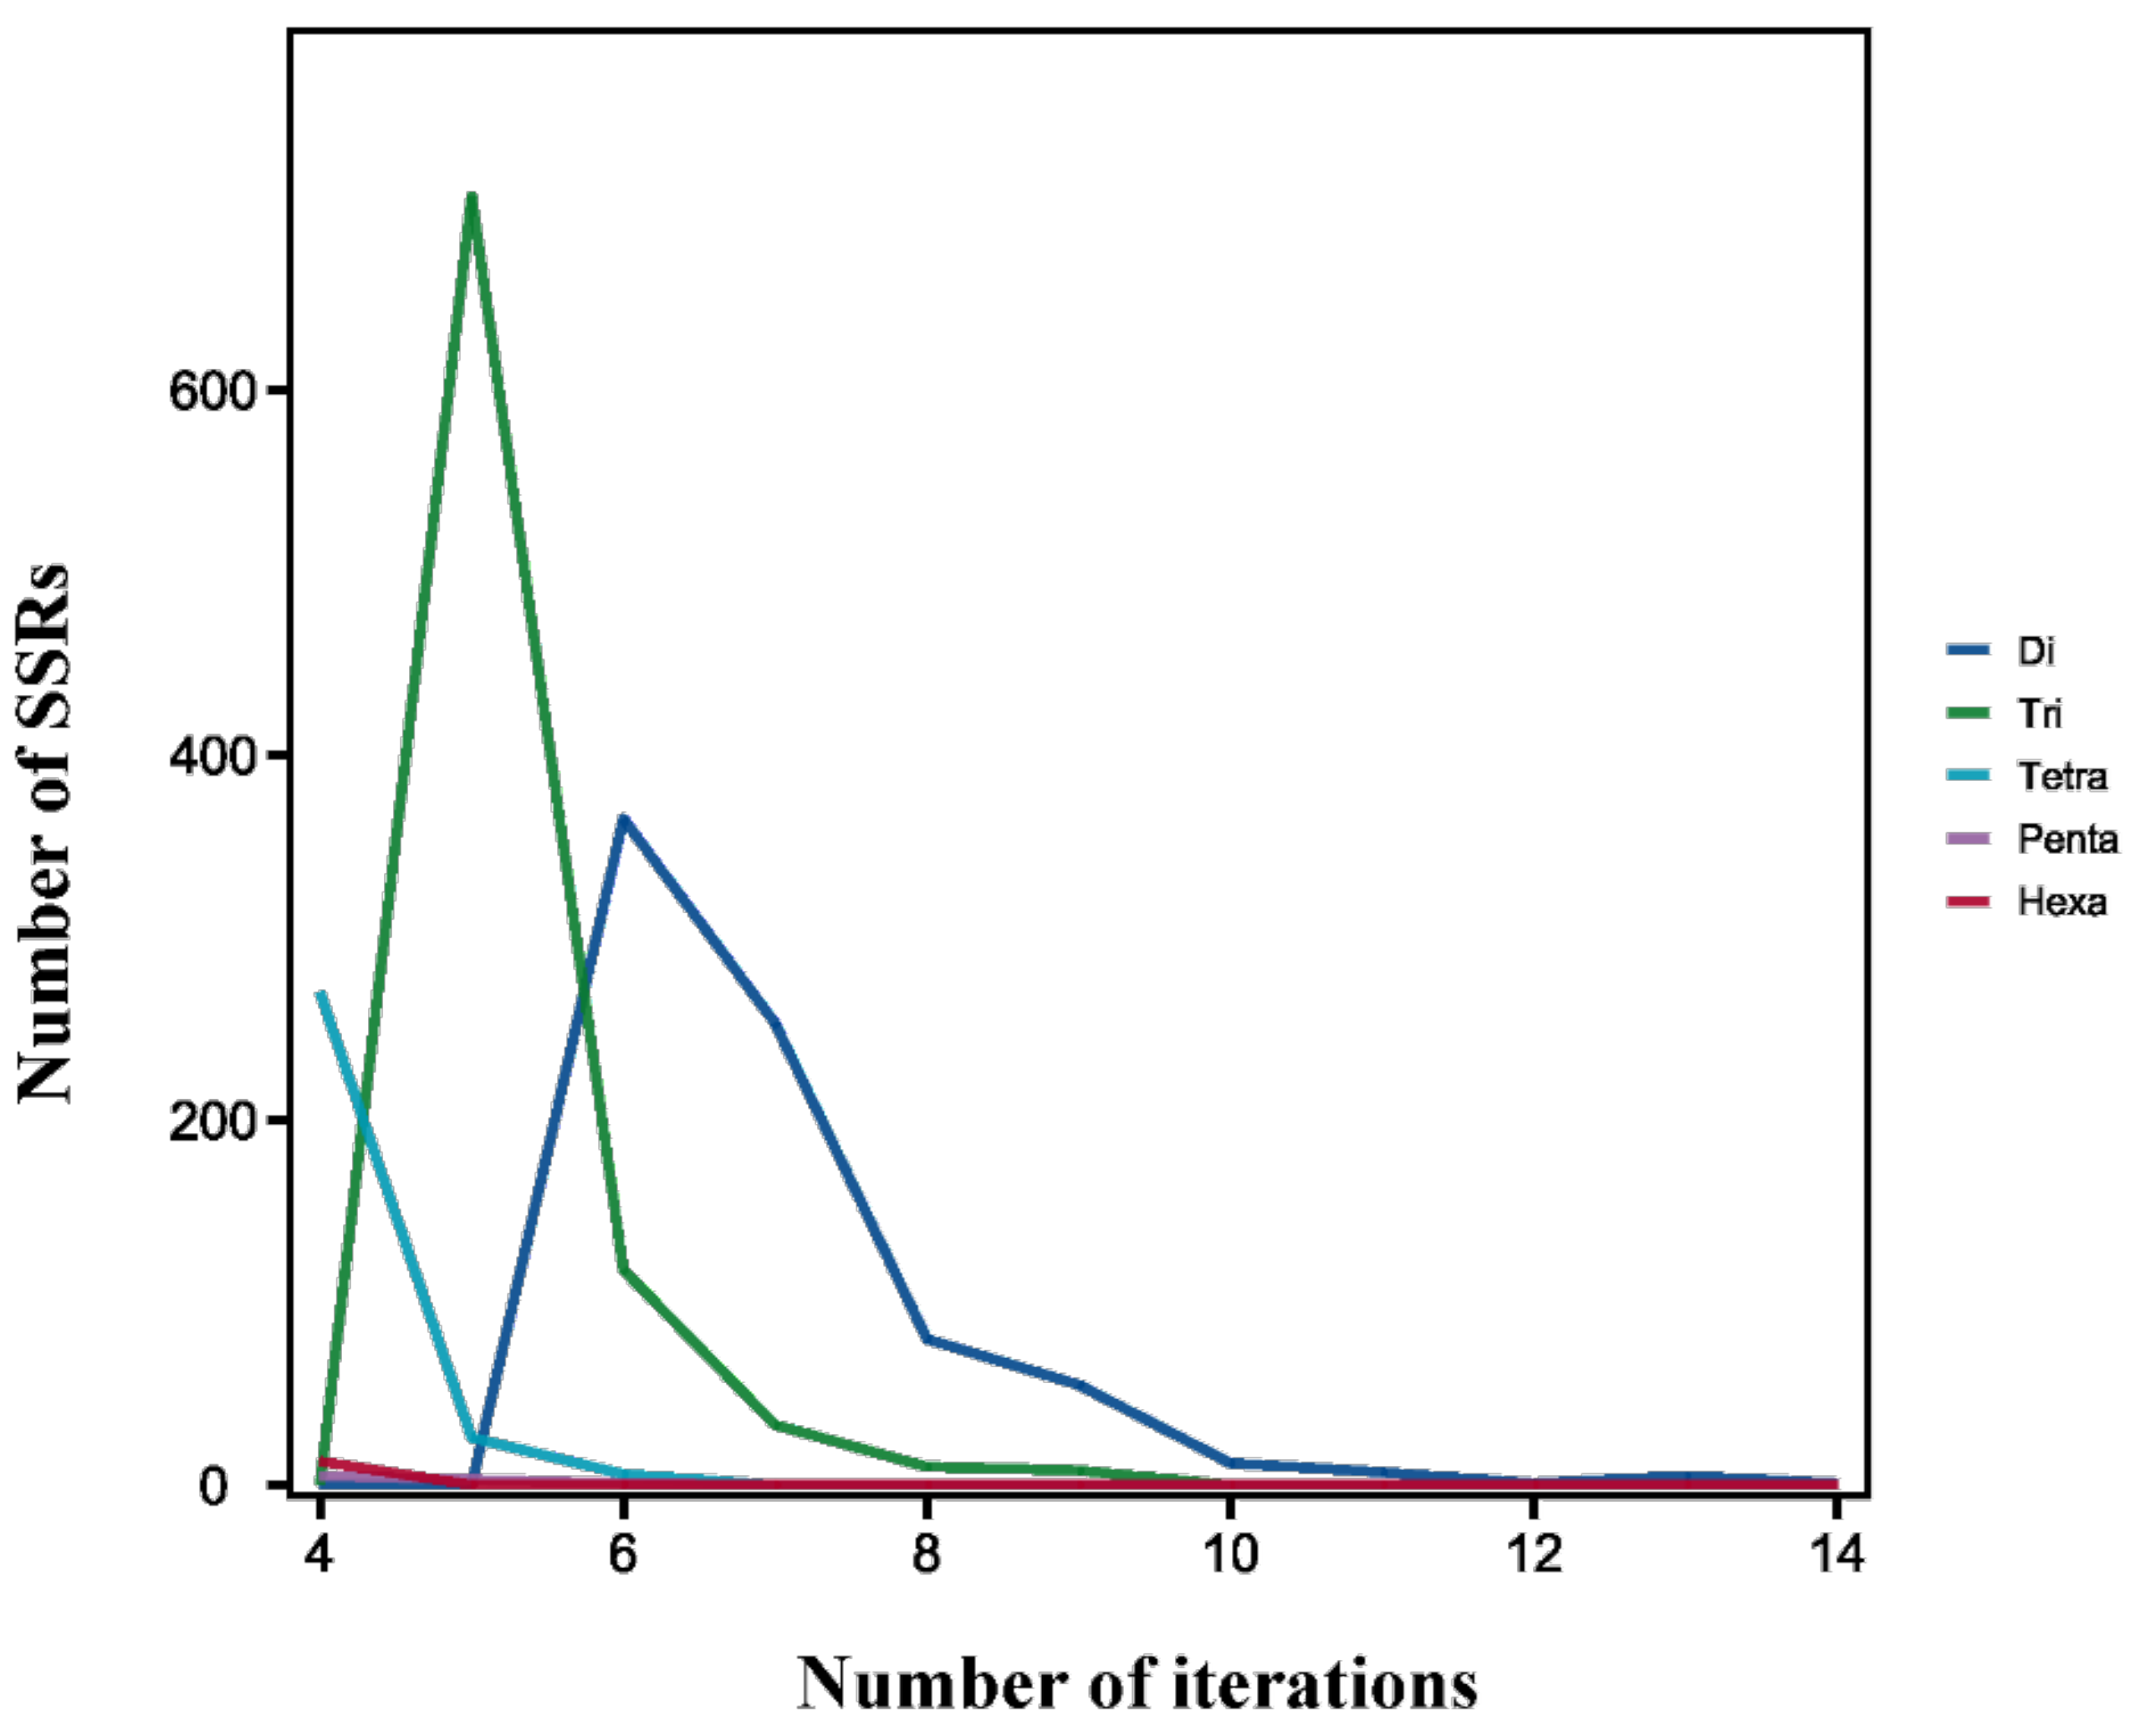
As for SSR tandem repeats, the most common tandem repeat number was 5 (735, 37.16%), followed by 6 (490, 24.77%) and 4 (288, 14.56%). Furthermore, the motif repeats of 1952 SSRs were less than 9, accounting for 98.69% of all identified SSR loci (Figure 6).
3.4. Verification of Novel and Polymorphic EST-SSRs
The development of primers contributes to the basis for further research on the genetic structure and diversity of species. In our study, 174 samples from different geographical populations of Guangxi were subjected to PCR amplification using 80 pairs of newly developed EST-SSRs. Of these 80 EST-SSRs, although five failed to generate a product, the rest of the 75 primer pairs successfully resulted in amplification. Among the 75 primer pairs, six exhibited poor universal applicability, three produced multiple bands, and 12 were monomorphic. Of the remaining 54 primer pairs with the capacity to generate polymorphic amplification products, 13 primer pairs generated unstable and unclear amplification, and the 41 others produced stable and clear amplification products. Details of these 41 primer pairs are shown in Table 6. The detailed information of the electrophoretogram of the nondenaturing polyacrylamide gel is shown in Table S1 and Figure S3.
4. Discussion
The transcriptome data were compared with the reference genome of B. dorsalis. The percentage of the sequences in the reference genome was more than 76%. More than 75% of the sequences were unique-mapped against the reference genome, and no more than 2% were multiple-mapped. In addition, 90.84% of the query sequences had comments for the four databases, indicating that the quality of the transcriptome was satisfactory.
In the study of gene annotation, to obtain gene function information, we can classify lots of new transcripts. Of the Nr databases, 4663 were annotated in B. dorsalis, accounting for 41.82% of the total annotated isoforms. This result not only indicates the close relationship between B. dorsalis and Bactrocera species, but also explains the correct assembly and annotation of this transcript library. A metabolic pathway analysis of 3169 isoforms of B. dorsalis was carried out with the KEGG database, which provided essential data for the next step of the mining of functional genes and functional verification of target genes.
The content of microsatellite sequences and dominant microsatellite sequence types varied among different species. As shown in Table 7, the frequency of occurrence of SSR sites showed differences among species. In the present study, the frequency was higher than that in Bemisia tabaci (5.07%), Conopomorpha sinensis (15.25%) [42], Odontotermes formosanus (9.98%), Galeruca daurica (5.36%) [12], Tenebrio molitor (1.67%), Arma chinensis (7.60%), Tomicus yunnanensis (1.29%) [43], Eucryptorrhynchus chinensis (10.36%) [13], Bicyclus anynana (3.15%) [44], Plodia interpunctell (8.52%) [45], Rhyacionia leptotubula (3.09%) [46], Plutella xylostella (6.59%), Conopomorpha sinensis (15.25%) [42], and Athetis lepigone (2.96%) [47]. We deduced that the investigation of SSR sites might relate to the database size, search element screening SSR site sequence criteria, RNA quality, and species specificity [48]. The number and density of SSR sites identified in this study were significantly higher than the results of the EST development of B. dorsalis in 2014, which was possibly due to the different sequencing depth and assembly quality [49]. The largest abundance of trinucleotide repeat motifs is consistent with that of other insect species, such as Blattella germanica [50], Laodelphax striatellus [51], Tetranychus urticae [52], Anopheles sinensis [19], Dolerus aeneus [53], Tomicus yunnanensis [43], Nilaparvata lugens [54,55], Mythimna separata, and Anoplophora chinensis [48]. This phenomenon is most likely since trinucleotide may be more stable than other repeat unit types in the protein-coding region and rarely produces sliding mutations of the coding frame. Moreover, Ixodes scapularis [52], Grapholitha molesta [56], Leptinotarsa decemlineata [57], Sitodiplosis mosellana [58], Tenebrio molitor, Cimex lectularius, and Phenacoccus solenopsis [59] are dominated by single nucleotide repetitions; Drosophila melanogaster, Epacromius coerulipes [60], Pardosa pseudoannulata [61], Gampsocleis gratiosa [62], and Apis mellifera have the most abundant repeat types with dinucleotides. Bombyx mori [63] is dominated by tetranucleotides. Tribolium castaneum and bee (Apis) [64] were mainly based on hexanucleotides, indicating that the differences in SSR abundance, base composition, and dominant base type among species are not significantly correlated with species kinship. Contrary to the study of Lepidoptera insects, such as Athetis lepigone and Mythimna separata [65], GC/CG is rare in the dinucleotides in animal or plant transcriptomes or genomes. In addition, the present study confirms that trinucleotide repeats are the most abundant in transcribed regions. The reason for such polymorphisms is still under debate, although it seems to be slippage events during DNA replication.
5. Conclusions
In the current study, we obtained 76.6 Gb of clean reads, and approximately 99.3% of the high-quality transcripts were almost greater than 1000 bp in length. In addition, 12,274 sequences were successfully annotated, and 1978 EST-SSRs—excluding mononucleotide repeats—were identified. Moreover, because of their high polymorphism, 41 of these EST-SSRs were proved to be reliable molecular markers in research on B. dorsalis. Overall, with these large amounts of transcription data, most genetic analyses, such as the discovery of new genes, gene function verification, and study of genetic diversity, will be facilitated. In addition, the markers mentioned above will help reveal the genetic relationships of B. dorsalis and its related species in terms of functional molecular markers.
Supplementary Materials
The following are available online at https://0-www-mdpi-com.brum.beds.ac.uk/article/10.3390/insects12100938/s1: Table S1.: Performance summary of 80 EST-SSRs with 174 B. dorsalis samples via nondenaturing polyacrylamide gel electrophoresis. Figure S1: The Venn diagram of the number of lncRNAs predicted by CPC, CNCI, and Swissprot, Figure S2: Classification and quantity statistics graph of alternative splicing events, 59: Performance of 80 EST-SSRs with 174 B. dorsalis samples via nondenaturing polyacrylamide gel electrophoresis, Figure S3: Electrophoretogram of nondenaturing polyacrylamide gel.
Author Contributions
Data curation, supervision, and writing—review and editing, X.W.; Formal analysis, software, writing—original draft, investigation, and methodology, H.O.; Resources and investigation, F.Q. and C.C.; Project administration, supervision, validation, and funding acquisition, W.L.; Writing—review and editing, visualization, and formal analysis, X.Z. All authors have read and agreed to the published version of the manuscript.
Funding
This research was funded by China Guangxi Innovation-Driven Projects, grant number AA17202017.
Institutional Review Board Statement
Not applicable.
Informed Consent Statement
Not applicable.
Data Availability Statement
The submission of raw sequences to NCBI SRA has been started undern project number PRJNA695387. Data are contained within the article or Supplementary Materials.
Conflicts of Interest
The authors declare no conflict of interest. The funders had no role in the design of the study; in the collection, analyses, or interpretation of data; in the writing of the manuscript, or in the decision to publish the results.
References
- Liu, H.; Zhang, D.J.; Xu, Y.J.; Wang, L.; Cheng, D.F.; Qi, Y.X.; Zeng, L.; Lu, Y.Y. Invasion, expansion, and control of Bactrocera dorsalis (Hendel) in China. J. Integr. Agric. 2019, 18, 771–787. [Google Scholar] [CrossRef]
- Aketarawong, N.; Bonizzoni, M.; Thanaphum, S.; Gomulski, L.M.; Gasperi, G.; Malacrida, A.R.; Gugliemino, C.R. Inferences on the population structure and colonization process of the invasive oriental fruit fly, Bactrocera dorsalis (Mendel). Mol. Ecol. 2007, 16, 3522–3532. [Google Scholar] [CrossRef]
- Clarke, A.R.; Armstrong, K.F.; Carmichael, A.E.; Milne, J.R.; Raghu, S.; Roderick, G.K.; Yeates, D.K. Invasive phytophagous pests arising through a recent tropical evolutionary radiation: The Bactrocera dorsalis complex of fruit flies. Annu. Rev. Entomol. 2005, 50, 293–319. [Google Scholar] [CrossRef] [Green Version]
- Stephens, A.E.A.; Kriticos, D.J.; Leriche, A. The current and future potential geographical distribution of the oriental fruit fly, Bactrocera dorsalis (Diptera: Tephritidae). Bull. Entomol. Res. 2007, 97, 369–378. [Google Scholar] [CrossRef]
- Shen, G.M.; Wang, X.N.; Dou, W.; Wang, J.J. Biochemical and molecular characterisation of acetylcholinesterase in four field populations of Bactrocera dorsalis (Hendel) (Diptera: Tephritidae). Pest Manag. Sci. 2012, 68, 1553–1563. [Google Scholar] [CrossRef] [PubMed]
- Buschiazzo, E.; Gemmell, N.J. The rise, fall and renaissance of microsatellites in eukaryotic genomes. Bioessays 2006, 28, 1040–1050. [Google Scholar] [CrossRef] [PubMed]
- Biswas, M.K.; Chai, L.; Mayer, C.; Xu, Q.; Guo, W.; Deng, X. Exploiting BAC-end sequences for the mining, characterization and utility of new short sequences repeat (SSR) markers in Citrus. Mol. Biol. Rep. 2012, 39, 5373–5386. [Google Scholar] [CrossRef]
- Hina, F.; Yisilam, G.; Wang, S.Y.; Li, P.; Fu, C.X. De novo transcriptome assembly, gene annotation and SSR marker development in the moon seed genus Menispermum (Menispermaceae). Front. Genet. 2020, 11, 380. [Google Scholar] [CrossRef]
- Li, Y.C.; Korol, A.B.; Fahima, T.; Beiles, A.; Nevo, E. Microsatellites: Genomic distribution, putative functions and mutational mechanisms: A review. Mol. Ecol. 2002, 11, 2453–2465. [Google Scholar] [CrossRef]
- Duan, H.; Zhang, A.; Zhao, C.; Yu, Y.; Chu, D. Characterization and molecular marker screening of EST-SSRs and their polymorphism compared with Genomic-SSRs in Frankliniella occidentalis (Thysanoptera: Thripidae). Acta Entomol. Sin. 2012, 55, 634–640. [Google Scholar]
- Duan, H.S.; Yu, Y.; Zhang, A.S.; Guo, D.; Tao, Y.L.; Chu, D. Genetic diversity and inferences on potential source areas of adventive Frankliniella Occidentalis (Thysanoptera: Thripidae) in Shandong, China based on mitochondrial and microsatellite markers. Fla. Entomol. 2013, 96, 964–973. [Google Scholar] [CrossRef]
- Zhang, P.; Zhou, X.; Pang, B.; Tan, Y.; Chang, J.; Gao, L. High-throughput discovery of microsatellite markers in Galeruca daurica (Coleoptera: Chrysomelidae) from a transcriptome database. Chin. J. Appl. Entomol. 2016, 53, 1058–1064. [Google Scholar]
- Wu, Z.; Gao, P.; Wen, J. Characteristic analysis of microsatellite in Eucryptorrhynchus chinensis transcriptome. J. Environ. Entomol. 2016, 38, 979–983. [Google Scholar]
- Guo, Y.Q.; Zhang, J.Z.; Yang, M.L.; Yan, L.Z.; Zhu, K.Y.; Guo, Y.P.; Ma, E.B. Comparative analysis of cytochrome P450-like genes from Locusta migratoria manilensis: Expression profiling and response to insecticide exposure. Insect Sci. 2012, 19, 75–85. [Google Scholar] [CrossRef]
- Li, D.; Zhao, P. Development of microsatellite markers based on the transcriptome data of Sclomina erinacea (Heteroptera: Reduviidae). Acta Entomol. Sin. 2019, 62, 694–702. [Google Scholar]
- Yu, H.; Frommer, M.; Robson, M.K.; Meats, A.W.; Shearman, D.C.A.; Sved, J.A. Microsatellite analysis of the Queensland fruit fly Bactrocera tryoni (Diptera: Tephritidae) indicates spatial structuring: Implications for population control. Bull. Entomol. Res. 2001, 91, 139–147. [Google Scholar] [PubMed]
- Solano, P.; de La Rocque, S.; de Meeus, T.; Cuny, G.; Duvallet, G.; Cuisance, D. Microsatellite DNA markers reveal genetic differentiation among populations of Glossina palpalis gambiensis collected in the agro-pastoral zone of Sideradougou, Burkina Faso. Insect Mol. Biol. 2000, 9, 433–439. [Google Scholar] [CrossRef]
- Luna, C.; Bonizzoni, M.; Cheng, Q.Y.; Robinson, A.S.; Aksoy, S.; Zheng, L.B. Microsatellite polymorphism in tsetse flies (Diptera: Glossinidae). J. Med. Entomol. 2001, 38, 376–381. [Google Scholar] [CrossRef] [PubMed] [Green Version]
- Wang, X.; Zhang, Y.; He, X.; Mei, T.; Chen, B. Identification, characteristics and distribution of microsatellites in the whole genome of Anopheles sinensis (Diptera: Culicidae). Acta Entomol. Sin. 2016, 59, 1058–1068. [Google Scholar]
- Bonizzoni, M.; Malacrida, A.R.; Guglielmino, C.R.; Gomulski, L.M.; Gasperi, G.; Zheng, L. Microsatellite polymorphism in the Mediterranean fruit fly, Ceratitis capitata. Insect Mol. Biol. 2000, 9, 251–261. [Google Scholar] [CrossRef]
- Ravel, S.; Herve, J.P.; Diarrassouba, S.; Kone, A.; Cuny, G. Microsatellite markers for population genetic studies in Aedes aegypti (Diptera: Culicidae) from Cote d’Ivoire: Evidence for a microgeographic genetic differentiation of mosquitoes from Bouake. Acta Trop. 2002, 82, 39–49. [Google Scholar] [CrossRef]
- Ouyang, P.; Kang, D.; Mo, X.; Tian, E.; Hu, Y.; Huang, R. Development and characterization of high-throughput EST-based SSR markers for Pogostemon cablin using transcriptome sequencing. Molecules 2018, 23, 2014. [Google Scholar] [CrossRef] [Green Version]
- Chapman, M.A. Optimizing depth and type of high-throughput sequencing data for microsatellite discovery. Appl. Plant Sci. 2019, 7, e11298. [Google Scholar] [CrossRef] [PubMed]
- Wang, Y.W.; Samuels, T.D.; Wu, Y.Q. Development of 1030 genomic SSR markers in switchgrass. Theor. Appl. Genet. 2011, 122, 677–686. [Google Scholar] [CrossRef]
- Contreras, J.L.; Knoppers, B.M. The Genomic Commons. Annu. Rev. Genom. Hum. Genet. 2018, 19, 429–453. [Google Scholar] [CrossRef] [PubMed]
- Dutta, S.; Kumawat, G.; Singh, B.P.; Gupta, D.K.; Singh, S.; Dogra, V.; Gaikwad, K.; Sharma, T.R.; Raje, R.S.; Bandhopadhya, T.K.; et al. Development of genic-SSR markers by deep transcriptome sequencing in pigeonpea [Cajanus cajan (L.) Millspaugh]. BMC Plant Biol. 2011, 11, 17. [Google Scholar] [CrossRef] [PubMed] [Green Version]
- Zhang, J.; Liang, S.; Duan, J.; Wang, J.; Chen, S.; Cheng, Z.; Zhang, Q.; Liang, X.; Li, Y. De novo assembly and characterisation of the transcriptome during seed development, and generation of genic-SSR markers in peanut (Arachis hypogaea L.). BMC Genom. 2012, 13, 90. [Google Scholar] [CrossRef] [Green Version]
- Liu, C.; Fan, B.; Cao, Z.; Su, Q.; Wang, Y.; Zhang, Z.; Wu, J.; Tian, J. A deep sequencing analysis of transcriptomes and the development of EST-SSR markers in mungbean (Vigna radiata). J. Genet. 2016, 95, 527–535. [Google Scholar] [CrossRef]
- Abdel-Ghany, S.E.; Hamilton, M.; Jacobi, J.L.; Ngam, P.; Devitt, N.; Schilkey, F.; Ben-Hur, A.; Reddy, A.S.N. A survey of the sorghum transcriptome using single-molecule long reads. Nat. Commun. 2016, 7, 11706. [Google Scholar] [CrossRef] [Green Version]
- Rhoads, A.; Au, K.F. PacBio sequencing and its applications. Genom. Proteom. Bioinform. 2015, 13, 278–289. [Google Scholar] [CrossRef] [Green Version]
- Feng, K.; Lu, X.; Luo, J.; Tang, F. SMRT sequencing of the full-length transcriptome of Odontotermes formosanus (Shiraki) under Serratia marcescens treatment. Sci. Rep. 2020, 10, 15909. [Google Scholar] [CrossRef] [PubMed]
- Gordon, S.P.; Tseng, E.; Salamov, A.; Zhang, J.; Meng, X.; Zhao, Z.; Kang, D.; Underwood, J.; Grigoriev, I.V.; Figueroa, M.; et al. Widespread polycistronic transcripts in Fungi revealed by Single-molecule mRNA sequencing. PLoS ONE 2015, 10, e0132628. [Google Scholar]
- Salmela, L.; Rivals, E. LoRDEC: Accurate and efficient long read error correction. Bioinformatics 2014, 30, 3506–3514. [Google Scholar] [CrossRef] [PubMed]
- Wu, T.D.; Watanabe, C.K. GMAP: A genomic mapping and alignment program for mRNA and EST sequences. Bioinformatics 2005, 21, 1859–1875. [Google Scholar] [CrossRef] [Green Version]
- Conesa, A.; Gotz, S.; Garcia-Gomez, J.M.; Terol, J.; Talon, M.; Robles, M. Blast2GO: A universal tool for annotation, visualization and analysis in functional genomics research. Bioinformatics 2005, 21, 3674–3676. [Google Scholar] [CrossRef] [PubMed] [Green Version]
- Ye, J.; Zhang, Y.; Cui, H.H.; Liu, J.W.; Wu, Y.Q.; Cheng, Y.; Xu, H.X.; Huang, X.X.; Li, S.T.; Zhou, A.; et al. WEGO 2.0: A web tool for analyzing and plotting GO annotations, 2018 update. Nucleic Acids Res. 2018, 46, W71–W75. [Google Scholar] [CrossRef] [PubMed]
- Kong, L.; Zhang, Y.; Ye, Z.Q.; Liu, X.Q.; Zhao, S.Q.; Wei, L.; Gao, G. CPC: Assess the protein-coding potential of transcripts using sequence features and support vector machine. Nucleic Acids Res. 2007, 35 (Suppl. 2), W345–W349. [Google Scholar] [CrossRef]
- Sun, L.; Luo, H.T.; Bu, D.C.; Zhao, G.G.; Yu, K.T.; Zhang, C.H.; Liu, Y.N.; Chen, R.S.; Zhao, Y. Utilizing sequence intrinsic composition to classify protein-coding and long non-coding transcripts. Nucleic Acids Res. 2013, 41, e166. [Google Scholar] [CrossRef] [PubMed]
- Fugenschuh, M.; Gera, R.; Tagarelli, A. ANGEL: A synthetic model for airline network generation emphasizing layers. IEEE Trans. Netw. Sci. Eng. 2020, 7, 1977–1987. [Google Scholar] [CrossRef]
- Alamancos, G.P.; Pages, A.; Trincado, J.L.; Bellora, N.; Eyras, E. Leveraging transcript quantification for fast computation of alternative splicing profiles. RNA 2015, 21, 1521–1531. [Google Scholar] [CrossRef] [Green Version]
- Wu, Q.C.; Zang, F.Q.; Xie, X.M.; Ma, Y.; Zheng, Y.Q.; Zang, D.K. Full-length transcriptome sequencing analysis and development of EST-SSR markers for the endangered species Populus wulianensis. Sci. Rep. 2020, 10, 16249. [Google Scholar] [CrossRef]
- Meng, X.; Hu, J.; Li, Y.; Ouyang, G. Analysis of SSR loci in transcriptome database of Conopomorpha sinensis Bradley (Lepidoptera: Gracilariidae). J. Environ. Entomol. 2017, 39, 1219–1224. [Google Scholar]
- Yuan, Y.; Zhang, L.; Wu, G.; Zhu, J. High-throughput discovery microsatellites in Tomicus yunnanensis (Coleoptera: Scolytinae). J. Environ. Entomol. 2014, 36, 166–170. [Google Scholar]
- Beldade, P.; Rudd, S.; Gruber, J.D.; Long, A.D. A wing expressed sequence tag resource for Bicyclus anynana butterflies, an evo-devo model. BMC Genom. 2006, 7, 130. [Google Scholar] [CrossRef] [Green Version]
- Tang, P.; Tao, Y.; Xue, H.; Yuan, M. Analysis of microsatellite loci in Plodia interpunctella based on transcriptome dataset. Plant Prot. 2017, 43, 43–48. [Google Scholar]
- Zhu, J.Y.; Li, Y.H.; Yang, S.; Li, Q.W. De novo assembly and characterization of the global transcriptome for Rhyacionia leptotubula using Illumina paired-end sequencing. PLoS ONE 2013, 8, e81096. [Google Scholar] [CrossRef]
- Li, L.T.; Zhu, Y.B.; Ma, J.F.; Li, Z.Y.; Dong, Z.P. An Analysis of the Athetis lepigone transcriptome from four developmental Stages. PLoS ONE 2013, 8, e73911. [Google Scholar] [CrossRef]
- Han, X.; Wang, Y.; Lu, C.; Lin, H.; Shi, Y.; He, H.; Zhang, F.; Liang, G. Characteristics of the SSR loci in the Anoplophora chinensis transcriptome. Chin. J. Appl. Entomol. 2019, 56, 1299–1308. [Google Scholar]
- Wei, D.D.; Shi, J.X.; Zhang, X.X.; Chen, S.C.; Wei, D.; Wang, J.J. Analysis of microsatellite loci from Bactrocera dorsalis based on transcriptome dataset. Ying Yong Sheng Tai Xue Bao 2014, 25, 1799–1805. [Google Scholar]
- Wang, C.; Du, L.; Li, P.; Yang, M.; Li, W.; Shen, Y.; Zhang, X.; Yue, B. Distribution patterns of microsatellites in the genome of the German cockroach (Blattella germanica). Acta Entomol. Sin. 2015, 58, 1037–1045. [Google Scholar]
- Zhang, F.J.; Guo, H.Y.; Zheng, H.J.; Zhou, T.; Zhou, Y.J.; Wang, S.Y.; Fang, R.X.; Qian, W.; Chen, X.Y. Massively parallel pyrosequencing-based transcriptome analyses of small brown planthopper (Laodelphax striatellus), a vector insect transmitting rice stripe virus (RSV). BMC Genom. 2010, 11, 303. [Google Scholar] [CrossRef] [Green Version]
- Wang, Z.; Huang, J.; Du, L.; Li, W.; Yue, B.; Zhang, X. Comparison of microsatellites between the genomes of Tetranychus urticae and Ixodes scapularis. Sichuan J. Zool. 2013, 32, 481–486. [Google Scholar]
- Cook, N.; Aziz, N.; Hedley, P.E.; Morris, J.; Milne, L.; Karley, A.J.; Hubbard, S.F.; Russell, J.R. Transcriptome sequencing of an ecologically important graminivorous sawfly: A resource for marker development. Conserv. Genet. Resour. 2011, 3, 789–795. [Google Scholar] [CrossRef]
- Liu, Y.-D.; Hou, M.-L. Analysis of microsatellite information in EST resource of Nilaparvata lugens (Homoptera: Delphacidae). Acta Entomol. Sin. 2010, 53, 239–247. [Google Scholar]
- Sun, J.T.; Zhang, Y.K.; Ge, C.; Hong, X.Y. Mining and characterization of sequence tagged microsatellites from the brown planthopper Nilaparvata lugens. J. Insect Sci. 2011, 11, 134. [Google Scholar] [CrossRef] [Green Version]
- Leng, C.; Li, Y.; Hu, D.; Wu, J.; Li, Y. Analysis of the larval midgut transcriptome and SSR markers in Grapholitha molesta (Lepidoptera: Tortricidae). Acta Entomol. Sin. 2018, 61, 1272–1283. [Google Scholar]
- Liu, Y.; Fu, K.; He, J.; Guo, W. Verification SSR primers by datamining genome SSR loci in Leptinotarsa decemlineata. J. Environ. Entomol. 2018, 40, 633–644. [Google Scholar]
- Duan, Y.; Wu, R.; Luo, L.; Wu, Y.; Jiang, Y.; Miao, J.; Gong, Z. Characterization of SSRs from the ESTs in the wheat midge, Sitodiplosis mosellana (Gehin) (Diptera: Cecidomyiidae). Acta Entomol. Sin. 2011, 54, 1147–1154. [Google Scholar]
- Luo, M.; Zhang, H.; Bin, S.; Lin, J. High-throughput discovery of SSR genetic markers in the mealybug, Phenacoccus solenopsis (Hemiptera: Pseudococcidae), from its transcriptome database. Acta Entomol. Sin. 2014, 57, 395–400. [Google Scholar]
- Jin, Y.; Cong, B.; Wang, L.; Zhang, H.; Dong, H. An analysis of the transcriptome of Epacromius coerulipes (Orthoptera: Acrididae). Acta Entomol. Sin. 2015, 58, 817–825. [Google Scholar]
- Li, C.C.; Li, G.Y.; Wang, Y.; Peng, Y. Development of SSR markers based on transcriptome sequences of the Wolf spider pardosa pseudoannulata (Araneae: Lycosidae) 1. Entomol. News 2020, 129, 6–15. [Google Scholar] [CrossRef]
- Zhou, Z.; Han, Y.; Zhen, Y.; Chai, J. Identification, characteristics and distribution of SSR loci in the transcriptome and genome skimming of Gampsocleis gratiosa (Orthoptera: Tettigoniidae). J. Environ. Entomol. 2019, 41, 799–807. [Google Scholar]
- Mi, Z.; Li, A.; Ruan, C.; Li, G.; Du, W.; Long, Y.; Zhu, Y. Searching and analysis of EST-SSR markers from linkage group 12 of the silkworm, Bombyx mori. Acta Entomol. Sin. 2011, 54, 1223–1230. [Google Scholar]
- Li, B.; Xia, Q.-Y.; Lu, C.; Zhou, Z.-Y. Analysis of microsatellites derived from bee ESTs. Acta Genet. Sin. 2004, 31, 1089–1094. [Google Scholar] [PubMed]
- Li, W.; Zhang, L.; Cheng, Y.; Luo, L.; Jiang, X. High-throughput discovery of microsatellite markers based on transcriptome sequencing in the oriental armyworm, Mythimna separata (Walker). Acta Phytophylacica Sin. 2017, 44, 377–384. [Google Scholar]
Figure 1.
SMRT sequencing of B. dorsalis transcriptomes. (A) Length distribution of subreads. (B) Length distribution of CCSs. (C) Length distribution of FLNCs. Note: The left ordinate represents the number of sequences of this length, and the right ordinate represents the number of sequences whose length is greater than a certain value (X-axis).

Figure 2.
Venn diagram of the number of the annotation results from the four databases.

Figure 3.
Gene Ontology (GO) distribution for B. dorsalis isoforms.

Figure 4.
Microsatellite distribution on different repeat motifs (considering sequence complementary) in the B. dorsalis transcriptome.
Figure 4.
Microsatellite distribution on different repeat motifs (considering sequence complementary) in the B. dorsalis transcriptome.

Figure 5.
Length distribution of microsatellites in the B. dorsalis transcriptome.

Figure 6.
The distribution of different types of repeat units of SSRs in B. dorsalis.


Table 1.
The Bactrocera dorsalis populations used in this study.
| Collection Location | Population Code | Number | Host Plants | Geo-Coordinates | Collection Date | |
|---|---|---|---|---|---|---|
| City/Province | Town | |||||
| Beihai | Tieshangang | BHTSG | 8 | Guava | N21°31′45″ E109°25′18″ | 2020.10.24 |
| Hepu | HPSK | 8 | Citrus Reiculata Blanco | N21°44′36″ E109°22′52″ | 2020.10.24 | |
| Weizhou island | WZD | 8 | Pawpaw | N21°01′39″ E109°05′24″ | 2021.6.9 | |
| Yulin | Yuzhouqu | YLYZQ | 8 | Guava | N22°41′35″ E110°07′43″ | 2020.10.29 |
| Luchuan | YLLC | 8 | Guava | N22°9′39″ E110°14′33″ | 2020.11.1 | |
| Rongxian | RXRX | 8 | Citrus Reiculata Blanco | N22°48′33″ E110°28′47″ | 2020.11.25 | |
| Chongzuo | Longzhou | CZLZ | 8 | Green date, Tangerine | N25°16′16″ E110°19′51″ | 2020.3.31 |
| Jiangzhouqu | CZJZQ | 6 | Citrus Reiculata Blanco | N22°39′34″ E107°38′21″ | 2020.10.31 | |
| Baise | Tianyang | BSTY | 6 | Mango | N23°44′08″ E106°54′56″ | 2020.10.31 |
| Guigang | Gangnanqu | GGGNQ | 8 | CitrusGonggan, sugar orange | N23°01′55″ E109°49′41″ | 2020.10.25 |
| Pingnan | GGPN | 8 | Citrus Reiculata Blanco | N23°25′17″ E110°32′11″ | 2020.11.25 | |
| Guilin | Yongfu | GLYF | 8 | Momordica Grosvenori | N24°59′31″ E109°59′54″ | 2020.11.1 |
| Gongcheng | GLGC | 8 | Gongcheng Persimmon | N24°43′41″ E110°52′31″ | 2020.11.2 | |
| Wuzhou | Mengshan | WZMS | 8 | Sugar Orange | N24°11′38″ E110°31′29″ | 2020.10.28 |
| Fangchenggang | Shangsi | FCGSS | 8 | Guava | N22°1′33″ E108°0′3″ | 2020.9.17 |
| Nanning | Longan | NNLA | 8 | Mango | N23°9′57″ E107°41′46″ | 2020.7.17 |
| Hechi | Duan | HCDA | 6 | Citrus Reiculata Blanco | N23°58′45″ E108°5′57″ | 2020.11.16 |
| Laibin | Xincheng | LBXC | 4 | Citrus Reiculata Blanco | N23°50′54″ E108°49′54″ | 2020.11.1 |
| Qinzhou | Qinnanqu | QZQN | 8 | Guava | N21°56′19″ E108°39′25″ | 2021.7.26 |
| Guangdong, Guangzhou | GZ | 8 | Uncertain | N23°9′29″ E113°21′28″ | 2020.10.17 | |
| Luoyang, Henan | HN | 8 | Peach | N34°39′55″ E112°24′55″ | 2021. 5.1 | |
| Baoshan, Yunnan | YN | 6 | Persimmon | N25°7′16″ E99°9′57″ | 2020.2.5 | |
Table 2.
Data filtering results of the B. dorsalis transcriptome.
| Categories | Sequencing | Amount |
|---|---|---|
| Subreads | Number of subreads | 40,319,890 |
| Number of bases | 40,685,843,094 | |
| Average length | 1009 | |
| N50 | 1659 | |
| Circular consensus sequence (CCS) | Number of sequences | 535,241 |
| Number of bases | 940,115,109 | |
| Mean length | 1756 | |
| Full-length non-concatemer (FLNC) | Number of sequences | 386,916 |
| Mean length | 1622 | |
| High-quality isoforms | Number of sequences | 22,780 (99.30%) |
| Mean length | 1783 | |
| N50 | 2256 | |
| Comparison of reference genomes | Total mapped | 17,459 (76.64%) |
| Multiple mapped | 362 (1.59%) | |
| Unique mapped | 17,097 (75.05%) | |
| Gene expression | All mapped genes | 4912 |
| All mapped isoforms | 12,274 | |
| Known isoforms | 5365 (43.71%) | |
| Novel isoforms | 226 (1.84%) | |
| New isoforms | 6683 (54.45%) |
Table 3.
The species distribution of the Nr annotation results.
| Genus | Name of Species | Number of Isoforms | Percentage (%) | |
|---|---|---|---|---|
| Individual | Generic Species | |||
| Bactrocera | B. dorsalis | 4663 | 41.82 | 44.88 |
| B. cucurbitae | 178 | 1.60 | ||
| B. latifrons | 98 | 0.88 | ||
| B. oleae | 65 | 0.58 | ||
| Ceratitis | C. capitata | 164 | 1.47 | 1.47 |
| Drosophila | D. melanogaster | 87 | 0.78 | 2.46 |
| D. grimshawi | 71 | 0.64 | ||
| D. persimilis | 58 | 0.52 | ||
| D. sechellia | 43 | 0.39 | ||
| D. busckii | 15 | 0.13 | ||
| Rhagoletis | R. zephyria | 26 | 0.23 | 0.23 |
Table 4.
KEGG pathway mapping for B. dorsalis.
| KEGG Category | Sub-Pathways | Genes |
|---|---|---|
| Metabolism (57.81%) | ||
| Metabolic pathways | 869 | |
| Biosynthesis of secondary metabolites | 367 | |
| Oxidative phosphorylation | 330 | |
| Biosynthesis of antibiotics | 317 | |
| Microbial metabolism in diverse environments | 309 | |
| Carbon metabolism | 278 | |
| Glycolysis/Gluconeogenesis | 246 | |
| Biosynthesis of amino acids | 200 | |
| Cellular processes (11.49%) | ||
| Phagosome | 159 | |
| Lysosome | 107 | |
| Endocytosis | 85 | |
| Peroxisome | 46 | |
| Focal adhesion | 17 | |
| Adherens junction | 17 | |
| Tight junction | 17 | |
| Regulation of actin cytoskeleton | 17 | |
| Quorum sensing | 8 | |
| Regulation of autophagy | 5 | |
| Gap junction | 3 | |
| Organismal systems (5.46%) | ||
| Phototransduction—fly | 82 | |
| Longevity regulating pathway—multiple species | 47 | |
| Dorso-ventral axis formation | 19 | |
| Platelet activation | 14 | |
| Leukocyte transendothelial migration | 14 | |
| Thyroid hormone signaling pathway | 14 | |
| Oxytocin signaling pathway | 14 | |
| Environmental information processing (8.71%) | ||
| ECM–receptor interaction | 61 | |
| Hippo signaling pathway—fly | 54 | |
| Wnt signaling pathway | 30 | |
| Two-component system | 28 | |
| FoxO signaling pathway | 22 | |
| ABC transporters | 17 | |
| Phosphatidylinositol signaling system | 16 | |
| TGF-beta signaling pathway | 16 | |
| Rap1 signaling pathway | 14 | |
| Hippo signaling pathway | 14 | |
| Genetic information processing (32.79%) | ||
| Ribosome | 280 | |
| RNA transport | 170 | |
| Protein processing in endoplasmic reticulum | 151 | |
| RNA degradation | 92 | |
| Proteasome | 76 | |
| Spliceosome | 74 | |
| Aminoacyl-tRNA biosynthesis | 62 | |
| Ubiquitin mediated proteolysis | 54 | |
| Protein export | 47 | |
| mRNA surveillance pathway | 40 |
Table 5.
Amount and distribution of SSR sites in the full-length transcriptome of B. dorsalis.
| Repeat Type | Repeat Number | Total | Percentage (%) | |||||||
|---|---|---|---|---|---|---|---|---|---|---|
| 4 | 5 | 6 | 7 | 8 | 9 | 10 | 11~14 | |||
| Dinucleotide | 365 | 253 | 80 | 55 | 12 | 14 | 779 | 39.38 | ||
| Trinucleotide | 706 | 118 | 33 | 10 | 8 | 875 | 44.24 | |||
| Tetranucleotide | 270 | 26 | 6 | 302 | 15.27 | |||||
| Pentanucleotide | 5 | 3 | 1 | 9 | 0.46 | |||||
| Hexanucleotide | 13 | 13 | 0.66 | |||||||
| Total | 288 | 735 | 490 | 286 | 90 | 63 | 12 | 14 | 1978 | 100.00 |
| Percentage (%) | 14.56 | 37.16 | 24.77 | 14.46 | 4.55 | 3.19 | 0.61 | 0.71 | ||
Table 6.
Primer sequences for microsatellite markers and optimal PCR conditions.
| Name | Motif Type | Primer Sequence | Tm (°C) | Size (bp) |
|---|---|---|---|---|
| BdSSR1 (Isoform 2924) | (TACA)4 | GGCAACCAATAGAACTGGGA | 53 | 280 |
| GTGCAAAAGTGTGTGCGTTT | ||||
| BdSSR2 (Isoform 3402) | (AAAC)4 | CGCGAATACTACGGACTTTAGG | 53 | 278 |
| CAACCTACCCACATCTACACACA | ||||
| BdSSR3 (Isoform 3866) | (TATG)4 | ATATCACCGCCGTAGCAAAC | 52 | 279 |
| TTGGCGTCAATCATAGCGTA | ||||
| BdSSR4 (Isoform 4371) | (ACAT)4 | TGCCATATGGTTGCATCAGT | 49 | 180 |
| GAAGCGCGAATGAACAAAAT | ||||
| BdSSR5 (Isoform 4367) | (CAG)5 | AAAGTAAATGTTGCGGTCGG | 51 | 258 |
| GTATAGCGCCGGTGATGAGT | ||||
| BdSSR6 (Isoform4777) | (ATAC)4 | AGCCCAGAAACTCACAGCAT | 50 | 197 |
| AACCGCAACAAAACAATTCC | ||||
| BdSSR7 (Isoform 4926) | (TA)7 | CGATAGCGCCCTATTTGTGT | 48 | 144 |
| CATTTGCGGTGCATTATTTG | ||||
| BdSSR8 (Isoform 5257) | (TAG)5 | TGTGACGGGTTGCTACCATA | 49 | 166 |
| CGCAAAAACAAGACCCAAAT | ||||
| BdSSR9 (Isoform 84) | (GGC6) | GCGACAAACAGTGCTTACGA | 53 | 233 |
| CCGCTGCTGTAAGAGGACTT | ||||
| BdSSR10 (Isoform 1104) | (AAC)6 | GCTTGTTGTTGTTGTGGTGG | 53 | 238 |
| ACGAAACGAGTGCGAAGAGT | ||||
| BdSSR11 (Isoform 1807) | (ATAC)5 | TTGAAACGCGTTGAAAAGTG | 50 | 269 |
| CGTTGCACTCAGGACTACGA | ||||
| BdSSR12 (Isoform 2327) | (TACA)4 | CATCGGGAAGTGCCAGTTAT | 52 | 264 |
| TGCCCAACATGTTATCTGGA | ||||
| BdSSR13 (Isoform 2402) | (ATTT)4 | GCTGGCCTACTCAGCGTATC | 53 | 217 |
| CTGCCCCGGTTAAAGTACAA | ||||
| BdSSR14 (Isoform 2859) | (ACAT)4 | GCGAAAGCGTAAAGGTGTGT | 47 | 132 |
| TTCAAAGTTAATGCGAAGCA | ||||
| BdSSR15 (Isoform2922) | (TACA)4 | GTGCAAAAGTGTGTGCGTTT | 51 | 155 |
| TCATCGGCCAATTCGAGTAT | ||||
| BdSSR16 (Isoform 2923) | (TACA)4 | GTGCAAAAGTGTGTGCGTTT | 51 | 155 |
| TCATCGGCCAATTCGAGTAT | ||||
| BdSSR17 (Isoform 2923) | (CAG)5 | GCAAGAAAAGCAGCAAAACC | 51 | 170 |
| GCTCGGCGAGTAACTCATTC | ||||
| BdSSR18 (Isoform 3194) | (CAAGAG)4 | GGCCAAACAGAATGAGGAAA | 51 | 200 |
| GCTACTACGCTTTCTTGCGG | ||||
| BdSSR19 (Isoform 3393) | (AGC)5 | CAATAGTGCGAGCAGTCGAA | 51 | 173 |
| GCAACGTTTCGTGATTCTCA | ||||
| BdSSR20 (Isoform 3695) | (GCTCCA)4 | TATACGGCTCCCTACATCGC | 54 | 181 |
| CACTTGGTGCAACCAGCTTA | ||||
| BdSSR21 (Isoform 3954) | (ACAT)4 | ACACACGAAGCGGAAGAGTT | 53 | 278 |
| CTGCCTCTCGTGTTTGCTTA | ||||
| BdSSR22 (Isoform 4461) | (GCT)6 | GTAATTGTGCCGTTCGAGGT | 53 | 217 |
| CCGGACTGCTATCCACATTT | ||||
| BdSSR23 (Isoform 4478) | (AAC)5 | GTCAGCTCTGGAGTCGGAAC | 55 | 249 |
| GGTGGTGTCTGTTGTCGTTG | ||||
| BdSSR24 (Isoform 4488) | (ATAC)5 | AGCAGCTGAAGAGGAAGTGC | 53 | 250 |
| TATGTAGAAACGGTTCGGGC | ||||
| BdSSR25 (Isoform 4513) | (ATAC)4 | GCGAAGCGGACAAAAGTTAG | 52 | 192 |
| TTTCTGCACTTCGCACTATCA | ||||
| BdSSR26 (Isoform 4606) | (CAG)5 | CAGCGAACAGGAGCACATTA | 50 | 236 |
| CGTATTGCATCATTTGTGGC | ||||
| BdSSR27 (Isoform 4611) | (CAG)5 | CAGCGAACAGGAGCACATTA | 50 | 236 |
| CGTATTGCATCATTTGTGGC | ||||
| BdSSR28 (Isoform 4614) | (CAG)5 | CAGCGAACAGGAGCACATTA | 50 | 236 |
| CGTATTGCATCATTTGTGGC | ||||
| BdSSR29 (Isoform 4621) | (AT)7 | TGTATGTACGCACACCAGCA | 51 | 114 |
| AACACAAATGCGGCTTCTTT | ||||
| BdSSR30 (Isoform 4621) | (CAG)5 | CAGCGAACAGGAGCACATTA | 50 | 236 |
| CGTATTGCATCATTTGTGGC | ||||
| BdSSR31 (Isoform 4654) | (TATG)4 | AGTTTTCGCTGCCGCTATTA | 52 | 214 |
| CGGCCATCTCGTAGGTATGT | ||||
| BdSSR32 (Isoform 4707) | (AC)6 | GCTAGTTTGACGATGAGGGC | 53 | 174 |
| CAGCACGTAATTTGCTGCAC | ||||
| BdSSR33 (Isoform 4731) | (ACAT)4 | TCCAACAGCAAATTCGACAA | 48 | 234 |
| TCTCATAAAAGCGCATACAAAAA | ||||
| BdSSR34 (Isoform 4932) | (CATA)4 | CAACGCTCACTCGCTCATTA | 49 | 190 |
| AATGTTCCGAATTTTCGTCG | ||||
| BdSSR35 (Isoform 4950) | (CAA)5 | GGTGCTGGTGGCAGTTTATT | 54 | 142 |
| TTGTTGTAGCGGTGGTGGTA | ||||
| BdSSR36 (Isoform 4980) | (CA)7 | TCCATGAGATCGAATGCAAA | 49 | 278 |
| CGATTCTAACTGCGAACGAA | ||||
| BdSSR37 (Isoform 4992) | (CAA) 5 | ACTCGCATTGAATGGACACA | 52 | 174 |
| AAATGATGCTGCTGCTGATG | ||||
| BdSSR38 (Isoform 5040) | (ATAC) 4 | GGATACTAGTGGTGGTCCGC | 54 | 175 |
| GCAGCTAGGATGCACAACAA | ||||
| BdSSR39 (Isoform 5126) | (TACA) 4 | ACAGCCGAGTTTGAGCTTGT | 50 | 245 |
| TTGCATGAAAAGCAAACACC | ||||
| BdSSR40 (Isoform 5749) | (GCT)5 | AAGACGAAGAAGATGCGGAA | 51 | 157 |
| AAGACGAAGAAGATGCGGAA | ||||
| BdSSR41 (Isoform 5805) | (AGC)5 | ACAGCAACAACAGCAACAGC | 55 | 225 |
| TGTGTGCTAGAAGACGCACC |
Table 7.
Dominant repeat types in different insects (incomplete statistics).
| Dominant Repeat Type | Order | Species | Frequency (%) | Omics Level | Reference |
|---|---|---|---|---|---|
| Mononucleotide | Hemiptera | Cimex lectularius | 18.68 | Transcriptome | Li et al., 2019 |
| Stephanitis nashi | 26.87 | Transcriptome | Xie et al., 2019 | ||
| Lepidoptera | Conopomorpha sinensis | 15.25 | Transcriptome | Meng et al., 2017 | |
| Mythimna separata | 11.51 | Transcriptome | Li et al., 2017 | ||
| Grapholitha molesta | 13.16 | Transcriptome | Leng et al., 2018 | ||
| Thysanoptera | Frankliniella occidentalis | 18.95 | Transcriptome | Duan et al., 2012 | |
| Coleoptera | Galeruca daurica | 5.36 | Transcriptome | Zhang et al., 2016 | |
| Tenebrio molitor | 1.67 | NA | Zhu et al., 2013 | ||
| Tribolium castaneum * | 10.87 | Transcriptome | Zhang et al., 2008 | ||
| Leptinotarsa decemlineata | NA | Genome | Liu et al., 2018 | ||
| Diptera | Sitodiplosis mosellana | 13.47 | Transcriptome | Duan et al., 2011 | |
| Anopheles sinensis | NA | Genome | Wang et al., 2016 | ||
| Homoptera | Phenacoccus solenopsis | 6.33 | Genome | Luo et al., 2014 | |
| Dinucleotide | Lepidoptera | Plodia interpunctell | 8.25 | Transcriptome | Tang et al., 2017 |
| Rhyacionia leptotubula | 3.09 | Transcriptome | Zhu et al., 2013 | ||
| Hemiptera | Arma chinensis | 7.6 | NA | Li et al., 2019 | |
| Orthoptera | Epacromius coerulipes | 44. 17 | Transcriptome | Jin et al., 2015 | |
| Gampsocleis gratiosa * | 18.64 | Transcriptome | Zhou et al., 2019 | ||
| Hymenoptera | Apis mellifera | 10.804 | Genome | Zhao et al., 2007 | |
| Trinucleotide | Coleoptera | Tomicus yunnanensis | 1.29 | Transcriptome | Yuan et al., 2014 |
| Anoplophora chinensis | 25.31 | Transcriptome | Han et al., 2019 | ||
| Eucryptorrhynchus chinensis | 10.36 | Transcriptome | Wu et al., 2016 | ||
| Lepidoptera | Dolerus aeneus | NA | NA | Cook et al., 2011 | |
| Athetis lepigone | 2.96 | NA | Li et al., 2013 | ||
| Mythimna separata | 1.93 | Transcriptome | Hu et al., 2015 | ||
| Plutella xylostella | 6.59 | Transcriptome | Ke et al., 2013 | ||
| Hemiptera | Nilaparvata lugens | NA | Transcriptome | Liu et al., 2010 | |
| Sclomina erinacea | 5.67 | NA | Li et al.,2019 | ||
| Homoptera | Laodelphax striatellus | NA | Transcriptome | Zhang et al., 2010 | |
| Orthoptera | Gampsocleis gratiosa * | 39.38 | Genome | Zhou et al., 2019 | |
| Diptera | Anopheles sinensis (2014) | NA | Transcriptome | Zhou et al., 2018 | |
| Bactrocera dorsalis | NA | Transcriptome | Wei et al., 2014 | ||
| Blattaria | Blattella germanica | NA | Genome | Wang et al.,2015 | |
| Tetranucleotide | Lepidoptera | Bombyx mori | 26.51 | Transcriptome | Mi et al., 2011 |
| Pentanucleotide | NA | NA | NA | NA | |
| Hexanucleotide | Coleoptera | Tribolium castaneum * | 13.65 | Genome | Zhang et al., 2008 |
| Hymenoptera | Bee (Apis) | 10.52 | Transcriptome | Li et al., 2004 |
Note: The * represents the frequency at different levels of omics of the same species. The NA means not available.
Publisher’s Note: MDPI stays neutral with regard to jurisdictional claims in published maps and institutional affiliations. |
© 2021 by the authors. Licensee MDPI, Basel, Switzerland. This article is an open access article distributed under the terms and conditions of the Creative Commons Attribution (CC BY) license (https://creativecommons.org/licenses/by/4.0/).
Share and Cite
MDPI and ACS Style
Ouyang, H.; Wang, X.; Zheng, X.; Lu, W.; Qin, F.; Chen, C. Full-Length SMRT Transcriptome Sequencing and SSR Analysis of Bactrocera dorsalis (Hendel). Insects 2021, 12, 938. https://0-doi-org.brum.beds.ac.uk/10.3390/insects12100938
AMA Style
Ouyang H, Wang X, Zheng X, Lu W, Qin F, Chen C. Full-Length SMRT Transcriptome Sequencing and SSR Analysis of Bactrocera dorsalis (Hendel). Insects. 2021; 12(10):938. https://0-doi-org.brum.beds.ac.uk/10.3390/insects12100938
Chicago/Turabian StyleOuyang, Huili, Xiaoyun Wang, Xialin Zheng, Wen Lu, Fengping Qin, and Chao Chen. 2021. "Full-Length SMRT Transcriptome Sequencing and SSR Analysis of Bactrocera dorsalis (Hendel)" Insects 12, no. 10: 938. https://0-doi-org.brum.beds.ac.uk/10.3390/insects12100938
Note that from the first issue of 2016, this journal uses article numbers instead of page numbers. See further details here.