
The Epidemiology and Genetics of Hyperuricemia and Gout across Major Racial Groups: A Literature Review and Population Genetics Secondary Database Analysis


Abstract
:
1. Introduction
2. Methods
2.1. Genetic Data Collection
2.2. SNP Selection
3. Statistical Analysis
Epidemiology of Hyperuricemia and Gout
4. Results
4.1. Hyperuricemia and Gout Risk Alleles Frequencies
4.2. Epidemiology of Hyperuricemia and Gout
4.2.1. Global Gout Epidemiology
4.2.2. U.S. Populations
4.2.3. African Populations
4.2.4. Asian Populations
4.2.5. Hispanic Populations
4.2.6. European Populations
5. Discussion
6. Limitations
7. Future Perspective
8. Conclusions
Author Contributions
Funding
Data Availability Statement
Acknowledgments
Conflicts of Interest
Abbreviations
| ASW | Africans in Southwest U.S. |
| CHARGE | Cohorts for Heart and Aging Research in Genomic Epidemiology |
| CHS | Southern Han-Chinese |
| COPCORD | Community Oriented Program for Control of Rheumatic Diseases |
| EUR | Europeans |
| GWAS | Genome Wide Association Studies |
| HU | Hyperuricemia |
| JPT | Japanese in Tokyo |
| MXL | Mexicans in California U.S. |
| NHANES | National Healthy and Nutrition Examination Survey |
| PAGE | Population Architecture using Genomics and Epidemiology |
| SU | Serum urate |
| SNP | Single nucleotide polymorphism |
References
- Jamnik, J.; Rehman, S.; Blanco Mejia, S.; de Souza, R.J.; Khan, T.A.; Leiter, L.A.; Wolever, T.M.; Kendall, C.W.; Jenkins, D.J.; Sievenpiper, J.L. Fructose intake and risk of gout and hyperuricemia: A systematic review and meta-analysis of prospective cohort studies. BMJ Open 2016, 6, e013191. [Google Scholar] [CrossRef]
- Ben Salem, C.; Slim, R.; Fathallah, N.; Hmouda, H. Drug-induced hyperuricaemia and gout. Rheumatology 2017, 56, 679–688. [Google Scholar] [CrossRef] [Green Version]
- Kuo, C.F.; See, L.C.; Luo, S.F.; Ko, Y.S.; Lin, Y.S.; Hwang, J.S.; Lin, C.M.; Chen, H.W.; Yu, K.H. Gout: An independent risk factor for all-cause and cardiovascular mortality. Rheumatology 2010, 49, 141–146. [Google Scholar] [CrossRef] [Green Version]
- Rahimi-Sakak, F.; Maroofi, M.; Rahmani, J.; Bellissimo, N.; Hekmatdoost, A. Serum uric acid and risk of cardiovascular mortality: A systematic review and dose-response meta-analysis of cohort studies of over a million participants. BMC Cardiovasc. Disord. 2019, 19, 218. [Google Scholar] [CrossRef] [Green Version]
- Kawai, T.; Ohishi, M.; Takeya, Y.; Onishi, M.; Ito, N.; Yamamoto, K.; Kamide, K.; Rakugi, H. Serum uric acid is an independent risk factor for cardiovascular disease and mortality in hypertensive patients. Hypertens. Res. 2012, 35, 1087–1092. [Google Scholar] [CrossRef] [Green Version]
- Chen-Xu, M.; Yokose, C.; Rai, S.K.; Pillinger, M.H.; Choi, H.K. Contemporary Prevalence of Gout and Hyperuricemia in the United States and Decadal Trends: The National Health and Nutrition Examination Survey, 2007–2016. Arthritis Rheumatol. 2019, 71, 991–999. [Google Scholar] [CrossRef] [PubMed]
- Krishnan, E.; Lienesch, D.; Kwoh, C.K. Gout in ambulatory care settings in the United States. J. Rheumatol. 2008, 35, 498–501. [Google Scholar]
- Rosenblatt, G.; Decker, J.L.; Healey, L.A., Jr. Gout in hospitalized Filipinos in Hawaii. Pac. Med. Surg. 1966, 74, 312–313. [Google Scholar]
- Healey, L.A.; Bayani-Sioson, P.S. A defect in the renal excretion of uric acid in Filipinos. Arthritis Rheum. 1971, 14, 721–726. [Google Scholar] [CrossRef] [PubMed]
- Shai, A.; Rimar, D.; Rozenbaum, M.; Wolfovitz, E.; Rosner, I. Gout in young migrant Filipino women in Israel: A changing epidemiology. Case reports and review of the literature. Rheumatol. Int. 2010, 30, 1685–1687. [Google Scholar] [CrossRef] [PubMed]
- Roman, Y.; Tiirikainen, M.; Prom-Wormley, E. The prevalence of the gout-associated polymorphism rs2231142 G>T in ABCG2 in a pregnant female Filipino cohort. Clin. Rheumatol. 2020, 39, 2387–2392. [Google Scholar] [CrossRef] [PubMed]
- Portis, A.J.; Laliberte, M.; Tatman, P.; Moua, M.; Culhane-Pera, K.; Maalouf, N.M.; Sakhaee, K. High prevalence of gouty arthritis among the Hmong population in Minnesota. Arthritis Care Res. 2010, 62, 1386–1391. [Google Scholar] [CrossRef] [PubMed]
- Roman, Y.M.; Culhane-Pera, K.A.; Menk, J.; Straka, R.J. Assessment of genetic polymorphisms associated with hyperuricemia or gout in the Hmong. Per. Med. 2016, 13, 429–440. [Google Scholar] [CrossRef] [Green Version]
- Teng, G.G.; Pan, A.; Yuan, J.M.; Koh, W.P. Food Sources of Protein and Risk of Incident Gout in the Singapore Chinese Health Study. Arthritis Rheumatol. 2015, 67, 1933–1942. [Google Scholar] [CrossRef] [Green Version]
- Rai, S.K.; Fung, T.T.; Lu, N.; Keller, S.F.; Curhan, G.C.; Choi, H.K. The Dietary Approaches to Stop Hypertension (DASH) diet, Western diet, and risk of gout in men: Prospective cohort study. BMJ 2017, 357, j1794. [Google Scholar] [CrossRef] [Green Version]
- Dalbeth, N.; House, M.E.; Gamble, G.D.; Horne, A.; Pool, B.; Purvis, L.; Stewart, A.; Merriman, M.; Cadzow, M.; Phipps-Green, A.; et al. Population-specific influence of SLC2A9 genotype on the acute hyperuricaemic response to a fructose load. Ann. Rheum. Dis. 2013, 72, 1868–1873. [Google Scholar] [CrossRef]
- Zhang, L.; Spencer, K.L.; Voruganti, V.S.; Jorgensen, N.W.; Fornage, M.; Best, L.G.; Brown-Gentry, K.D.; Cole, S.A.; Crawford, D.C.; Deelman, E.; et al. Association of functional polymorphism rs2231142 (Q141K) in the ABCG2 gene with serum uric acid and gout in 4 US populations: The PAGE Study. Am. J. Epidemiol. 2013, 177, 923–932. [Google Scholar] [CrossRef] [Green Version]
- Reginato, A.M.; Mount, D.B.; Yang, I.; Choi, H.K. The genetics of hyperuricaemia and gout. Nat. Rev. Rheumatol. 2012, 8, 610–621. [Google Scholar] [CrossRef]
- Tu, H.P.; Chen, C.J.; Tovosia, S.; Ko, A.M.; Lee, C.H.; Ou, T.T.; Lin, G.T.; Chang, S.J.; Chiang, S.L.; Chiang, H.C.; et al. Associations of a non-synonymous variant in SLC2A9 with gouty arthritis and uric acid levels in Han Chinese subjects and Solomon Islanders. Ann. Rheum. Dis. 2010, 69, 887–890. [Google Scholar] [CrossRef]
- Kim, Y.S.; Kim, Y.; Park, G.; Kim, S.K.; Choe, J.Y.; Park, B.L.; Kim, H.S. Genetic analysis of ABCG2 and SLC2A9 gene polymorphisms in gouty arthritis in a Korean population. Korean J. Intern. Med. 2015, 30, 913–920. [Google Scholar] [CrossRef] [PubMed]
- Zhou, Z.W.; Cui, L.L.; Han, L.; Wang, C.; Song, Z.J.; Shen, J.W.; Li, Z.Q.; Chen, J.H.; Wen, Z.J.; Wang, X.M.; et al. Polymorphisms in GCKR, SLC17A1 and SLC22A12 were associated with phenotype gout in Han Chinese males: A case-control study. BMC Med. Genet. 2015, 16, 66. [Google Scholar] [CrossRef] [Green Version]
- Phipps-Green, A.J.; Hollis-Moffatt, J.E.; Dalbeth, N.; Merriman, M.E.; Topless, R.; Gow, P.J.; Harrison, A.A.; Highton, J.; Jones, P.B.; Stamp, L.K.; et al. A strong role for the ABCG2 gene in susceptibility to gout in New Zealand Pacific Island and Caucasian, but not Maori, case and control sample sets. Hum. Mol. Genet. 2010, 19, 4813–4819. [Google Scholar] [CrossRef]
- Kolz, M.; Johnson, T.; Sanna, S.; Teumer, A.; Vitart, V.; Perola, M.; Mangino, M.; Albrecht, E.; Wallace, C.; Farrall, M.; et al. Meta-analysis of 28,141 individuals identifies common variants within five new loci that influence uric acid concentrations. PLoS Genet. 2009, 5, e1000504. [Google Scholar] [CrossRef] [Green Version]
- Kottgen, A.; Albrecht, E.; Teumer, A.; Vitart, V.; Krumsiek, J.; Hundertmark, C.; Pistis, G.; Ruggiero, D.; O’Seaghdha, C.M.; Haller, T.; et al. Genome-wide association analyses identify 18 new loci associated with serum urate concentrations. Nat. Genet. 2013, 45, 145–154. [Google Scholar] [CrossRef] [Green Version]
- Matsuo, H.; Nakayama, A.; Sakiyama, M.; Chiba, T.; Shimizu, S.; Kawamura, Y.; Nakashima, H.; Nakamura, T.; Takada, Y.; Oikawa, Y.; et al. ABCG2 dysfunction causes hyperuricemia due to both renal urate underexcretion and renal urate overload. Sci. Rep. 2014, 4, 3755. [Google Scholar] [CrossRef]
- Yi, X.L.; Li, J.; Meng, D.M.; Liu, Y.J.; Liu, Y.H.; Ma, H.M.; Yuan, Y.; Xing, S.C. An Intron Variant of SLC2A9 Increases the Risk for Type 2 Diabetes Mellitus Complicated with Hyperuricemia in Chinese Male Population. Iran. J. Public Health 2018, 47, 844–851. [Google Scholar]
- Yang, Q.O.; Kottgen, A.; Dehghan, A.; Smith, A.V.; Glazer, N.L.; Chen, M.H.; Chasman, D.I.; Aspelund, T.; Eiriksdottir, G.; Harris, T.B.; et al. Multiple Genetic Loci Influence Serum Urate Levels and Their Relationship with Gout and Cardiovascular Disease Risk Factors. Circ. Cardiovasc. Genet. 2010, 3, 523–530. [Google Scholar] [CrossRef] [PubMed]
- Li, M.; Li, Q.; Li, C.G.; Guo, M.; Xu, J.M.; Tang, Y.Y.; Zhao, Q.S.; Hu, Y.H.; Cheng, Z.F.; Zhang, J.C. Genetic polymorphisms in the PDZK1 gene and susceptibility to gout in male Han Chinese: A case-control study. Int. J. Clin. Exp. Med. 2015, 8, 13911–13918. [Google Scholar] [PubMed]
- Dehlin, M.; Jacobsson, L.; Roddy, E. Global epidemiology of gout: Prevalence, incidence, treatment patterns and risk factors. Nat. Rev. Rheumatol. 2020, 16, 380–390. [Google Scholar] [CrossRef]
- Kuo, C.F.; Grainge, M.J.; Zhang, W.; Doherty, M. Global epidemiology of gout: Prevalence, incidence and risk factors. Nat. Rev. Rheumatol. 2015, 11, 649–662. [Google Scholar] [CrossRef] [PubMed]
- Xia, Y.; Wu, Q.; Wang, H.; Zhang, S.; Jiang, Y.; Gong, T.; Xu, X.; Chang, Q.; Niu, K.; Zhao, Y. Global, regional and national burden of gout, 1990–2017: A systematic analysis of the Global Burden of Disease Study. Rheumatology 2020, 59, 1529–1538. [Google Scholar] [CrossRef]
- Safiri, S.; Kolahi, A.A.; Cross, M.; Carson-Chahhoud, K.; Hoy, D.; Almasi-Hashiani, A.; Sepidarkish, M.; Ashrafi-Asgarabad, A.; Moradi-Lakeh, M.; Mansournia, M.A.; et al. Prevalence, Incidence, and Years Lived With Disability Due to Gout and Its Attributable Risk Factors for 195 Countries and Territories 1990–2017: A Systematic Analysis of the Global Burden of Disease Study 2017. Arthritis Rheumatol. 2020, 72, 1916–1927. [Google Scholar] [CrossRef] [PubMed]
- Singh, G.; Lingala, B.; Mithal, A. Gout and hyperuricaemia in the USA: Prevalence and trends. Rheumatology 2019, 58, 2177–2180. [Google Scholar] [CrossRef]
- Mody, G.M.; Naidoo, P.D. Gout in South African blacks. Ann. Rheum. Dis. 1984, 43, 394–397. [Google Scholar] [CrossRef] [PubMed] [Green Version]
- Beighton, P.; Solomon, L.; Soskolne, C.L.; Sweet, M.B. Rheumatic disorders in the South African Negro. Part IV. Gout and hyperuricaemia. S. Afr. Med. J. 1977, 51, 969–972. [Google Scholar] [PubMed]
- Ndong Atome, G.R.; Ngoua Meye Misso, R.L.; Sima Obiang, C.; Onanga, R.; Nkogue Mba, D. Hyper-Uricemia and Gouty Access in the Adult Population of the Southeast of Gabon: Biochemical Aspects. Diseases 2018, 6, 19. [Google Scholar] [CrossRef] [Green Version]
- Samison, L.H.; Randriatsarafara, F.M.; Ralandison, S. Joint pain epidemiology and analgesic usage in Madagascar. Pan Afr. Med. J. 2017, 26, 77. [Google Scholar] [CrossRef]
- Kumar, A.U.A.; Browne, L.D.; Li, X.; Adeeb, F.; Perez-Ruiz, F.; Fraser, A.D.; Stack, A.G. Temporal trends in hyperuricaemia in the Irish health system from 2006–2014: A cohort study. PLoS ONE 2018, 13, e0198197. [Google Scholar] [CrossRef] [PubMed] [Green Version]
- Trifiro, G.; Morabito, P.; Cavagna, L.; Ferrajolo, C.; Pecchioli, S.; Simonetti, M.; Bianchini, E.; Medea, G.; Cricelli, C.; Caputi, A.P.; et al. Epidemiology of gout and hyperuricaemia in Italy during the years 2005–2009: A nationwide population-based study. Ann. Rheum. Dis. 2013, 72, 694–700. [Google Scholar] [CrossRef]
- Miao, Z.; Li, C.; Chen, Y.; Zhao, S.; Wang, Y.; Wang, Z.; Chen, X.; Xu, F.; Wang, F.; Sun, R.; et al. Dietary and lifestyle changes associated with high prevalence of hyperuricemia and gout in the Shandong coastal cities of Eastern China. J. Rheumatol. 2008, 35, 1859–1864. [Google Scholar]
- Liu, R.; Han, C.; Wu, D.; Xia, X.; Gu, J.; Guan, H.; Shan, Z.; Teng, W. Prevalence of Hyperuricemia and Gout in Mainland China from 2000 to 2014: A Systematic Review and Meta-Analysis. Biomed. Res. Int. 2015, 2015, 762820. [Google Scholar] [CrossRef] [PubMed] [Green Version]
- Hakoda, M.; Kasagi, F. Increasing trend of asymptomatic hyperuricemia under treatment with urate-lowering drugs in Japan. Mod. Rheumatol. 2019, 29, 880–884. [Google Scholar] [CrossRef] [PubMed]
- Higa, S.; Yoshida, M.; Shima, D.; Ii, Y.; Kitazaki, S.; Yamamoto, Y.; Fujimoto, Y. A Retrospective, Cross-Sectional Study on the Prevalence of Hyperuricemia Using a Japanese Healthcare Database. Arch. Rheumatol. 2020, 35, 41–51. [Google Scholar] [CrossRef] [PubMed] [Green Version]
- Julian-Santiago, F.; Garcia-Garcia, C.; Garcia-Olivera, I.; Goycochea-Robles, M.V.; Pelaez-Ballestas, I. Epidemiology of rheumatic diseases in Mixtec and Chontal indigenous communities in Mexico: A cross-sectional community-based study. Clin. Rheumatol. 2016, 35 (Suppl. 1), 35–42. [Google Scholar] [CrossRef] [Green Version]
- Cardiel, M.H.; Rojas-Serrano, J. Community based study to estimate prevalence, burden of illness and help seeking behavior in rheumatic diseases in Mexico City. A COPCORD study. Clin. Exp. Rheumatol. 2002, 20, 617–624. [Google Scholar] [PubMed]
- Healey, L.A.; Skeith, M.D.; Decker, J.L.; Bayani-Sioson, P.S. Hyperuricemia in Filipinos: Interaction of heredity and environment. Am. J. Hum. Genet. 1967, 19, 81–85. [Google Scholar]
- Kuo, C.F.; Grainge, M.J.; See, L.C.; Yu, K.H.; Luo, S.F.; Zhang, W.; Doherty, M. Epidemiology and management of gout in Taiwan: A nationwide population study. Arthritis Res. Ther. 2015, 17, 13. [Google Scholar] [CrossRef] [Green Version]
- Dehlin, M.; Drivelegka, P.; Sigurdardottir, V.; Svard, A.; Jacobsson, L.T. Incidence and prevalence of gout in Western Sweden. Arthritis Res. Ther. 2016, 18, 164. [Google Scholar] [CrossRef] [Green Version]
- Zaidi, F.; Narang, R.K.; Phipps-Green, A.; Gamble, G.G.; Tausche, A.K.; So, A.; Riches, P.; Andres, M.; Perez-Ruiz, F.; Doherty, M.; et al. Systematic genetic analysis of early-onset gout: ABCG2 is the only associated locus. Rheumatology 2020, 59, 2544–2549. [Google Scholar] [CrossRef] [PubMed]
- Wrigley, R.; Phipps-Green, A.J.; Topless, R.K.; Major, T.J.; Cadzow, M.; Riches, P.; Tausche, A.K.; Janssen, M.; Joosten, L.A.B.; Jansen, T.L.; et al. Pleiotropic effect of the ABCG2 gene in gout: Involvement in serum urate levels and progression from hyperuricemia to gout. Arthritis Res. Ther. 2020, 22, 45. [Google Scholar] [CrossRef] [Green Version]
- Kannangara, D.R.; Phipps-Green, A.J.; Dalbeth, N.; Stamp, L.K.; Williams, K.M.; Graham, G.G.; Day, R.O.; Merriman, T.R. Hyperuricaemia: Contributions of urate transporter ABCG2 and the fractional renal clearance of urate. Ann. Rheum. Dis. 2016, 75, 1363–1366. [Google Scholar] [CrossRef] [Green Version]
- Chen, C.J.; Tseng, C.C.; Yen, J.H.; Chang, J.G.; Chou, W.C.; Chu, H.W.; Chang, S.J.; Liao, W.T. ABCG2 contributes to the development of gout and hyperuricemia in a genome-wide association study. Sci. Rep. 2018, 8, 3137. [Google Scholar] [CrossRef]
- Liu, J.; Yang, W.; Li, Y.; Wei, Z.; Dan, X. ABCG2 rs2231142 variant in hyperuricemia is modified by SLC2A9 and SLC22A12 polymorphisms and cardiovascular risk factors in an elderly community-dwelling population. BMC Med. Genet. 2020, 21, 54. [Google Scholar] [CrossRef]
- Vitart, V.; Rudan, I.; Hayward, C.; Gray, N.K.; Floyd, J.; Palmer, C.N.; Knott, S.A.; Kolcic, I.; Polasek, O.; Graessler, J.; et al. SLC2A9 is a newly identified urate transporter influencing serum urate concentration, urate excretion and gout. Nat. Genet. 2008, 40, 437–442. [Google Scholar] [CrossRef]
- Mobasheri, A.; Neama, G.; Bell, S.; Richardson, S.; Carter, S.D. Human articular chondrocytes express three facilitative glucose transporter isoforms: GLUT1, GLUT3 and GLUT9. Cell Biol. Int. 2002, 26, 297–300. [Google Scholar] [CrossRef] [PubMed]
- Urano, W.; Taniguchi, A.; Anzai, N.; Inoue, E.; Sekita, C.; Endou, H.; Kamatani, N.; Yamanaka, H. Association between GLUT9 and gout in Japanese men. Ann. Rheum. Dis. 2010, 69, 932–933. [Google Scholar] [CrossRef] [PubMed]
- Takeuchi, F.; Yamamoto, K.; Isono, M.; Katsuya, T.; Akiyama, K.; Ohnaka, K.; Rakugi, H.; Yamori, Y.; Ogihara, T.; Takayanagi, R.; et al. Genetic impact on uric acid concentration and hyperuricemia in the Japanese population. J. Atheroscler. Thromb. 2013, 20, 351–367. [Google Scholar] [CrossRef] [Green Version]
- Phipps-Green, A.J.; Merriman, M.E.; Topless, R.; Altaf, S.; Montgomery, G.W.; Franklin, C.; Jones, G.T.; van Rij, A.M.; White, D.; Stamp, L.K.; et al. Twenty-eight loci that influence serum urate levels: Analysis of association with gout. Ann. Rheum. Dis. 2016, 75, 124–130. [Google Scholar] [CrossRef]
- Beer, N.L.; Tribble, N.D.; McCulloch, L.J.; Roos, C.; Johnson, P.R.; Orho-Melander, M.; Gloyn, A.L. The P446L variant in GCKR associated with fasting plasma glucose and triglyceride levels exerts its effect through increased glucokinase activity in liver. Hum. Mol. Genet. 2009, 18, 4081–4088. [Google Scholar] [CrossRef] [Green Version]
- Chen, G.; Shriner, D.; Doumatey, A.P.; Zhou, J.; Bentley, A.R.; Lei, L.; Adeyemo, A.; Rotimi, C.N. Refining genome-wide associated loci for serum uric acid in individuals with African ancestry. Hum. Mol. Genet. 2020, 29, 506–514. [Google Scholar] [CrossRef] [PubMed]
- MacFarlane, L.A.; Kim, S.C. Gout: A review of nonmodifiable and modifiable risk factors. Rheum. Dis. Clin. N. Am. 2014, 40, 581–604. [Google Scholar] [CrossRef] [Green Version]
- Roman, Y.M. The Daniel K. Inouye College of Pharmacy Scripts: Perspectives on the Epidemiology of Gout and Hyperuricemia. Hawaii J. Med. Public Health 2019, 78, 71–76. [Google Scholar] [PubMed]
- Major, T.J.; Topless, R.K.; Dalbeth, N.; Merriman, T.R. Evaluation of the diet wide contribution to serum urate levels: Meta-analysis of population based cohorts. BMJ 2018, 363, k3951. [Google Scholar] [CrossRef] [Green Version]
- Major, T.J.; Dalbeth, N.; Stahl, E.A.; Merriman, T.R. An update on the genetics of hyperuricaemia and gout. Nat. Rev. Rheumatol. 2018, 14, 341–353. [Google Scholar] [CrossRef]

| Gene (Protein) | Protein Function | SNP * | SNP Effect | References |
|---|---|---|---|---|
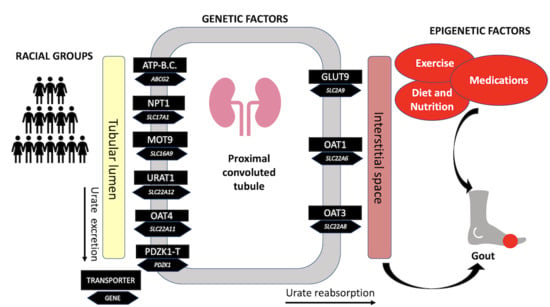
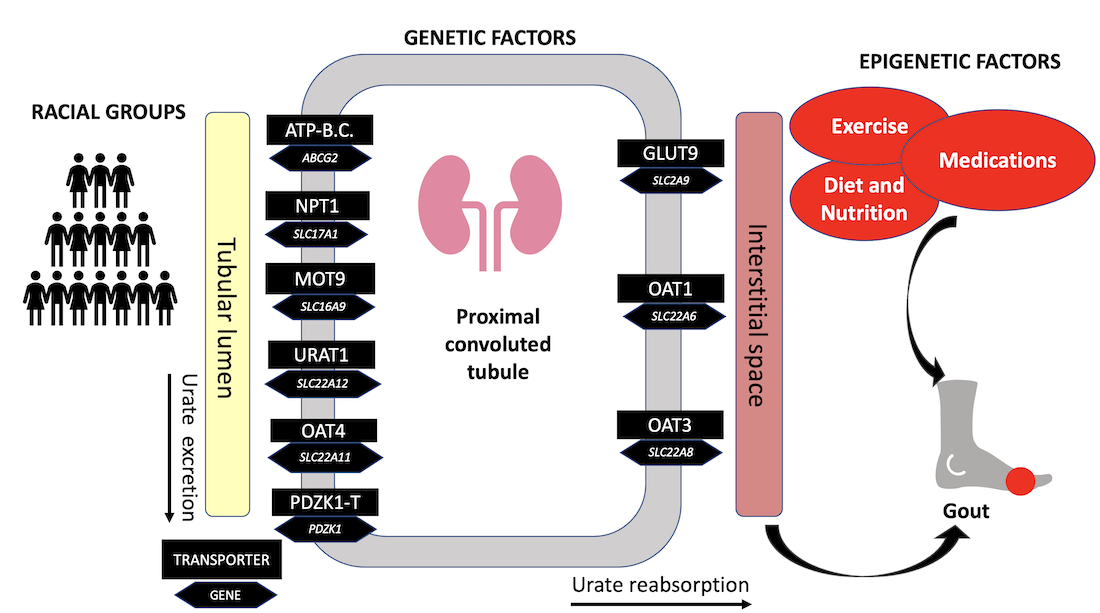
| ABCG2 (ABCG2) | Major urate efflux transporter expressed in the kidney, liver, and gastrointestinal tract. | rs2231142 (G > T) | Missense variant resulting in Q141K (Glu141Lys) amino acid substitution leading to a reduction in ABCG2-mediated urate transport, urate under-excretion, hyperuricemia, and gout. | [23,24,25] |
| SLC2A9 (GLUT9) | High-capacity urate, fructose, and glucose transporter expressed in liver, kidney, chondrocytes tissues shown to be strongly associated with hyperuricemia and gout. | rs734553 (G > T) | Intronic variant associated with increased susceptibility to gout due to altered transporter affinity for urate. | [23,26] |
| SLC16A9 (MCT9) | Monocarboxylic acid transporter protein across cell membranes. | rs1171614 (C > T) | 5′ untranslated region (UTR) variant associated with lower serum urate concentrations in individuals of European ancestry. | [14,23] |
| SLC17A1 (NPT1) | Uric acid transport protein localized at the apical membrane of the renal proximal tubule. | rs1183201 (T > A) | Intronic variant reported being in high linkage disequilibrium (r2 = 0.97) with rs1165205, an intronic SNP in SLC17A3 found to be associated with SU levels and gout risk factors. | [21,23] |
| SLC22A11 (OAT4) | An organic anion-dicarboxylate exchanger mediates transport across the apical membrane of the kidney. | rs2078267 (C > T) | Noncoding transcript exon variant associated with lower SU levels in individuals of European ancestry. | [23] |
| SLC22A12 (URAT1) | Major urate transporter that mediates the non-voltage dependent exchange of urate for several organic anions, localized at the apical membrane of the renal proximal tubule | rs505802 (C > T) | Intergenic variant associated with lower serum urate concentrations in individuals of European ancestry. | [23] |
| GCKR (GCKR) | Glucokinase regulator associated with metabolic traits such as insulin resistance that may be linked to urate concentrations | rs1260326 (C > T) | Missense variant that causes a Leu446Pro amino acid substitution within the glucokinase regulatory protein gene. Associated with lower fasting glucose levels and higher risk for elevated triglyceride levels, SU, and gout (OR = 1.39, 95%CI 1.23;1.57). | [23,24,25] |
| INHBC (INHBC) | Member of the transforming growth factor ß superfamily that may inhibit activin A signaling, affecting a variety of biologic functions including pituitary hormone secretion and insulin secretion. | rs3741414 (C > T) | 3′ untranslated region (UTR) variant was reported to interact with OAT4, URAT1, and NTP1 via their C-terminal PDZ motifs and was found to have an association with SU levels. | [24,27] |
| RREB1 (RREB1) | Zinc finger transcription factor that binds to gene promoters and regulates calcitonin gene and androgen receptor. | rs675209 (C > T) | Intergenic variant associated with a higher risk for gout in individuals of European ancestry. | [24,27] |
| PDZK1 (PDZ) | Scaffolding protein forms a bidirectional urate transport system to maintain balanced urate levels at the apical membrane of renal proximal tubules. | rs12129861 (C > T) | Intergenic variant inked with lower serum urate concentrations in individuals of European ancestry. | [23,28] |
| NRXN2 (Neurexin 2) | Member of the neurexin gene family that serves as a cell adhesion molecule. | rs478607 (G > A) | Missense variant associated with higher serum urate concentrations in individuals of Chinese descent. | [24] |
| Gene (SNP) | Variant Type | Allele * | EUR % (n) | ASW % (n) | CHS % (n) | JPT % (n) | MXL % (n) | Gout/Urate Effect (↑↓) |
|---|---|---|---|---|---|---|---|---|
| ABCG2 (rs2231142 G > T) | missense | G T | 90.6 (911) 9.4 (95) | 92.6 (113) 7.4 (9) | 74.3 (156) * 25.7 (54) | 67.8 (141) * 32.2 (67) | 79.7 (102) * 20.3 (26) | ↑ |
| SLC2A9 (rs734553 G > T) | intronic | G T | 24.5 (246) 75.5 (760) | 46.7 (57) * 53.3 (65) | 1.4 (3) * 98.6 (207) | 0.5 (1)* 95.5 (207) | 38.3 (49) * 61.7 (79) | ↑ |
| SLC17A1 (rs1183201 T > A) | intronic | A T | 46.1 (464) 53.9 (542) | 12.3 (15) * 87.7 (107) | 11.9 (25) * 88.1 (185) | 16.3 (34) * 83.7 (174) | 29.7 (38) * 70.3 (90) | ↓ |
| SLC16A9 (rs1171614 C > T) | intronic | T C | 24.2 (244) 75.8 (762) | 23 (28) 77 (94) | — 100 (210)* | — 100 (208)* | 10.2 (13) * 89.8 (115) | ↓ |
| GCKR (rs1260326 C > T) | missense | T C | 41.1 (413) 58.9 (593) | 9.8 (12) * 90.2 (110) | 50 (105) 50 (105) | 58.2 (121) * 41.8 (87) | 35.2 (45) 64.8 (83) | ↑ |
| SLC22A11 (rs2078267 C > T) | non-coding transcript exon | C T | 46.9 (472) 53.1 (534) | 85.2 (104) * 14.8 (18) | 98.1 (206) * 1.9 (4) | 98.1 (204) * 1.9 (4) | 75.8 (97) * 24.2 (31) | ↓ |
| SLC22A12 (rs505802 C > T) | intergenic | T C | 70.7 (711) 29.3 (295) | 35.2 (43) * 64.8 (79) | 29.9 (48) * 77.1 (162) | 17.8 (37) * 82.2 (171) | 50 (64) * 50 (64) | ↓ |
| INHBC (rs3741414 C > T) | 3 prime UTR | C T | 80.5 (810) 19.5 (196) | 86.9 (106) 13.1 (16) | 91.4 (192) * 8.6 (18) | 94.2 (196) * 5.8 (12) | 53.1 (68) * 46.9 (60) | ↓ |
| RREB1 (rs675209 C > T) | intergenic variant | T C | 26.9 (271) 73.1 (735) | 42.6 (52) * 57.4 (70) | 91.4 (192) * 8.6 (18) | 92.3 (192) * 7.7 (16) | 47.7 (61) * 52.3 (67) | ↑ |
| PDZK1 (rs12129861 C > T) | intergenic | C T | 54.1 (544) 45.9 (462) | 64.8 (79) 35.2 (43) | 78.1(164) * 21.9 (46) | 91.3 (190) * 8.7 (18) | 64.1 (82) 35.9 (46) | ↓ |
| NRXN2 (rs478607 G > A) | Intronic | G A | 15.4 (155) 84.6 (851) | 46.7 (57) * 53.3 (65) | 17.1 (36) 82.9 (174) | 24.5 (51) * 75.5 (157) | 13.3 (17) 86.7 (111) | ↓ |
| Gene (SNP) * | Genotype | EUR (Reference) % (n) | ASW % (n) | CHS % (n) | JPT % (n) | MXL % (n) |
|---|---|---|---|---|---|---|
| ABCG2 (rs2231142 G > T) | GG GT TT | 82.3 (414) 16.5 (83) 1.2 (6) | 85.2 (52) 14.8 (9) — | 56.2 (59) * 36.2 (38) 7.6 (8) | 43.3 (45) * 49 (51) 7.7 (8) | 64.1 (41) * 31.2 (20) 4.7 (3) |
| SLC2A9 (rs734553 T > G) | GG GT TT | 5.6 (28) 38.7 (190) 56.7 (285) | 24.6 (15) * 44.3 (27) 31.1 (19) | — 2.9 (3) * 97.1 (102) | — 1 (1) * 99 (103) | 17.2 (11) 42.2 (27) 40.6 (26) |
| SLC17A1 (rs1183201 T > A) | AA AT TT | 23.1 (116) 46.1 (232) 30.8 (155) | 1.6 (1) * 2.13 (13) 77 (47) | 1.9(2) * 20 (21) 78.1 (82) | 3.8 (4) * 25 (26) 71.2 (74) | 10.9 (7) 37.5 (24) 51.6 (33) |
| SLC16A9 (rs1171614 C > T) | TT CT CC | 5.8 (29) 36.8 (185) 57.5 (289) | 4.9 (3) 36.1 (22) 59 (36) | — — 100 (105)* | — — 100 (104) * | — 20.3 (13) 79.7 (51) |
| GCKR (rs1260326 C > T) | TT CT CC | 15.7 (79) 50.7 (255) 33.6 (169) | 80.3 (49) * 19.7 (120) — | 20 (21) 60 (63) 20 (21) | 35.6 (37) * 45.2 (47) 19.2 (20) | 14.1 (9) 42.2 (27) 43.8 (28) |
| SLC22A11 (rs2078267 C >T) | CC CT TT | 23.9 (120) 46.1 (232) 30 (151) | 72.1 (44) * 26.2 (16) 1.6 (1) | 96.2 (10) 3.8 (4) — | 96.2 (100) * 3.8 (4) — | 60.9 (39) * 29.7 (19) 9.4 (6) |
| SLC22A12 (rs505802 C > T) | TT CT CC | 51.3 (258) 38.8 (195) 9.9 (50) | 13.1 (8) * 44.3 (27) 42.6 (26) | 6.7 (7) * 32.4 (34) 61 (64) | 1 (1) * 33.7 (35) 65.4 (68) | 23.4 (15) 53.1 (34) 23.4 (15) |
| INHBC (rs3741414 C > T) | CC CT TT | 65 (327) 31 (156) 4 (20) | 75.4 (46) 23 (14) 1.6 (1) | 83.8 (88) 15.2 (16) 1 (1) | 89.4 (93) * 9.6 (10) 1 (1) | 29.7 (19) * 46.9 (30) 23.4 (15) |
| RREB1 (rs675209 T > C) | TT CT CC | 8.5 (43) 36.8 (185) 54.7 (275) | 19.7 (12) 45.9 (28) 34.4 (21) | 84.8 (89) * 13.3 (14) 1.9 (2) | 85.6 (89) * 13.5 (14) 1 (1) | 23.4 (15) 48.4 (31) 28.1 (81) |
| PDZK1 (rs10910845 G > T) | TT GT GG | 26.6 (134) 45.3 (228) 28 (141) | 52.5 (32) * 42.6 (26) 4.9 (3) | 71.4 (75) * 24.8 (26) 3.8 (4) | 89.4 (93) * 9.6 (10) 1 (1) | 35.9 (23) 45.3 (29) 18.8 (12) |
| NRXN2 (rs478607 G > A) | GG GA AA | 2.6 (13) 25.6 (129) 71.8 (361) | 19.7 (12) * 54.1 (33) 26.2 (16) | 3.8 (4) 26.7 (28) 69.5 (73) | 4.8 (5) 39.4 (41) 55.8 (58) | 4.7 (3) 17.2 (11) 78.1 (50) |
| EUR | ASW | CHS | JPT | MXL | |
|---|---|---|---|---|---|
| Count of significantly different alleles (Ns) from EUR | Reference (11 SNPs) | 63.6% (7/11) | 81.8% (9/11) | 100% (11/11) | 72.7% (8/11) |
| Cumulative risk allele * index | 5 | 9 | 11 | 6 | |
| Percentage of risk allele * | 71.4% (5/7) | 100.0% (9/9) | 100.0% (11/11) | 75.0% (6/8) |
| European a | African b | Chinese c | Japanese d | Mexican f | |
|---|---|---|---|---|---|
| HU | 11.9–25.0 | 30.6 | 13.1–13.3 | 26.8 | 20.6 |
| Gout | 0.3–4.7 | -- | 1.14 | 0.09–1.6 | 0.4 |
| References | [30,38,39] | [36] | [40,41] | [42,43] | [33,44] |
Publisher’s Note: MDPI stays neutral with regard to jurisdictional claims in published maps and institutional affiliations. |
© 2021 by the authors. Licensee MDPI, Basel, Switzerland. This article is an open access article distributed under the terms and conditions of the Creative Commons Attribution (CC BY) license (http://creativecommons.org/licenses/by/4.0/).
Share and Cite
Butler, F.; Alghubayshi, A.; Roman, Y. The Epidemiology and Genetics of Hyperuricemia and Gout across Major Racial Groups: A Literature Review and Population Genetics Secondary Database Analysis. J. Pers. Med. 2021, 11, 231. https://0-doi-org.brum.beds.ac.uk/10.3390/jpm11030231
Butler F, Alghubayshi A, Roman Y. The Epidemiology and Genetics of Hyperuricemia and Gout across Major Racial Groups: A Literature Review and Population Genetics Secondary Database Analysis. Journal of Personalized Medicine. 2021; 11(3):231. https://0-doi-org.brum.beds.ac.uk/10.3390/jpm11030231
Chicago/Turabian StyleButler, Faven, Ali Alghubayshi, and Youssef Roman. 2021. "The Epidemiology and Genetics of Hyperuricemia and Gout across Major Racial Groups: A Literature Review and Population Genetics Secondary Database Analysis" Journal of Personalized Medicine 11, no. 3: 231. https://0-doi-org.brum.beds.ac.uk/10.3390/jpm11030231