1. Rationale
Gene duplication is recognised since many decades as a key mechanism of evolution [
1,
2,
3,
4]. It has been found to be relevant for the major evolutionary transitions, for speciation, for opening new physiological and ecological opportunities and for short time-scale adaptation. Gene duplication can alter gene dosage, rescue gene function, and lead to evolution of new genetic networks, and to the re-wiring or modulation of existing ones. While it is still unclear if the first cellular organisms had many or few genes, it seems plausible to assume that all genes were initially present in a single copy, and it is clear that present-day gene families are a result of ongoing, and lineage-specific, duplication and loss. Whether this process is mostly neutral, or driven by natural selection, is controversial [
4,
5,
6]. It can act on short evolutionary time-scales and gene family sizes can substantially differ even between closely related sister species, as for instance observed in
Drosophila [
7]. Many more examples are found in the vast literature on gene duplication and multi gene families, see for example [
8]. Here, we focus on very large families and pay special attention to tandemly arrayed gene clusters in these families.
One massive expansion of such a family, supposedly acting in innate immunity, was recently described in the zebrafish [
9]. Based on an initial analysis by Stein et al. [
10], about 400 NLR-B30.2 genes have been identified in the fish genome. Only a small part of them are found as orthologues in the closely related carp genome. Curiously, the vast majority (227) of the zebrafish NACHT-domain and leucine-rich-repeat-containing (NLR) genes are densely packed on one arm of chromosome 4, interspersed with a family of diverse, but so far not characterised, zinc finger genes. Such clusters are a consequence of tandem duplication and non-homologous cross-over. Different rates and patterns of subsequent gene conversion can lead to both diversification or homogenisation, in particular of young paralogues [
9,
11]. The existence of large clusters of duplicated genes is known not only from vertebrates, but also from other eukaryotes, for example the nematode model organism
Ceanorhabditis elegans [
12]. Many of the clustered gene families found in this nematode appeared to be lineage specific expansions (“in-paralogues”) and the ones in the largest clusters were tentatively connected to environmental interaction, for instance the P450, and F-Box genes, or the G-coupled receptors [
12].
However, to our knowledge, such an ultra large multi gene family as the NLR-B30.2 genes in zebrafish, with one large cluster dominating a whole chromosomal arm, has not been described before in Metazoa. Thus, it is an obvious question to ask whether this is a singular case in zebrafish or if there are other examples of huge gene-families, with hundreds of members, which are organised in genomic clusters.
The sheer number of genes found in some of these clusters also leads to the question if functional diversification, potentially in some domains, is beneficial and the inflation of the family is selectively favoured. Alternatively, most of the duplicates could be redundant and neutral, or even deleterious, for the organism. Thus, these genes should be prone for pseudo-geneisation and eventual loss. Another possibility is that the ultimate selfish gene, like transposable elements, is one that is propagating itself not only vertically, across time, but also laterally, across the genome, as a genomic parasite.
The latter is again especially interesting in the zebrafish as most of the NLR genes not residing on chromosome 4 are clustered within 15% of the ends of other chromosomes. A prevalence for insertion in telomeric regions is known for transposable elements [
13]. It is thus conceivable that NLR genes from chromosome 4 are spawned into other regions of the zebrafish genome, where they proliferate into new clusters.
2. Results
To form an opinion about how special the situation in the zebrafish genome truly is, we conducted a survey in other species with well annotated genomes to search for families with large sets of clustered genes. NLR genes are in particular interesting for this, as they have also been reported as expanded in phylogenetically very different groups of animals, such as the sea urchin
Strongilocentrotus purpuratus and the sponge
Amphimedon queensladica [
14,
15]. While one can analyse the independent evolution of these genes in different organisms, it is unfortunately not possible to trace this gene family through well-annotated model species genomes. They were neither described in large numbers in the model genera
Caenorhabditis, nor in
Drosophila, nor the great apes. To get an overview of ultra-large gene families we decided to not exclusively concentrate on NLR family genes but to also include other large gene families.
We analysed a set of phylogenetically distant species: the acraniate
Branchiostoma floridae, the coral
Acropora digitifera, the sponge
Amphimedon queenslandica, the carp
Cyprinus carpio, and the sea urchin
Strongylocentrotus purpuratus. We also re-analysed several fish species (see [
9] for initial analysis), which are separated by a few hundred Myr of divergence, namely the pike
Esox lucius, the torafugu
Takifugu rubripes, the cichlid
Maylandia zebra, the spotted gar
Lepisosteus oculatus, the cavefish
Astianax mexicanus, and the model organisms medaka
Oryzias latipes and killifish
Nothobranchius furzeri. We complemented this with comparisons on shorter time scales by analysing selected taxa of animals from primates, nematodes and diptera, containing the model organisms
Caenorhabditis elegans,
Drosophila melanogaster and
Homo sapiens. Details are described in Methods.
In
C. elegans inflations of F-box and T-box transcription factors, and of nuclear hormone receptors have been reported [
16]. We were interested to see if these genes expanded throughout the genus or only in lineages leading to single species. To complement manual data screening of the InterProScan output, we applied a Fisher’s exact test to test for enrichment of Pfam domains in pairwise species comparisons. We performed pairwise comparisons of 15 species to identify additional cases of species-specific gene expansions (
Table 1). Using this method, we recovered, for example, F-box genes as extremely expanded in
C. remanei. Another example are fibronectins in human (
n = 970). However, these 970 human fibronectin domains collapsed into 123 genes widely dispersed throughout the entire genome when we removed redundancy.
Manually mining the InterProScan output, we divided the inflated gene families into three different size fractions: 150–200 genes, 200–400 genes, and more than 400 genes (
Figure 1). Comparing the divergence in gene family sizes (see Methods) to substitution rates on branches leading to single species in all three analysed taxa (genera
Caenorhabditis and
Drosophila, and the great apes;
Table 2) we found no correlation between these two measures. In
Drosophila we observe Pearson’s correlation between family size divergence and substitution rates of
r = 0.12 (0.82) for the whole-genome comparison and of
r = 0.08 (0.87) (
p-values in parentheses) for the single-gene (SSU 18S rRNA) comparison. In the great apes we measured
r = −0.35 (0.33) for the whole-genome comparison and
r = 0.005 (0.99) for the single-gene comparison. Only, in the nematodes we see a marginally significant correlation. However, the results for the whole-genome and for the single-gene comparison are contradictory: we observe
r = −0.51 (0.05) for the whole-genome comparison, and
r = 0.49 (0.06) for the single gene comparison (
Figure 1B). In fact, we measure a negative correlation (
r = −0.47 (0.08)) even between the single-gene and whole-genome substitution rates. This discrepancy may be due to the difficulties in correctly estimating substitution rates based on whole-genome comparisons, in particular with unfinished genomes, or it might be that the 18S rRNAs in the analysed nematodes are evolving unusually fast. Another striking observation in
Caenorhabditis is the high dissimilarity in the inflated gene families. It thus appears that inflation and deflation of gene families are highly specific to species-lineages. While this holds in particular for
Caenorhabditis (average divergence/substitution rate ratio of 24.75), it is also true—yet to a somewhat lesser extent—for the primate species (ratio 17.27). In contrast,
Drosophila species show only a slightly inflated gene family size divergence compared to the nucleotide substitution rate (ratio 1.95). This is more than a twelve-fold difference compared to the nematodes, which cannot exclusively be attributed to different depths of the phylogenies. Genome-wide nucleotide substitution rates and estimated divergence times in generations between the most distant species differ by a factor of less than two between the nematode (av. substitution rate in all pairwise comparisons including the root of the phylogeny: 0.127) and
Drosophila (av. substitution rate = 0.072) clades. When considering only the 18S SSU instead of the whole genome substitution rate, the numbers are even closer: 0.023 for the nematodes, and 0.019 for
Drosophila. Hence, gene family divergence in
Drosophila appears to be much more constrained than in nematodes. One potential reason for this observation could be linked to different reproductive modes — androdioecious hermaphrodites and gonochoristic nematodes compared to obligatory gonochoristic flies. However, whether this is indeed the case has still to be explored. Possibly, also life-style and host-association could play a role. Compared to the nematodes and flies, the primate phylogeny is much shallower in terms of generation time divergence (0.031 for the whole genome comparisons, and 0.009 for the 18S SSU comparisons). In spite of the short phylogenetic branches, gene families are considerably diverged in size. Furthermore, gene family sizes are completely uncorrelated from the substitution rate patterns, even on the relatively short time-scale of the primate phylogeny. This corroborates the view that gene family evolution is lineage- and even species-specific, and that phylogenetic signals are quickly blurred. If gene family size is shaped by selection, then the selective forces at work must be quite distinct from genome-wide background selection.
To further explore our data, we checked if gene families belonging to the different size fractions might also be functionally distinct. We find that in all classes genes in the inflated families, and the encoded proteins, have the potential to mediate interactions between cells and the environment, including host pathogen interactions (
Supplementary Excel file 1).
Clearly, it is technically difficult to identify, distinguish, and to correctly assemble and map all paralogues in large gene clusters. However, even if genome assemblies and gene maps are still preliminary for many organisms, we do find a discrete number of examples—albeit surprisingly few—which are comparable in number and genomic clustering to the zebrafish NLR case.
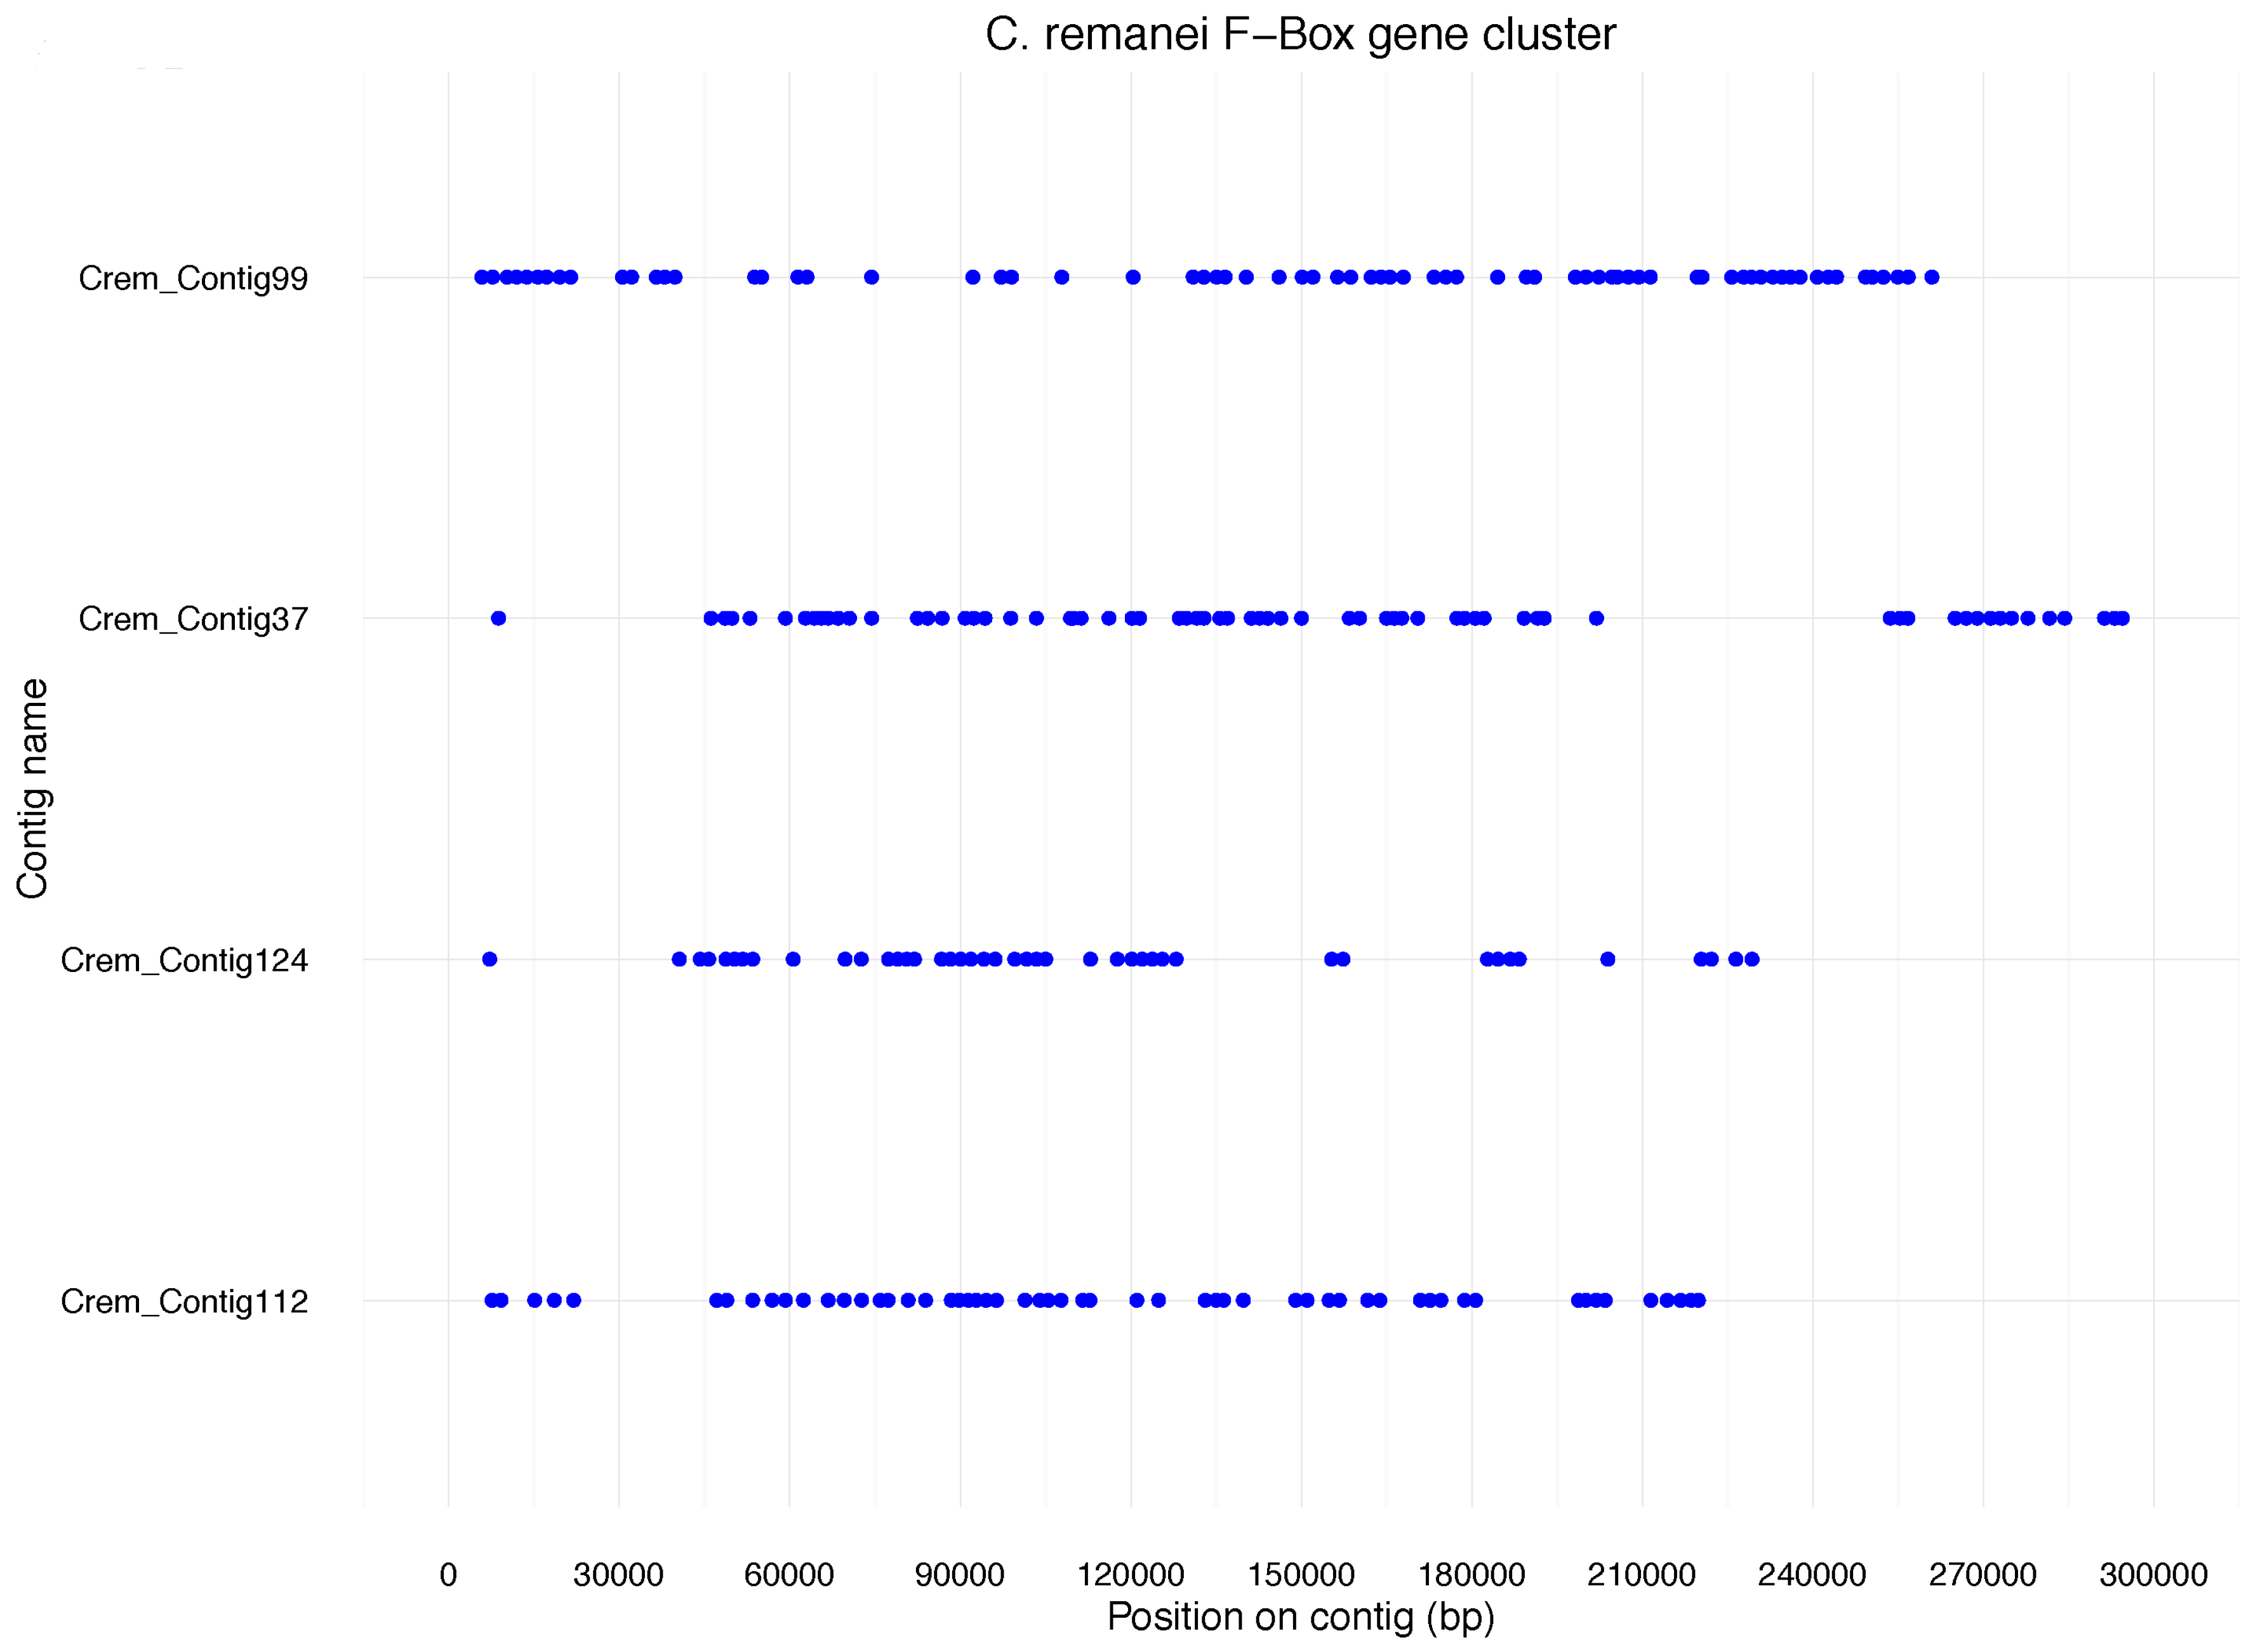
Like NLR genes in the fish, F-box genes in nematodes are thought to play a role in pathogen resistance. We found that 688 F-box genes in
C. remanei are located in 42 clusters containing 5 or more genes. The four largest clusters comprised over 40 genes each (
n = 71,
n = 69,
n = 56,
n = 43) (
Figure 2). These data are derived from protein annotation and thus indicate functionality of the genes in
C. remanei. The dense clustering of these genes is similar to what has previously been described for F-Box genes in
C. elegans. However,
C. elegans has fewer F-box genes (~260) than
C. remanei, and, in contrast to the cases mentioned before, many of them are pseudogenes [
12]. Consequently, the vast majority of F-box genes in
C. remanei cannot be uniquely related to an
C. elegans orthologue. This again underlines species specificity of this particular gene family expansion.
We also analysed whether NLR genes in species with known inflations could be similarly clustered as in the zebrafish. To this end, we re-compiled the list of the NLR genes in the respective species by intersecting the set of proteins we found to have a NACHT domain with those we found to have leucine rich repeats. Mapping the corresponding gene start positions on genomic scaffolds, we could identify a small cluster of NLR genes in A. queenslandica (5 genes) and a bigger group of 12 tightly packed NLRs in B. floridae. Overall, it appears that either there is no general clustering of these genes in species where they are expanded, or that the currently available genomes do not yet allow us to finally answer this question.
3. Conclusions
From our survey we conclude that massive expansions of gene families are rare and species-specific. For instance, regarding the NLR family there is only a very limited degree of orthology and synteny between the species
Danio rerio and
Cyprinus carpio. Such a situation appears to be common, given the previous analysis on shared gene families in closely related
Drosophila species [
7]. Clearly, a mechanism such as frequent tandem duplication, which promotes expansions on a short time scale, must be operating. It is, however, not clear whether duplications and losses (via pseudo-geneisation and deletion) reach a balance or whether the duplication rate is modulated depending on gene family size. An intriguing question is if functional genes can continue to proliferate unlimited when beyond a certain numerical threshold—a phenomenon, which we like to call
runaway evolution.
Furthermore, it is currently not clear whether expansions are driven by positive selection or whether they are mostly subject to neutral genetic drift. Functional analysis of the cases, which we have compiled shows that interaction with the environment, for instance through signaling processes or immune response, is a recurring theme. This is in line with previous observations in
C. elegans [
12]. A comparison of 12
Drosophila genomes led to the conclusion that rapidly expanding gene families contain members which might be directly involved in speciation, e.g., functionally associated to sperm displacement or inseminating [
7]. Taken together, the described functional categories hint at a potential role of positive selection, sexual selection or environmental adaptation in the initial proliferation phase of such gene families. It is then surprising that there are only so few instances of very large families. In any case, they tend to be specific to a species and show only little or no phylogenetic concordance, even between closely related species living in comparable environments. It is possible that only very few largely inflated families can be contained per genome to retain genomic stability. Additionally, these might have to remain functionally similar, due to the potential cost and to the adaptive valleys to be transgressed, when building complex regulation networks de-novo. The idea that physically close homologues might act redundantly, or in the same physiological process, is old [
18,
19]. Consequently, expansions may be neutral or nearly neutral for the hosting organism at least up to a certain threshold. In fact, it is hard to imagine how coordinated, and non-disruptive, regulation of the genes in very large families should evolve, if they were either highly constrained or driven by positive selection. With increasing family size, the additional costs of regulation and expression may lower a potential fitness advantage of further copies and thus keep cluster sizes under check. However, each new copy also adds to the overall duplication rate. Once a rate-threshold is surpassed, the duplication-selection-drift balance may become disrupted, with the consequence of massive gene family expansions under a possible regime of
runaway evolution.
Returning to our example of the NLR-B30.2 genes in the zebrafish, these could act in a massive swarm in organismal defense. While still retaining their function for the organisms such genes might evolve into “genomic parasites” when continuing to proliferate, inflating and remodeling the host’s genome. Ultimately, such selfish immune-genes could be lethal for their host organism.


