Evaluation of TP-E Interval and TP-E/QT Ratio in Panic Disorder


1
Department of Cardiology, M.D, Kahta State Hospital, Adıyaman 02450, Turkey
2
Department of Cardiology, M.D, Adıyaman Training and Research Hospital, Adıyaman 02450, Turkey
3
Department of Psychiatry, M.D, Kahta State Hospital, Adıyaman 02450, Turkey
*
Author to whom correspondence should be addressed.
Medicina 2020, 56(5), 215; https://0-doi-org.brum.beds.ac.uk/10.3390/medicina56050215
Submission received: 15 March 2020
/
Revised: 21 April 2020
/
Accepted: 24 April 2020
/
Published: 28 April 2020
Abstract
:Background and Objectives: The autonomic nervous system (ANS) is involved in panic disorders. ANS dysfunction has been shown to be associated with ventricular arrhythmia and increased heterogeneity of ventricular repolarization. However, there remains limited evidence of the relationship between panic disorders and ventricular depolarization markers, including the Tp-e interval and Tp-e/QT ratio. This study aimed to evaluate ventricular repolarization parameters in patients with panic disorder. Materials and Methods: In total, 40 patients with panic disorder, diagnosed using the Diagnostic and Statistical Manual of Mental Disorders (DSM-5) criteria, were included in the study group. The control group comprised of 50 age- and sex-matched healthy individuals. A standard 12 lead electrocardiogram was recorded on all participants, and heart rate, QT interval, QRS duration, Tp-e interval, and Tp-e/QT ratio were measured. Results: QRS durations and QT intervals were similar in the study and control groups. Compared to the control group, QTd, Tp-e, and cTp-e intervals as well as Tp-e/QT and Tp-e/QTc ratios were significantly increased in patients with panic disorder (p < 0.05 for all). In the study group, the Severity Measure for Panic Disorder—Adult score had a significant positive correlation with the Tp-e interval (r = 0.369, p < 0001), cTp-e interval (r = 0.531, p < 0.001), Tp-e/QT ratio (r = 0.358, p = 0.001), and Tp-e/QTc ratio (r = 0.351, p = 0.001). Conclusion: These findings indicate that panic disorders are associated with increased ventricular repolarization heterogeneity, which may be attributed to ANS dysregulation.
1. Introduction
Patients frequently present with non-cardiac chest pain and palpitations in cardiology outpatient clinics. Non-cardiac chest pain and palpitations have a significant impact on an individual’s quality of life and are associated with mental health conditions [1]. Of patients with non-cardiac chest pain and palpitations, 72% have a coexisting mental illness. Moreover, patients with non-cardiac chest pain are particularly susceptible to experiencing panic attacks and developing panic disorders [2]. Previous studies have found that the lifetime prevalence of panic disorders varies between 1.7% and 2.7% [3].
The autonomic nervous system (ANS) regulates the heart rate and rhythm. It is well established that the ANS is involved in panic disorders. Symptoms such as chest pain, palpitations, sweating, breathing difficulties, feelings of suffocation, and hot flashes are common symptoms of panic attacks and indicate ANS dysfunction [4]. Moreover, it has been suggested that the ANS can cause changes in ventricular repolarization [5].
The QT interval and QT dispersion (QTd) are measured via a 12 channel electrocardiogram (ECG) to assess regional heterogeneity of ventricular repolarization. Studies have shown that ventricular repolarization heterogeneity increases the risk of cardiac arrhythmias [6]. Moreover, QTd is increased in patients with panic disorder [7]. Transmural dispersion of repolarization (TDR) occurs when ventricular repolarization does not occur simultaneously throughout the entire ventricle. Recently, T-wave measurements have been used to evaluate myocardial repolarization. The time between the T wave peak and T wave end (Tp-e) measured on an ECG can be used as an indicator for TDR [8]. Clinical studies have reported that the Tp-e interval and Tp-e/QT ratio are simple yet useful parameters for predicting increased ventricular arrhythmias and cardiovascular events [9]. However, there is limited evidence on the relationship between panic disorders and TDR markers such as the Tp-e interval and Tp-e/QT ratio.
There are many clinical studies showing that the risk of death from cardiovascular diseases or cardiovascular causes is increased among individuals with panic disorder [10]. Therefore, this study aimed to evaluate ventricular repolarization parameters, including the Tp-e interval and Tp-e/QT ratio, measured on 12 lead superficial ECGs in patients with panic disorder.
2. Materials and Methods
Patients who presented to our outpatient cardiology clinic with panic disorder symptoms between 1 March 2019 and 30 September 2019 were eligible for participation. Panic disorder symptoms included palpitations, shortness of breath, sweating, anxiety, and fear. Patients who were referred to the psychiatry outpatient unit with the pre-diagnosis of panic disorder were included in the study group. A sample of subjects without cardiac symptoms served as the comparison group; volunteers were recruited from hospital staff. Healthy controls who had diagnosed cardiac or other organic disease, or who were using psychotropic or other medications were excluded. Demographic data as well as systolic and diastolic blood pressure values were collected from all participants. Current smoking status was recorded. Body mass index (BMI) was calculated by dividing weight in kilograms (kg) by height in meters squared (m2). Blood glucose, creatinine, thyroid-stimulating hormone, and electrolyte values were analyzed from blood samples collected at the initial clinic visit. Patients with acute coronary syndrome, stable coronary artery disease, hypertension, diabetes, kidney failure, left ventricular systolic dysfunction, heart valve disease, congenital heart disease, thyroid dysfunction, electrolyte disorder, and psychiatric disease were excluded from the study. Further excluded from the study were patients with rhythm disturbances or biphasic T and negative T waves on ECG, those using tricyclic antidepressants, antihistamines, antibiotics, and antipsychotics, and those that had previously used medication for a panic disorder.
In this study, panic disorder diagnosis was made according to the fifth version of the Diagnostic and Statistical Manual of Mental Disorders (DSM-5) (F41.0). Disease severity was determined using the Severity Measure for Panic Disorder—Adult (SMPD-A). The SMPD-A was developed by the American Psychiatric Association and is a self-assessment tool with 10 items, each scored on a five-point Likert-scale (0 = never, 4 = always). The SMPD-A asks participants to consider how the panic disorder has affected their personal lives in the past seven days. The resulting scores indicate the severity of the panic disorder. Total scores range from 0 to 40, with higher scores indicating more severe panic disorder. The Turkish version of the SMPD-A used herein has demonstrated good validity and reliability [11].
The 12 lead ECG recordings (50 mm/s, 10 mm/mV) were obtained in the supine position using a CardioFax S device (Nihon Kohden, Tokyo, Japan). Resting heart rate was measured using the ECG data. QT and Tp-e intervals and QRS duration were manually calculated by two cardiologists using the ECG data. Calipers and magnifying glasses were used to reduce measurement errors. The QRS duration was defined as from the time interval onset to the end of the QRS complex. The QT interval was calculated as the time from the start of the QRS complex to the end of the T wave. The longest QT interval from the 12 leads was defined as the maximum QT interval and the shortest QT interval was the minimum QT interval. QTd was calculated by subtracting the minimum QT interval from the maximum QT interval. The Tp-e interval was measured as the time from the T wave peak to the T wave end point on the precordial V5 lead [12]. The peak of the T wave was defined as a point of highest amplitude of T wave deflection. The end of the T wave was defined as the intersection of the tangent to the downslope of the T wave and the isoelectric line. If the V5 lead was not suitable for this measurement, the D2 lead was used. The measured values were corrected according to the heart rate using Bazett’s formula. Corrected QT interval (QTc), corrected QTd (cQTd), and corrected Tp-e interval (cTp-e) were obtained, and the ratios of Tp-e/QT and corrected Tp-e/QT (Tp-e/QTc) were calculated. The inter-observer and intra-observer variation coefficients for the Tp-e/QT ratio were 2.8% and 3.0%, respectively, and those for the Tp-e/QTc ratio were 2.9% and 3.1%, respectively.
Transthoracic echocardiographic evaluations were performed on all participants using a Vivid 5 Pro ECO device (General Electric, Horten, Norway). In the lateral decubitus position, the images of the parasternal long and short axis as well as four-chamber and two-chamber views from the apical window were obtained. The left ventricular ejection fraction was assessed using Simpson’s method [13].
Prior to enrolment, all participants received detailed information about the study and provided written informed consent. Research ethics approval was obtained from the Ethics Committee of Adıyaman University Medical Faculty (#17 September 2019, approved 17 February 2019).
Statistical Analysis
All statistical analyses were performed using SPSS 22.0 statistical program (SPSS Inc., Chicago, IL, USA). Continuous variables were expressed as mean ± standard deviation and categorical variables were reported as numbers and percentages. The distribution of the data was assessed using the Kolmogorov–Smirnov test. Independent sample t-tests were used to compare continuous variables. Median, interquartile range (IQR), and Mann–Whitney U-tests were used for non-continuous parametric variables. Categorical variables were compared within the study group using chi-squared tests. Pearson correlation tests were used to evaluate the relationship between parametric continuous variables. p-values < 0.05 were considered statistically significant.
3. Results
In total, 40 patients with panic disorder (13 males; mean age, 34.7 ± 8.7 years) and 50 healthy controls (23 males; mean age, 34.5 ± 5.5 years) were included in the study. The demographic, laboratory, and echocardiographic data of all participants are summarized in Table 1. In patients with panic disorder, the average SMPD-A score was 21.2 ± 5.4. There were no statistical differences in demographic, laboratory, and echocardiographic variables between the two groups.
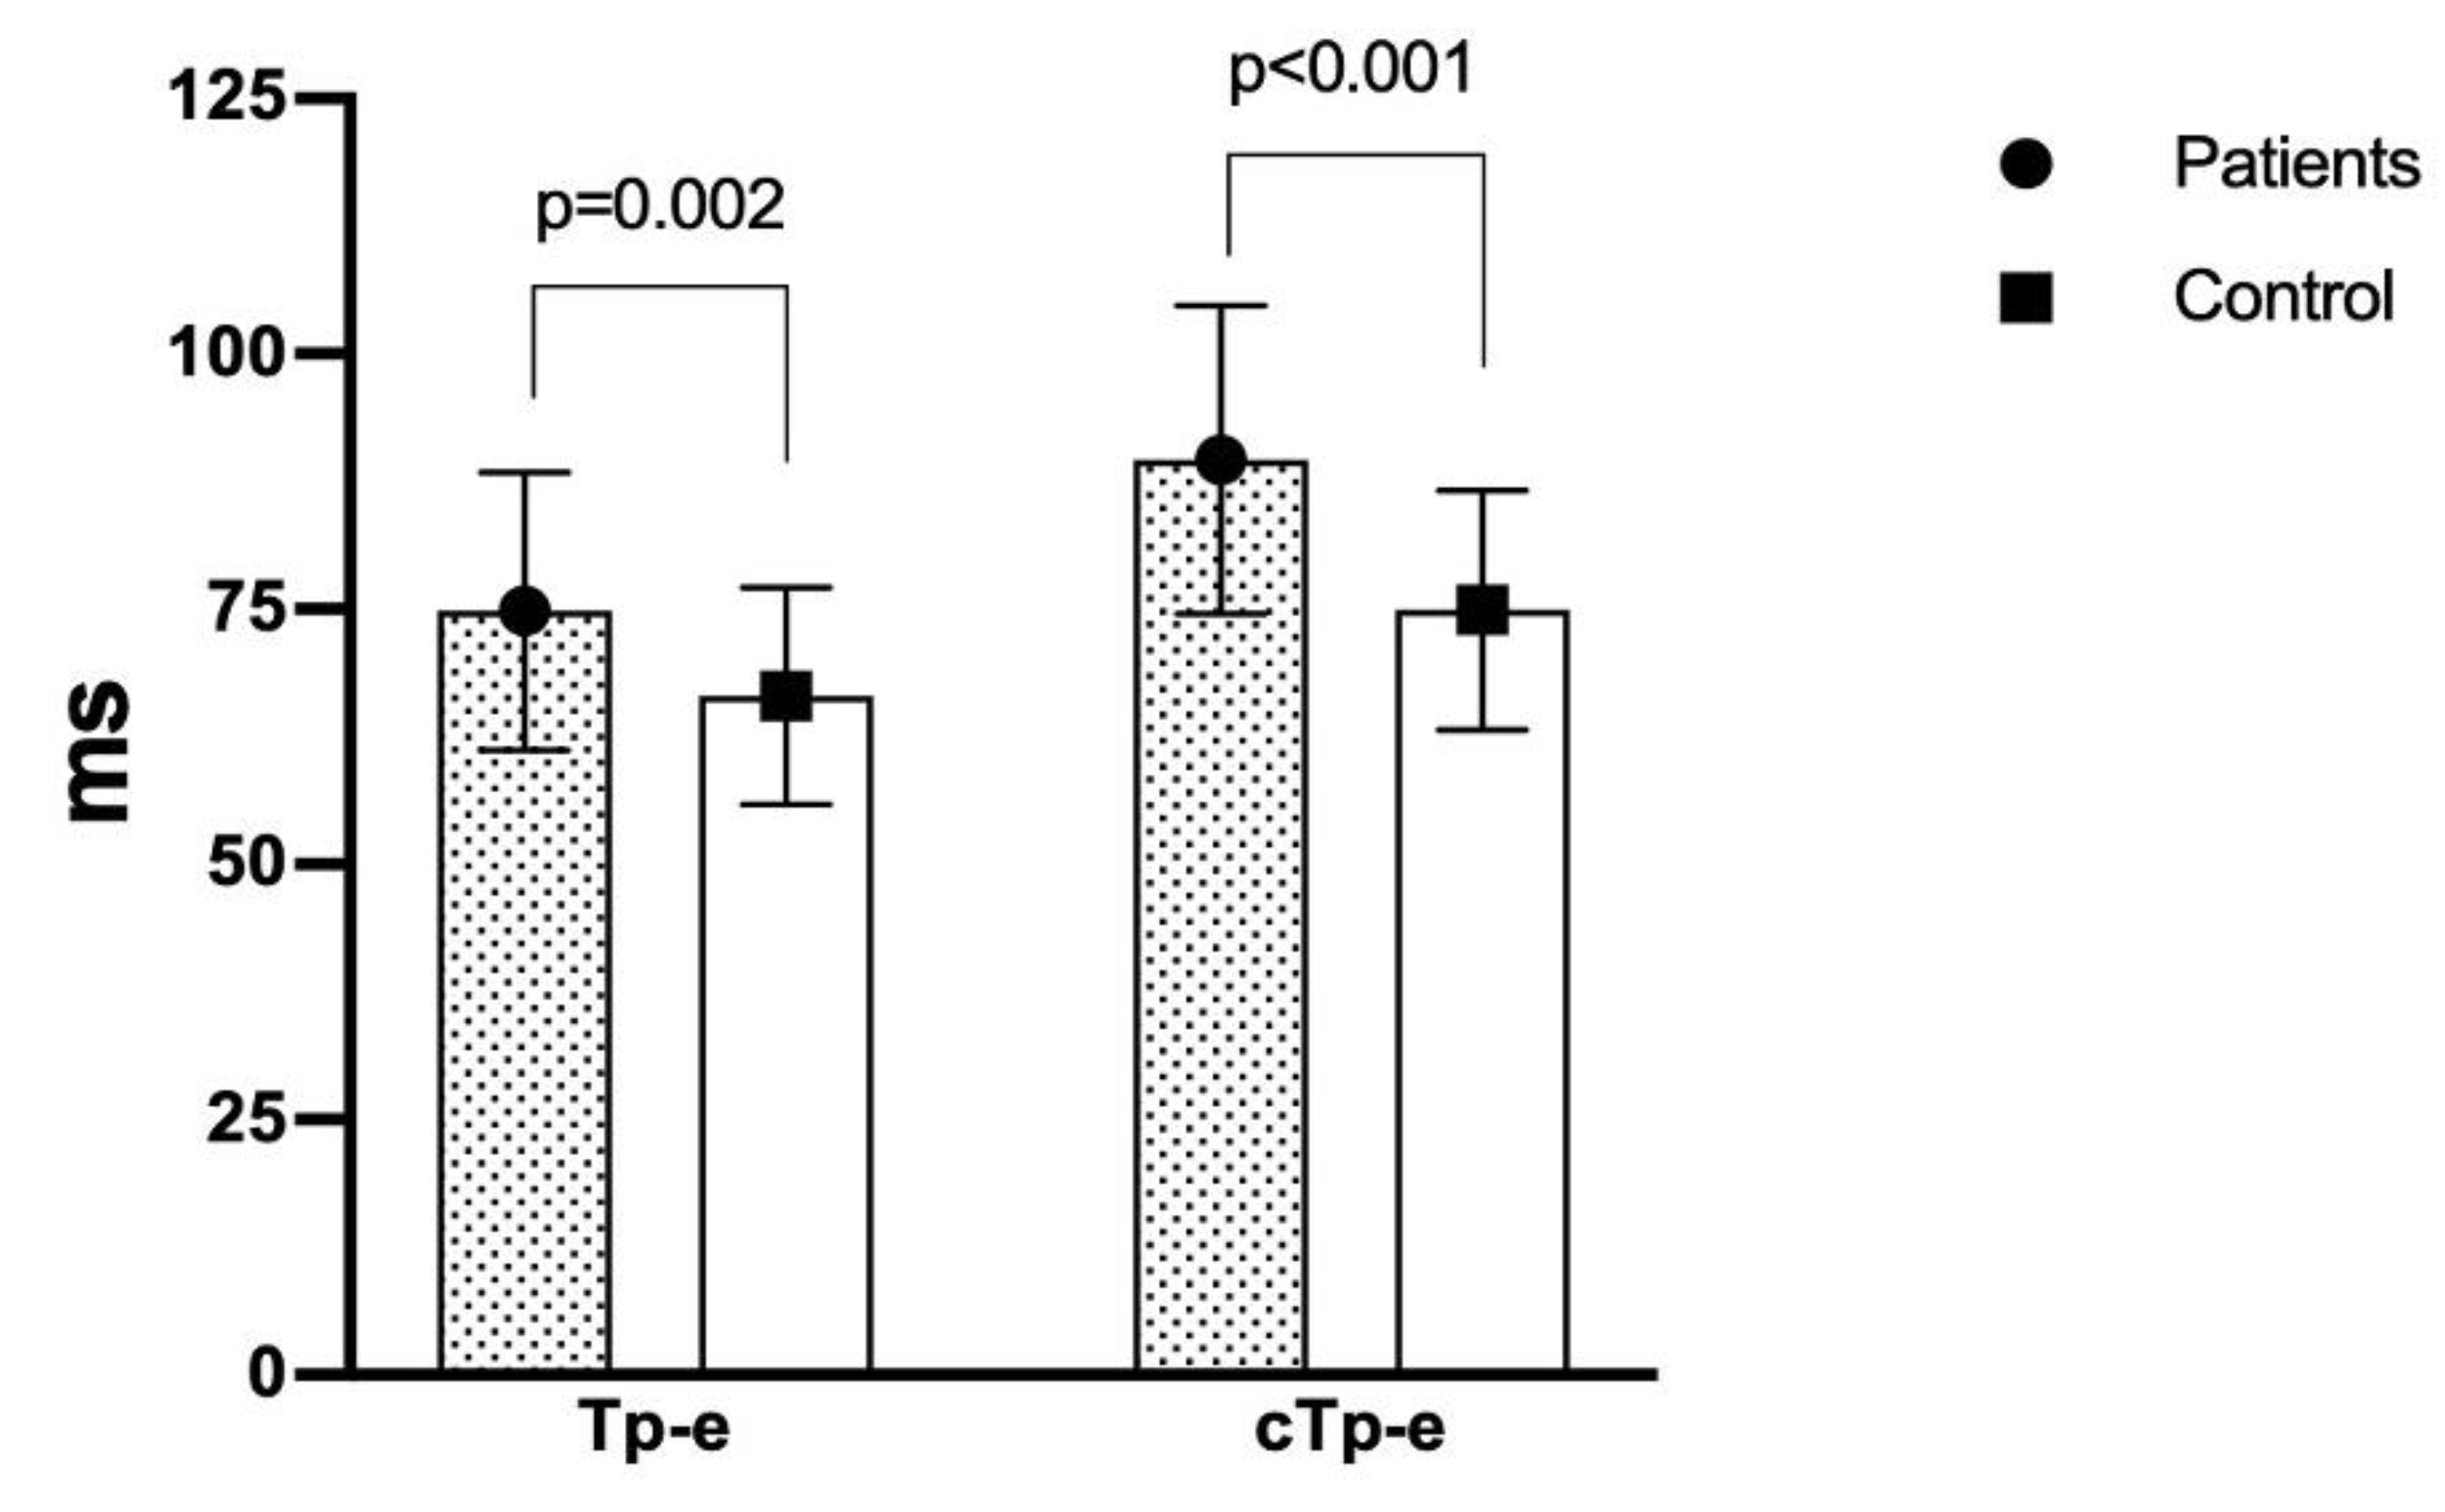
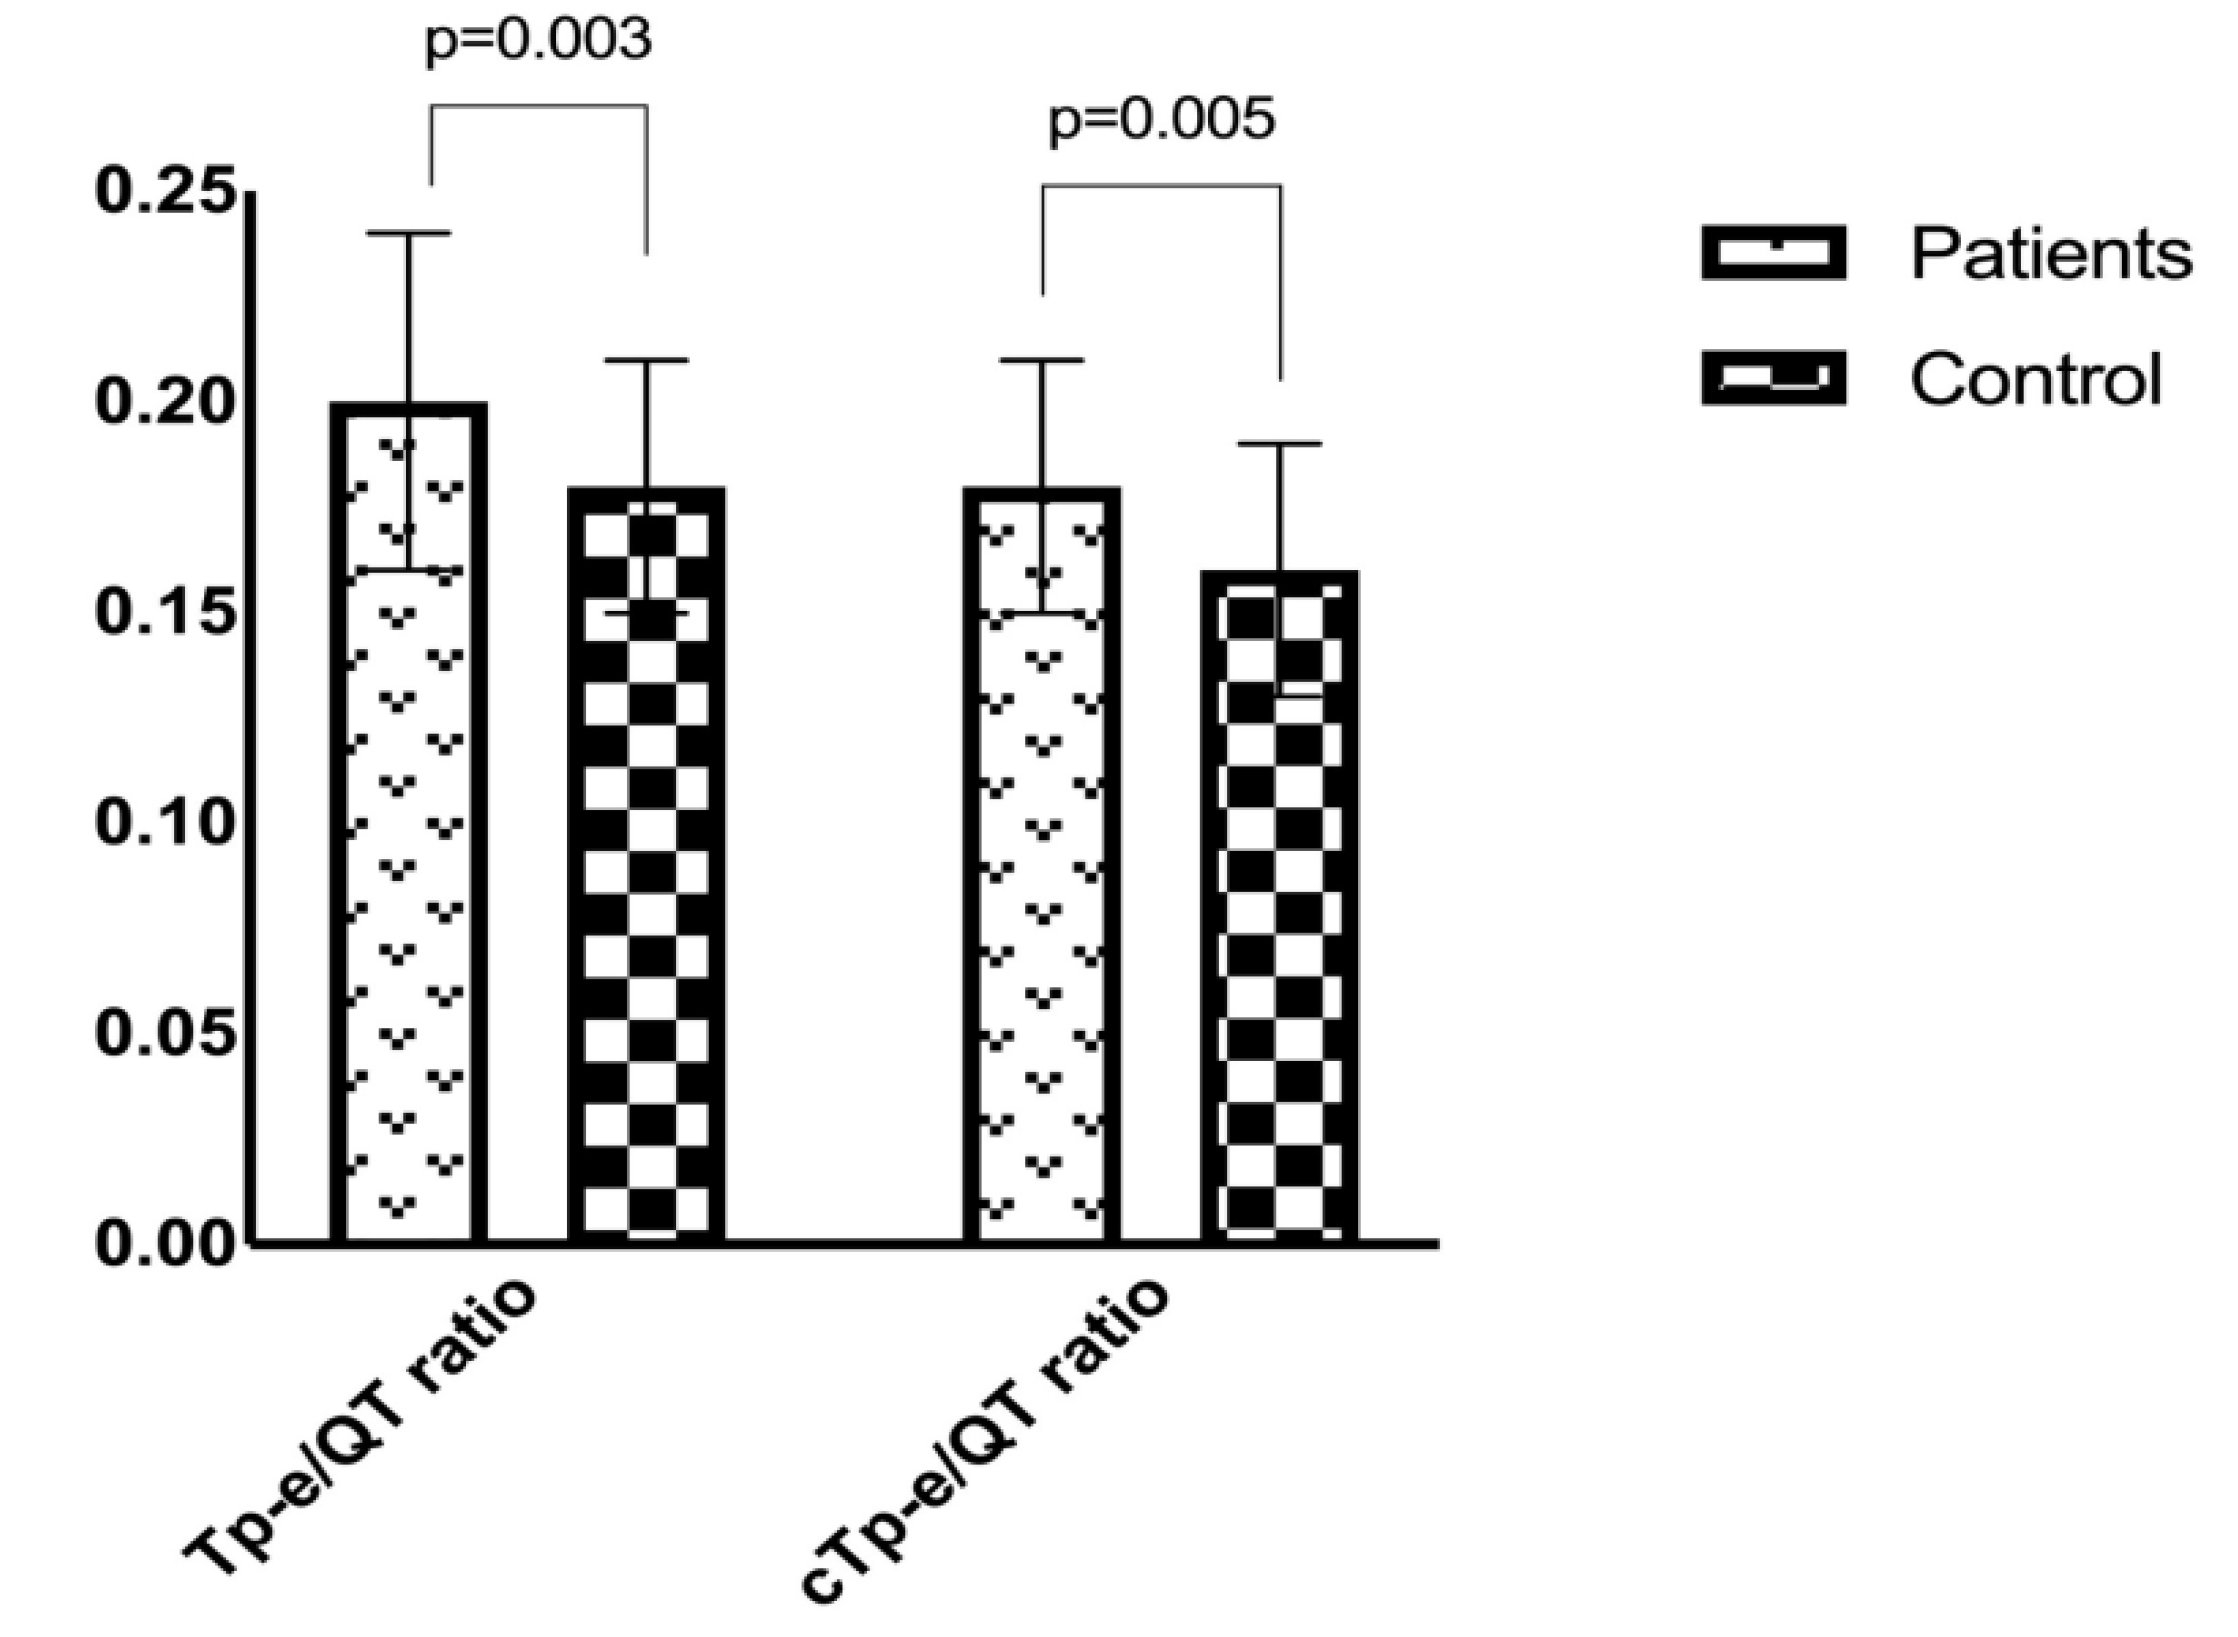
In the study group, the mean heart rate was 80.2 ± 13.6 bpm compared to 73.7 ± 11.2 bpm in the control group (p = 0.017). The QTd and cQTd intervals were significantly higher in the study group than in the control group (p < 0.05 for both). The study group had a significantly higher Tp-e interval (74.8 ± 13.6 vs. 66.5 ± 10.6; p = 0.002), cTp-e interval (89.6 ± 15.1 vs. 74.9 ± 11.7; p < 0.001) (Figure 1), Tp-e/QT ratio (0.20 ± 0.04 vs. 0.18 ± 0.03; p = 0.003), and Tp-e/QTc ratio (0.18 ± 0.03 vs. 0.16 ± 0.03; p = 0.005) (Figure 2) compared to the control group. A comparison of the electrocardiographic findings between the two groups is provided in Table 2.
In the study group, the SMPD-A score had a significant positive relationship with the Tp-e interval (r = 0.369, p < 0001), cTp-e interval (r = 0.531, p < 0.001), Tp-e/QT ratio (r = 0.358, p = 0.001), and Tp-e/QTc ratio (r = 0.351, p = 0.001). Correlations between the SMPD-A score and electrocardiographic parameters are presented in Table 3.
Logistic regression was performed to further investigate whether ECG variables have explanatory power over panic disorder. The results are presented in Table 4, and were in accordance with the findings of the t-tests which are shown in Table 2.
In Table 4 QRS duration, QTc, QTd, and Tp-e intervals as well as Tp-e/QT and Tp-e/QTc rates were statistically insignificant, while cQTd and cTp-e intervals were statistically significant. On average, the odds of a patient having panic disorder increased by 20% for each 1 ms increase in cTp-e interval, and the average odds of a patient having panic disorder increased by 5% for each 1 ms increase in cQTd interval.
4. Discussion
This study evaluated electrocardiographic parameters among patients experiencing panic disorder symptoms compared to healthy controls. Participants in this study were not using any psychotropic drugs that could affect resting ECG results. A significant increase was observed in TDR markers, including the Tp-e interval, cTp-e interval, Tp-e/QT ratio, and Tp-e/QTc ratio, in the study group. To our knowledge, this is the first study to show variability in TDR among patients with panic disorder compared to healthy controls. These findings may indicate an increased risk of cardiac arrhythmia in patients with panic disorder.
Panic disorder has been associated with an increased risk of cardiovascular disease (CVD) and mortality [14]. Previous studies have shown a strong correlation between panic disorder and CVD, cardiomyopathies, arrhythmia, and decreased heart rate variability (HRV) [15]. Batelan et al. [16] investigated the effect of three anxiety disorders, panic disorder, social phobia–agoraphobia, and generalized anxiety disorder, on non-fatal CVD and found that many patients developed CVD during the 3 year follow-up period. The study also found a strong correlation between diffuse anxiety disorder and the onset of CVD. However, there remains limited evidence of any causal relationship between panic disorder and CVD [15].
The ANS is an important modulator of ventricular repolarization and plays a key role in the development and maintenance of malignant ventricular arrhythmias. However, the mechanism linking ANS dysfunction and ventricular arrhythmias is not yet fully understood [17]. Several clinical studies have shown an increased incidence of ANS disorders, including increased resting heart rate [18], reduced vagal tone, and increased sympathetic system efficacy [19], in patients with panic disorder compared to healthy controls. HRV is one method used to evaluate ANS function, which is controlled by parasympathetic and sympathetic cardiac nerves. HVR indicates the capacity of autonomic stimulation to be suppressed by the parasympathetic system [20]. A decrease in HRV is frequently used as an indicator of cardiac autonomic instability in panic disorder [21]. There are several models explaining the reduced HRV in panic disorder. According to the neurovisceral integration model [22], efferent nerve fibers from the prefrontal cortex moderate parasympathetic activity and vagal nerve inhibition of cardiac activity. This model defines a healthy functioning ANS with adaptive variability. This adaptive variability encompasses environmental, physiological, behavioural, cognitive, and emotional areas and plays a role in reducing anxiety that aggregates cardiovascular symptoms. Interventions that improve HRV may also help to ameliorate worry [23]. In their study of 41 patients with panic disorder, Gündüz et al. [24] detected decreased HRV parameters, suggesting reduced parasympathetic activity. Hovland et al. [25] reported that decreased HRV was associated with the severity of panic disorder symptoms.
QTd refers to the difference between the longest and shortest QT intervals measured on ECG. Clinical studies have shown that QTd is an independent factor in the QT interval among individuals with ANS dysfunction [26,27]. Increased QTd indicates heterogeneity in ventricular repolarization, which leads to ventricular instability [28]. Moreover, increased QTd has been associated with autonomic neuropathy and cardiovascular mortality [29]. However, there are few studies that evaluate the relationship between QTd and panic disorder. Atmaca et al. [7] found that the QTd was increased in patients with panic disorder compared to the control group. Although studies have suggested that increased QTd reflects an imbalance in the autonomic innervation of the heart and is associated with anxiety levels [30], others have shown that the QTd does not directly indicate ventricular repolarization heterogeneity [31,32]. In this study, the QT interval was similar in both groups, whereas the QTd interval was higher in patients with panic disorder.
Lubinski et al. [33] were first to report that patients with long QT syndrome had increased Tp-e intervals, which is an indication of TDR. It is well established that the Tp-e interval is more sensitive than QTd in assessing the heterogeneity of ventricular repolarization, as it reflects global dispersion, including apicobasal and interventricular repolarization dispersion. While the QT and Tp-e intervals are affected by BMI and heart rate, the Tp-e/QT ratio is not affected by these parameters and is more sensitive in predicting ventricular arrhythmias [34,35]. An increased Tp-e interval has been shown to be associated with mortality in Brugada syndrome, congenital or acquired long QT syndrome, hypertrophic cardiomyopathy, and ST-segment acute myocardial infarction [36]. Moreover, increased Tp-e interval and Tp-e/QT ratio have been associated with cardiovascular mortality [37]. A meta-analysis found that prolonged Tp-e intervals were associated with a 1.14-fold increase in risk of malignant ventricular arrhythmias or sudden cardiac death [38]. The authors suggested that the Tp-e interval might be a useful risk classification tool in various clinical populations as well as in the general public. In this study, the Tp-e interval and Tp-e/QT ratio were higher in the study group compared to the control group. This may be attributable to ANS dysfunction via increased sympathetic activity and/or decreased vagal tone during panic attacks. Moreover, changes in these parameters have been associated with increased ventricular repolarization heterogeneity and ventricular arrhythmias [39]. Therefore, these non-invasive ECG parameters may be used to assess the risk of adverse cardiac events in patients with panic disorder.
This study had several limitations. The incidence of arrhythmias and its relationship with arrhythmia markers were not assessed in this study. Due to the cross-sectional design, adverse cardiac events during clinical follow-up could not be evaluated. In addition, this study used 12 lead ECGs; however, the relationship between HRV and ventricular repolarization parameters may have been better assessed using 24 h rhythm Holter ECG recordings during panic attacks.
5. Conclusions
In this study, ECG proxy markers for ventricular repolarization abnormalities, including QTd, Tp-e intervals, and Tp-e/QT ratios, were higher in patients with panic disorder compared to healthy controls. Secondary to panic attacks, electrophysiological properties of myocardial cells may change, resulting in altered repolarization characteristics in myocardial cells. Further large-scale, prospective studies are needed to evaluate the relationship between ventricular arrhythmias and increased Tp-e intervals and Tp-e/QT ratios.
Author Contributions
Conceptualization, A.A. and M.H.O.; Data curation, A.A., R.A. and E.C.; Investigation, A.A. and M.H.O.; Methodology, R.A.; Resources, E.C.; Software, M.H.O. and E.C.; Supervision, R.A.; Visualization, E.C.; Writing—review & editing, A.A. and M.H.O. All authors have read and agreed to the published version of the manuscript.
Funding
This research received no external funding.
Acknowledgments
This study received no grant funding from any agency in the public, commercial or not-for-profit sectors.
Conflicts of Interest
The authors declare no potential conflict of interest.
References
- Christenson, J.; Innes, G.; McKnight, D.; Boychuk, B.; Grafstein, E.; Thompson, C.; Rosenberg, F.; Anis, A.H.; Gin, K.; Tilley, J.; et al. Safety and efficiency of emergency department assessment of chest discomfort. Can. Med. Assoc. J. 2004, 170, 1803–1807. [Google Scholar] [CrossRef] [Green Version]
- Foldes-Busque, G.; Marchand, A.; Chauny, J.-M.; Poitras, J.; Diodati, J.; Denis, I.; Lessard, M.-J.; Pelland, M.-E.; Fleet, R. Unexplained chest pain in the ED: Could it be panic? Am. J. Emerg. Med. 2011, 29, 743–751. [Google Scholar] [CrossRef]
- De Jonge, P.; Roest, A.M.; Lim, C.; Florescu, S.E.; Bromet, E.J.; Stein, D.J.; Harris, M.; Nakov, V.; De Almeida, J.M.C.; Levinson, D.; et al. Cross-national epidemiology of panic disorder and panic attacks in the world mental health surveys. Depress. Anxiety 2016, 33, 1155–1177. [Google Scholar] [CrossRef] [Green Version]
- McCraty, R.; Atkinson, M.; Tomasino, D.; Stuppy, W.P. Analysis of twenty-four hour heart rate variability in patients with panic disorder. Boil. Psychol. 2001, 56, 131–150. [Google Scholar] [CrossRef] [Green Version]
- Ozturk, M.; Turan, O.E.; Karaman, K.; Bilge, N.; Ceyhun, G.; Aksu, U.; Aksakal, E.; Gulcu, O.; Kalkan, K.; Demirelli, S. Evaluation of ventricular repolarization parameters during migraine attacks. J. Electrocardiol. 2019, 53, 66–70. [Google Scholar] [CrossRef] [PubMed]
- Sauer, A.; Wilcox, J.E.; Andrei, A.C.; Passman, R.; Goldberger, J.J.; Shah, S.J. Association of the ECG T-peak to T-end interval with echocardiographic markers of diastolic dysfunction. Circ. Arrhythm. Electrophysiol. 2012, 5, 537–543. [Google Scholar] [CrossRef] [Green Version]
- Atmaca, M.; Yavuzkir, M.; Izci, F.; Gurok, M.G.; Adiyaman, S. QT wave dispersion in patients with panic disorder. Neurosci. Bull. 2012, 28, 247–252. [Google Scholar] [CrossRef] [PubMed] [Green Version]
- Kors, J.A.; Van Eck, H.J.R.; Van Herpen, G. The meaning of the Tp-Te interval and its diagnostic value. J. Electrocardiol. 2008, 41, 575–580. [Google Scholar] [CrossRef]
- Shu, J.; Li, H.; Yan, G.; Cui, C. Tp-e/QT ratio as a predictive index of sudden cardiac death in patients with ST-segment elevation myocardial infarction. J. Xi’an Jiaotong Univ. Med. Sci. 2010, 31, 441–443. [Google Scholar]
- Walters, K.R.; Rait, G.; Petersen, I.; Williams, R.; Nazareth, I. Panic disorder and risk of new onset coronary heart disease, acute myocardial infarction, and cardiac mortality: Cohort study using the general practice research database. Eur. Heart J. 2008, 29, 2981–2988. [Google Scholar] [CrossRef] [Green Version]
- Balıkçı, K.; Herdem, A.; Aydemir, O.; Grubu, D. Reliability and validity of Turkish form of panic disorder scale. Anatol. J. Psychiatry 2017, 18, 13. [Google Scholar] [CrossRef] [Green Version]
- Hevia, J.C.; Antzelevitch, C.; Bárzaga, F.T.; Sánchez, M.D.; Balea, F.D.; Molina, R.Z.; Pérez, M.A.Q.; Rodríguez, Y.F. Tpeak-tend and tpeak-tend dispersion as risk factors for ventricular tachycardia/ventricular fibrillation in patients with the brugada syndrome. J. Am. Coll. Cardiol. 2006, 47, 1828–1834. [Google Scholar] [CrossRef] [PubMed] [Green Version]
- Lang, R.M.; Badano, L.P.; Mor-Avi, V.; Afilalo, J.; Armstrong, A.; Ernande, L.; Flachskampf, F.A.; Foster, E.; Goldstein, S.A.; Kuznetsova, T. Recommendations for cardiac chamber quantification by echocardiography in adults: An update from the American society of echocardiography and the european association of cardiovascular imaging. J. Am. Soc. Echocardiogr. 2015, 16, 233–271. [Google Scholar]
- Katerndahl, D.A. The association between panic disorder and coronary artery disease among primary care patients presenting with chest pain: An updated literature review. Prim. Care Companion J. Clin. Psychiatry 2008, 10, 276–285. [Google Scholar] [CrossRef]
- Machado, S.; Sancassiani, F.; Paes, F.; Rocha, N.B.; Murillo-Rodríguez, E.; Nardi, A.E. Panic disorder and cardiovascular diseases: An overview. Int. Rev. Psychiatry 2017, 29, 436–444. [Google Scholar] [CrossRef]
- Batelaan, N.M.; Have, M.T.; Van Balkom, A.J.; Tuithof, M.; De Graaf, R. Anxiety disorders and onset of cardiovascular disease: The differential impact of panic, phobias and worry. J. Anxiety Disord. 2014, 28, 252–258. [Google Scholar] [CrossRef]
- Ng, G.A. Neuro-cardiac interaction in malignant ventricular arrhythmia and sudden cardiac death. Auton. Neurosci. 2016, 199, 66–79. [Google Scholar] [CrossRef] [Green Version]
- Wise, V.; McFarlane, A.C.; Clark, C.R.; Battersby, M. An integrative assessment of brain and body function ‘at rest’ in panic disorder: A combined quantitative EEG/autonomic function study. Int. J. Psychophysiol. 2011, 79, 155–165. [Google Scholar] [CrossRef]
- Cohen, H.; Benjamin, J. Power spectrum analysis and cardiovascular morbidity in anxiety disorders. Auton. Neurosci. 2006, 128, 1–8. [Google Scholar] [CrossRef]
- Carney, R.M.; Freedland, K.E.; Stein, P.K.; Skala, J.A.; Hoffman, P.; Jaffe, A.S. Change in heart rate and heart rate variability during treatment for depression in patients with coronary heart disease. Psychosom. Med. 2000, 62, 639–647. [Google Scholar] [CrossRef]
- Chalmers, J.A.; Quintana, D.S.; Abbott, M.J.-A.; Kemp, A.H. Anxiety disorders are associated with reduced heart rate variability: A meta-analysis. Front. Psychol. 2014, 5, 80. [Google Scholar] [CrossRef] [PubMed] [Green Version]
- Thayer, J.F.; Lane, R.D. A model of neurovisceral integration in emotion regulation and dysregulation. J. Affect. Disord. 2000, 61, 201–216. [Google Scholar] [CrossRef] [Green Version]
- Rennie, K.L.; Hemingway, H.; Kumari, M.; Brunner, E.; Malik, M.; Marmot, M. Effects of moderate and vigorous physical activity on heart rate variability in a British study of civil servants. Am. J. Epidemiol. 2003, 158, 135–143. [Google Scholar] [CrossRef] [PubMed]
- Gündüz, N.; Aslan, E.A.; Eren, F.; Turan, H.S.; Öztürk, M.; Tural, U. Psikotrop İlaç Kullanımı, Başka Tıbbi Hastalığı ve Psikiyatrik Eş Tanısı Olmayan Panik Bozukluğu Hastalarında 24 Saatlik Kalp Hızı Değişkenliğinin Değerlendirilmesi. Türk. Psikiyatr. Derg. 2019, 30, 236–244. [Google Scholar]
- Hovland, A.; Pallesen, S.; Hammar, Å.; Hansen, A.L.; Thayer, J.F.; Tarvainen, M.; Nordhus, I.H. The relationships among heart rate variability, executive functions, and clinical variables in patients with panic disorder. Int. J. Psychophysiol. 2012, 86, 269–275. [Google Scholar] [CrossRef]
- Ishida, S.; Nakagawa, M.; Fujino, T.; Yonemochi, H.; Saikawa, T.; Ito, M. Circadian variation of QT interval dispersion: Correlation with heart rate variability. J. Electrocardiol. 1997, 30, 205–210. [Google Scholar] [CrossRef]
- Fossa, A.A. The impact of varying autonomic states on the dynamic beat-to-beat QT-RR and QT-TQ interval relationships. Br. J. Pharmacol. 2008, 154, 1508–1515. [Google Scholar] [CrossRef] [Green Version]
- De Bruyne, M.C.; Hoes, A.W.; Kors, J.A.; Hofman, A.; Van Bemmel, J.H.; Grobbee, D.E. QTc dispersion predicts cardiac mortality in the elderly: The rotterdam study. Circulation 1998, 97, 467–472. [Google Scholar] [CrossRef] [Green Version]
- Stewart, A.; Waterhouse, J.; Howard, P. The QTc interval, autonomic neuropathy and mortality in hypoxaemic COPD. Respir. Med. 1995, 89, 79–84. [Google Scholar] [CrossRef] [Green Version]
- Uyarel, H.; Okmen, E.; Cobanoğlu, N.; Karabulut, A.; Cam, N. Effects of anxiety on QT dispersion in healthy young men. Acta Cardiol. 2006, 61, 83–87. [Google Scholar] [CrossRef]
- Rautaharju, P.M. Why Did QT Dispersion Die? Card. Electrophysiol. Rev. 2002, 6, 295–301. [Google Scholar] [CrossRef] [PubMed]
- Somberg, J.C.; Molnar, J. Usefulness of QT dispersion as an electrocardiographically derived index. Am. J. Cardiol. 2002, 89, 291–294. [Google Scholar] [CrossRef]
- Lubinski, A.; Kempa, M.; Baczynska, A.M.; Romanowska, I.; Świątecka, G.; Lewicka, E. New insight into repolarization abnormalities in patients with congenital long QT syndrome: The increased transmural dispersion of repoiarization. Pacing Clin. Electrophysiol. 1998, 21, 172–175. [Google Scholar] [CrossRef] [PubMed]
- Gupta, P.; Patel, C.; Patel, H.; Narayanaswamy, S.; Malhotra, B.; Green, J.T.; Yan, G.-X. Tp-e/QT ratio as an index of arrhythmogenesis. J. Electrocardiol. 2008, 41, 567–574. [Google Scholar] [CrossRef] [PubMed]
- Zhao, X.; Xie, Z.; Chu, Y.; Yang, L.; Xu, W.; Yang, X.; Liu, X.; Tian, L. Association between Tp-e/QT ratio and prognosis in patients undergoing primary percutaneous coronary intervention for ST-segment elevation myocardial infarction. Clin. Cardiol. 2012, 35, 559–564. [Google Scholar] [CrossRef]
- Içli, A.; Kayrak, M.; Akilli, H.; Aribas, A.; Coskun, M.; Ozer, S.F.; Ozdemir, K. Prognostic value of Tpeak-Tend interval in patients with acute pulmonary embolism. BMC Cardiovasc. Disord. 2015, 15, 99. [Google Scholar] [CrossRef] [Green Version]
- Panikkath, R.; Reinier, K.; Uy-Evanado, A.; Teodorescu, C.; Hattenhauer, J.; Mariani, R.; Gunson, K.; Jui, J.; Chugh, S.S. Prolonged Tpeak-to-tend interval on the resting ECG is associated with increased risk of sudden cardiac death. Circ. Arrhythm. Electrophysiol. 2011, 4, 441–447. [Google Scholar] [CrossRef] [Green Version]
- Tse, G.; Gong, M.; Wong, W.T.; Georgopoulos, S.; Letsas, K.P.; Vassiliou, V.S.; Chan, Y.S.; Yan, B.P.; Wong, S.H.; Wu, K.K.; et al. The Tpeak-Tend interval as an electrocardiographic risk marker of arrhythmic and mortalityoutcomes: A systematic review and meta-analysis. Heart Rhythm. 2017, 14, 1131–1137. [Google Scholar] [CrossRef] [Green Version]
- Perkiömäki, J.S.; Ikäheimo, M.J.; Pikkujämsä, S.M.; Rantala, A.; Lilja, M.; Kesäniemi, Y.A.; Huikuri, H.V. Dispersion of the QT interval and autonomic modulation of heart rate in hypertensive men with and without left ventricular hypertrophy. Hypertension 1996, 28, 16–21. [Google Scholar] [CrossRef]
Figure 1.
Comparison of Tp-e and cTp-e intervals in patients with panic disorder and healthy controls (74.8 ± 13.6 vs. 66.5 ± 10.6, p = 0.002; 89.6 ± 15.1 vs. 74.9 ± 11.7, p < 0.001, respectively). Tp-e: transmural dispersion of repolarization; cTp-e: corrected transmural dispersion of repolarization.

Figure 2.
Comparison of Tp-e/QT and Tp-e/QTc rates between patients with panic disorder and healthy controls (0.20 ± 0.04 vs. 0.18 ± 0.03, p = 0.003; 0.18 ± 0.03 vs. 0.16 ± 0.03, p = 0.005, respectively). Tp-e: transmural dispersion of repolarization; cTp-e: corrected transmural dispersion of repolarization.


Table 1.
Clinical characteristics and laboratory and echocardiographic findings of the groups.
| Panic Disorder Group (n = 40) | Control Group (n = 50) | p | |
|---|---|---|---|
| Baseline Demographic Parameters | |||
| Age (years) | 34.7 ± 8.7 | 34.5 ± 5.5 | 0.188 |
| Male sex, n (%) | 13 (32.5) | 20 (40%) | 0.139 |
| Married, n (%) | 20 (50%) | 20 (40%) | 0.231 |
| Smoking, n (%) | 12 (30) | 16 (32) | 0.511 |
| Body mass index (kg/m2) | 26.8 ± 2.3 | 25.9 ± 2.6 | 0.099 |
| Systolic BP (mmHg) | 125 (118–130) | 120 (120–125) | 0.077 |
| Diastolic BP (mmHg) | 73.8 ± 7.9 | 70.9 ± 9.1 | 0.120 |
| Severity Measure for Panic Disorder—Adult score | 21.2 ± 5.4 | ||
| Laboratory Parameters | |||
| Fasting glucose (mg/dL) | 96 (86–99) | 90 (86–95) | 0.052 |
| Creatinine (mg/dL) | 0.84 ± 0.15 | 0.82 ± 0.13 | 0.484 |
| Potassium (mmol/L) | 4.2 ± 0.2 | 4.2 ± 0.3 | 0.484 |
| Calcium (mg/dL) | 9.57 ± 0.42 | 9.65 ± 0.47 | 0.434 |
| Magnesium (mg/dL) | 2.1 ± 0.1 | 2.0 ± 0.2 | 0.235 |
| Thyroid-stimulating hormone (µU/mL) | 2.33 ± 1.20 | 2.60 ± 1.12 | 0.055 |
| Echocardiography Parameters | |||
| LV ejection fraction (%) | 55.3 ± 2.8 | 56.4 ± 3.1 | 0.080 |
| LVEDD (mm) | 43.7 ± 5.4 | 42.5 ± 3.6 | 0.190 |
| LVESD (mm) | 30.7 ± 4.2 | 30.9 ± 3.5 | 0.854 |
| Left atrial diameter (cm) | 3.7 ± 0.2 | 3.6 ± 0.3 | 0.197 |
BP: blood pressure; LV: left ventricular; LVEDD: LV end-diastolic dimension; LVESD: LV end-systolic dimension.
Table 2.
Electrocardiographic findings of the study population.
| Panic Disorder Group (n = 40) | Control Group (n = 50) | p | |
|---|---|---|---|
| Heart rate (beats/min) | 80.2 ± 13.6 | 73.7 ± 11.2 | 0.017 |
| QRS duration (ms) | 86.7 ± 6.6 | 89.1 ± 6.3 | 0.094 |
| QT interval (ms) | 362.8 ± 24.9 | 361.9 ± 22.2 | 0.884 |
| QTc interval (ms) | 407.8 ± 21.2 | 405.1 ± 20.9 | 0.645 |
| QTd interval (ms) | 49 [40–60] | 45 [40–60] | 0.010 |
| cQTd interval (ms) | 62.4 ± 11.6 | 52.5 ± 17.3 | 0.004 |
| Tp-e interval (ms) | 74.8 ± 13.6 | 66.5 ± 10.6 | 0.002 |
| cTp-e interval (ms) | 89.6 ± 15.1 | 74.9 ± 11.7 | <0.001 |
| Tp-e/QT ratio | 0.20 ± 0.04 | 0.18 ± 0.03 | 0.003 |
| Tp-e/QTc ratio | 0.18 ± 0.03 | 0.16 ± 0.03 | 0.005 |
QTc: corrected QT; QTd: QT dispersion; Tp-e: transmural dispersion of repolarization; cTp-e: corrected transmural dispersion of repolarization.
Table 3.
Correlations between panic disorder scale and electrocardiography parameters.
| r | p | |
|---|---|---|
| Heart rate (beats/min) | 0.260 | 0.007 |
| QRS duration | −0.151 | 0.082 |
| QT interval | −0.030 | 0.391 |
| QTc interval | −0.015 | 0.444 |
| QTd interval (ms) | 0.277 | 0.005 |
| cQTd interval (ms) | 0.294 | 0.003 |
| Tp-e interval (ms) | 0.369 | <0.001 |
| cTp-e interval (ms) | 0.531 | <0.001 |
| Tp-e/QT ratio | 0.358 | 0.001 |
| Tp-e/QTc ratio | 0.351 | 0.001 |
QTc: corrected QT; QTd: QT dispersion; Tp-e: transmural dispersion of repolarization; cTp-e: corrected transmural dispersion of repolarization.
Table 4.
Logistic regression analysis results of investigation of the effect of ECG variables over panic disorder.
Table 4.
Logistic regression analysis results of investigation of the effect of ECG variables over panic disorder.
| Beta | p-Value | EXP (beta) | 95% CI for EXP (beta) | ||
|---|---|---|---|---|---|
| Lower | Upper | ||||
| BPM (beats/min) | 0.059 | 0.147 | 1.060 | 0.980 | 1.148 |
| QT | 0.040 | 0.944 | 1.004 | 0.891 | 1.131 |
| QTc | −0.109 | 0.166 | 0.897 | 0.769 | 1.046 |
| QTd | 0.056 | 0.071 | 1.057 | 0.995 | 1.123 |
| cQTd | 0.045 | 0.026 | 1.053 | 1.006 | 1.101 |
| Tp-e interval | 0.576 | 0.231 | 1.778 | 0.694 | 4.556 |
| cTp-e interval | 0.217 | <0.001 | 1.242 | 1.103 | 1.400 |
| Tp-e/QT ratio | −25.445 | 0.346 | 0.000 | 0.000 | 9.001 |
| Tp-e/QTc ratio | −252.844 | 0.187 | 0.000 | 0.000 | 2.611 |
| Constant | 32.618 | 0.293 | 1.465 | ||
CI: confidence interval; ECG: electrocardiography; QTc: corrected QT; QTd: QT dispersion; Tp-e: transmural dispersion of repolarization; cTp-e: corrected transmural dispersion of repolarization.
© 2020 by the authors. Licensee MDPI, Basel, Switzerland. This article is an open access article distributed under the terms and conditions of the Creative Commons Attribution (CC BY) license (http://creativecommons.org/licenses/by/4.0/).
Share and Cite
MDPI and ACS Style
Afsin, A.; Asoğlu, R.; Orum, M.H.; Cicekci, E. Evaluation of TP-E Interval and TP-E/QT Ratio in Panic Disorder. Medicina 2020, 56, 215. https://0-doi-org.brum.beds.ac.uk/10.3390/medicina56050215
AMA Style
Afsin A, Asoğlu R, Orum MH, Cicekci E. Evaluation of TP-E Interval and TP-E/QT Ratio in Panic Disorder. Medicina. 2020; 56(5):215. https://0-doi-org.brum.beds.ac.uk/10.3390/medicina56050215
Chicago/Turabian StyleAfsin, Abdulmecit, Ramazan Asoğlu, Mehmet Hamdi Orum, and Elvan Cicekci. 2020. "Evaluation of TP-E Interval and TP-E/QT Ratio in Panic Disorder" Medicina 56, no. 5: 215. https://0-doi-org.brum.beds.ac.uk/10.3390/medicina56050215