Metabolomics Analytics Workflow for Epidemiological Research: Perspectives from the Consortium of Metabolomics Studies (COMETS) †

 , , , ,
  , , ,
, , ,  add
Show full author list
add
Show full author list
Abstract
: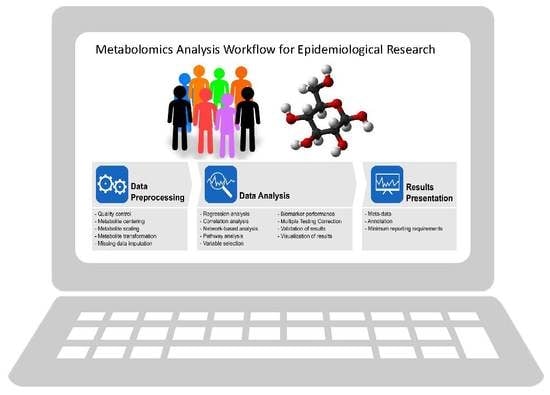
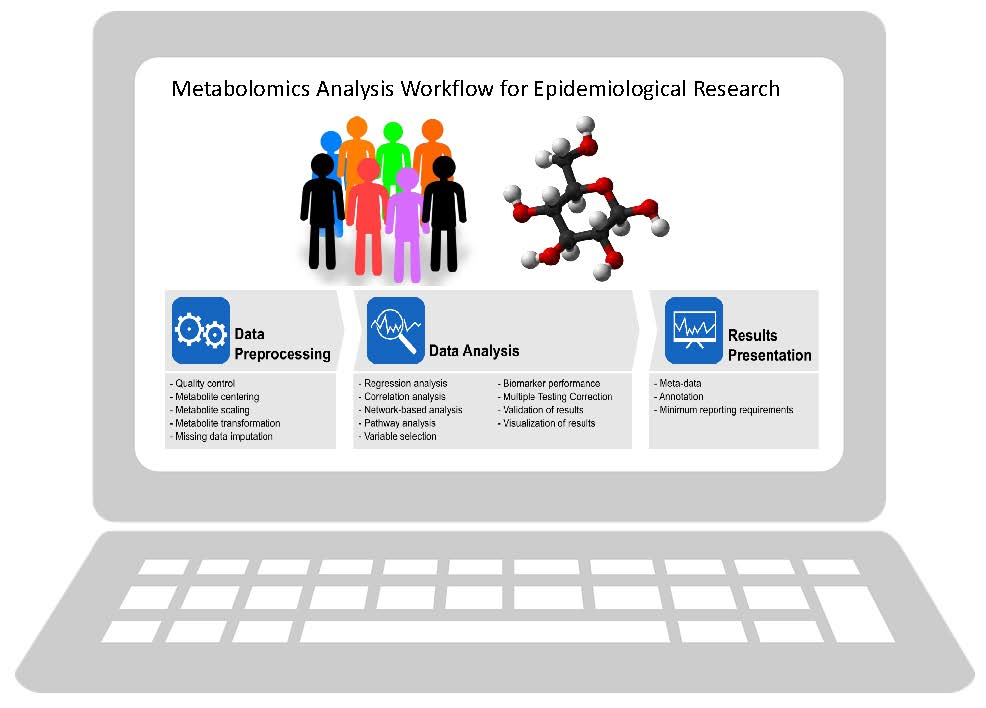
1. Introduction
2. Results
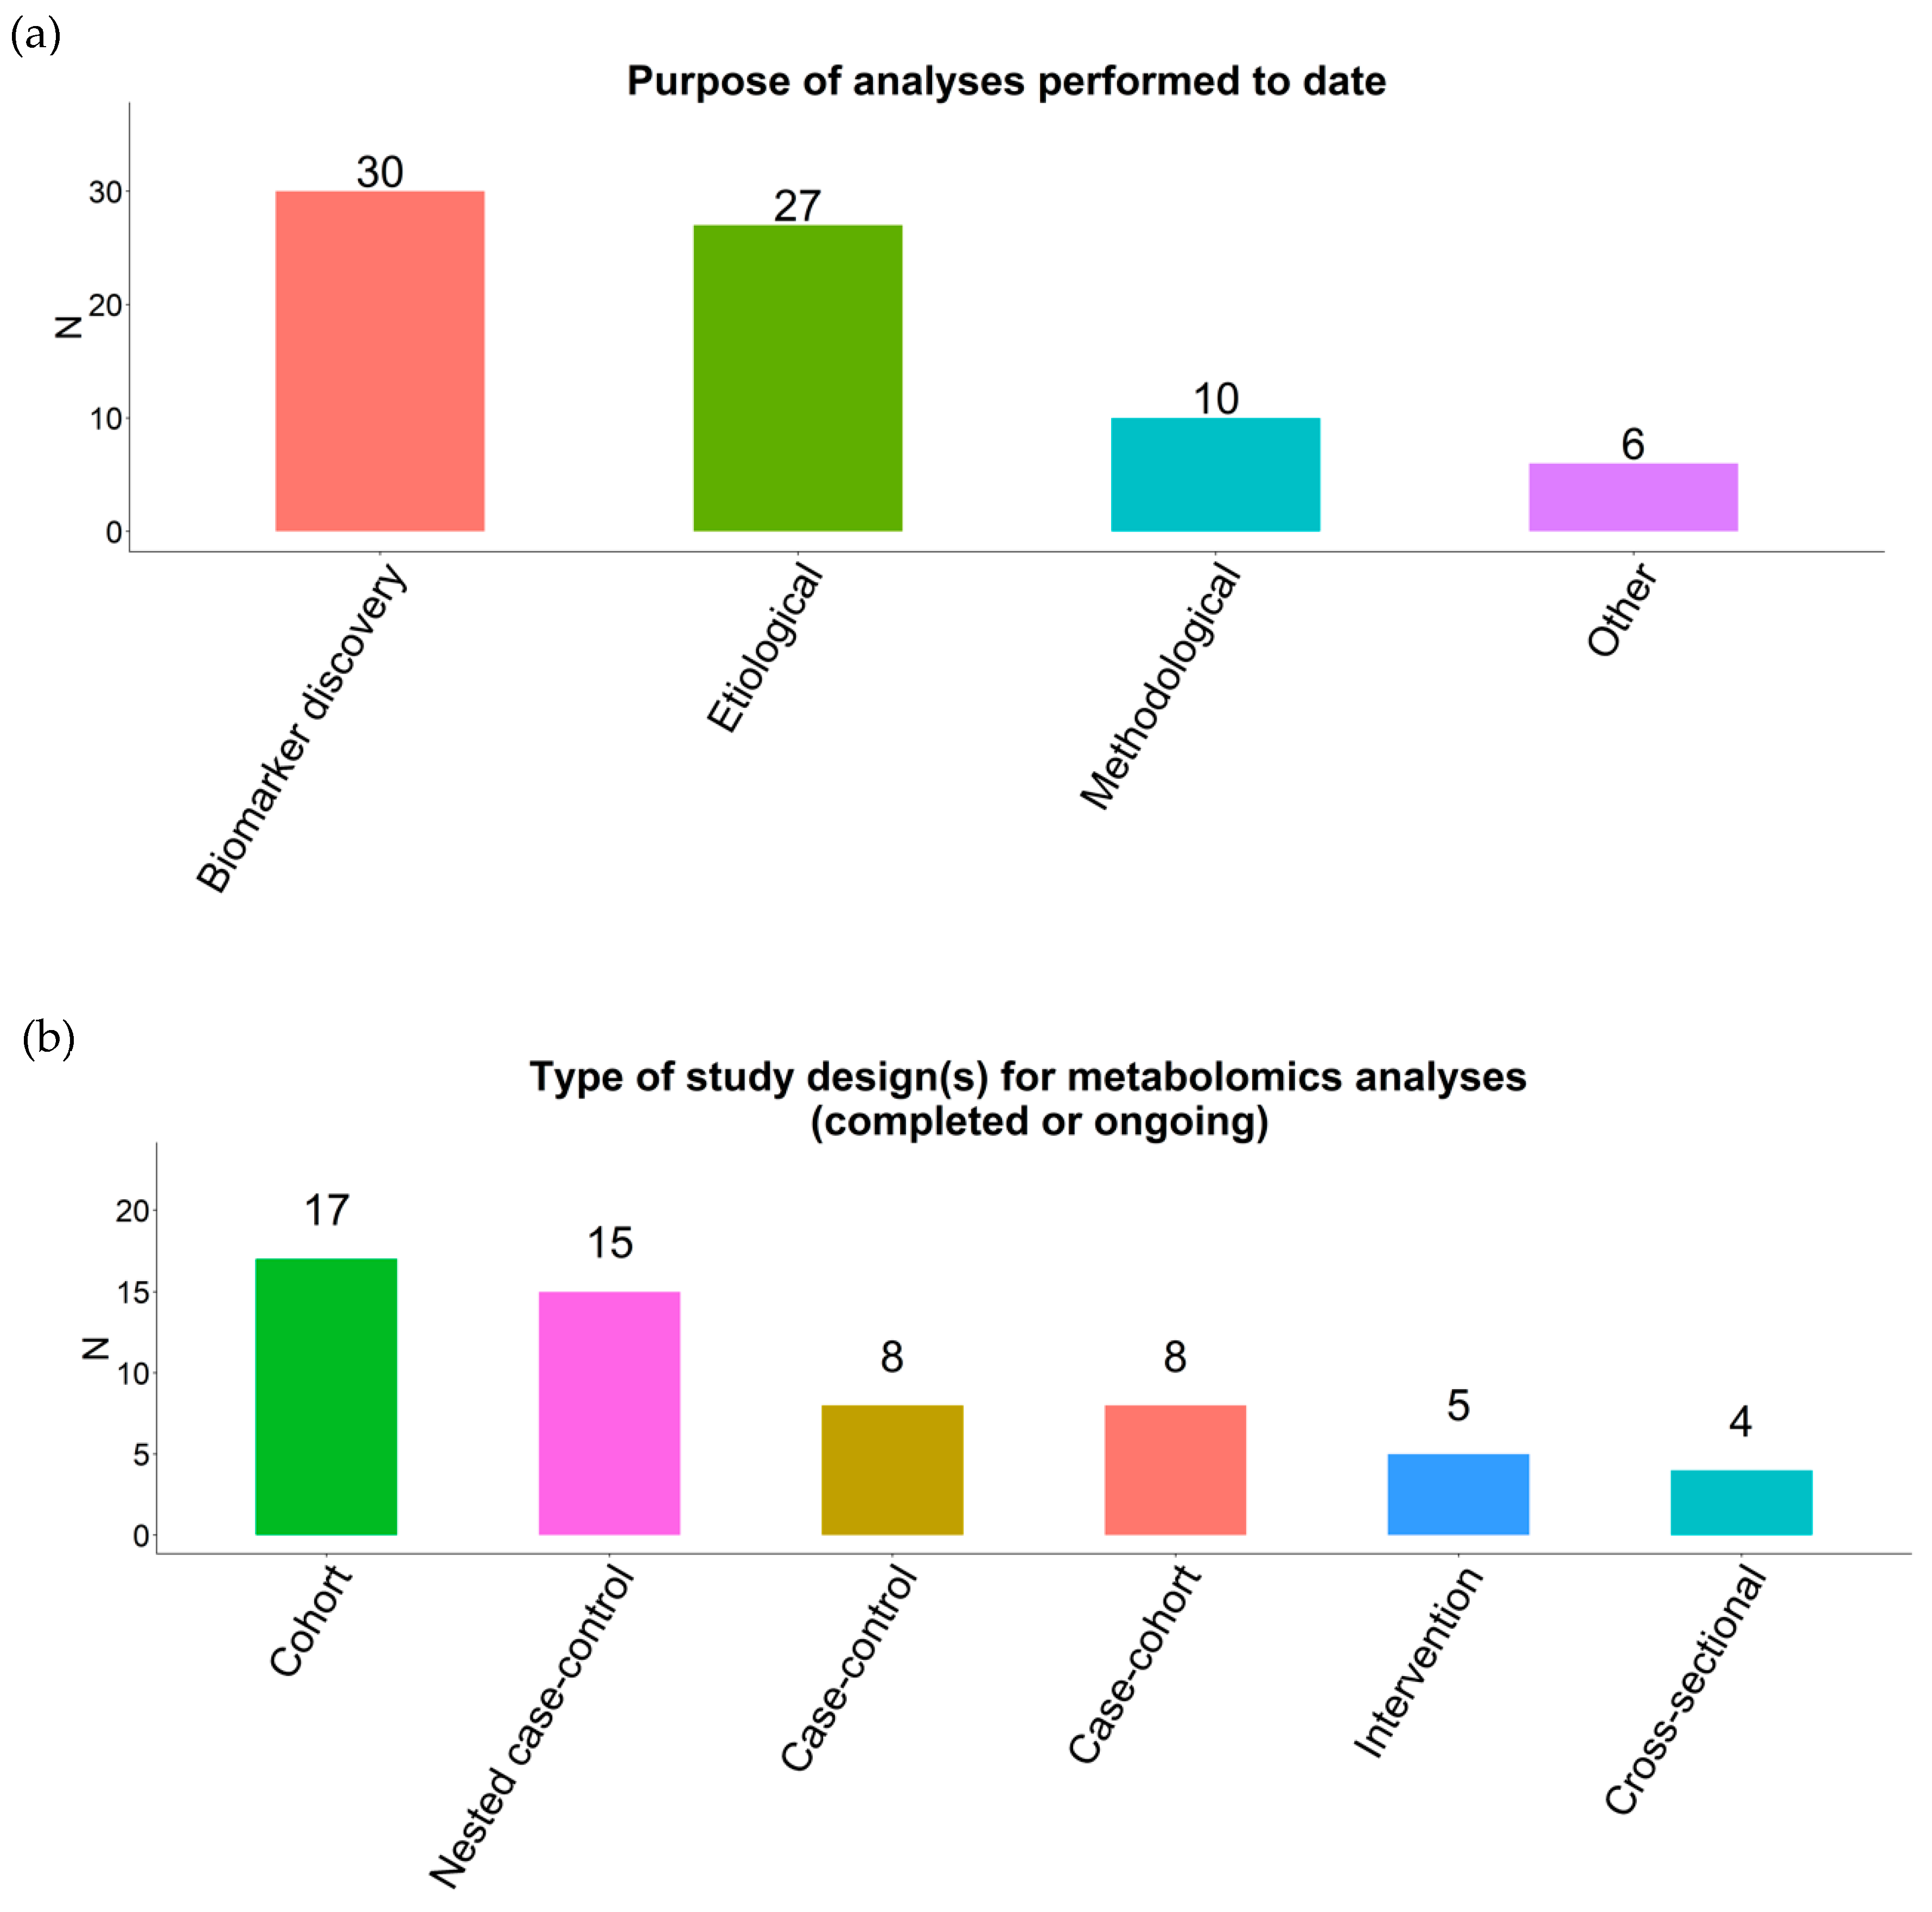
2.1. Response Rate
2.2. Datasets
2.3. Power Calculations
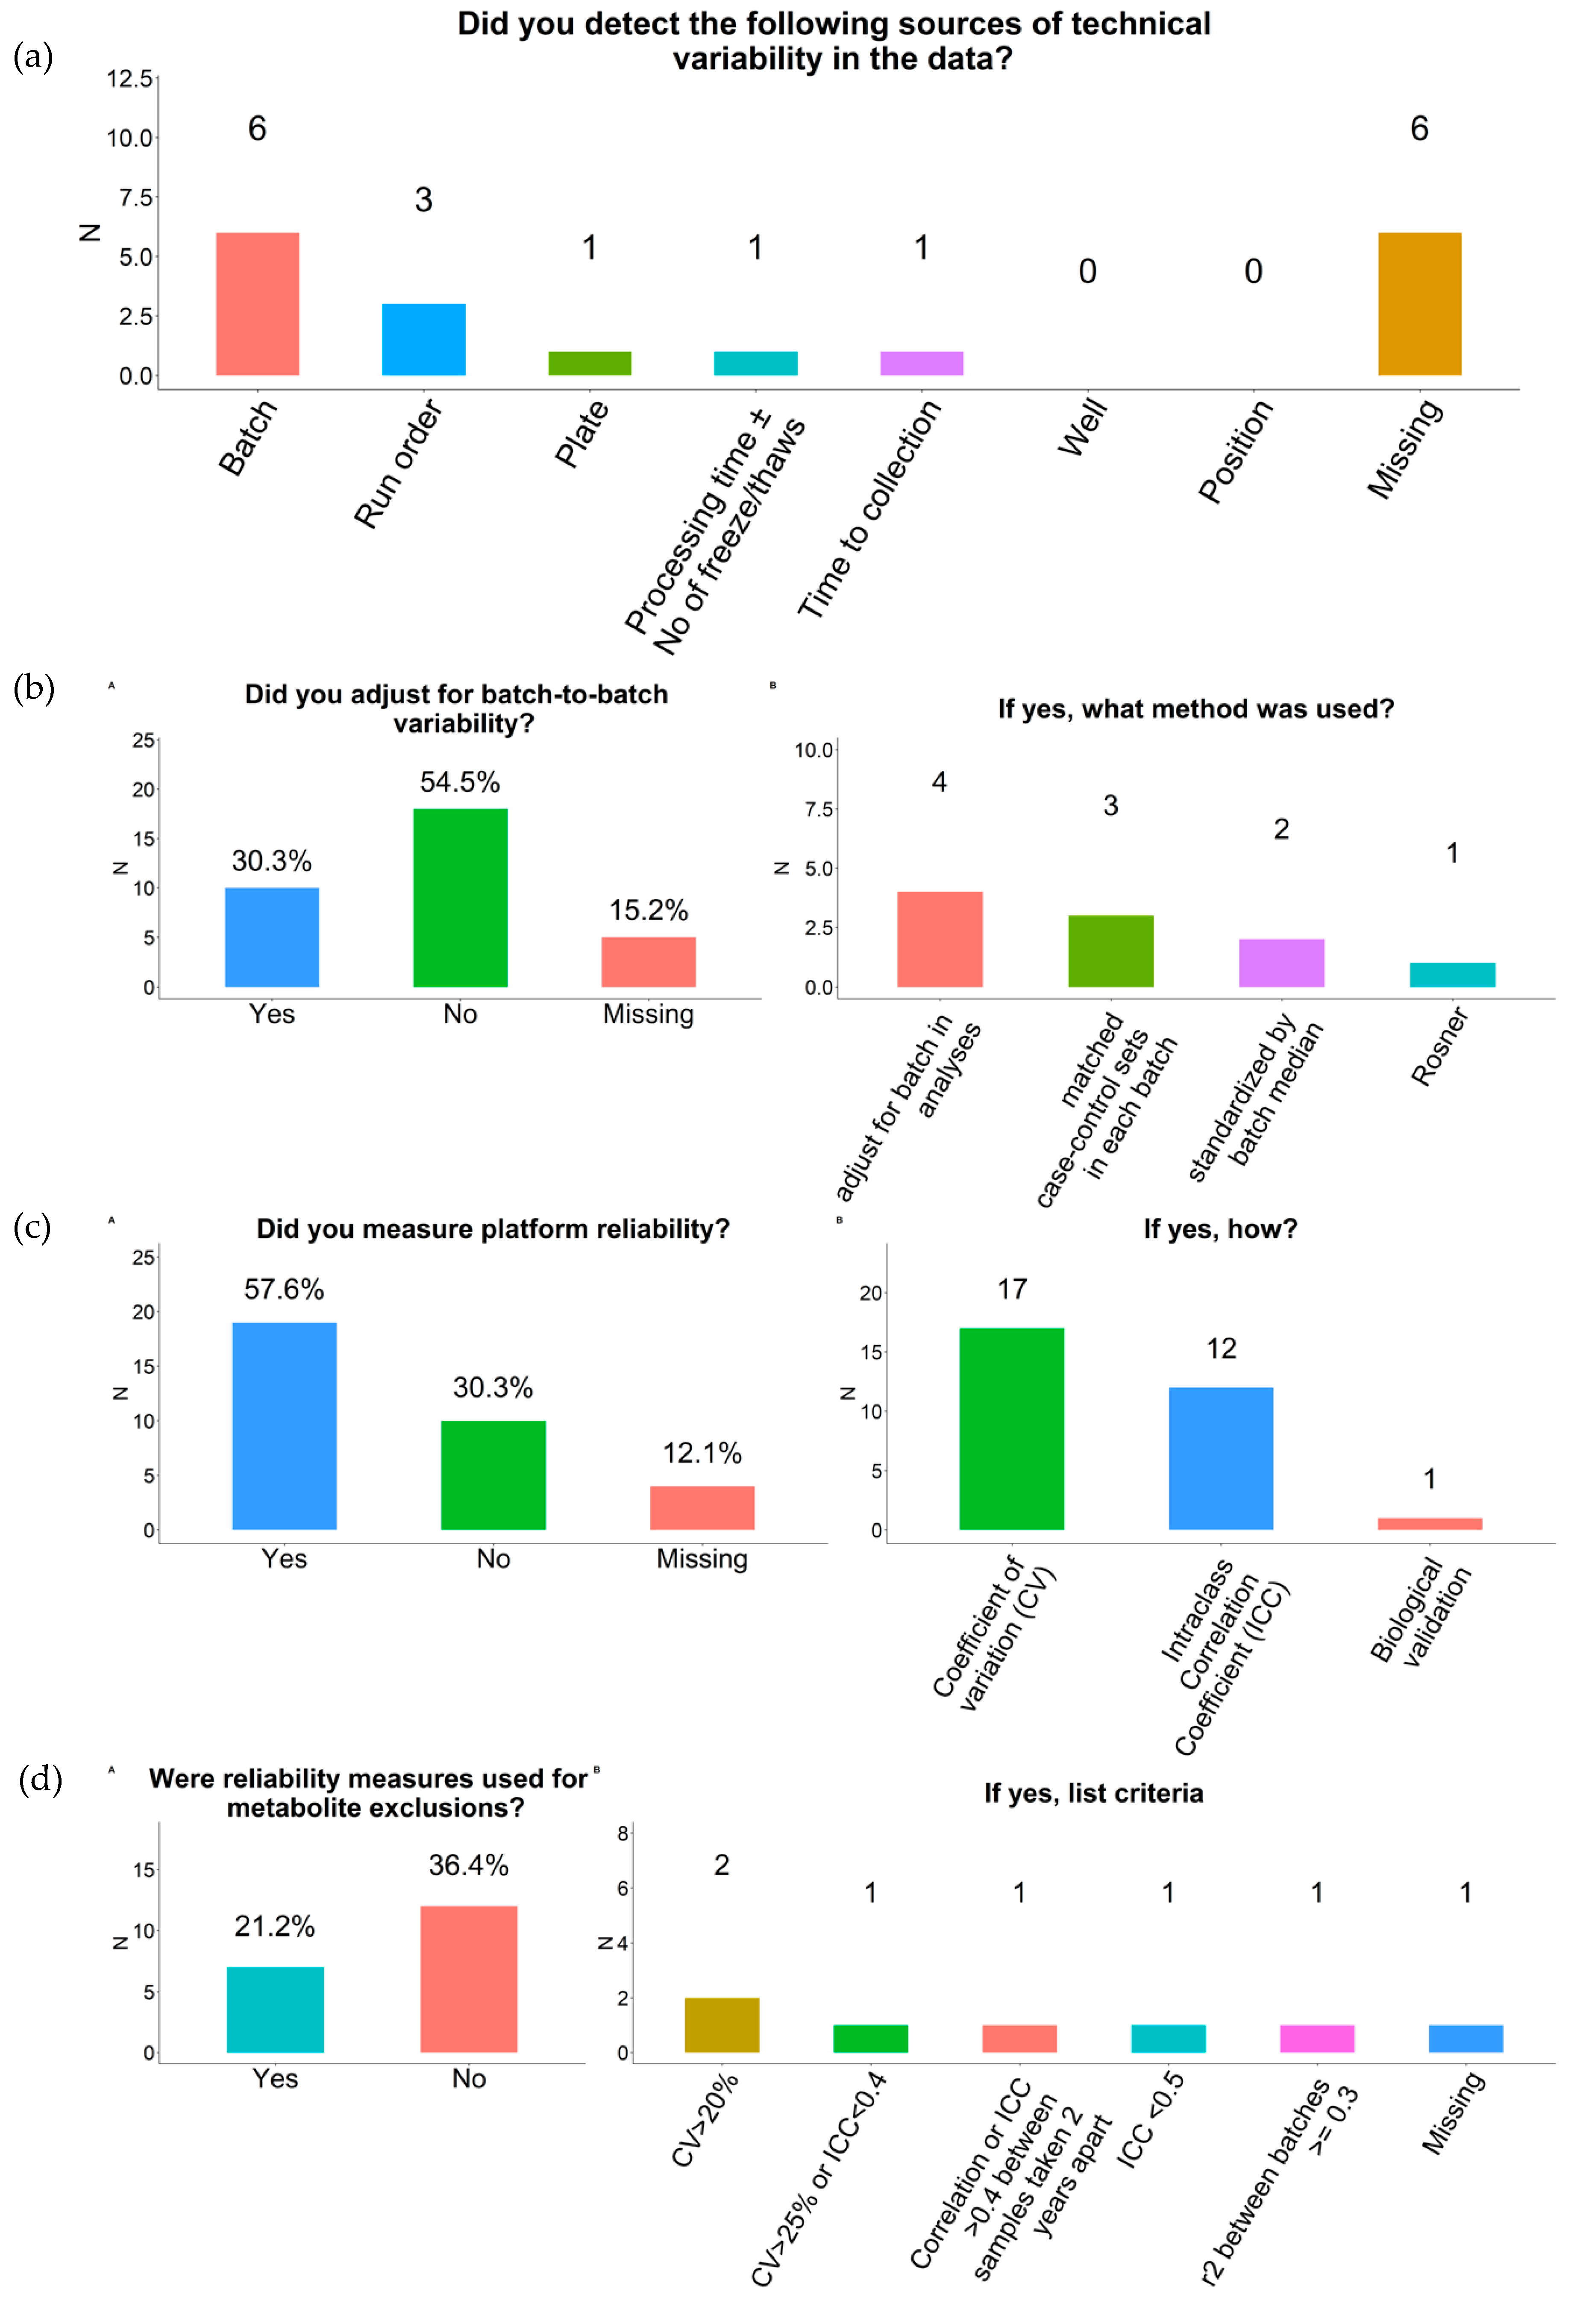
2.4. Outliers and Technical Variability
2.5. Data Preparation
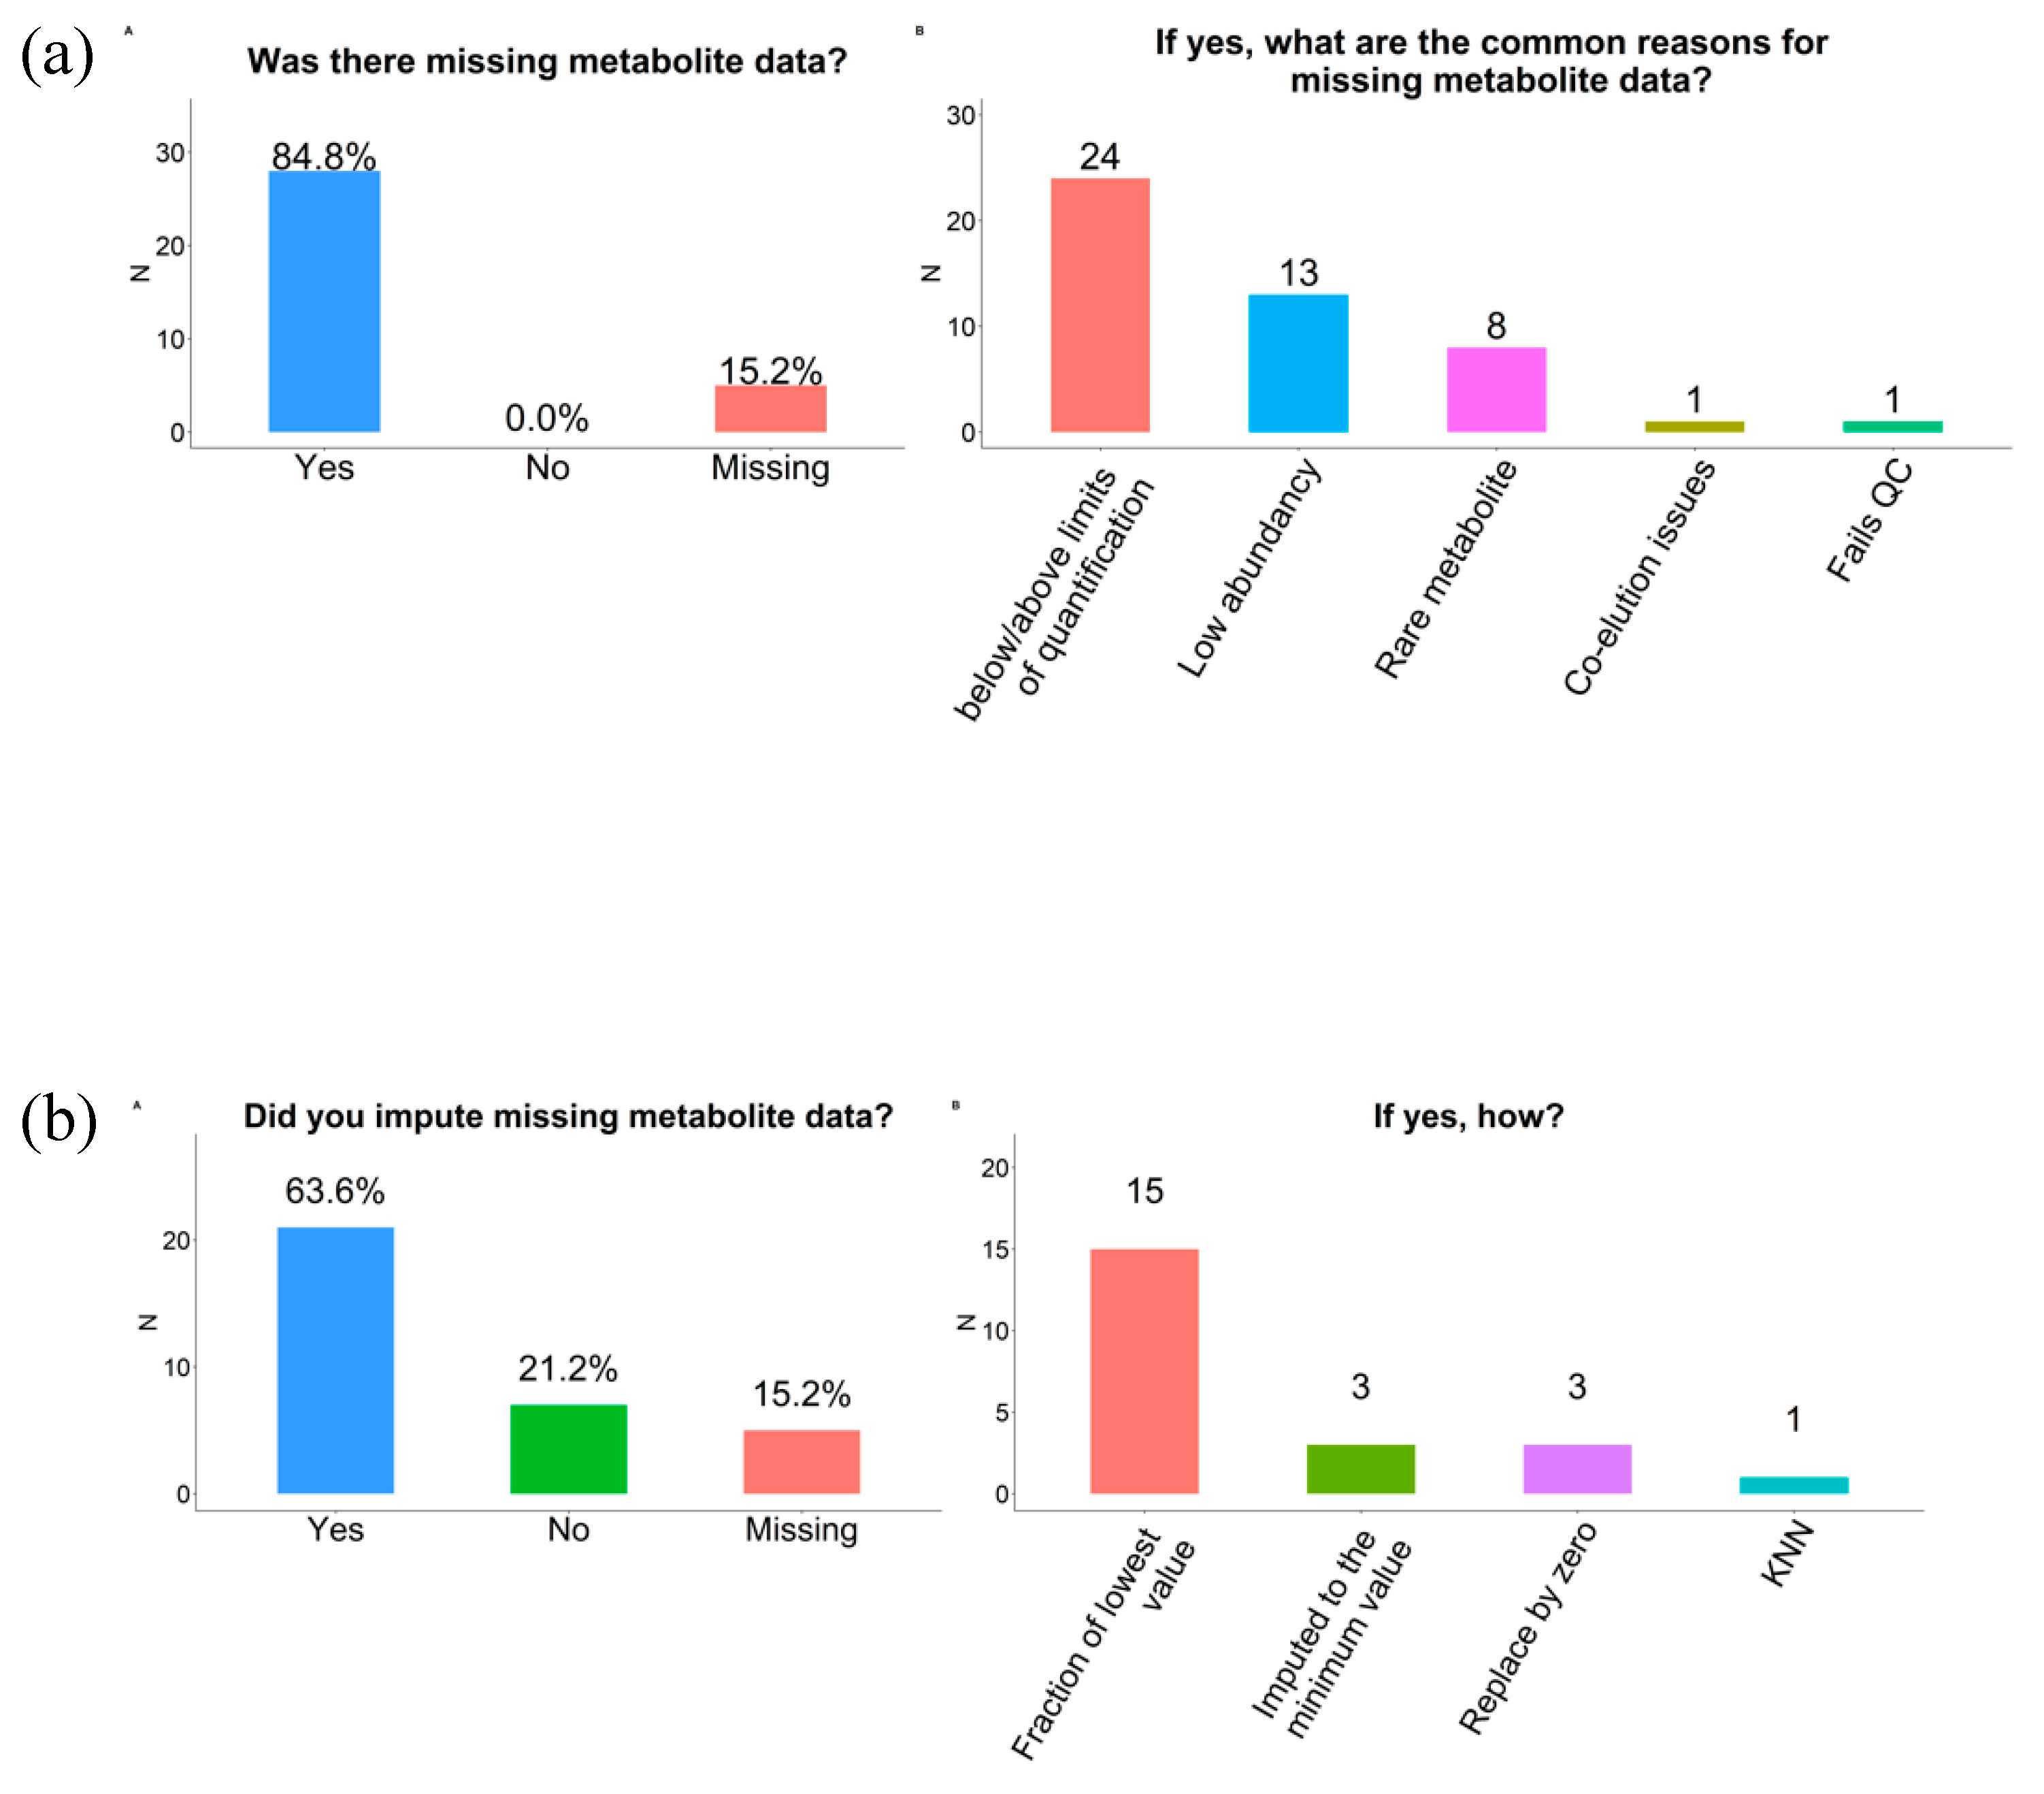
2.6. Missing Data
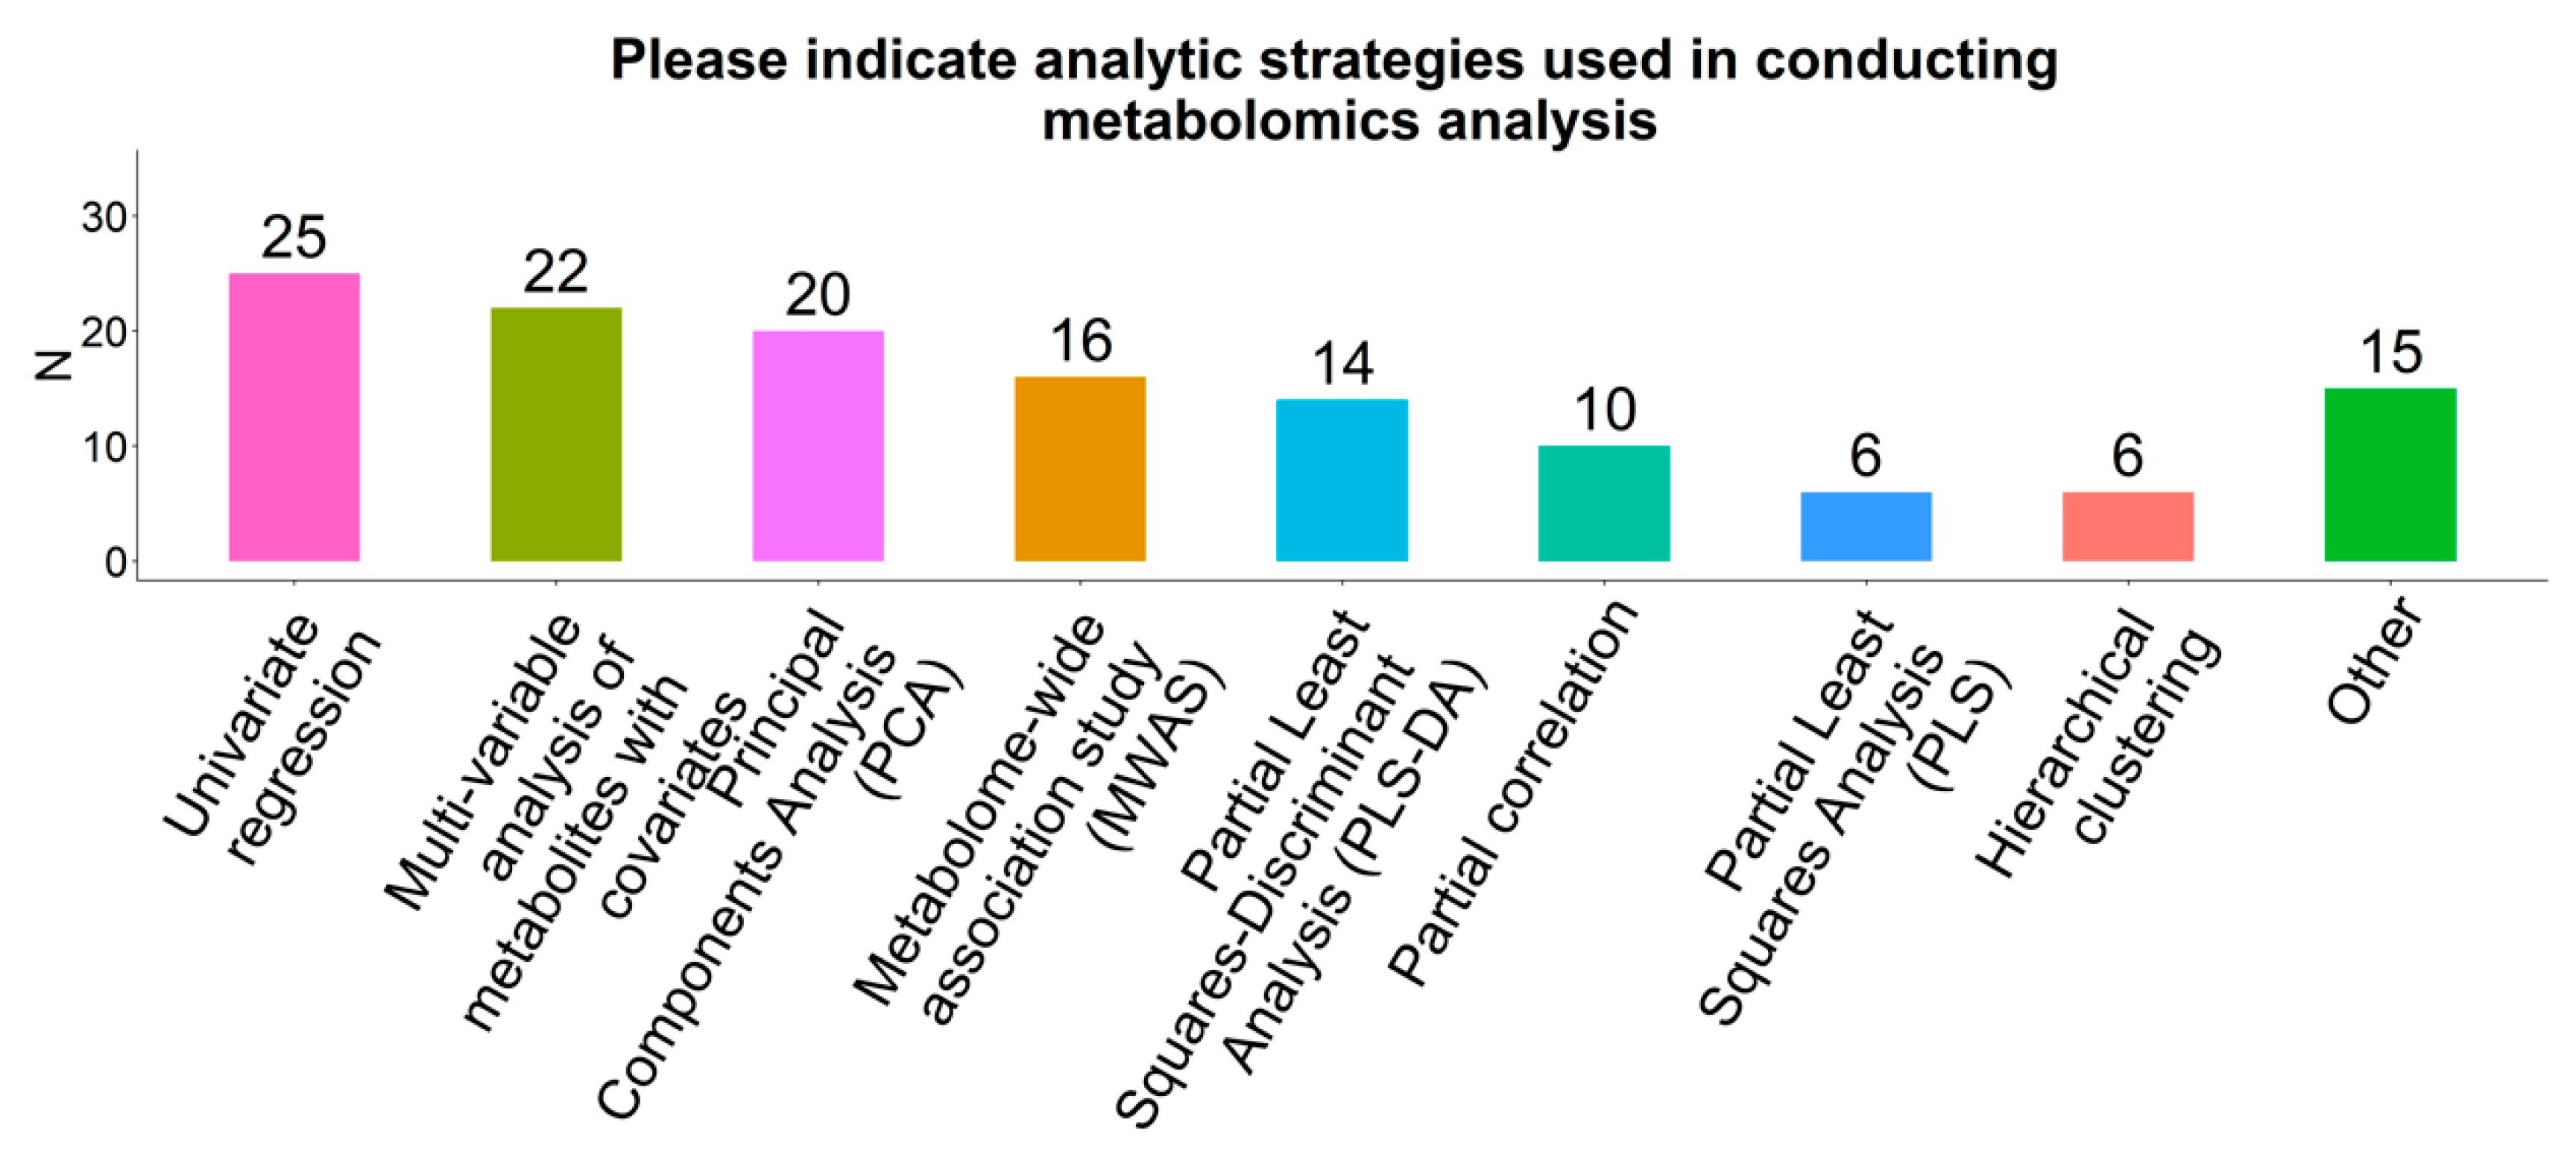
2.7. Statistical Analysis Methods
2.8. Cross Validation and External Validation
2.9. Visualization
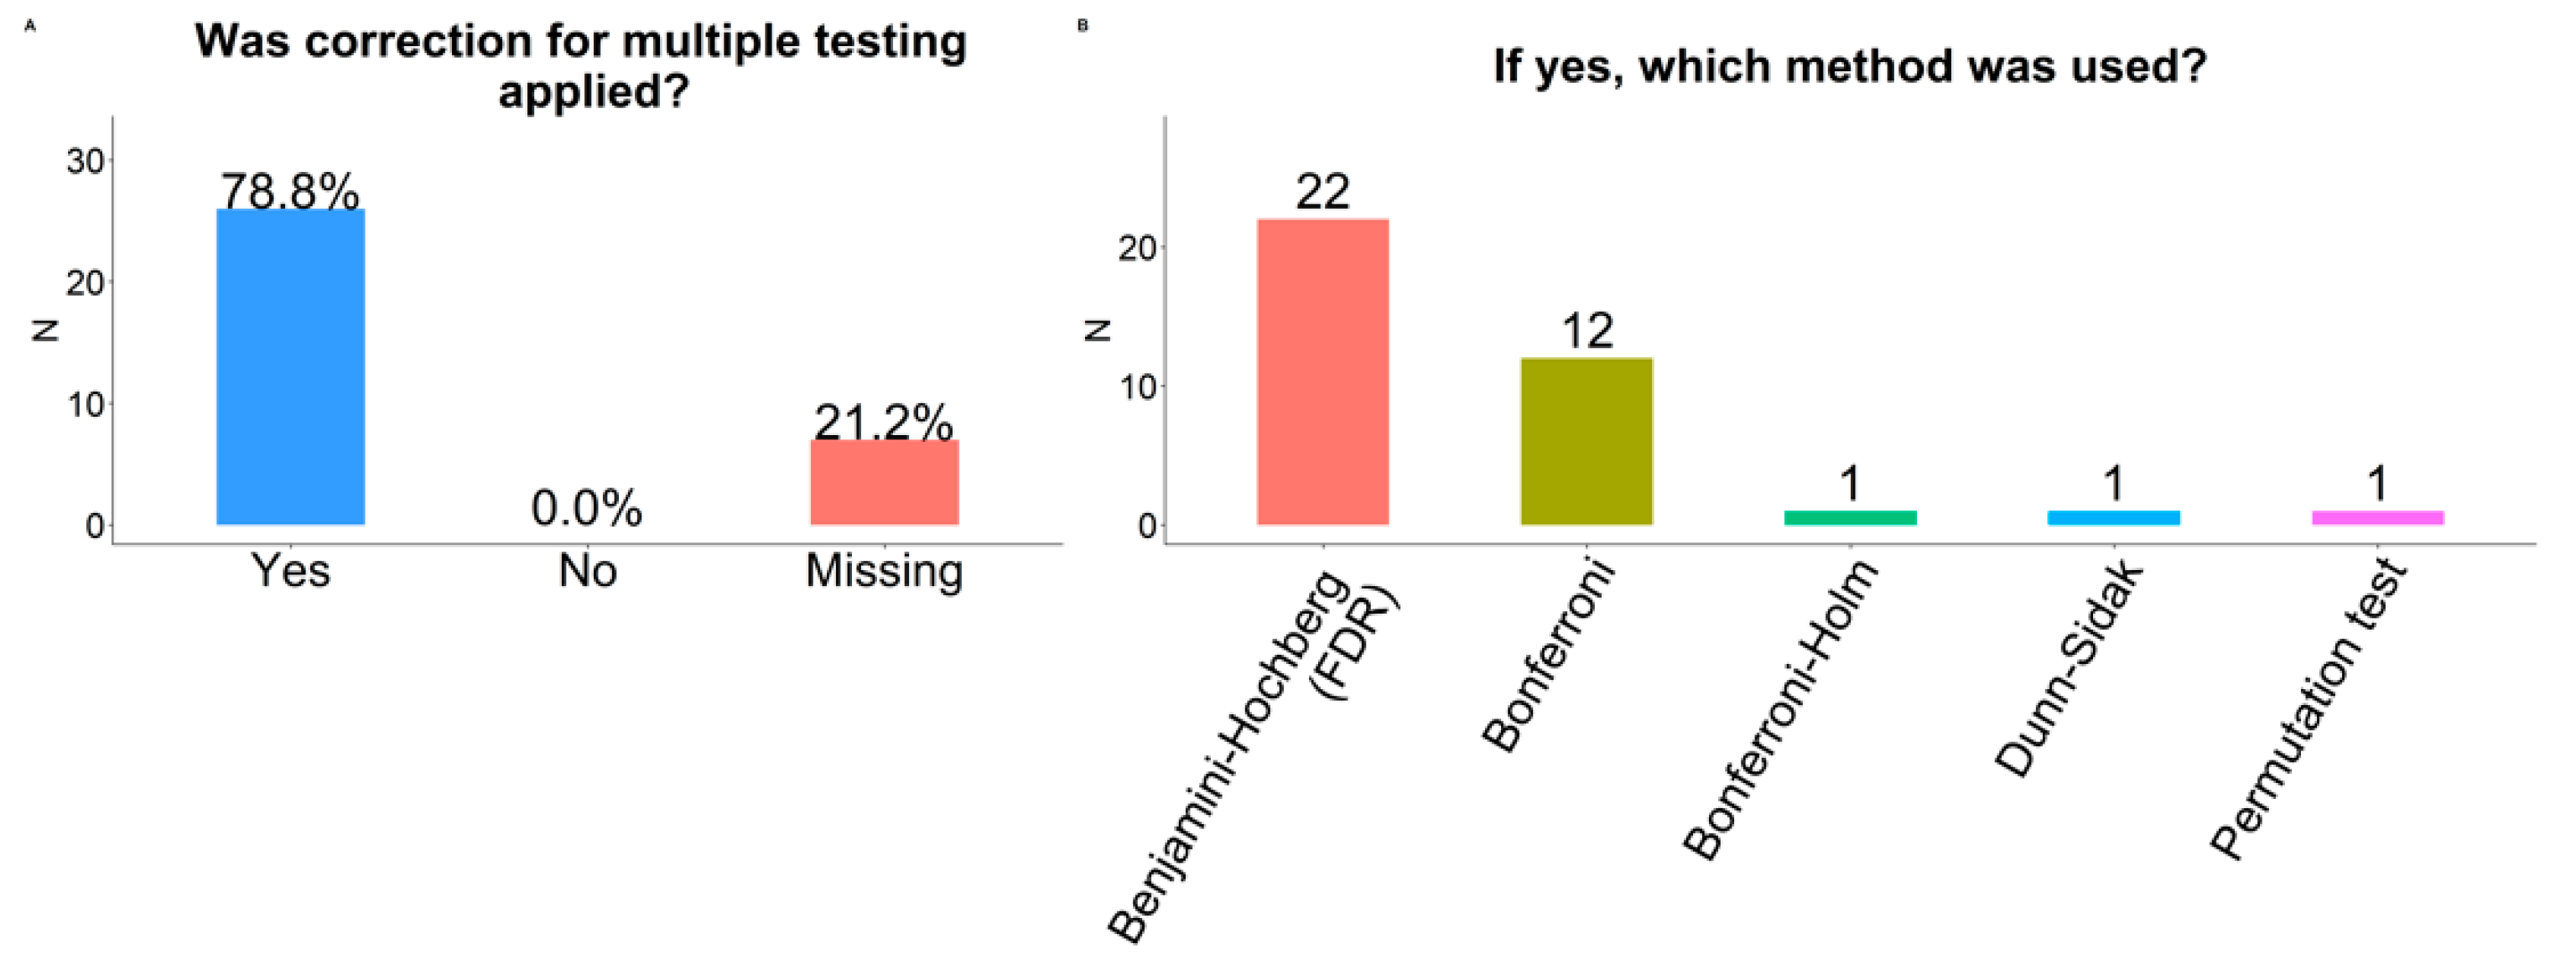
2.10. Multiple Testing Correction
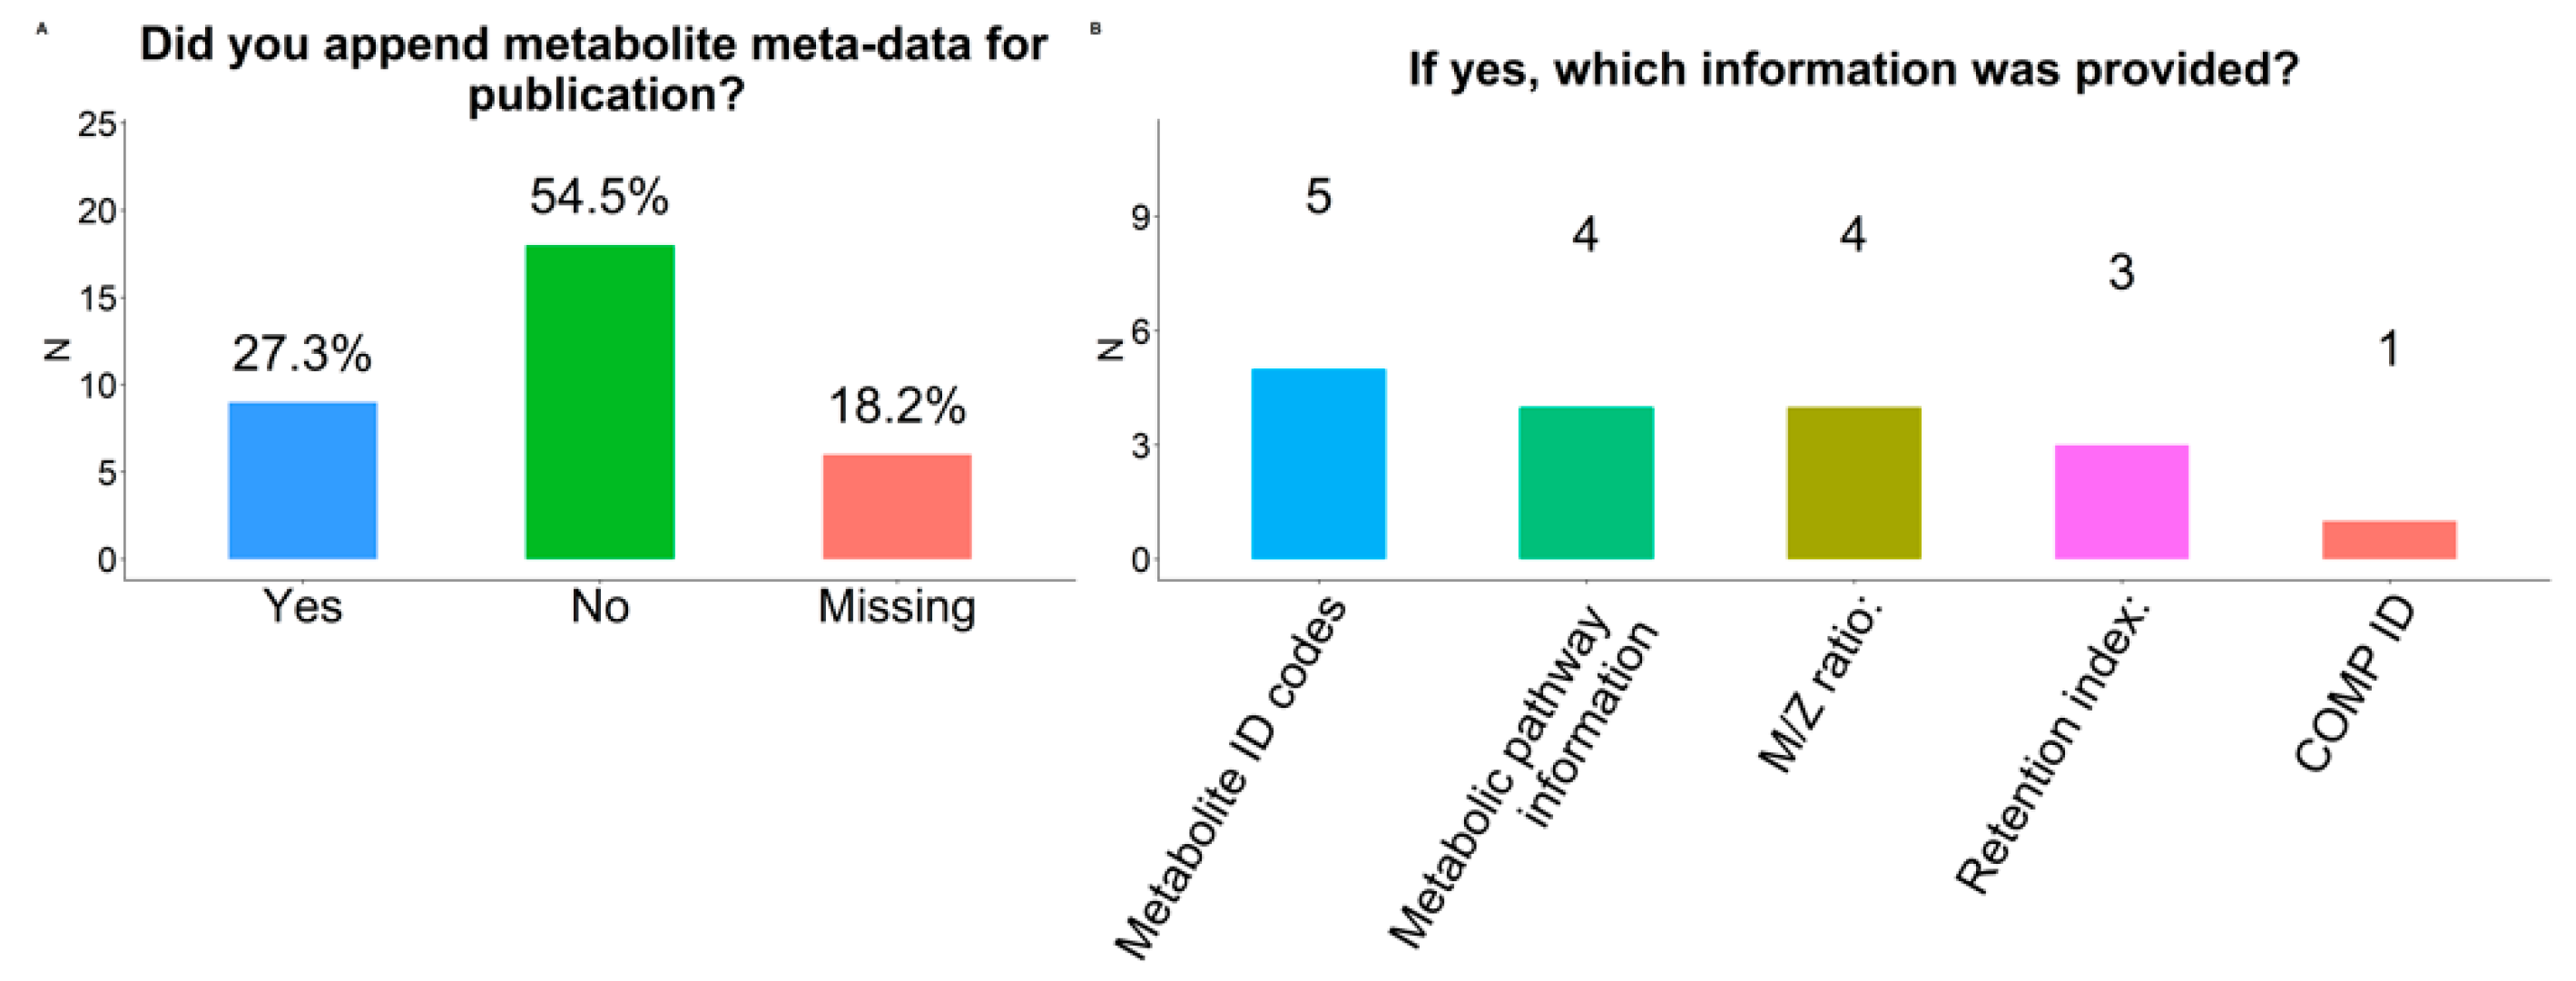
2.11. Meta-Data
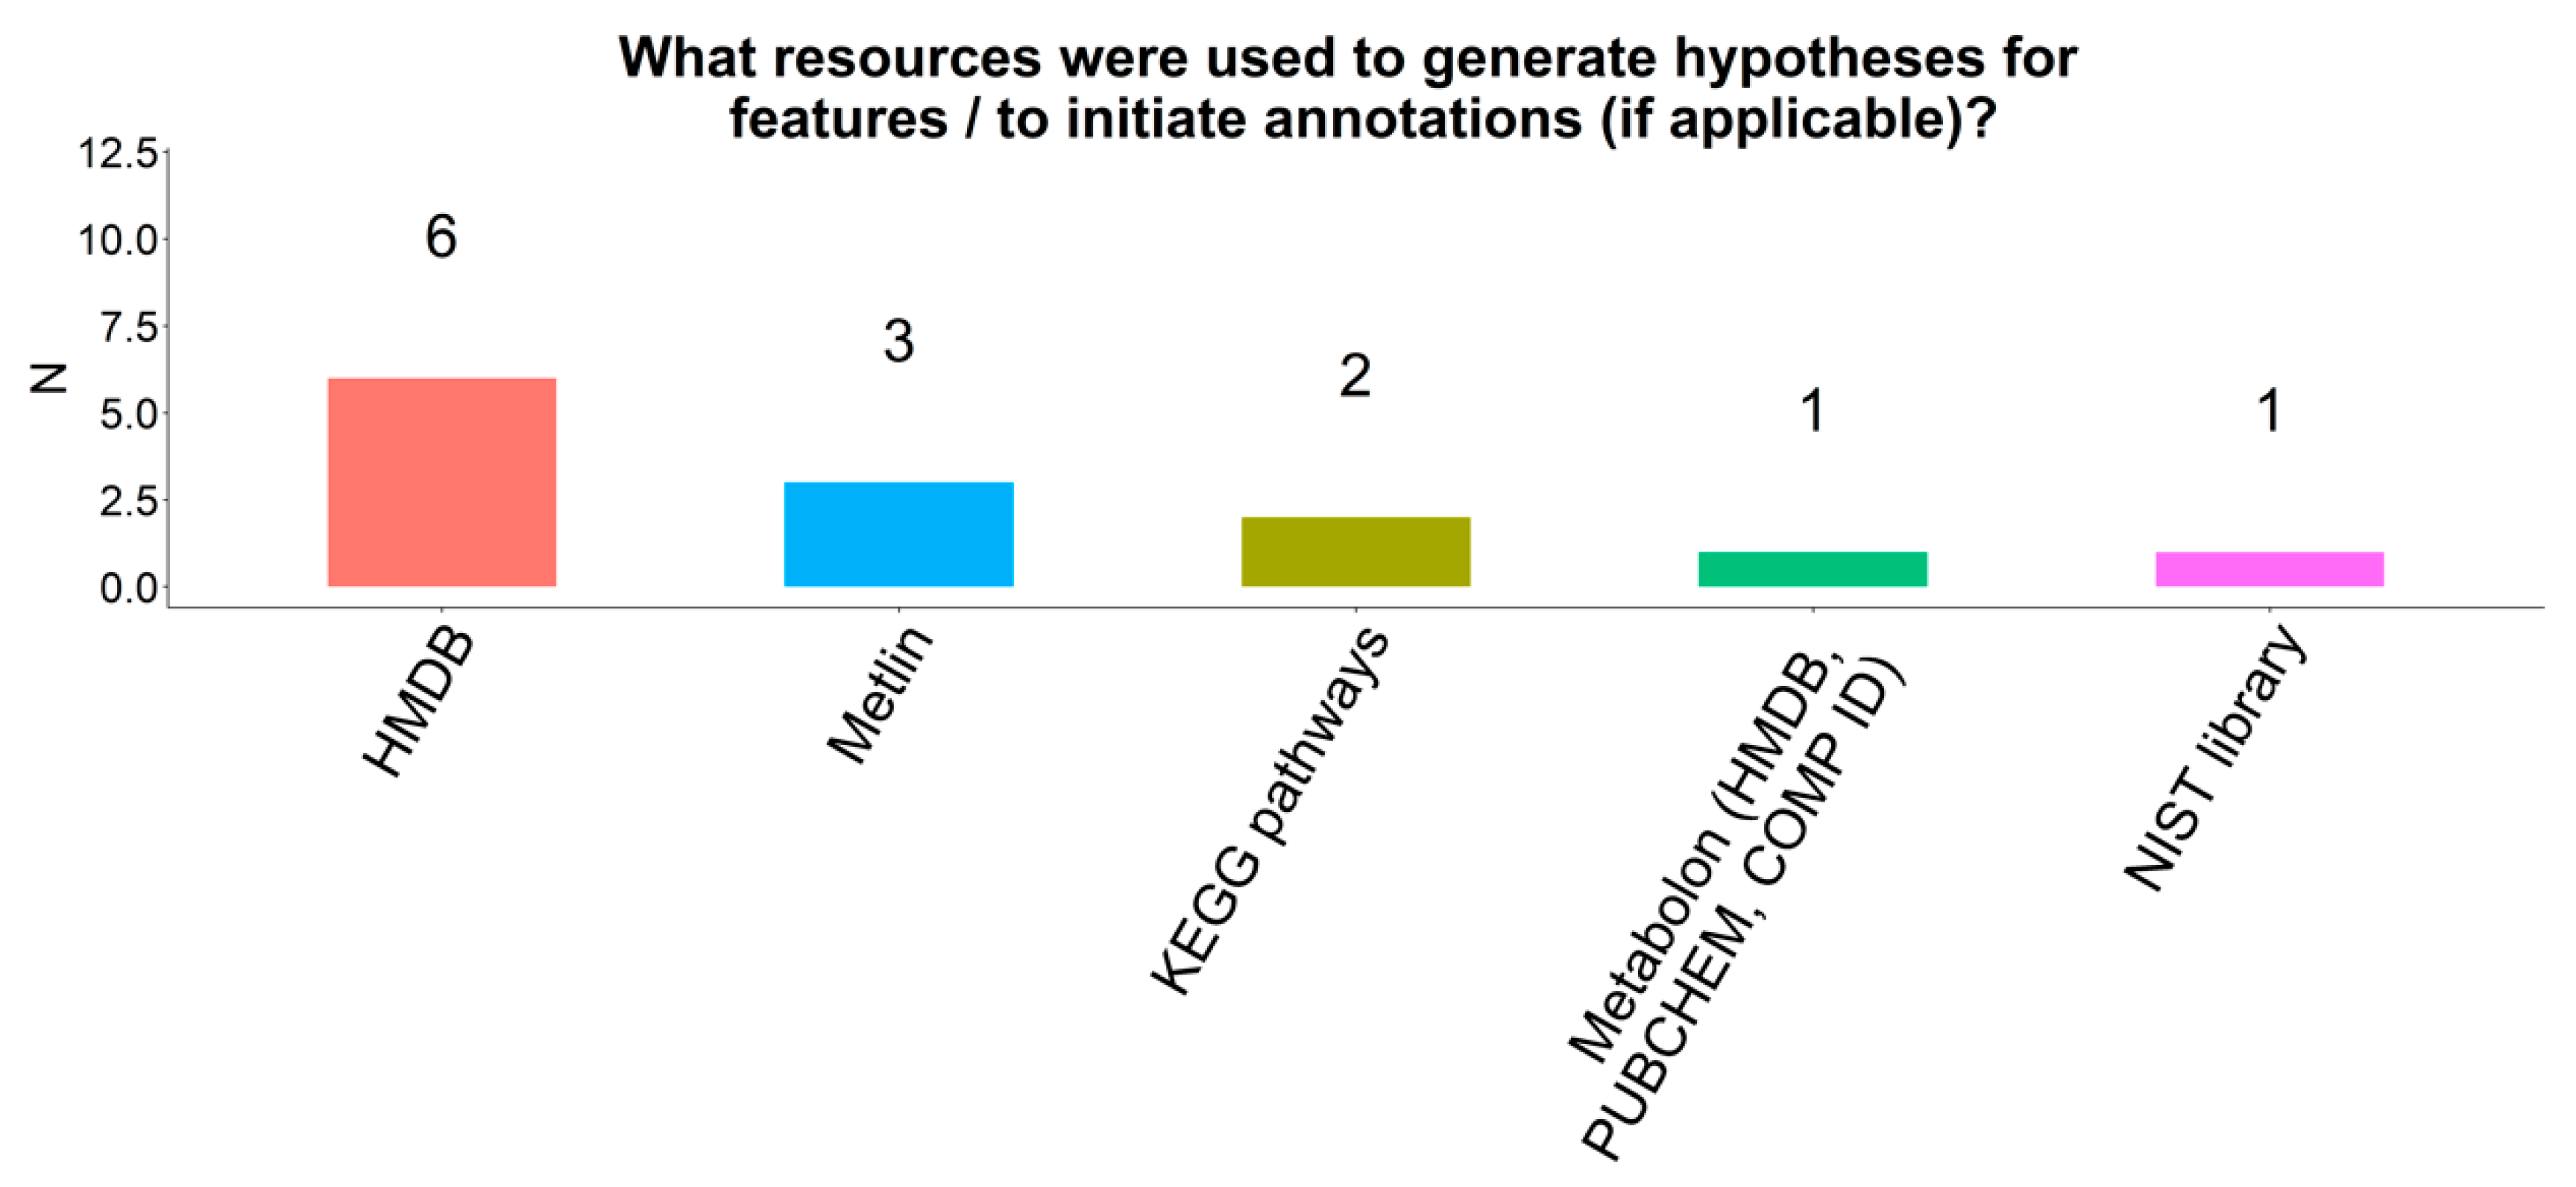
2.12. Annotations
2.13. Coding Language
2.14. Software
2.15. Minimum Reporting Standards
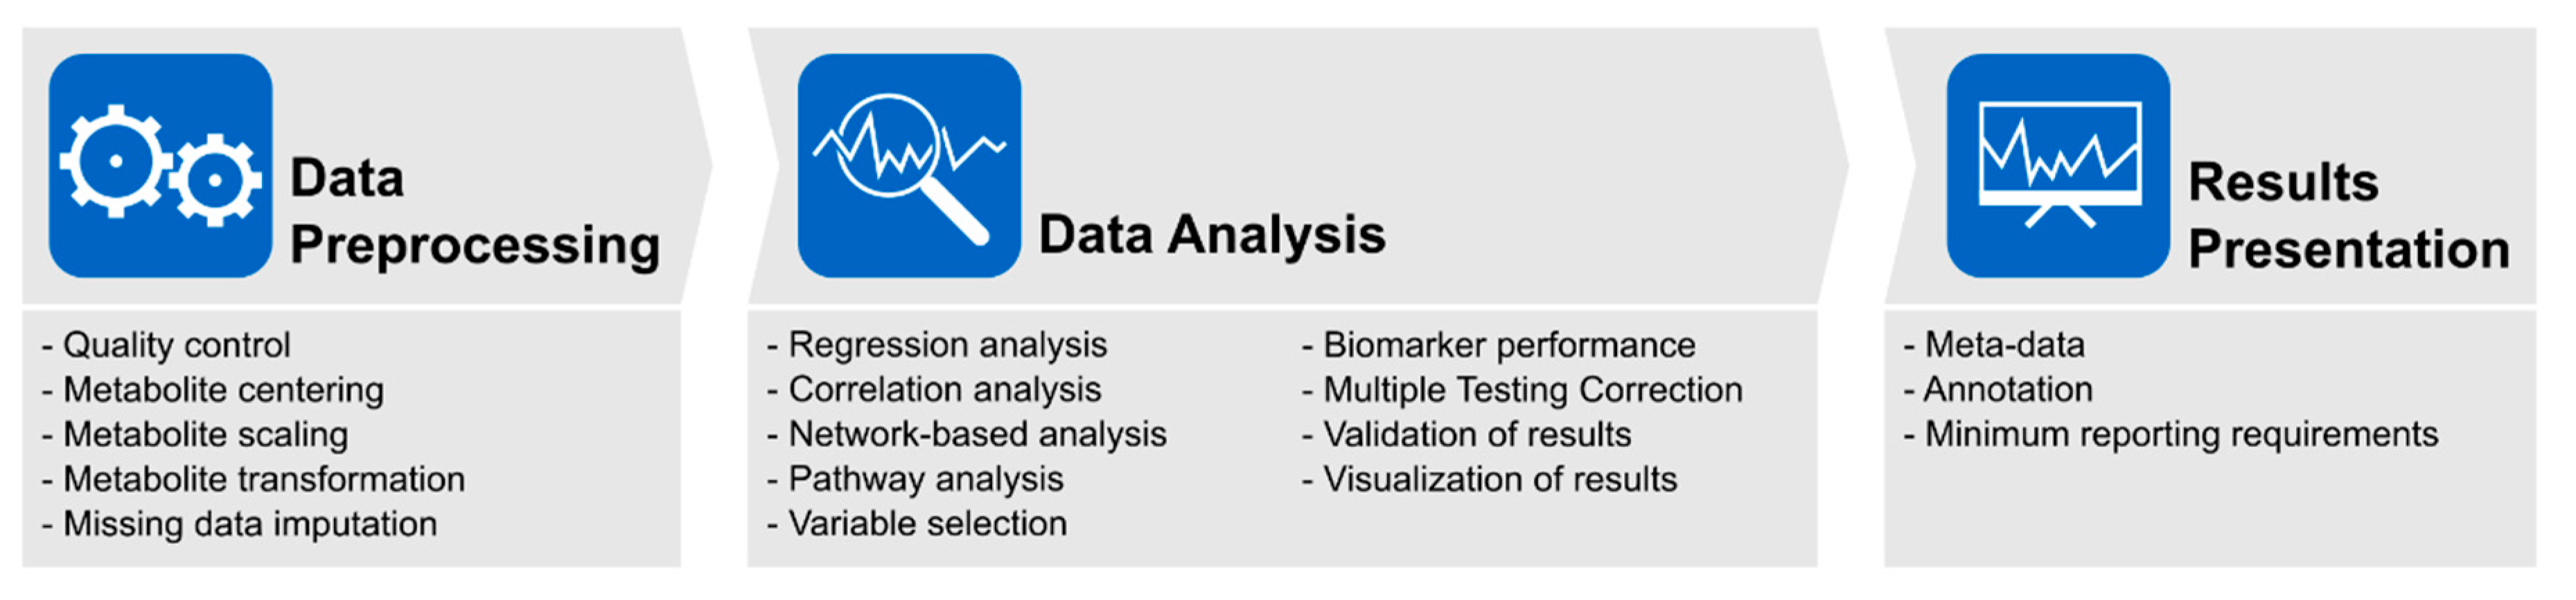
3. Discussion
3.1. Data Pre-Processing
3.2. Data Analysis
3.2.1. Analytic Approaches
3.2.2. Correction for Multiple Statistical Testing
3.2.3. Classification Performance
3.2.4. Meta-Data
3.2.5. Validation
3.2.6. Coding Language
3.3. Reporting of Data Analysis Workflow
4. Materials and Methods
4.1. Study Population
4.2. Questionnaire
5. Conclusions
Supplementary Materials
Author Contributions
Funding
Acknowledgments
Conflicts of Interest
References
- Su, L.J.; Fiehn, O.; Maruvada, P.; Moore, S.C.; O’Keefe, S.J.; Wishart, D.S.; Zanetti, K.A. The use of metabolomics in population-based research. Adv. Nutr. 2014, 5, 785–788. [Google Scholar] [CrossRef] [PubMed]
- Beger, R.D.; Dunn, W.; Schmidt, M.A.; Gross, S.S.; Kirwan, J.A.; Cascante, M.; Brennan, L.; Wishart, D.S.; Oresic, M.; Hankemeier, T.; et al. Metabolomics enables precision medicine: “A White Paper, Community Perspective”. Metabolomics 2016, 12, 149. [Google Scholar] [CrossRef] [PubMed]
- Liesenfeld, D.B.; Habermann, N.; Owen, R.W.; Scalbert, A.; Ulrich, C.M. Review of mass spectrometry-based metabolomics in cancer research. Cancer Epidemiol. Biomark. Prev. 2013, 22, 2182–2201. [Google Scholar] [CrossRef] [PubMed]
- Guasch-Ferre, M.; Hruby, A.; Toledo, E.; Clish, C.B.; Martinez-Gonzalez, M.A.; Salas-Salvado, J.; Hu, F.B. Metabolomics in Prediabetes and Diabetes: A Systematic Review and Meta-analysis. Diabetes Care 2016, 39, 833–846. [Google Scholar] [CrossRef] [PubMed] [Green Version]
- Johnson, C.H.; Ivanisevic, J.; Siuzdak, G. Metabolomics: Beyond biomarkers and towards mechanisms. Nat. Rev. Mol. Cell Biol. 2016, 17, 451–459. [Google Scholar] [CrossRef]
- Gu, F.; Derkach, A.; Freedman, N.D.; Landi, M.T.; Albanes, D.; Weinstein, S.J.; Mondul, A.M.; Matthews, C.E.; Guertin, K.A.; Xiao, Q.; et al. Cigarette smoking behaviour and blood metabolomics. Int. J. Epidemiol. 2016, 45, 1421–1432. [Google Scholar] [CrossRef] [PubMed]
- Guasch-Ferre, M.; Bhupathiraju, S.N.; Hu, F.B. Use of Metabolomics in Improving Assessment of Dietary Intake. Clin. Chem. 2018, 64, 82–98. [Google Scholar] [CrossRef] [Green Version]
- Moore, S.C.; Matthews, C.E.; Sampson, J.N.; Stolzenberg-Solomon, R.Z.; Zheng, W.; Cai, Q.; Tan, Y.T.; Chow, W.H.; Ji, B.T.; Liu, D.K.; et al. Human metabolic correlates of body mass index. Metabolomics 2014, 10, 259–269. [Google Scholar] [CrossRef]
- Hivert, M.F.; Perng, W.; Watkins, S.M.; Newgard, C.S.; Kenny, L.C.; Kristal, B.S.; Patti, M.E.; Isganaitis, E.; DeMeo, D.L.; Oken, E.; et al. Metabolomics in the developmental origins of obesity and its cardiometabolic consequences. J. Dev. Orig. Health Dis. 2015, 6, 65–78. [Google Scholar] [CrossRef] [Green Version]
- Tzoulaki, I.; Ebbels, T.M.; Valdes, A.; Elliott, P.; Ioannidis, J.P. Design and analysis of metabolomics studies in epidemiologic research: A primer on -omic technologies. Am. J. Epidemiol. 2014, 180, 129–139. [Google Scholar] [CrossRef]
- van den Berg, R.A.; Hoefsloot, H.C.; Westerhuis, J.A.; Smilde, A.K.; van der Werf, M.J. Centering, scaling, and transformations: Improving the biological information content of metabolomics data. BMC Genom. 2006, 7, 142. [Google Scholar] [CrossRef] [PubMed]
- Misra, B.B.; Langefeld, C.D.; Olivier, M.; Cox, L.A. Integrated Omics: Tools, Advances, and Future Approaches. J. Mol. Endocrinol. 2018, 62, R21–R45. [Google Scholar] [CrossRef] [PubMed]
- Considine, E.C.; Thomas, G.; Boulesteix, A.L.; Khashan, A.S.; Kenny, L.C. Critical review of reporting of the data analysis step in metabolomics. Metabolomics 2017, 14, 7. [Google Scholar] [CrossRef] [PubMed]
- Yu, B.; Zanetti, K.A.; Temprosa, M.; Albanes, D.; Appel, N.; Barrios Barrera, C.; Ben-Shlomo, Y.; Boerwinkle, E.; Casas, J.P.; Clish, C.; et al. The Consortium of Metabolomics Studies (COMETS): Metabolomics in 47 Prospective Cohort Studies. Am. J. Epidemiol. 2019, 188, 991–1012. [Google Scholar] [CrossRef] [PubMed] [Green Version]
- Rosner, B. Percentage Points for a Generalized ESD Many-Outlier Procedure. Technometrics 1983, 25, 165–172. [Google Scholar] [CrossRef]
- Do, K.T.; Wahl, S.; Raffler, J.; Molnos, S.; Laimighofer, M.; Adamski, J.; Suhre, K.; Strauch, K.; Peters, A.; Gieger, C.; et al. Characterization of missing values in untargeted MS-based metabolomics data and evaluation of missing data handling strategies. Metabolomics 2018, 14, 128. [Google Scholar] [CrossRef] [PubMed]
- van Roekel, E.H.; Loftfield, E.; Kelly, R.S.; Zeleznik, O.A.; Zanetti, K.A. Metabolomics in epidemiologic research: Challenges and opportunities for early-career epidemiologists. Metabolomics 2019, 15, 9. [Google Scholar] [CrossRef]
- Cheng, S.; Rhee, E.P.; Larson, M.G.; Lewis, G.D.; McCabe, E.L.; Shen, D.; Palma, M.J.; Roberts, L.D.; Dejam, A.; Souza, A.L.; et al. Metabolite profiling identifies pathways associated with metabolic risk in humans. Circulation 2012, 125, 2222–2231. [Google Scholar] [CrossRef]
- Guertin, K.; Moore, S.C.; Sampson, J.N.; Huang, W.Y.; Xiao, Q.; Stolzenberg-Solomon, R.Z.; Sinha, R.; Cross, A.J. Metabolomics in nutritional epidemiology: Identifying metabolites associated with diet and quantifying their potential to uncover diet-disease relations in populations. Am. J. Clin. Nutr. 2014, 100, 208–217. [Google Scholar] [CrossRef]
- Mondul, A.M.; Sampson, J.N.; Moore, S.C.; Weinstein, S.J.; Evans, A.M.; Karoly, E.D.; Virtamo, J.; Albanes, D. Metabolomic profile of response to supplementation with β-carotene in the Alpha-Tocopherol, Beta-Carotene Cancer Prevention Study. Am. J. Clin. Nutr. 2013, 98, 488–493. [Google Scholar] [CrossRef]
- Newgard, C.B.; An, J.; Bain, J.R.; Muehlbauer, M.J.; Stevens, R.D.; Lien, L.F.; Haqq, A.M.; Shah, S.H.; Arlotto, M.; Slentz, C.A.; et al. A branched-chain amino acid-related metabolic signature that differentiates obese and lean humans and contributes to insulin resistance. Cell Metab. 2009, 9, 311–326. [Google Scholar] [CrossRef] [PubMed]
- Pallister, T.; Jennings, A.; Mohney, R.P.; Yarand, D.; Mangino, M.; Cassidy, A.; MacGregor, A.; Spector, T.D.; Menni, C. Characterizing Blood Metabolomics Profiles Associated with Self-Reported Food Intakes in Female Twins. PLoS ONE 2016, 11, e0158568. [Google Scholar] [CrossRef] [PubMed]
- Playdon, M.C.; Ziegler, R.G.; Sampson, J.N.; Stolzenberg-Solomon, R.; Thompson, H.J.; Irwin, M.L.; Mayne, S.T.; Hoover, R.N.; Moore, S.C. Nutritional metabolomics and breast cancer risk in a prospective study. Am. J. Clin. Nutr. 2017, 106, 637–649. [Google Scholar] [CrossRef]
- Scalbert, A.; Brennan, L.; Manach, C.; Andres-Lacueva, C.; Dragsted, L.O.; Draper, J.; Rappaport, S.M.; van der Hooft, J.J.J.; Wishart, D.S. The food metabolome: A window over dietary exposure. Am. J. Clin. Nutr. 2014, 99, 1286–1308. [Google Scholar] [CrossRef] [PubMed]
- Schmidt, J.A.; Rinaldi, S.; Ferrari, P.; Carayol, M.; Achaintre, D.; Scalbert, A.; Cross, A.J.; Gunter, M.J.; Fensom, G.K.; Appleby, P.N.; et al. Metabolic profiles of male meat eaters, fish eaters, vegetarians, and vegans from the EPIC-Oxford cohort. Am. J. Clin. Nutr. 2015, 102, 1518–1526. [Google Scholar] [CrossRef] [PubMed] [Green Version]
- Schmidt, J.A.; Rinaldi, S.; Scalbert, A.; Ferrari, P.; Achaintre, D.; Gunter, M.J.; Appleby, P.N.; Key, T.J.; Travis, R.C. Plasma concentrations and intakes of amino acids in male meat-eaters, fish-eaters, vegetarians and vegans: A cross-sectional analysis in the EPIC-Oxford cohort. Eur. J. Clin. Nutr. 2016, 70, 306–312. [Google Scholar] [CrossRef]
- Zheng, Y.; Yu, B.; Alexander, D.; Steffen, L.M.; Boerwinkle, E. Human metabolome associates with dietary intake habits among African Americans in the atherosclerosis risk in communities study. Am. J. Epidemiol. 2014, 179, 1424–1433. [Google Scholar] [CrossRef] [PubMed]
- Floegel, A.; Stefan, N.; Yu, Z.; Mühlenbruch, K.; Drogan, D.; Joost, H.-G.; Fritsche, A.; Häring, H.-U.; Hrabě de Angelis, M.; Peters, A.; et al. Identification of serum metabolites associated with risk of type 2 diabetes using a targeted metabolomic approach. Diabetes 2013, 62, 639–648. [Google Scholar] [CrossRef]
- Huang, J.; Weinstein, S.J.; Kitahara, C.M.; Karoly, E.D.; Sampson, J.N.; Albanes, D. A prospective study of serum metabolites and glioma risk. Oncotarget 2017, 8, 70366–70377. [Google Scholar] [CrossRef]
- Jiang, X.; Zeleznik, O.A.; Lindstrom, S.; Lasky-Su, J.; Hagan, K.; Clish, C.B.; Eliassen, A.H.; Kraft, P.; Kabrhel, C. Metabolites Associated With the Risk of Incident Venous Thromboembolism: A Metabolomic Analysis. J. Am. Heart Assoc. 2018, 7, e010317. [Google Scholar] [CrossRef] [Green Version]
- Kraus, W.E.; Muoio, D.M.; Stevens, R.; Craig, D.; Bain, J.R.; Grass, E.; Haynes, C.; Kwee, L.; Qin, X.; Slentz, D.H.; et al. Metabolomic Quantitative Trait Loci (mQTL) Mapping Implicates the Ubiquitin Proteasome System in Cardiovascular Disease Pathogenesis. PLoS Genet. 2015, 11, e1005553. [Google Scholar] [CrossRef] [PubMed]
- Kühn, T.; Floegel, A.; Sookthai, D.; Johnson, T.; Rolle-Kampczyk, U.; Otto, W.; von Bergen, M.; Boeing, H.; Kaaks, R. Higher plasma levels of lysophosphatidylcholine 18:0 are related to a lower risk of common cancers in a prospective metabolomics study. BMC Med. 2016, 14, 13. [Google Scholar] [CrossRef] [PubMed]
- Mayers, J.R.; Wu, C.; Clish, C.B.; Kraft, P.; Torrence, M.E.; Fiske, B.P.; Yuan, C.; Bao, Y.; Townsend, M.K.; Tworoger, S.S.; et al. Elevation of circulating branched-chain amino acids is an early event in human pancreatic adenocarcinoma development. Nat. Med. 2014, 20, 1193–1198. [Google Scholar] [CrossRef] [PubMed]
- Menni, C.; Fauman, E.; Erte, I.; Perry, J.R.B.; Kastenmüller, G.; Shin, S.-Y.; Petersen, A.-K.; Hyde, C.; Psatha, M.; Ward, K.J.; et al. Biomarkers for type 2 diabetes and impaired fasting glucose using a nontargeted metabolomics approach. Diabetes 2013, 62, 4270–4276. [Google Scholar] [CrossRef] [PubMed]
- Mondul, A.M.; Moore, S.C.; Weinstein, S.J.; Karoly, E.D.; Sampson, J.N.; Albanes, D. Metabolomic analysis of prostate cancer risk in a prospective cohort: The alpha-tocolpherol, beta-carotene cancer prevention (ATBC) study. Int. J. Cancer 2015, 137, 2124–2132. [Google Scholar] [CrossRef] [PubMed]
- Shah, S.H.; Bain, J.R.; Muehlbauer, M.J.; Stevens, R.D.; Crosslin, D.R.; Haynes, C.; Dungan, J.; Newby, L.K.; Hauser, E.R.; Ginsburg, G.S.; et al. Association of a Peripheral Blood Metabolic Profile With Coronary Artery Disease and Risk of Subsequent Cardiovascular Events. Circ. Cardiovasc. Genet. 2010, 3, 207–214. [Google Scholar] [CrossRef] [PubMed] [Green Version]
- Tang, W.H.W.; Wang, Z.; Levison, B.S.; Koeth, R.A.; Britt, E.B.; Fu, X.; Wu, Y.; Hazen, S.L. Intestinal microbial metabolism of phosphatidylcholine and cardiovascular risk. N. Engl. J. Med. 2013, 368, 1575–1584. [Google Scholar] [CrossRef]
- Wang, T.J.; Larson, M.G.; Vasan, R.S.; Cheng, S.; Rhee, E.P.; McCabe, E.; Lewis, G.D.; Fox, C.S.; Jacques, P.F.; Fernandez, C. Metabolite Profiles and the Risk of Developing Diabetes. Nat. Med. 2011, 17, 448–453. [Google Scholar] [CrossRef]
- Yu, D.; Moore, S.C.; Matthews, C.E.; Xiang, Y.-B.; Zhang, X.; Gao, Y.-T.; Zheng, W.; Shu, X.-O. Plasma metabolomic profiles in association with type 2 diabetes risk and prevalence in Chinese adults. Metabolomics 2016, 12, 3. [Google Scholar] [CrossRef]
- Zeleznik, O.; Clish, C.B.; Kraft, P.; Avila-Pancheco, J.; Eliassen, A.; Tworoger, S.S. Circulating Lysophosphatidylcholines, Phosphatidylcholines, Ceramides, and Sphingomyelins and Ovarian Cancer Risk: A 23-year Prospective Study. BioRxiv 2019. [Google Scholar] [CrossRef]
- Geijsen, A.; Brezina, S.; Keski-Rahkonen, P.; Baierl, A.; Bachleitner-Hofmann, T.; Bergmann, M.M.; Boehm, J.; Brenner, H.; Chang-Claude, J.; van Duijnhoven, F.J.B.; et al. Plasma metabolites associated with colorectal cancer: A discovery-replication strategy. Int. J. Cancer 2019, 10. [Google Scholar] [CrossRef] [PubMed]
- Moore, S.C.; Playdon, M.C.; Sampson, J.N.; Hoover, R.N.; Trabert, B.; Matthews, C.E.; Ziegler, R.G. A Metabolomics Analysis of Body Mass Index and Postmenopausal Breast Cancer Risk. J. Natl Cancer Inst. 2018, 110, 588–597. [Google Scholar] [CrossRef] [PubMed]
- Hada, M.; Edin, M.L.; Hartge, P.; Lih, F.B.; Wentzensen, N.; Zeldin, D.C.; Trabert, B. Prediagnostic Serum Levels of Fatty Acid Metabolites and Risk of Ovarian Cancer in the Prostate, Lung, Colorectal, and Ovarian (PLCO) Cancer Screening Trial. Cancer Epidemiol. Biomark. Prev. 2019, 28, 189–197. [Google Scholar] [CrossRef] [PubMed]
- Watrous, J.D.; Henglin, M.; Claggett, B.; Lehmann, K.A.; Larson, M.G.; Cheng, S.; Jain, M. Visualization, Quantification, and Alignment of Spectral Drift in Population Scale Untargeted Metabolomics Data. Anal. Chem. 2017, 89, 1399–1404. [Google Scholar] [CrossRef] [PubMed] [Green Version]
- Gromski, P.S.; Xu, Y.; Kotze, H.L.; Correa, E.; Ellis, D.I.; Armitage, E.G.; Turner, M.L.; Goodacre, R. Influence of missing values substitutes on multivariate analysis of metabolomics data. Metabolites 2014, 4, 433–452. [Google Scholar] [CrossRef] [PubMed]
- Evans, A.M.; Bridgewater, B.; Liu, Q.; Mitchell, M.W.; Robinson, R.J.; Dai, H.; Stewart, S.J.; DeHaven, C.D.; Miller, L. High resolution mass spectrometry improves data quality and quality as compared to unit mass resolution mass spectrometry in high-throughput profiling metabolomics. Metabolomics 2014, 2014, 132. [Google Scholar]
- Roberts, L.D.; Souza, A.L.; Gerszten, R.E.; Clish, C.B. Targeted metabolomics. Curr. Protoc. Mol. Biol. 2012, 98, 30.2.1–30.2.24. [Google Scholar] [CrossRef]
- Issaq, H.J.; Van, Q.N.; Waybright, T.J.; Muschik, G.M.; Veenstra, T.D. Analytical and statistical approaches to metabolomics research. J. Sep. Sci. 2009, 32, 2183–2199. [Google Scholar] [CrossRef]
- Li, B.; Tang, J.; Yang, Q.; Cui, X.; Li, S.; Chen, S.; Cao, Q.; Xue, W.; Chen, N.; Zhu, F. Performance Evaluation and Online Realization of Data-driven Normalization Methods Used in LC/MS based Untargeted Metabolomics Analysis. Sci. Rep. 2016, 6, 38881. [Google Scholar] [CrossRef] [Green Version]
- Ejigu, B.A.; Valkenborg, D.; Baggerman, G.; Vanaerschot, M.; Witters, E.; Dujardin, J.C.; Burzykowski, T.; Berg, M. Evaluation of normalization methods to pave the way towards large-scale LC-MS-based metabolomics profiling experiments. OMICS 2013, 17, 473–485. [Google Scholar] [CrossRef]
- Wulff, J.E.; Mitchell, M.W. A Comparison of Various Normalization Methods for LC/MS Metabolomics Data. Adv. Biosci. Biotechnol. 2018, 9, 339. [Google Scholar] [CrossRef]
- Reisetter, A.C.; Muehlbauer, M.J.; Bain, J.R.; Nodzenski, M.; Stevens, R.D.; Ilkayeva, O.; Metzger, B.E.; Newgard, C.B.; Lowe, W.L., Jr.; Scholtens, D.M. Mixture model normalization for non-targeted gas chromatography/mass spectrometry metabolomics data. BMC Bioinform. 2017, 18, 84. [Google Scholar] [CrossRef] [PubMed]
- Wen, B.; Mei, Z.; Zeng, C.; Liu, S. metaX: A flexible and comprehensive software for processing metabolomics data. BMC Bioinform. 2017, 18, 183. [Google Scholar] [CrossRef] [PubMed]
- Sampson, J.N.; Boca, S.M.; Shu, X.O.; Stolzenberg-Solomon, R.Z.; Matthews, C.E.; Hsing, A.W.; Tan, Y.T.; Ji, B.T.; Chow, W.H.; Cai, Q.; et al. Metabolomics in epidemiology: Sources of variability in metabolite measurements and implications. Cancer Epidemiol. Biomark. Prev. 2013, 22, 631–640. [Google Scholar] [CrossRef]
- Xiao, Q.; Moore, S.C.; Boca, S.M.; Matthews, C.E.; Rothman, N.; Stolzenberg-Solomon, R.Z.; Sinha, R.; Cross, A.J.; Sampson, J.N. Sources of variability in metabolite measurements from urinary samples. PLoS ONE 2014, 9, e95749. [Google Scholar] [CrossRef]
- Czysz, A.H.; South, C.; Gadad, B.S.; Arning, E.; Soyombo, A.; Bottiglieri, T.; Trivedi, M.H. Can targeted metabolomics predict depression recovery? Results from the CO-MED trial. Transl. Psychiatry 2019, 9, 11. [Google Scholar] [CrossRef]
- Do, K.T.; Kastenmuller, G.; Mook-Kanamori, D.O.; Yousri, N.A.; Theis, F.J.; Suhre, K.; Krumsiek, J. Network-based approach for analyzing intra- and interfluid metabolite associations in human blood, urine, and saliva. J. Proteome Res. 2015, 14, 1183–1194. [Google Scholar] [CrossRef]
- Iqbal, K.; Dietrich, S.; Wittenbecher, C.; Krumsiek, J.; Kuhn, T.; Lacruz, M.E.; Kluttig, A.; Prehn, C.; Adamski, J.; von Bergen, M.; et al. Comparison of metabolite networks from four German population-based studies. Int. J. Epidemiol. 2018, 47, 2070–2081. [Google Scholar] [CrossRef] [Green Version]
- Weber, R.J.M.; Lawson, T.N.; Salek, R.M.; Ebbels, T.M.D.; Glen, R.C.; Goodacre, R.; Griffin, J.L.; Haug, K.; Koulman, A.; Moreno, P.; et al. Computational tools and workflows in metabolomics: An international survey highlights the opportunity for harmonisation through Galaxy. Metabolomics 2017, 13, 12. [Google Scholar] [CrossRef]
- Paynter, N.P.; Balasubramanian, R.; Giulianini, F.; Wang, D.D.; Tinker, L.F.; Gopal, S.; Deik, A.A.; Bullock, K.; Pierce, K.A.; Scott, J.; et al. Metabolic Predictors of Incident Coronary Heart Disease in Women. Circulation 2018, 137, 841–853. [Google Scholar] [CrossRef]
- Barupal, D.K.; Fan, S.; Fiehn, O. Integrating bioinformatics approaches for a comprehensive interpretation of metabolomics datasets. Curr. Opin. Biotechnol. 2018, 54, 1–9. [Google Scholar] [CrossRef] [PubMed]
- Krumsiek, J.; Suhre, K.; Illig, T.; Adamski, J.; Theis, F.J. Gaussian graphical modeling reconstructs pathway reactions from high-throughput metabolomics data. BMC Syst. Biol. 2011, 5, 21. [Google Scholar] [CrossRef] [PubMed]
- Zhang, B.; Horvath, S. A general framework for weighted gene co-expression network analysis. Stat. Appl. Genet. Mol. Biol. 2005, 4. [Google Scholar] [CrossRef] [PubMed]
- Basu, S.; Duren, W.; Evans, C.R.; Burant, C.F.; Michailidis, G.; Karnovsky, A. Sparse network modeling and metscape-based visualization methods for the analysis of large-scale metabolomics data. Bioinformatics 2017, 33, 1545–1553. [Google Scholar] [CrossRef] [PubMed]
- McGeachie, M.J.; Chang, H.H.; Weiss, S.T. CGBayesNets: Conditional Gaussian Bayesian network learning and inference with mixed discrete and continuous data. PLoS Comput. Biol. 2014, 10, e1003676. [Google Scholar] [CrossRef] [PubMed]
- Breiman, L. Random forests. Mach. Learn. 2001, 45, 5–32. [Google Scholar] [CrossRef]
- Subramanian, A.; Tamayo, P.; Mootha, V.K.; Mukherjee, S.; Ebert, B.L.; Gillette, M.A.; Paulovich, A.; Pomeroy, S.L.; Golub, T.R.; Lander, E.S.; et al. Gene set enrichment analysis: A knowledge-based approach for interpreting genome-wide expression profiles. Proc. Natl. Acad. Sci. USA 2005, 102, 15545–15550. [Google Scholar] [CrossRef] [PubMed] [Green Version]
- Chong, J.; Soufan, O.; Li, C.; Caraus, I.; Li, S.; Bourque, G.; Wishart, D.S.; Xia, J. MetaboAnalyst 4.0: Towards more transparent and integrative metabolomics analysis. Nucleic Acids Res. 2018, 46, W486–W494. [Google Scholar] [CrossRef]
- Sud, M.; Fahy, E.; Cotter, D.; Azam, K.; Vadivelu, I.; Burant, C.; Edison, A.; Fiehn, O.; Higashi, R.; Nair, K.S.; et al. Metabolomics Workbench: An international repository for metabolomics data and metadata, metabolite standards, protocols, tutorials and training, and analysis tools. Nucleic Acids Res. 2016, 44, D463–D470. [Google Scholar] [CrossRef]
- Do, K.T.; Rasp, D.J.N.; Kastenmuller, G.; Suhre, K.; Krumsiek, J. MoDentify: Phenotype-driven module identification in metabolomics networks at different resolutions. Bioinformatics 2019, 35, 532–534. [Google Scholar] [CrossRef]
- Shin, S.Y.; Fauman, E.B.; Petersen, A.K.; Krumsiek, J.; Santos, R.; Huang, J.; Arnold, M.; Erte, I.; Forgetta, V.; Yang, T.P.; et al. An atlas of genetic influences on human blood metabolites. Nat. Genet. 2014, 46, 543–550. [Google Scholar] [CrossRef] [PubMed] [Green Version]
- Zhang, B.; Hu, S.; Baskin, E.; Patt, A.; Siddiqui, J.K.; Mathe, E.A. RaMP: A Comprehensive Relational Database of Metabolomics Pathways for Pathway Enrichment Analysis of Genes and Metabolites. Metabolites 2018, 8, 16. [Google Scholar] [CrossRef] [PubMed]
- Salek, R.M.; Neumann, S.; Schober, D.; Hummel, J.; Billiau, K.; Kopka, J.; Correa, E.; Reijmers, T.; Rosato, A.; Tenori, L.; et al. Coordination of Standards in MetabOlomicS (COSMOS): Facilitating integrated metabolomics data access. Metabolomics 2015, 11, 1587–1597. [Google Scholar] [CrossRef] [PubMed]
- Wanichthanarak, K.; Fan, S.; Grapov, D.; Barupal, D.K.; Fiehn, O. Metabox: A Toolbox for Metabolomic Data Analysis, Interpretation and Integrative Exploration. PLoS ONE 2017, 12, e0171046. [Google Scholar] [CrossRef] [PubMed]
- Pluskal, T.; Castillo, S.; Villar-Briones, A.; Oresic, M. MZmine 2: Modular framework for processing, visualizing, and analyzing mass spectrometry-based molecular profile data. BMC Bioinform. 2010, 11, 395. [Google Scholar] [CrossRef]
- Tautenhahn, R.; Patti, G.J.; Rinehart, D.; Siuzdak, G. XCMS Online: A web-based platform to process untargeted metabolomic data. Anal. Chem. 2012, 84, 5035–5039. [Google Scholar] [CrossRef] [PubMed]
- Giacomoni, F.; Le Corguille, G.; Monsoor, M.; Landi, M.; Pericard, P.; Petera, M.; Duperier, C.; Tremblay-Franco, M.; Martin, J.F.; Jacob, D.; et al. Workflow4Metabolomics: A collaborative research infrastructure for computational metabolomics. Bioinformatics 2015, 31, 1493–1495. [Google Scholar] [CrossRef]
- Afgan, E.; Baker, D.; van den Beek, M.; Blankenberg, D.; Bouvier, D.; Cech, M.; Chilton, J.; Clements, D.; Coraor, N.; Eberhard, C.; et al. The Galaxy platform for accessible, reproducible and collaborative biomedical analyses: 2016 update. Nucleic Acids Res. 2016, 44, W3–W10. [Google Scholar] [CrossRef] [Green Version]
- Peters, K.; Bradbury, J.; Bergmann, S.; Capuccini, M.; Cascante, M.; de Atauri, P.; Ebbels, T.M.D.; Foguet, C.; Glen, R.; Gonzalez-Beltran, A.; et al. PhenoMeNal: Processing and analysis of metabolomics data in the cloud. Gigascience 2019, 8, giy149. [Google Scholar] [CrossRef]
- Haug, K.; Salek, R.M.; Conesa, P.; Hastings, J.; de Matos, P.; Rijnbeek, M.; Mahendraker, T.; Williams, M.; Neumann, S.; Rocca-Serra, P.; et al. MetaboLights—An open-access general-purpose repository for metabolomics studies and associated meta-data. Nucleic Acids Res. 2013, 41, D781–D786. [Google Scholar] [CrossRef]
- Dudoit, S.; Popper Shaffer, J.; Boldrick, J.C. Multiple Hypothesis Testing in Microarray Experiments. Stat. Sci. 2003, 18, 71–103. [Google Scholar] [CrossRef]
- Xia, J.; Broadhurst, D.I.; Wilson, M.; Wishart, D.S. Translational biomarker discovery in clinical metabolomics: An introductory tutorial. Metabolomics 2013, 9, 280–299. [Google Scholar] [CrossRef] [PubMed]
- Wang, Y.; Gapstur, S.M.; Carter, B.D.; Hartman, T.J.; Stevens, V.L.; Gaudet, M.M.; McCullough, M.L. Untargeted Metabolomics Identifies Novel Potential Biomarkers of Habitual Food Intake in a Cross-Sectional Study of Postmenopausal Women. J. Nutr. 2018, 148, 932–943. [Google Scholar] [CrossRef] [PubMed]
- Wishart, D.S.; Feunang, Y.D.; Marcu, A.; Guo, A.C.; Liang, K.; Vazquez-Fresno, R.; Sajed, T.; Johnson, D.; Li, C.; Karu, N.; et al. HMDB 4.0: The human metabolome database for 2018. Nucleic Acids Res. 2018, 46, D608–D617. [Google Scholar] [CrossRef] [PubMed]
- Dashti, H.; Wedell, J.R.; Westler, W.M.; Markley, J.L.; Eghbalnia, H.R. Automated evaluation of consistency within the PubChem Compound database. Sci. Data 2019, 6, 190023. [Google Scholar] [CrossRef] [PubMed]
- Ferreira, J.D.; Inacio, B.; Salek, R.M.; Couto, F.M. Assessing Public Metabolomics Metadata, Towards Improving Quality. J. Integr. Bioinform. 2017, 14. [Google Scholar] [CrossRef]
- Marchand, C.R.; Farshidfar, F.; Rattner, J.; Bathe, O.F. A Framework for Development of Useful Metabolomic Biomarkers and Their Effective Knowledge Translation. Metabolites 2018, 8, 59. [Google Scholar] [CrossRef]
- Townsend, M.K.; Clish, C.B.; Kraft, P.; Wu, C.; Souza, A.L.; Deik, A.A.; Tworoger, S.S.; Wolpin, B.M. Reproducibility of metabolomic profiles among men and women in 2 large cohort studies. Clin. Chem. 2013, 59, 1657–1667. [Google Scholar] [CrossRef]
- Refaeilzadeh, P.; Tang, L.; Liu, H. Cross-Validation; Ling, L.M., ÖZSU, T., Eds.; Springer: Boston, MA, USA, 2009; Volume 1. [Google Scholar]
- Westerhuis, J.A.; Hoefsloot, H.C.J.; Smit, S.; Vis, D.J.; Smilde, A.K.; van Velzen, E.J.J.; van Duijnhoven, J.P.M.; van Dorsten, F.A. Assessment of PLSDA cross validation. Metabolomics 2008, 4, 81–89. [Google Scholar] [CrossRef] [Green Version]
- Metabolomics Society. Freely Available Software Tools. Available online: http://wiki.metabolomicssociety.org/index.php/Freely_available_software_tools (accessed on 25 March 2019).
- Spicer, R.; Salek, R.M.; Moreno, P.; Canueto, D.; Steinbeck, C. Navigating freely-available software tools for metabolomics analysis. Metabolomics 2017, 13, 106. [Google Scholar] [CrossRef]
- Goodacre, R.; Broadhurst, D.; Smilde, A.K.; Kristal, B.S.; Baker, J.D.; Beger, R.; Bessant, C.; Connor, S.; Capuani, G.; Craig, A.; et al. Proposed minimum reporting standards for data analysis in metabolomics. Metabolomics 2007, 3, 231–241. [Google Scholar] [CrossRef]
- Strengthening the Reporting Of Observational Studies in Epidemiology. Available online: https://www.strobe-statement.org/index.php?id=strobe-publications (accessed on 25 April 2019).
- CONSORT Transparent Reporting of Trials. Available online: http://www.consort-statement.org/ (accessed on 25 April 2019).
- Oxford, U.O. Enhancing the QUAlity and Transparency of health Research. Available online: http://www.equator-network.org/reporting-guidelines/strobe-strega/ (accessed on 25 April 2019).
- Lindon, J.C.; Nicholson, J.K.; Holmes, E.; Keun, H.C.; Craig, A.; Pearce, J.T.; Bruce, S.J.; Hardy, N.; Sansone, S.A.; Antti, H.; et al. Summary recommendations for standardization and reporting of metabolic analyses. Nat. Biotechnol. 2005, 23, 833–838. [Google Scholar] [CrossRef] [PubMed]
- Temprosa, E.; Mathe, E. CBIIT/R-cometsAnalytics: Comets Analytics for Consortium Based Metabolomic Analyses. Available online: https://rdrr.io/github/CBIIT/R-cometsAnalytics/ (accessed on 24 March 2019).
- Lowndes, J.S.S.; Best, B.D.; Scarborough, C.; Afflerbach, J.C.; Frazier, M.R.; O’Hara, C.C.; Jiang, N.; Halpern, B.S. Our path to better science in less time using open data science tools. Nat. Ecol. Evol. 2017, 1, 160. [Google Scholar] [CrossRef] [PubMed] [Green Version]


| Resource | Name | Description | Website |
|---|---|---|---|
| Consortia and Societies | Consortium of METabolomics Studies (COMETS) | Consortium of prospective studies with blood metabolomics data. | https://epi.grants.cancer.gov/comets/ [14] |
| Metabolomics Society | Summary of metabolomics databases. | http://metabolomicssociety.org/ | |
| COordination of Standards in MetabOlomicsS (COSMOS) | Standards for data dissemination. | http://cosmos-fp7.eu/ [73] | |
| Statistical Analysis Tools; Meta-Data and Other Resources | Metabolomics Workbench | Metabolomics resource sponsored by the Common Fund of the National Institutes of Health. | http://www.metabolomicsworkbench.org/ [69] |
| MetaboAnalyst | Program for statistical, functional and integrative analysis of metabolomics data. | https://www.metaboanalyst.ca/MetaboAnalyst/faces/home.xhtml [68] | |
| Metabox | A toolbox for metabolomic data analysis, interpretation, and integrative exploration. | http://kwanjeeraw.github.io/metabox/ [74] | |
| MZmine | A modular framework for processing, visualizing, and analyzing mass spectrometry-based molecular profile data. | http://mzmine.github.io/ [75] | |
| XCMSOnline | Metabolomics data processing and analysis platform. | https://xcmsonline.scripps.edu/landing_page.php?pgcontent=mainPage [76] | |
| Workflow4Metabolomics | Collaborative research infrastructure for computational metabolomics. | https://workflow4metabolomics.org/ [77,78] | |
| PhenoMeNal | Cloud-based platform for metabolomics processing and analysis. | http://phenomenal-h2020.eu/home/ [79] | |
| Metabolomics Tools Wiki | Classified and searchable list of metabolomics software and tools. | https://raspicer.github.io/MetabolomicsTools/ | |
| MetaboLights | Database for metabolomics experiments and derived information. | https://www.ebi.ac.uk/metabolights/ [80] | |
| MetabolomeXchange | An international data aggregation and notification service for metabolomics. | http://www.metabolomexchange.org/site/ |
© 2019 by the authors. Licensee MDPI, Basel, Switzerland. This article is an open access article distributed under the terms and conditions of the Creative Commons Attribution (CC BY) license (http://creativecommons.org/licenses/by/4.0/).
Share and Cite
Playdon, M.C.; Joshi, A.D.; Tabung, F.K.; Cheng, S.; Henglin, M.; Kim, A.; Lin, T.; van Roekel, E.H.; Huang, J.; Krumsiek, J.; et al. Metabolomics Analytics Workflow for Epidemiological Research: Perspectives from the Consortium of Metabolomics Studies (COMETS). Metabolites 2019, 9, 145. https://0-doi-org.brum.beds.ac.uk/10.3390/metabo9070145
Playdon MC, Joshi AD, Tabung FK, Cheng S, Henglin M, Kim A, Lin T, van Roekel EH, Huang J, Krumsiek J, et al. Metabolomics Analytics Workflow for Epidemiological Research: Perspectives from the Consortium of Metabolomics Studies (COMETS). Metabolites. 2019; 9(7):145. https://0-doi-org.brum.beds.ac.uk/10.3390/metabo9070145
Chicago/Turabian StylePlaydon, Mary C., Amit D. Joshi, Fred K. Tabung, Susan Cheng, Mir Henglin, Andy Kim, Tengda Lin, Eline H. van Roekel, Jiaqi Huang, Jan Krumsiek, and et al. 2019. "Metabolomics Analytics Workflow for Epidemiological Research: Perspectives from the Consortium of Metabolomics Studies (COMETS)" Metabolites 9, no. 7: 145. https://0-doi-org.brum.beds.ac.uk/10.3390/metabo9070145