Article

The Transcription Factor Sfp1 Regulates the Oxidative Stress Response in Candida albicans

1
Institute of Molecular and Cellular Biology, National Tsing Hua University, Hsinchu 30013, Taiwan
2
Department of Life Science, National Tsing Hua University, Hsinchu 30013, Taiwan
*
Author to whom correspondence should be addressed.
Submission received: 31 March 2019 / Revised: 7 May 2019 / Accepted: 9 May 2019 / Published: 14 May 2019
(This article belongs to the Special Issue Molecular Mechanisms of Fungal Virulence and Commensalism)

Abstract

:
Candida albicans is a commensal that inhabits the skin and mucous membranes of humans. Because of the increasing immunocompromised population and the limited classes of antifungal drugs available, C. albicans has emerged as an important opportunistic pathogen with high mortality rates. During infection and therapy, C. albicans frequently encounters immune cells and antifungal drugs, many of which exert their antimicrobial activity by inducing the production of reactive oxygen species (ROS). Therefore, antioxidative capacity is important for the survival and pathogenesis of C. albicans. In this study, we characterized the roles of the zinc finger transcription factor Sfp1 in the oxidative stress response against C. albicans. A sfp1-deleted mutant was more resistant to oxidants and macrophage killing than wild-type C. albicans and processed an active oxidative stress response with the phosphorylation of the mitogen-activated protein kinase (MAPK) Hog1 and high CAP1 expression. Moreover, the sfp1-deleted mutant exhibited high expression levels of antioxidant genes in response to oxidative stress, resulting in a higher total antioxidant capacity, glutathione content, and glutathione peroxidase and superoxide dismutase enzyme activity than the wild-type C. albicans. Finally, the sfp1-deleted mutant was resistant to macrophage killing and ROS-generating antifungal drugs. Together, our findings provide a new understanding of the complex regulatory machinery in the C. albicans oxidative stress response.

1. Introduction

Candida albicans (C. albicans) is a member of the human microbiota that normally inhabits the skin and mucosal surfaces of healthy individuals [1]. However, C. albicans is also an opportunistic pathogen that causes a wide range of infections including life-threatening hematogenously disseminated candidiasis, particularly in immunocompromised patients [1]. In addition to infections, C. albicans drug resistance has also emerged as a serious problem in clinical settings [2].
During the infection process and clinical therapy, the ability of C. albicans to adapt and respond to oxidative stress is critical for cell survival and virulence [3,4]. For example, C. albicans copes with reactive oxygen species (ROS) generation during the respiratory burst in phagocytic cells such as macrophages and neutrophils [3,5]. In addition, antifungal agents including amphotericin B, miconazole, and caspofungin induce ROS formation against C. albicans [6,7,8]. Previous studies showed that miconazole-mediated fungicidal activity against C. albicans was significantly inhibited by the addition of antioxidant [7], and superoxide dismutase inhibitors enhanced the activity of miconazole against C. albicans biofilm cells [9,10].
To protect cells from oxidative stress, C. albicans has evolved various signaling components, transcriptional regulatory factors, and antioxidant enzyme systems [11]. Antioxidant systems are exemplified by the superoxide dismutases (Sods), catalase, and glutathione peroxidase. Sods convert superoxide to the less toxic hydrogen peroxide, which is further detoxified to water and oxygen by catalase and the glutathione system [12,13]. In cell signaling, hydrogen peroxide activates the mitogen-activated protein kinase (MAPK) Hog1 by phosphorylation, and phosphorylated Hog1 promotes cell adaptation to oxidative stress [14]. However, transcription factor(s) and target genes downstream of the Hog1 pathway that respond to oxidative stress remain unknown. Moreover, independent of the Hog1-mediated pathway, the transcription factor Cap1 plays a key role in the regulation of oxidative stress response genes. Importantly, components of antioxidative systems are also associated with C. albicans pathogenesis and drug resistance. Mutant strains defective in the genes encoding Hog1, Cap1, Sods, catalase, and glutathione-related enzymes are hypersensitive to phagocyte killing and reduce C. albicans virulence in animal models of infection [15,16,17,18,19,20]. Finally, a recent study indicated that overproduction of catalase protects C. albicans against ROS-generating antifungals [21], indicating that the antioxidative capacity of C. albicans is also involved in drug resistance.
In C. albicans, Sfp1 is a transcription factor that negatively regulates the expression of adhesion- and biofilm-related genes and functions downstream of the Rhb1-target of rapamycin (TOR) signaling pathway [22]. In this study, we explored other functions of Sfp1 using DNA microarray analysis and molecular genetic approaches. We found that Sfp1 is also involved in the oxidative stress response in C. albicans. The deletion of C. albicans SFP1 (sfp1Δ/sfp1Δ) increased the expression of antioxidant genes and antioxidant enzyme activity compared to those in wild-type strains. Moreover, the sfp1Δ/sfp1Δ mutant promoted a higher level of CAP1 gene expression and Hog1 phosphorylation. Finally, the sfp1Δ/sfp1Δ mutant exhibited resistance to macrophage killing and antifungals with reduced ROS accumulation.

2. Materials and Methods

2.1. Strains and Growth Conditions

The C. albicans strains used in this study are listed in Table S1. Cells were routinely grown in YPD medium (2% glucose, 1% yeast extract, and 2% peptone) and synthetic complete (SC) medium (0.67% yeast nitrogen base [YNB] with ammonium sulfate, 2.0% glucose, and 0.079% complete supplement mixture). Plates were prepared with 1.5% agar. For each experiment, one colony was inoculated into YPD medium and grown at 30 °C overnight. This culture was harvested by centrifugation and washed with sterile double-distilled water (ddH2O). Cells were then subcultured in SC medium with an initial optical density at 600 nm (OD600) of ~0.5 and further grown at 30 °C to the exponential phase. The reagents used in this study were purchased from Sigma-Aldrich (St. Louis, MO, USA), unless indicated otherwise. For DNA microarray analysis, cells were inoculated into YPD medium at 30 °C overnight, subcultured in SC medium, and grown to the exponential phase (OD600 = 1). Two independent experiments were performed for each sample.

2.2. DNA Microarray Analysis

DNA microarray analysis was performed as previously described [23] with some modifications. Briefly, probes for 6202 genes were designed based on the C_albicans_SC5314_version_A21-s02-m09-r08_orf_coding FASTA file (Agilent Technologies, Santa Clara, CA, USA). To normalize the raw signal values, quantile normalization was used to identify differentially expressed genes. Changes in gene expression with a fold change ≥1.5 and P-value <0.05 in the sfp1Δ/sfp1Δ mutant compared to the wild type strain were considered significantly different. Microarray data were deposited in the Gene Expression Omnibus (http://0-www-ncbi-nlm-nih-gov.brum.beds.ac.uk/geo) under accession number GSE127184.

2.3. Reverse Transcription (RT) Real-Time Quantitative PCR (qPCR)

Total RNA extraction, cDNA synthesis by reverse transcription and real-time qPCR were performed as previously described [23]. The primers used in this study are listed in Table S2. The PMA1 transcript was used as an internal control for the RNA input [24]. The relative fold change in the expression of each gene was calculated using the 2−∆∆CT method [25].

2.4. Extraction and Quantification of Total Protein

Cells were grown in SC medium with or without hydrogen peroxide (H2O2) or menadione for 2 h, washed with phosphate buffered saline (PBS), and mixed with ice-cold protein extraction buffer as indicated for each assay described below. The cell suspensions were further mixed with 0.3 g acid-washed glass beads, disrupted by vortexing for 30 s, and immediately placed on ice for 30 s. This process was repeated eight times. Soluble proteins were collected by centrifugation (13,000× g) at 4 °C and quantified using a Bio-Rad protein assay (Bio-Rad, Hercules, CA, USA) based on the Bradford method.

2.5. Determination of Total Antioxidant Capacity

Total antioxidant capacity was measured using the Antioxidant Assay Kit (Cayman Chemical, Ann Arbor, MI, USA) according to the manufacturer’s instructions. This assay relies on the ability of cellular antioxidants to inhibit the oxidation of ABTS (2,2′-azino-di-[3-ethylbenzthiazoline sulfonate]). Protein extraction was performed as described above using an extraction buffer containing 5 mM potassium phosphate (pH 7.4), 0.9% sodium chloride, and 0.1% glucose. Briefly, 10 μL of proteins was mixed with 150 μL ABTS, followed by the addition of 40 μL H2O2 and 10 μL metmyoglobin to initiate the reaction. After incubation at room temperature for 5 min, the absorbance at 750 nm was measured spectrophotometrically. The total antioxidant capacity to prevent ABTS oxidation was compared with that of Trolox, a water-soluble tocopherol analogue. The total antioxidant capacity was expressed as molar Trolox equivalents.

2.6. Cell Susceptibility to Oxidants and Measurement of Intracellular ROS

Cell susceptibility to oxidants was examined by spot assay and propidium iodide (PI) staining as previously described [26]. In the spot assay, one colony was inoculated into YPD medium and grown at 30 °C overnight. Cells were collected by centrifugation, washed, and resuspended in sterile ddH2O. Cells were 10-fold serially diluted (3 × 10⁷ to 3 × 10³ cells/mL) and 5 μL of each sample was spotted onto SC or YPD agar plates containing H2O2 or menadione. The plates were incubated at 30 °C for 4–5 days and photographed every day. For PI staining, cells were treated with H2O2 or menadione for 2 h, harvested by centrifugation, washed with PBS, and resuspended in a PI staining solution (4 μg/mL PI in PBS). PI-positive cells were measured using an Accuri C6 flow cytometer (BD Biosciences, San Jose, CA, USA).
Intracellular ROS were detected using cell permeable 2′,7′-dichlorodihydrofluorescein diacetate (H2DCFDA) as previously described [27]. Briefly, cells were treated with or without H2O2 and menadione for 2 h. The cells were subsequently harvested, washed with PBS, resuspended in PBS containing 20 μg/mL H2DCFDA, and incubated at 30 °C for 30 min. The fluorescence intensity was measured using an Accuri C6 flow cytometer (BD Biosciences).

2.7. Examination of Cell Morphology by Scanning Electron Microscopy (SEM)

To examine cell morphology, 6 × 10⁷ cells were grown on polystyrene coverslips (Thermanox plastic coverslip 174950, Thermo Scientific) that were placed in each well of a 24-well microplate containing 1 mL SC medium with or without 30 mM H2O2. After incubation at 30 °C for 2 h, the coverslip was washed with PBS and fixed with 3.7% formaldehyde for 40 min. The coverslip was subsequently washed with PBS and treated with 1% osmium tetroxide for 15 min. After fixation, the samples were dehydrated using serial ethanol solutions as previously described [22] and dried overnight in a 60 °C oven. Finally, the samples were examined and micrographs were collected using SEM S-4700, Type II (Hitachi, Minato-ku, Japan).

2.8. Measurement of Sod and Catalase Enzyme Activity

The Sod activity was measured using a Superoxide Dismutase (SOD) Activity Colorimetric Assay Kit (BioVision, Milpitas, CA) according to the manufacturer’s instructions. Protein extraction was performed as described above in an extraction buffer containing 0.1 M Tris/HCl (pH 7.4), 0.5% Triton X-100, 5 mM β-mercaptoethanol, and 0.1 mg/mL phenylmethylsulfonyl fluoride. Proteins (2 µg in 250 µL solution) were mixed with 200 µL WST Solution and 20 µL SOD Enzyme Solution (BioVision) and incubated at 37 °C for 20 min. The absorbance at 450 nm was measured spectrophotometrically. The relative enzyme activity of Sod was calculated by the activity in the sfp1Δ/sfp1Δ mutant divided by that in the wild-type strain.
Catalase enzyme activity was determined using a spectrophotometric method as previously described [28]. Briefly, 10 µg of protein was mixed with potassium phosphate buffer (75 mM, pH 7.0) and 10 mM H2O2 to a volume of 1 mL. The rate of H2O2 disappearance was detected by measuring the absorbance at 240 nm every 30 sec for a total of 2 min. One unit of catalase activity was defined as the amount of catalase required to degrade 1 µmole H2O2 per min.

2.9. Measurement of Total Glutathione, Oxidized-Glutathione (GSSG), and Reduced-Glutathione (GSH) Content

Total glutathione and GSH content was quantified using the 5,5′-dithiobis-2- nitrobenzoic acid (DTNB)-based enzymatic recycling method [29]. To measure the total glutathione content, a protein extraction buffer (0.1 M potassium phosphate [pH 7.5], 5 mM ethylenediaminetetraacetic acid [EDTA], 0.5% metaphosphoric acid, 0.6% sulfosalicylic acid, and 0.1% Triton-X 100) was used. Twenty micrograms of protein was incubated with 60 µL DTNB, 60 µL glutathione reductase and 60 µL NADPH for 2 min, and the absorbance at 412 nm was measured.
To measure the GSSG content, cells (in 100 µL protein extraction buffer) were mixed with 2 µL 2-vinylpyridine (2-VP). After the cells were disrupted, their supernatants were collected by centrifugation and incubated at room temperature for 1 h, allowing 2-VP to conjugate with GSH. Then, 6 µL triethanolamine was added to neutralize 2-VP, and the mixture was adjusted to pH 6~7. Finally, 20 µg of 2-VP treated proteins were incubated with 60 µL DTNB, 60 µL glutathione reductase, and 60 µL NADPH for 2 min, and the absorbance at 412 nm was measured. The GSH content was determined using the following formula: [GSH] = [total glutathione] − 2 × [GSSG]

2.10. Measurement of Glutathione Peroxidase Enzyme Activity

The glutathione peroxidase activity was determined using the glutathione reductase enzyme-coupling method as previously described [30] with some modifications. Proteins were extracted in an extraction buffer containing 50 mM potassium phosphate buffer (pH 7.2) with 5 mM EDTA. Briefly, 50 µL of protein was mixed with 10 µL NADPH (40 mM), 10 µL glutathione reductase (10 U/mL), and 10 µL glutathione (5 mM). Then, the mixture was added to 20 µL cumene hydroperoxide (0.25 mM) to initiate the reaction. The rate of NADPH oxidation was monitored by measuring the absorbance at 340 nm at a 1-min interval for 5 min. One unit of glutathione peroxidase activity was defined as the amount of enzyme that produced 1 µmol of GSSG/min.

2.11. Western Blotting

Western blotting was conducted as previously described [31]. The anti-phospho-p38 (Thr180/Tyr182) monoclonal antibody #9211 (Cell Signaling Technology, Danvers, MA, USA) and the rabbit polyclonal anti-β-actin antibody (GeneTex, Irvine, CA, USA) were used to detect Hog1 phosphorylation and Act1, respectively. The horseradish peroxidase (HRP)-conjugated goat anti-rabbit IgG (GeneTex) was used as the secondary antibody. The blots were visualized using a Western Lightning Plus-ECL Enhanced Chemiluminescence Substrate kit (PerkinElmer) and an ImageQuant LAS 4000 Biomolecular Imager (GE Healthcare Life Science, Marlborough, PA, USA).

2.12. Macrophage Killing and Phagocytosis Assay

The RAW264.7 mouse macrophage cell line was incubated with Dulbecco’s modified Eagle medium (DMEM) plus 10% fetal bovine serum (FBS) at 37 °C with 5% CO2. In the macrophage killing assay, C. albicans cells were cocultured with 106 RAW264.7 cells for 16 h at a multiplicity of infection (MOI) of 1:10. One milliliter of sterile ddH2O was added to promote macrophage lysis, C. albicans cells were collected by scraping from the bottom of each well and then spotted onto YPD agar plates, and colony-forming units (CFUs) were counted after incubation at 30 °C for 24 h.
In the phagocytosis assay, C. albicans cells were stained with 0.68 mg/mL fluorescein isothiocyanate (FITC) for 40 min and then cocultured with 2 × 10⁶ cells of macrophages for 20 min at an MOI of 1. Then, 5 µg/mL calcofluor white was added to stain the nonphagocytosed C. albicans cells. The rate of phagocytosis was assessed using a fluorescence microscope (AIX0, Zeiss). Data were obtained from three independent experiments by analyzing at least 300 macrophages per well.

2.13. Statistical Analysis

Student’s t-test was used to assess the statistical significance of differences in the wild-type strain versus the sfp1Δ/sfp1Δ mutant. Statistical significance was indicated with a P-value <0.05.

3. Results

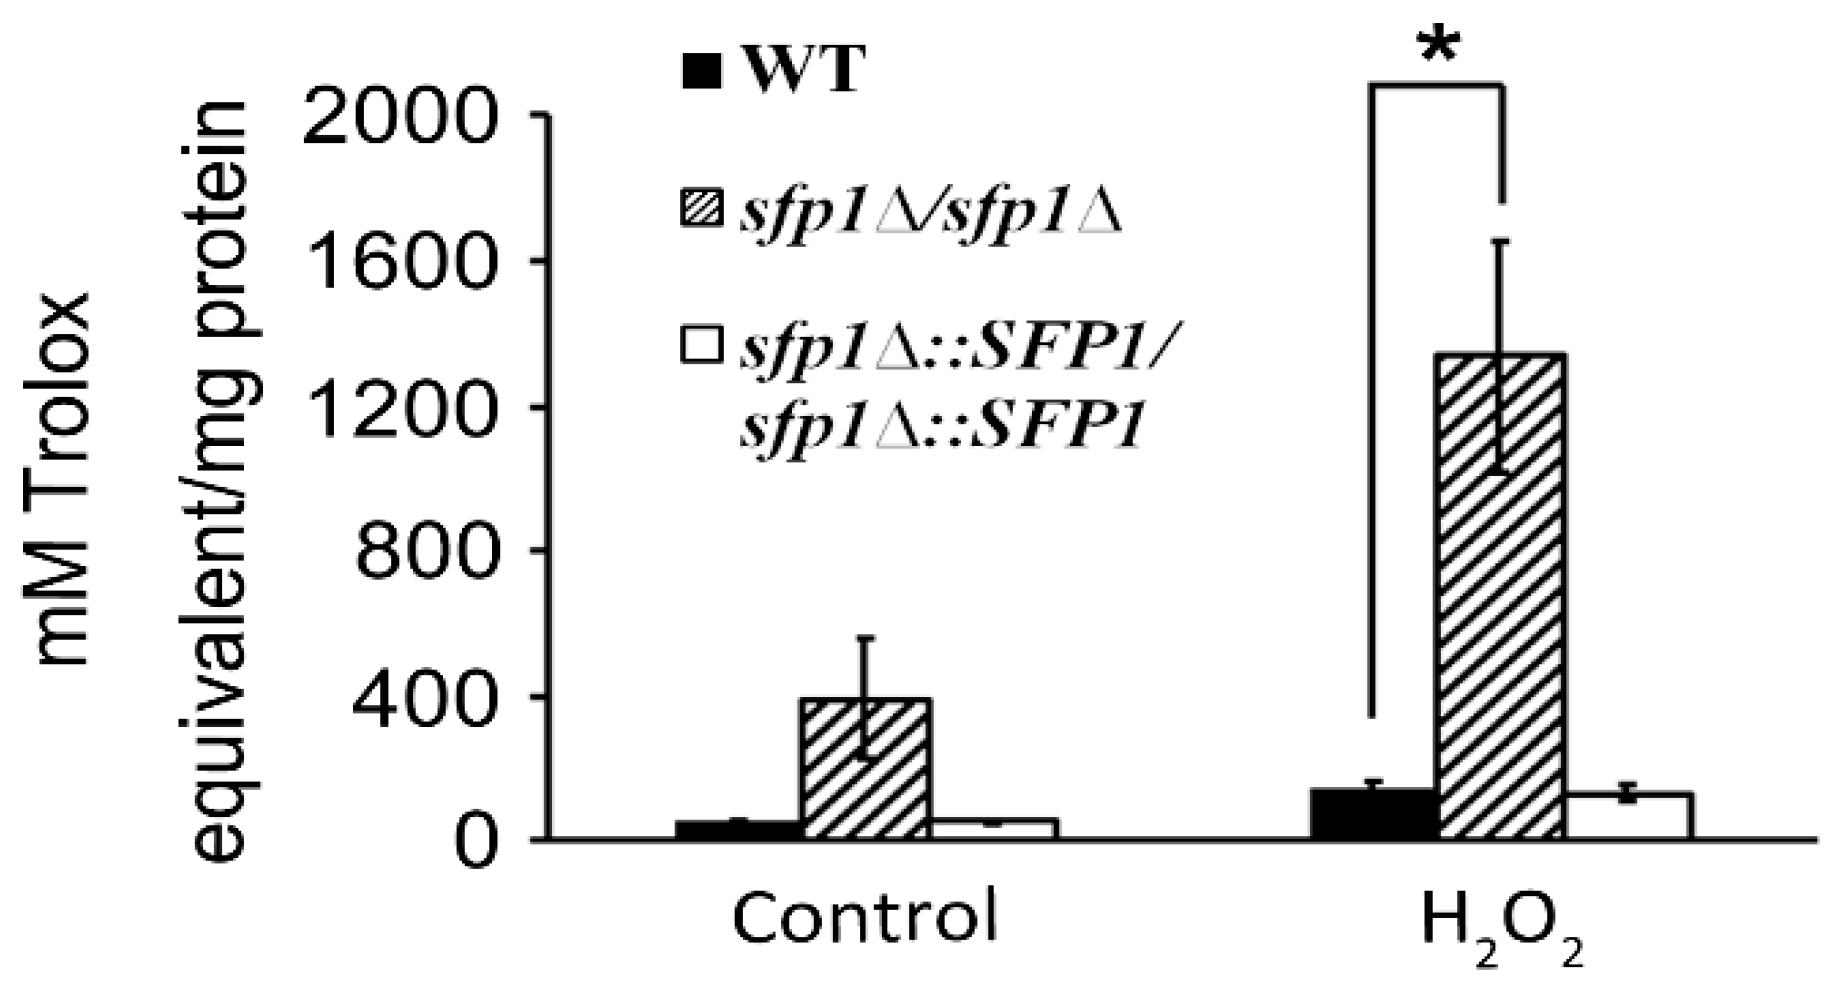
3.1. Sfp1 is Involved in the C. albicans Response to Oxidative Stress

In our previous study, C. albicans Sfp1 was involved in cell adhesion and biofilm formation [22]. To reveal other functions of Sfp1, we used whole-genome DNA microarray to compare gene expression patterns between the sfp1-deleted (sfp1Δ/sfp1Δ) and wild-type strains. Among the 6,202 C. albicans genes that were evaluated, 2,365 genes exhibited a significant change in expression (P < 0.05) that was ≥1.5-fold. Based on C. albicans genome annotation (http://www.candidagenome.org), these genes are involved in a wide variety of biological processes (Figure S1). Interestingly, a subset of genes involved in the oxidative stress response was upregulated in the sfp1Δ/sfp1Δ mutant compared to their expression in the wild-type strain (Table 1), including GCS1 and GPX2, which encode gamma-glutamylcysteine synthetase and glutathione peroxidase, respectively. Moreover, the sfp1Δ/sfp1Δ mutant also showed higher expression levels of genes encoding the components of oxidative stress signaling and regulation, including SSK1 and CAP1. Ssk1 is a response regulator of two-component system and functions upstream of the Hog1 mitogen-activated protein kinase (MAPK) to adapt cells to oxidative stress [32]. Cap1 is a transcription regulator that controls antioxidant gene expression [33,34].
To further investigate the functions of Sfp1 in the oxidative stress response, we determined the total antioxidative capacity of C. albicans. In Figure 1, the sfp1Δ/sfp1Δ mutant showed an increase in antioxidative capacity compared to that in the wild-type and SFP1-reintegrated strains. Moreover, the total antioxidative capacity was largely enhanced in the sfp1Δ/sfp1Δ mutant with hydrogen peroxide (H2O2)-induced oxidative stress. Therefore, the combined results of the DNA microarray and total antioxidant capacity assay suggested that C. albicans Sfp1 negatively regulates the oxidative stress response.

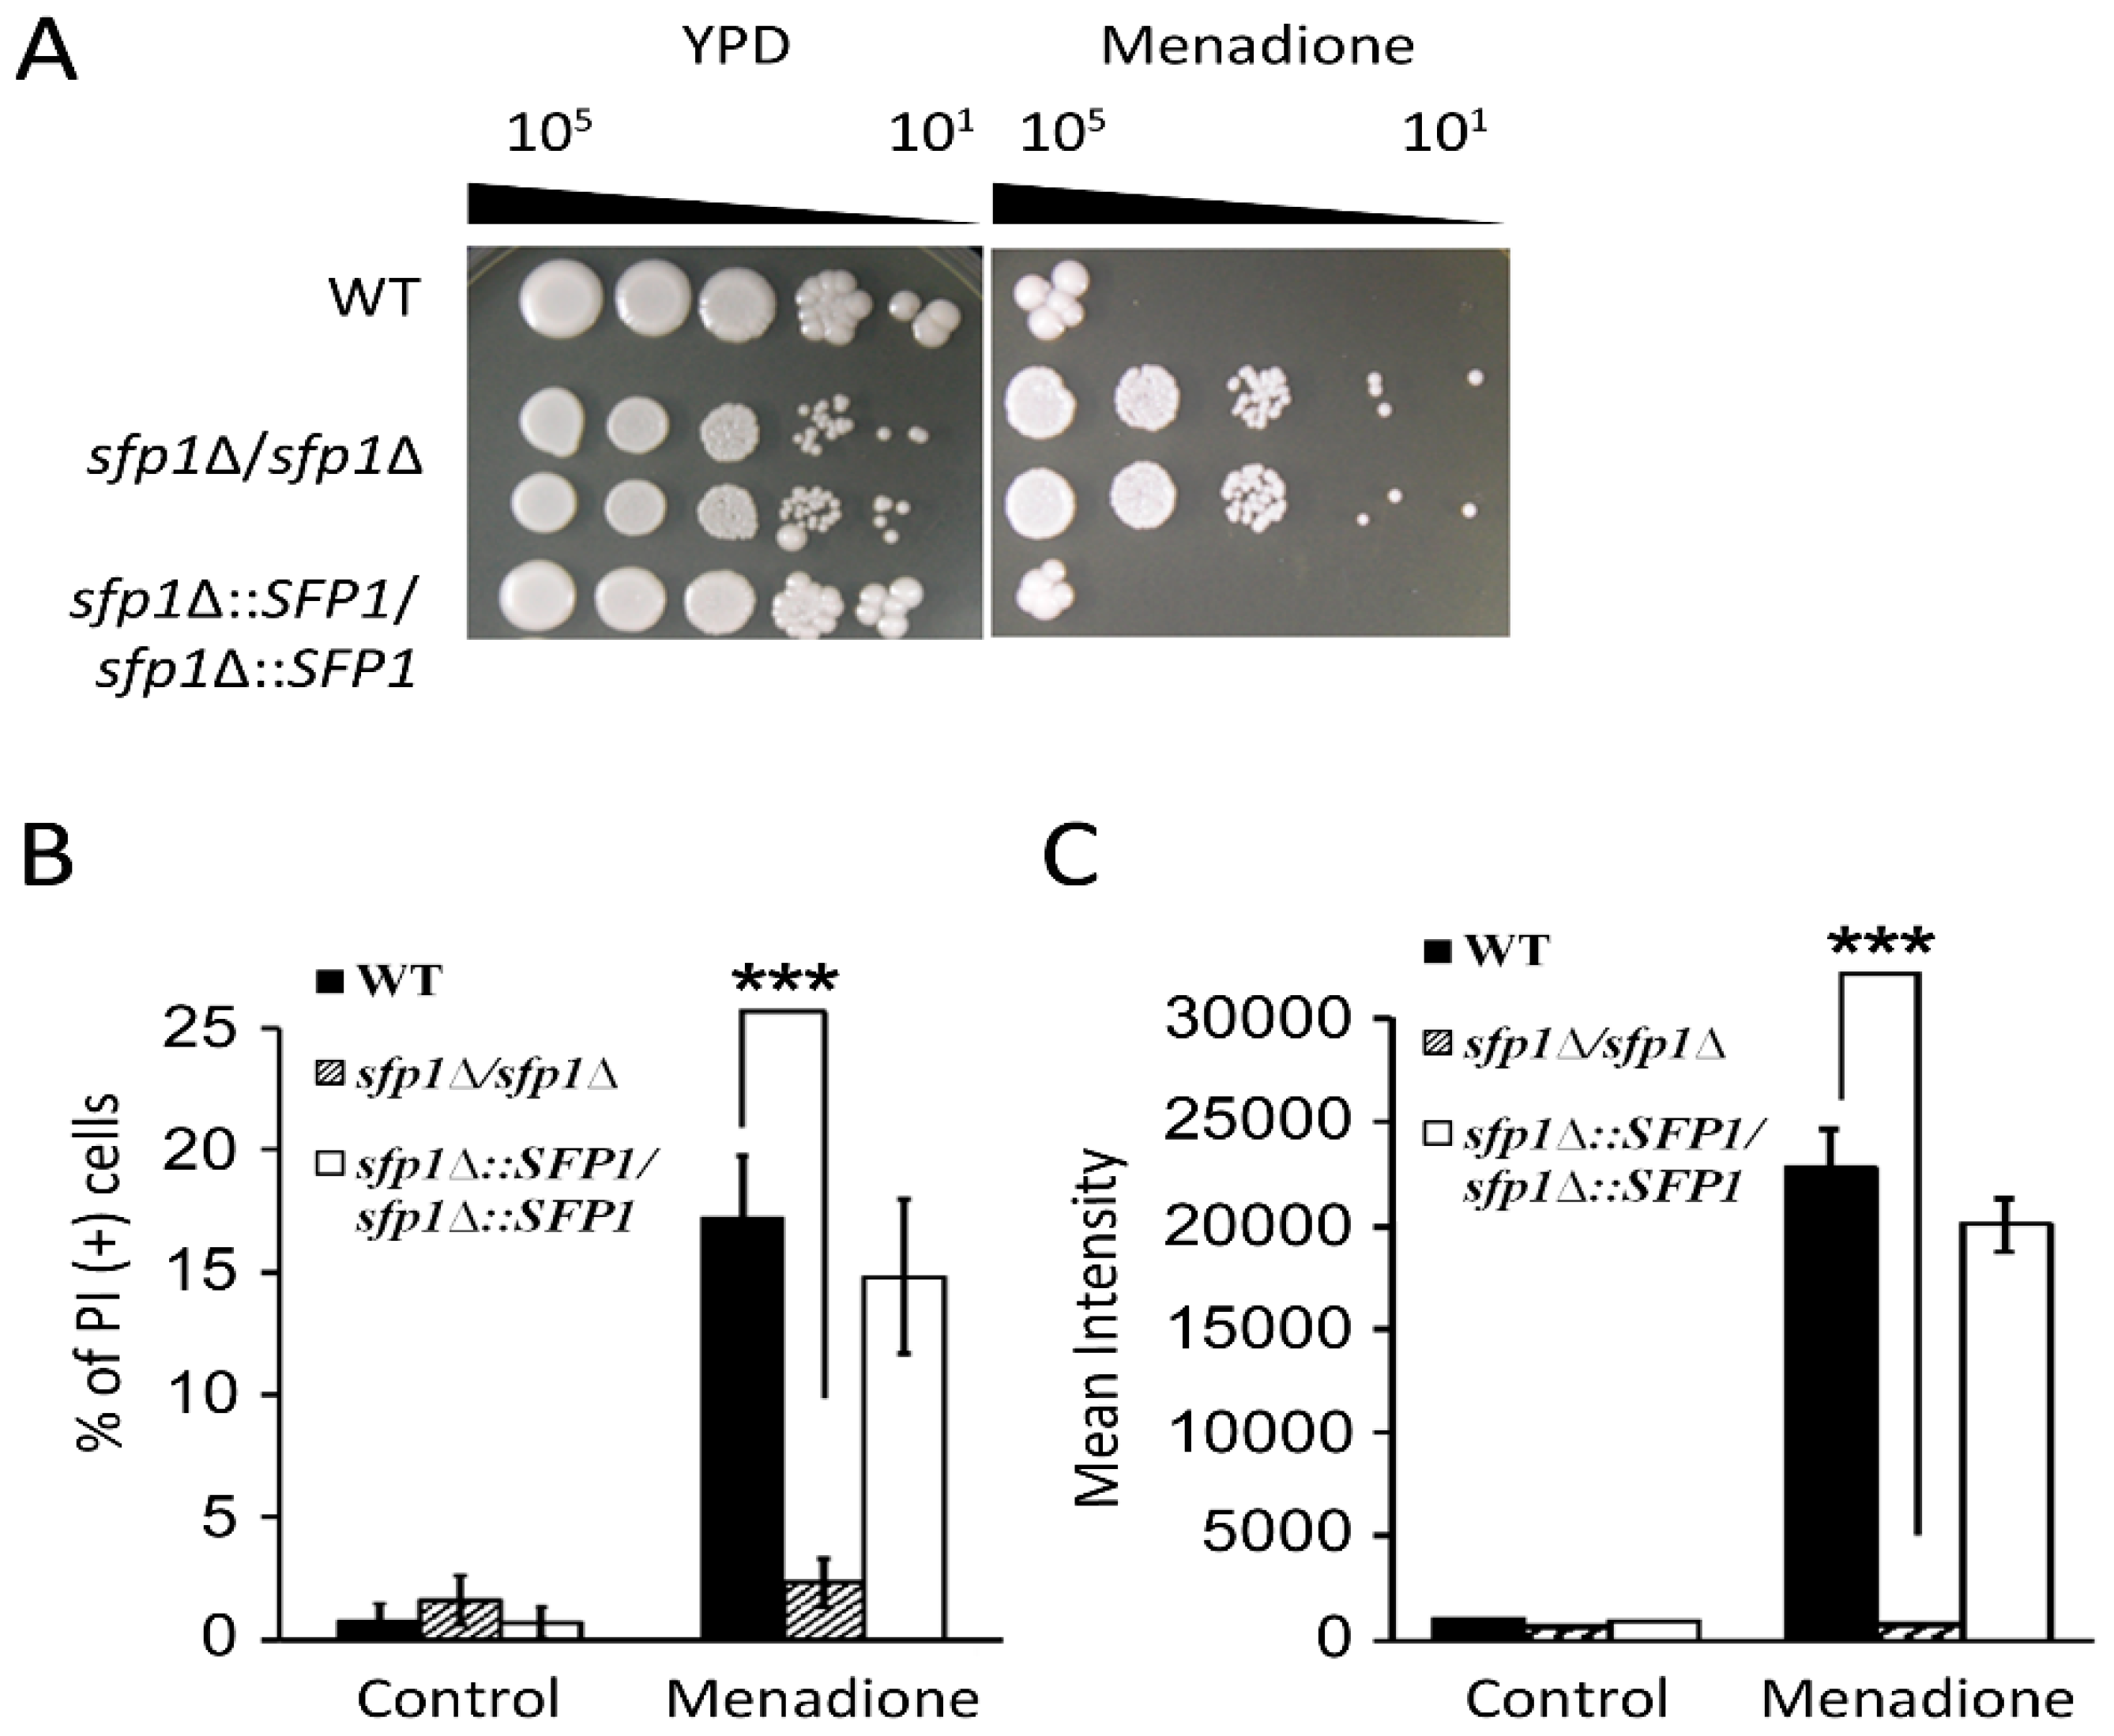
3.2. Sfp1 is Related to Cellular Susceptibility to Menadione/Superoxide

Superoxide is a primary ROS generated by phagocytes and several antifungals. To further understand the functions of Sfp1 in the oxidative stress response, we also determined the cellular response to the superoxide generator menadione. In a cell susceptibility assay, the sfp1Δ/sfp1Δ mutant was more resistant to menadione than the wild-type and SFP1-reintegrated strains (Figure 2A). Moreover, cell viability upon menadione treatment was also assessed through PI staining using flow cytometry. As shown in Figure 2B, the number of PI-positive cells was much lower in the sfp1Δ/sfp1Δ mutant than in the wild-type and SFP1-reintegrated strains.
To further understand the correlation between Sfp1 and the cellular response to menadione-induced oxidative stress, intracellular ROS accumulation was detected. The cells were treated with sublethal doses of menadione and stained with the ROS indicator H2DCFDA. Intracellular ROS accumulation was then measured using flow cytometry. As shown in Figure 2C, the mean fluorescence intensity of the sfp1Δ/sfp1Δ mutant was approximately 30-fold lower than those of the wild-type and SFP1-reintegrated cells. Together, these results indicate that the sfp1Δ/sfp1Δ mutant is more resistant to menadione-induced oxidative stress and possesses a significantly lower intracellular ROS content upon the induction of superoxide than the other two tested strains.

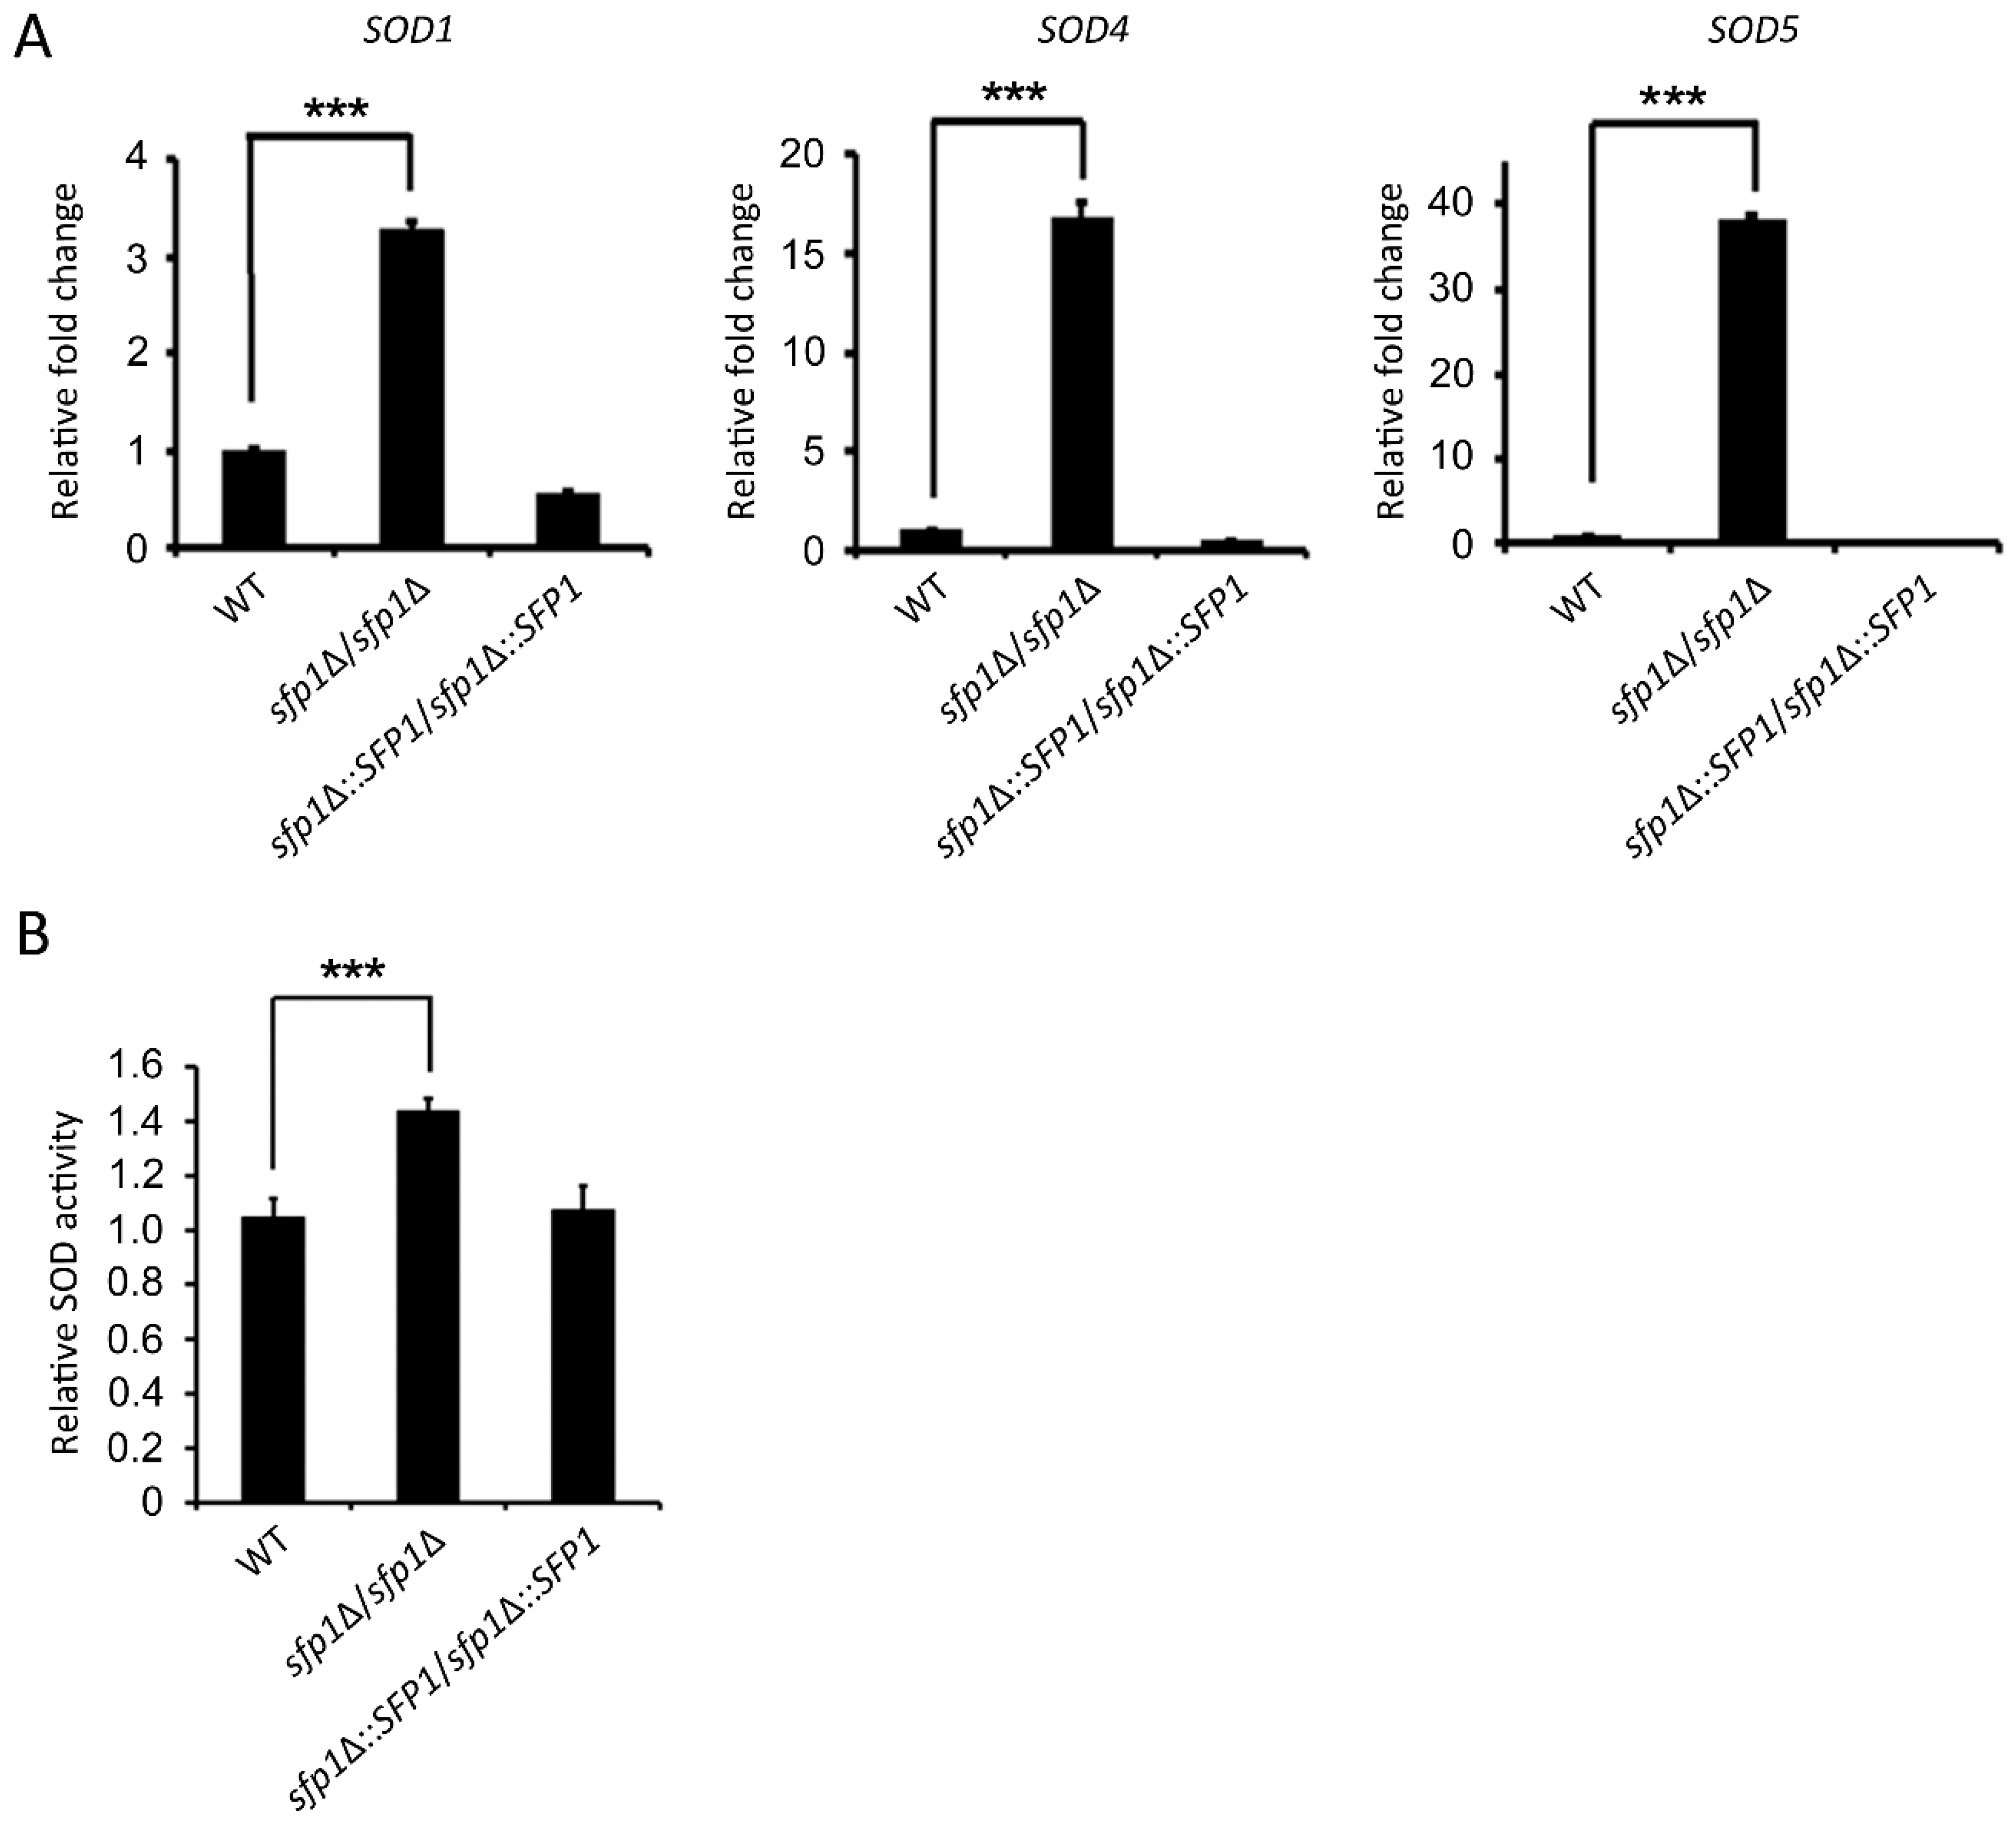
3.3. Sfp1 Affects SOD Gene Expression and Enzyme Activity

In C. albicans, superoxide is mainly detoxified by superoxide dismutases (Sods) that convert superoxide into the less toxic hydrogen peroxide [4,35]. Moreover, previous studies showed that Sods are involved in the C. albicans response to menadione, an ROS-generating antifungal, and macrophage killing [7,18,19]. Because the sfp1Δ/sfp1Δ mutant is resistant to menadione-induced oxidative stress (Figure 2A–C), we hypothesized that Sfp1 may regulate SOD expression. To test this hypothesis, SOD gene expression levels and enzyme activity were compared among different C. albicans strains. Based on the results of real-time qPCR analysis, the expression of the SOD1, SOD4, and SOD5 genes, but not SOD2 and SOD3, was significantly upregulated in the sfp1Δ/sfp1Δ mutant with menadione treatment compared to that in the other two strains (Figure 3A and Figure S2). Finally, Sod enzyme activity was also measured. As shown in Figure 3B, the sfp1Δ/sfp1Δ mutant exhibited 40% higher Sod enzyme activity than the wild-type and SFP1-reintegrated strains. These results further indicated that Sfp1 negatively regulates the cellular response to menadione/superoxide, possibly through its control of SOD gene expression and enzyme activity.

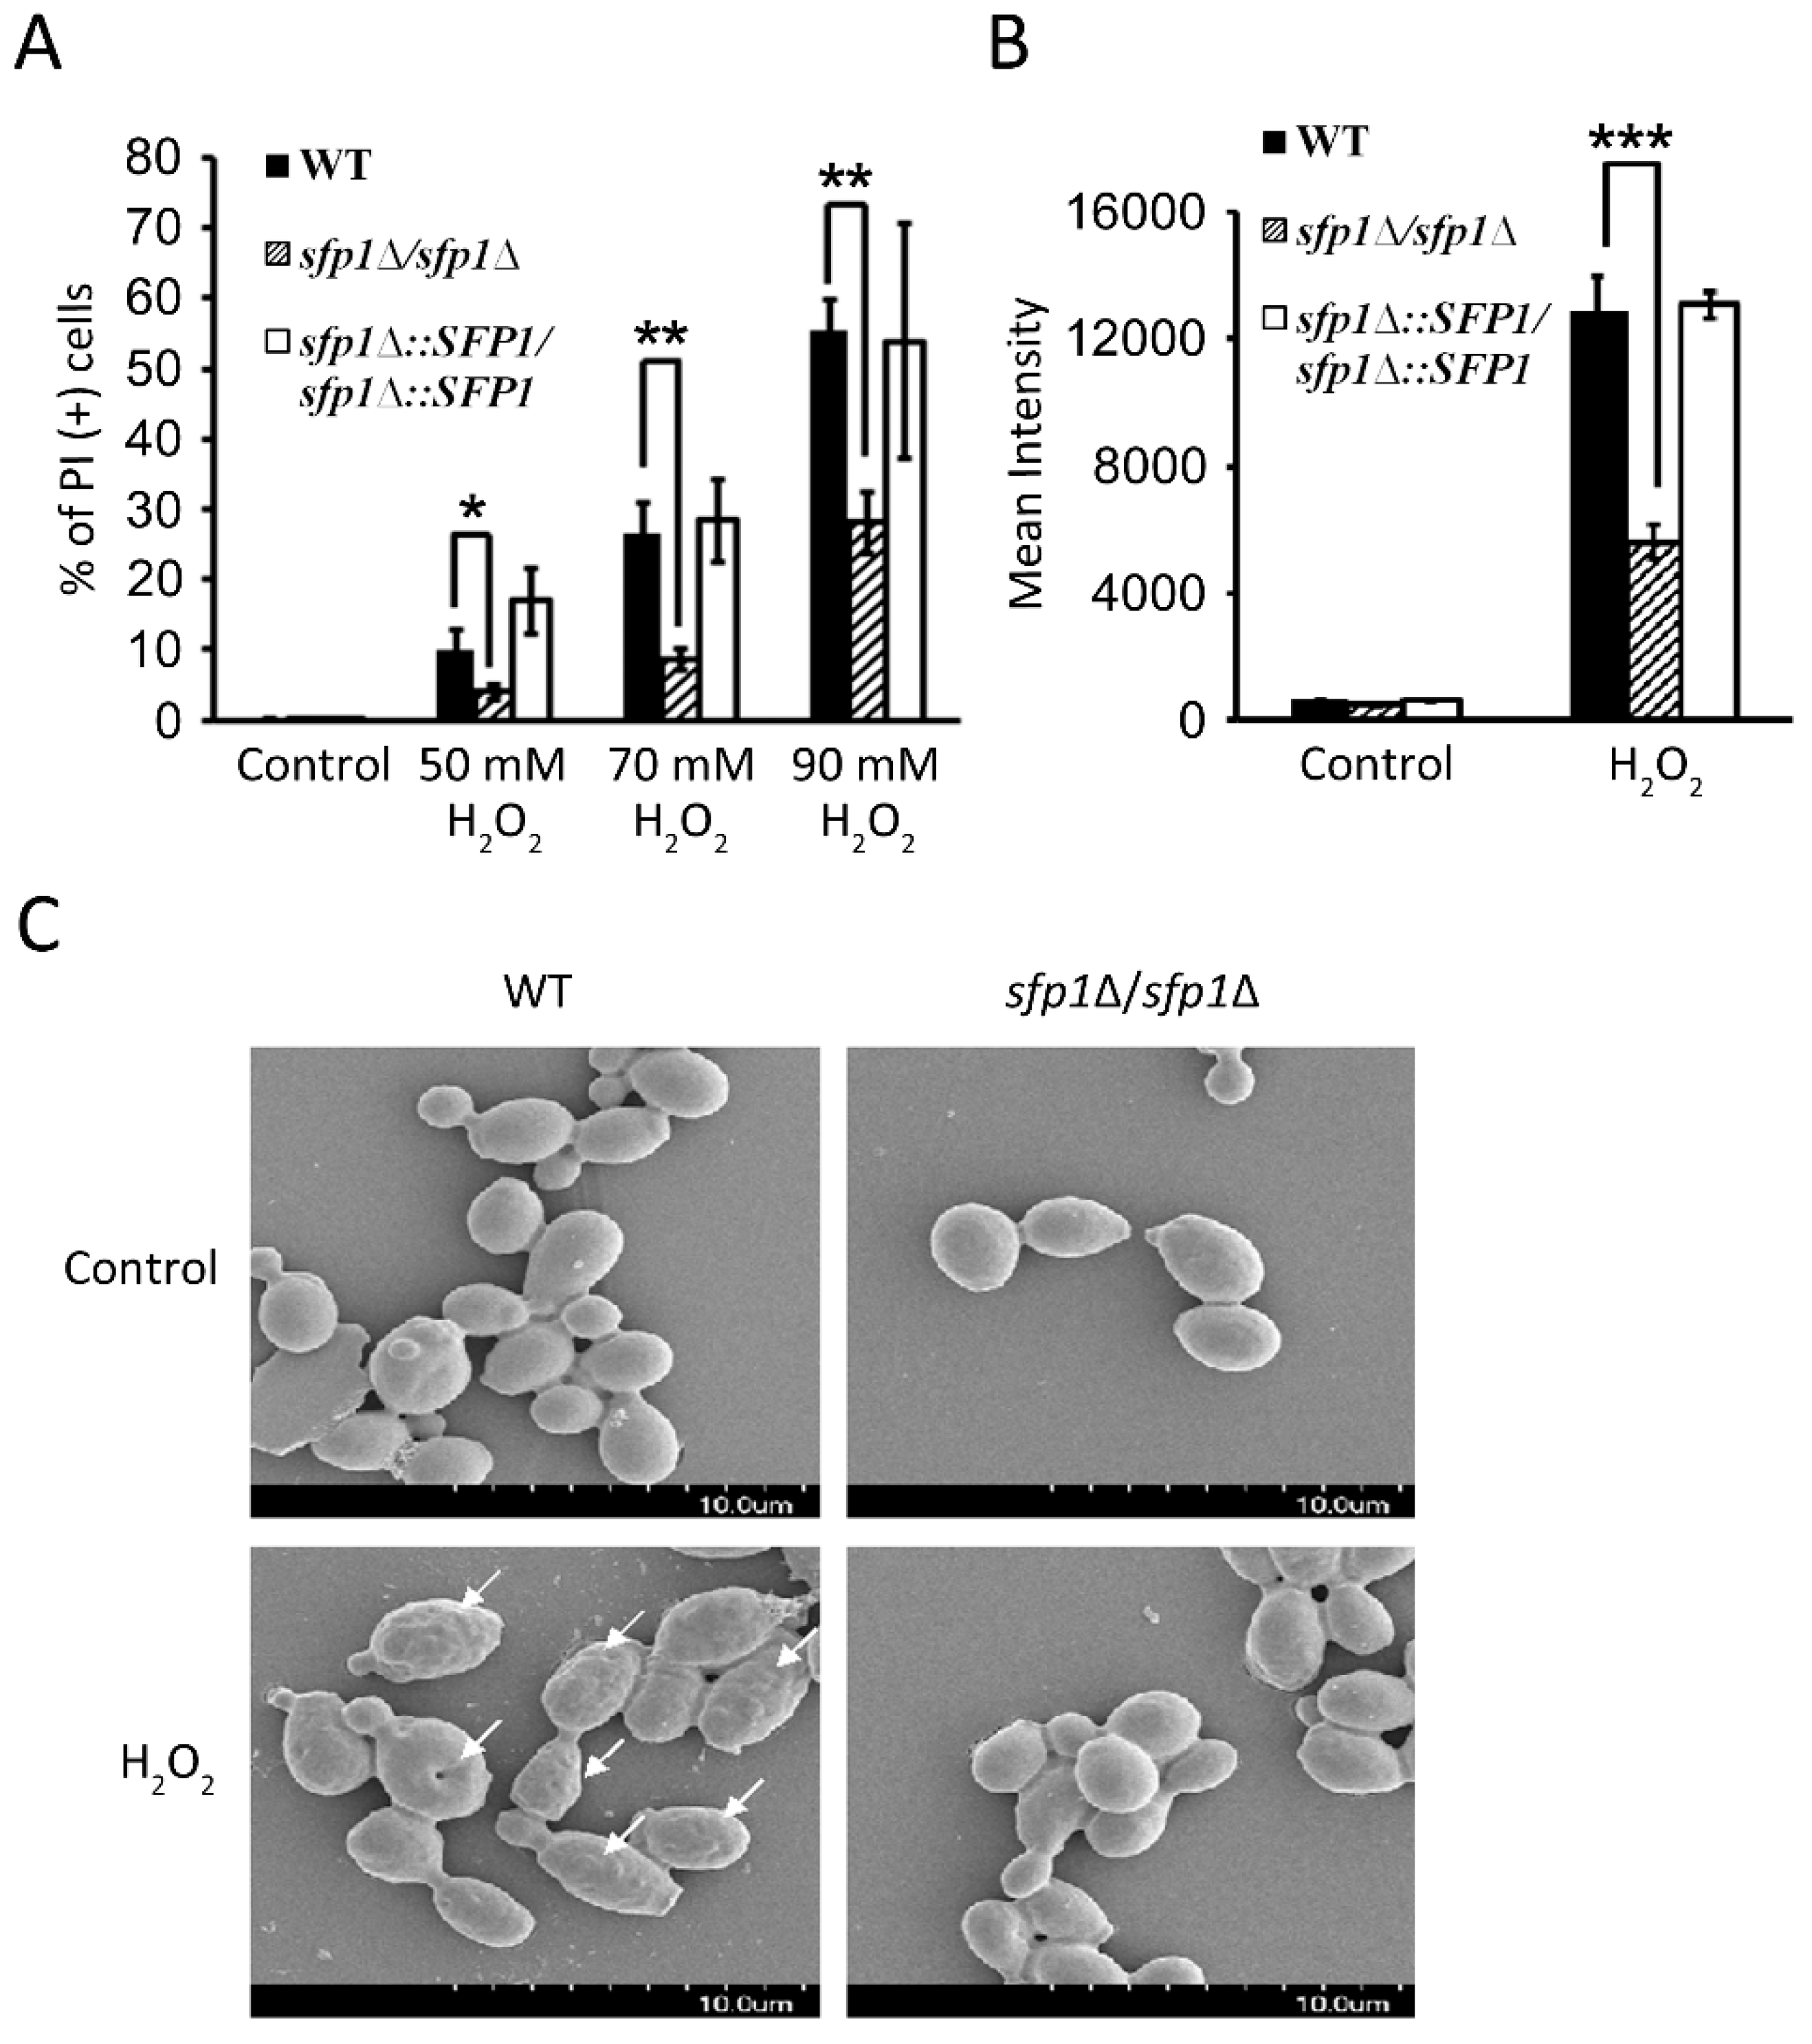
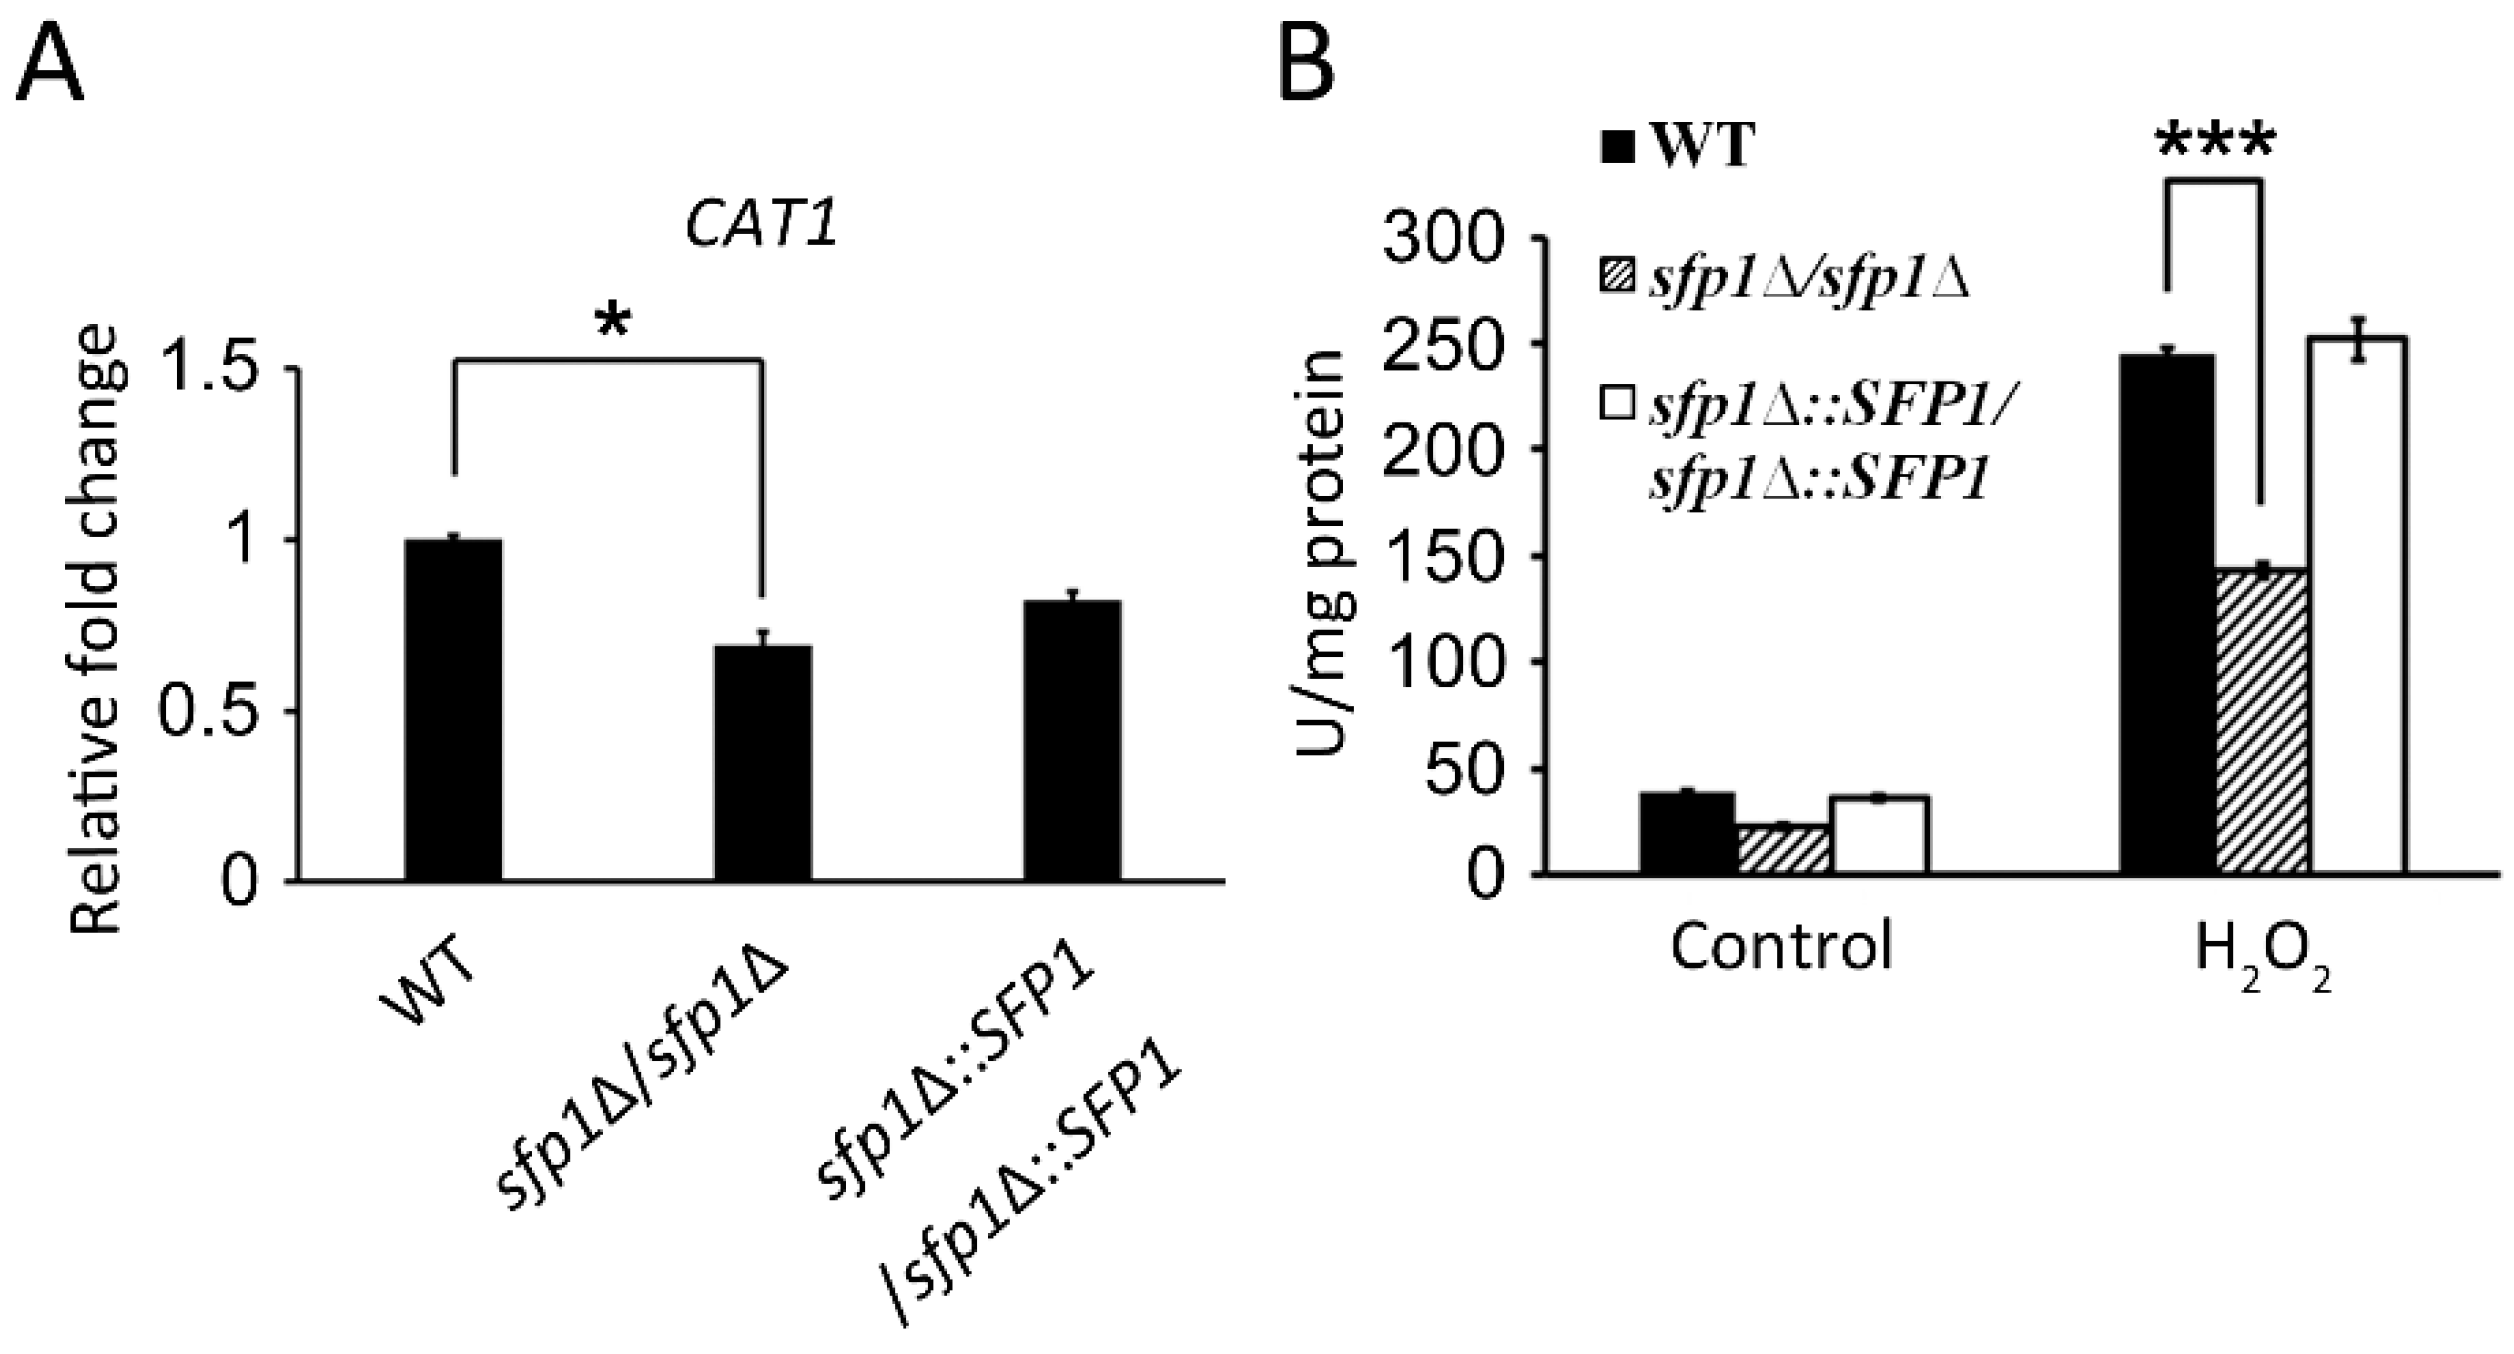
3.4. Sfp1 Is Also Related to Cellular Susceptibility to Hydrogen Peroxide

By the activity of Sods, superoxide is converted into H2O2. However, H2O2 is still toxic and highly reactive and requires further detoxification. Therefore, to explore the correlation between Sfp1 and H2O2 detoxification, cellular susceptibility to H2O2 was determined through PI staining and flow cytometry. The sfp1Δ/sfp1Δ mutant exhibited a much lower percentage of PI-positive cells after treatment with different concentrations of H2O2 than the wild-type and SFP1-reintegrated strains (Figure 4A). For example, 55% of the wild-type cells were PI-positive following 90 mM H2O2 treatment, whereas only 28% of the sfp1Δ/sfp1Δ mutant were stained by PI (Figure 4A).
Moreover, the intracellular ROS content was measured in cells treated with a sublethal dose of H2O2. The sfp1Δ/sfp1Δ mutant showed significantly lower fluorescence intensity in flow cytometric analysis following H2DCFDA staining than the wild-type and SFP1-reintegrated strains (Figure 4B). Previous reports indicated that intracellular ROS accumulation is correlated with changes in the C. albicans cell surface, leading to a rough appearance with many protrusions and disc-like depressions [36,37]. Similar morphologies were observed when the wild-type strain was treated with H2O2 (Figure 4C). In contrast, the cell surfaces of the sfp1Δ/sfp1Δ mutant (±H2O2) and the wild-type (without H2O2 treatment) remained relatively smooth (Figure 4C). These results are consistent with the low level of intracellular ROS accumulation in the sfp1Δ/sfp1Δ strain following H2O2 treatment (Figure 4B) and suggest that the sfp1Δ/sfp1Δ mutant is better able to detoxify H2O2 than the wild-type strain.

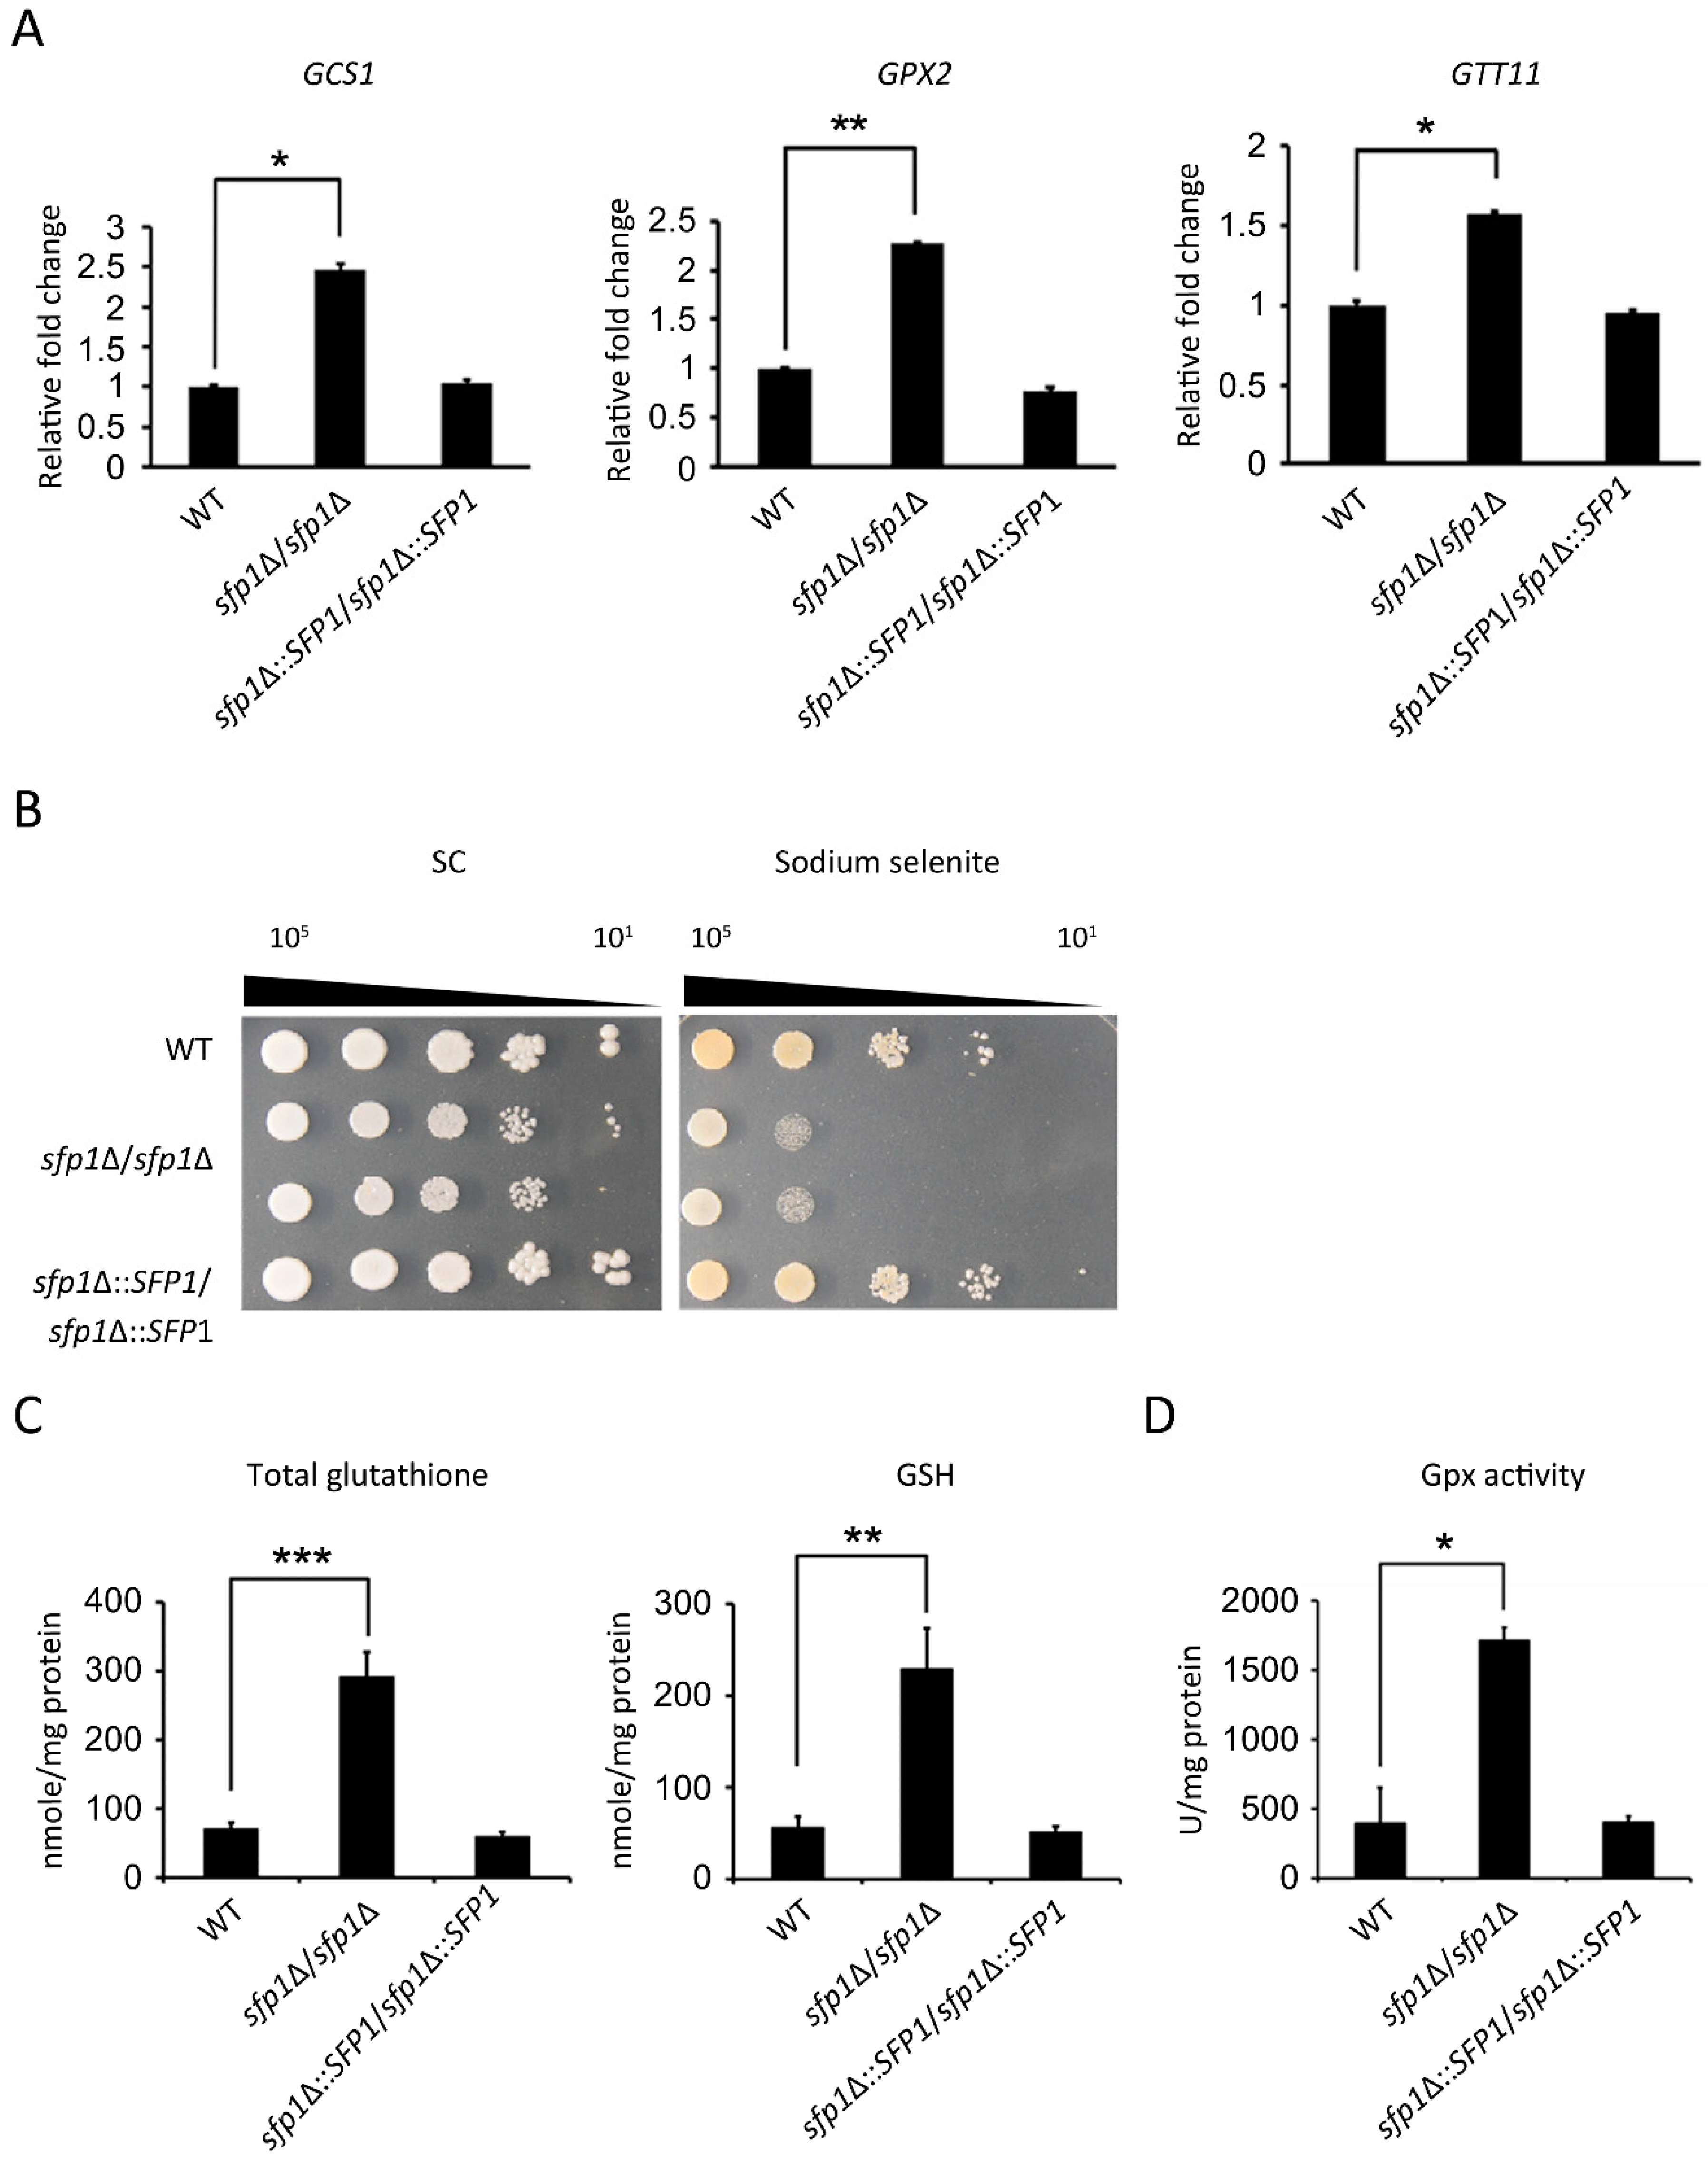
3.5. Sfp1 Regulates the Glutathione System to Detoxify Hydrogen Peroxide

Both catalase and the glutathione system participate in the conversion of H2O2 into water [38,39] and provide overlapping defense against H2O2 in the model yeast Saccharomyces cerevisiae [40]. Therefore, we determined whether the effect of Sfp1 on the cellular response to hydrogen peroxide is via catalase and/or the glutathione system. Interestingly, the sfp1Δ/sfp1Δ mutant displayed slightly lower expression of the CAT1 catalase gene than the wild-type and SFP1-reintegrated strains (Figure 5A). Moreover, catalase enzyme activity was lower in the sfp1Δ/sfp1Δ mutant treated with H2O2 than in the other tested strains (Figure 5B). However, the sfp1Δ/sfp1Δ mutant showed the upregulation of glutathione-related genes in DNA microarray and real-time qPCR analysis (Table 1 and Figure 6A). These genes included GCS1, GPX2, and GTT11. The GCS1, GPX2, and GTT11 genes encode gamma-glutamylcysteine synthetase, glutathione peroxidase, and glutathione S-transferase, respectively [20,41,42]. Therefore, the sfp1Δ/sfp1Δ mutant exhibited lower catalase gene expression and enzyme activity but the increased expression of glutathione redox genes. These results suggest that the resistance to H2O2 seen in the sfp1Δ/sfp1Δ mutant is mainly due to changes in the glutathione redox system rather than catalase.
To further explore the link between Sfp1 and the glutathione redox system, a sodium selenite sensitivity assay was performed to detect alterations in cellular glutathione content. Glutathione is involved in selenite-induced oxidative stress and reacts with selenite to yield superoxide, causing cell death [43]. Therefore, cells containing a high level of glutathione are more sensitive to sodium selenite. Indeed, Figure 6B shows that the sfp1Δ/sfp1Δ mutant was much more sensitive to sodium selenite than the wild-type strain, suggesting a higher cellular glutathione level in the mutant. Moreover, the total glutathione and GSH (reduced form of glutathione) content was also measured. The sfp1Δ/sfp1Δ mutant contained a much higher total glutathione and GHS content than the wild-type and SFP1-reintegrated strains (Figure 6C). Because GSH plays an important role in detoxifying ROS in Candida species [44], the high GSH content likely contributes to H2O2 resistance in the sfp1Δ/sfp1Δ mutant. Finally, glutathione peroxidases (Gpxs) catalyze the reduction of H2O2 using GSH, and their activities were measured. As shown in Figure 6D, the sfp1Δ/sfp1Δ mutant possessed much higher Gpx activity than the wild-type and SFP1-reintegrated strains. In summary, the deletion of SFP1 enhanced GCS1, GPX2, and GTT11 gene expression, which was correlated with a higher total glutathione and GSH content and high Gpx activity. These results suggest that Sfp1 is involved in the regulation of the glutathione redox system to detoxify H2O2.

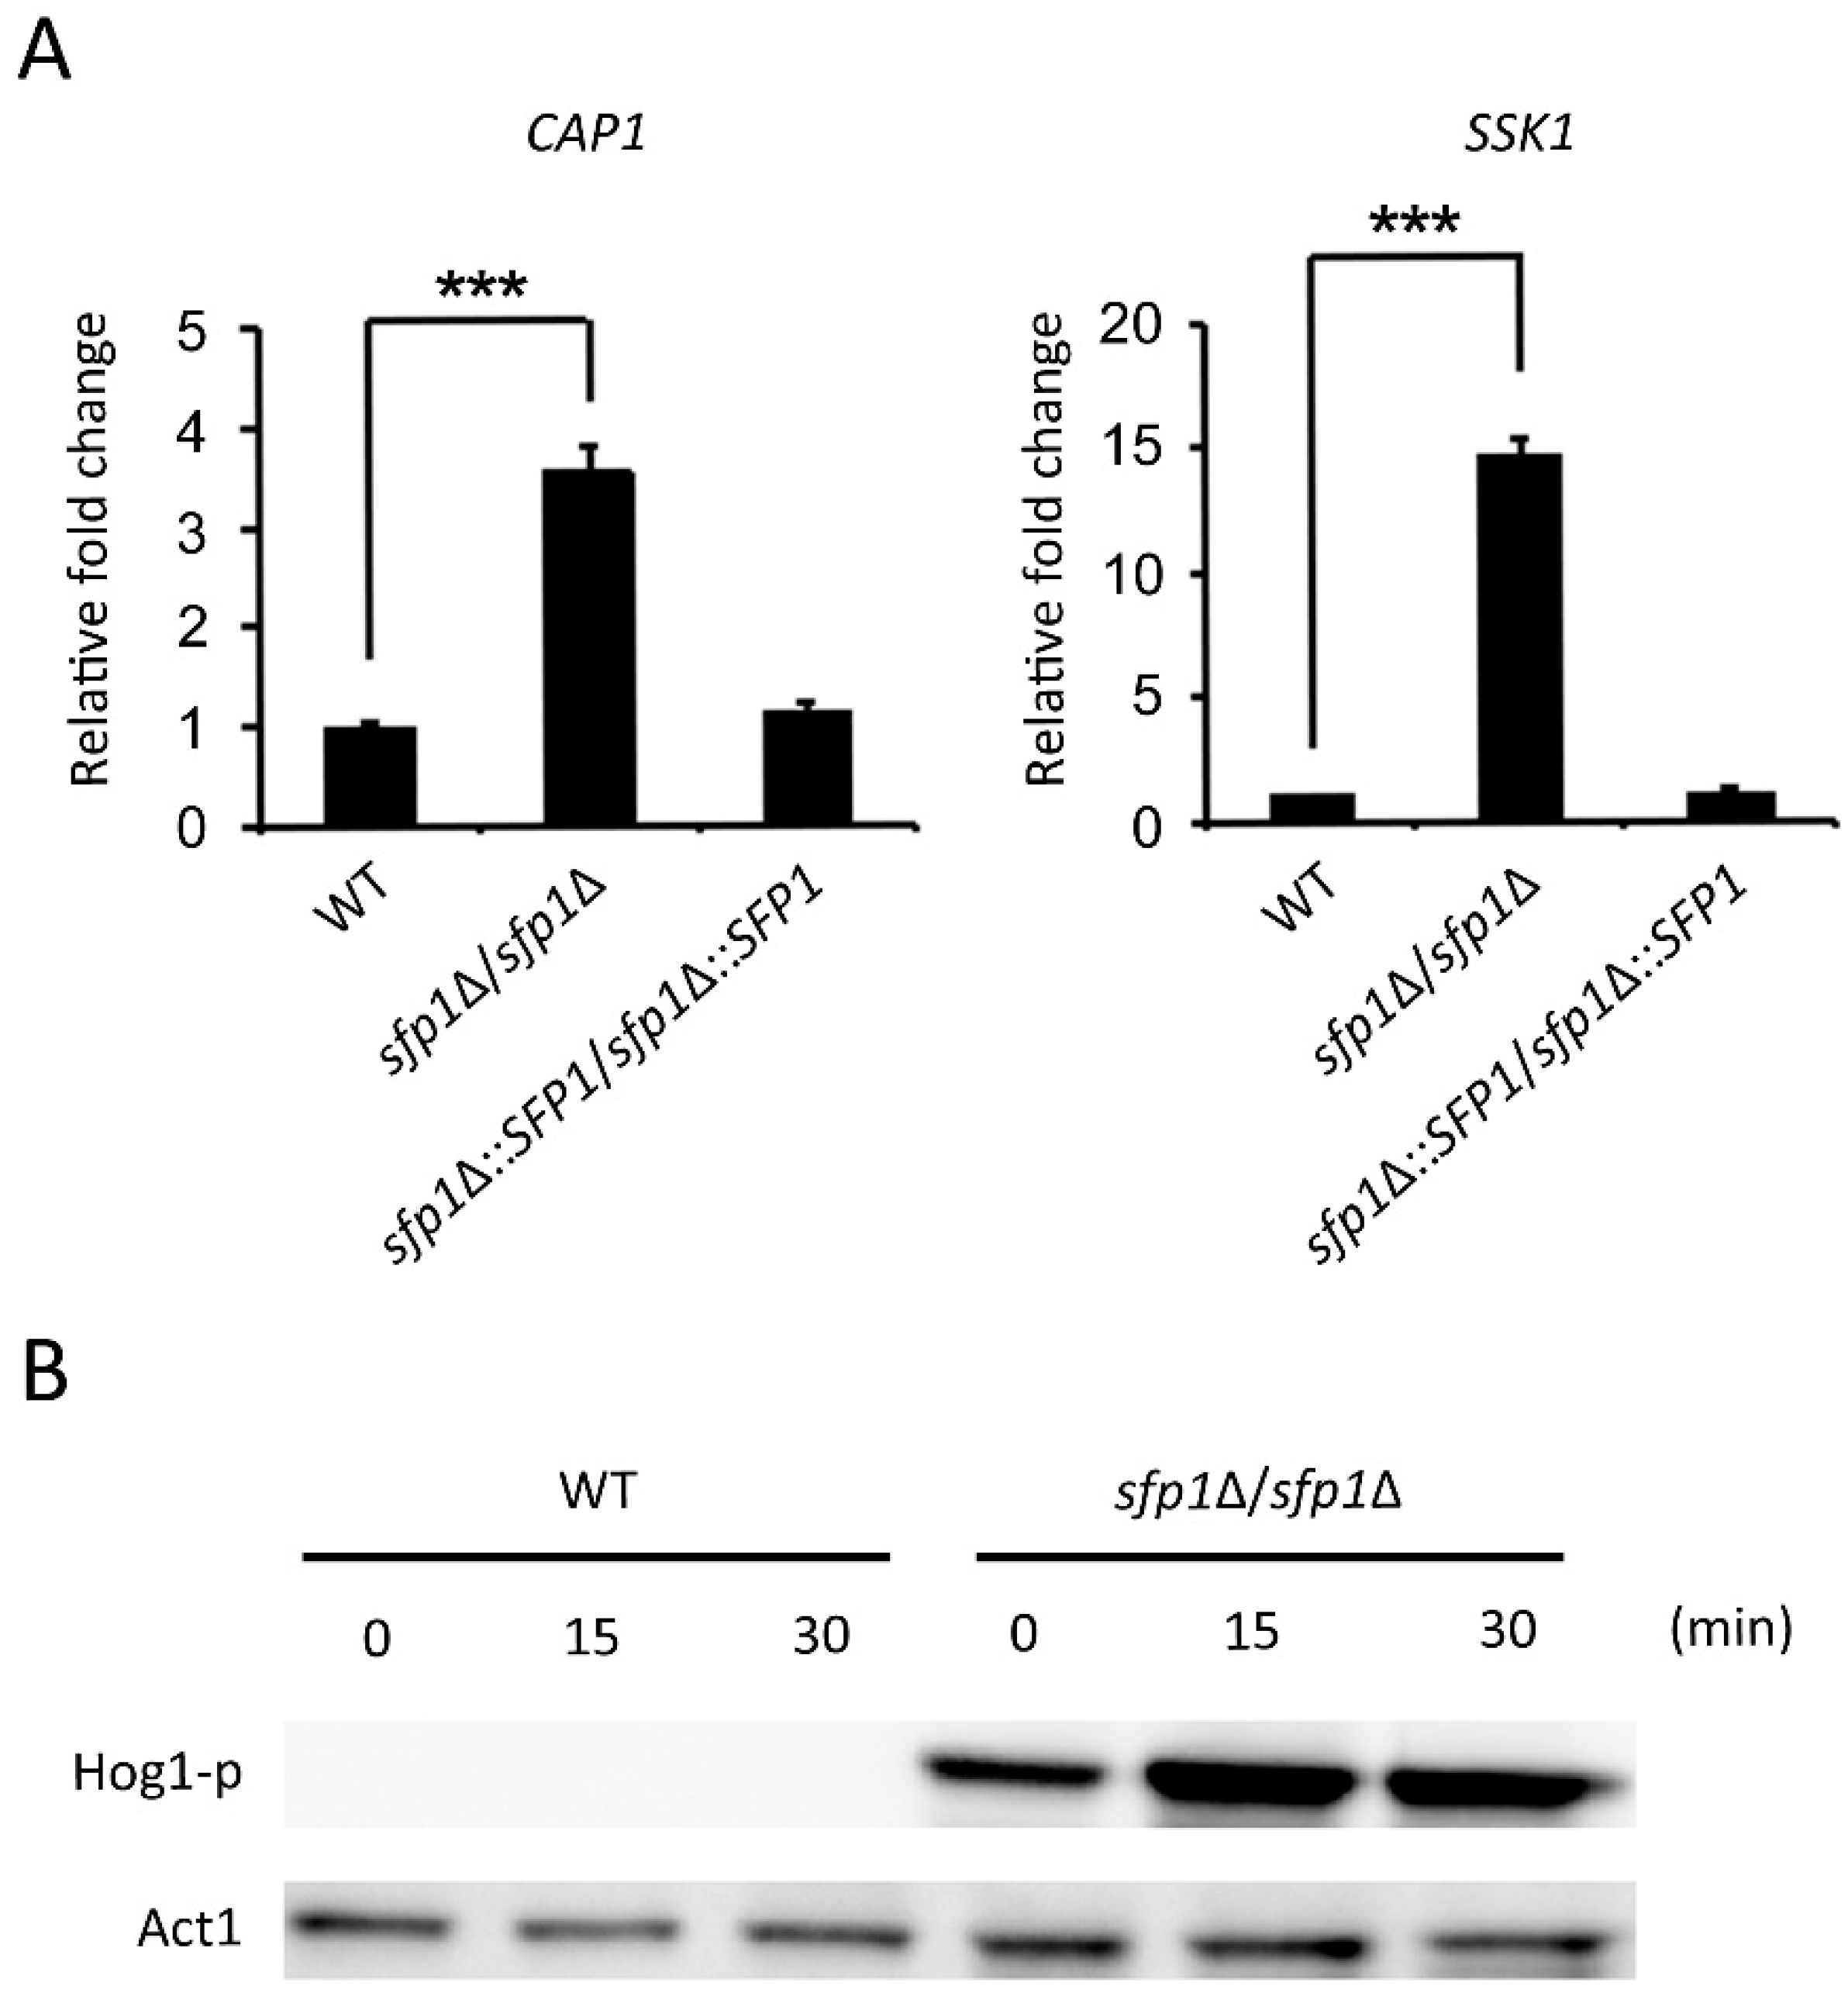
3.6. The Hog1 Signaling Pathway and the Transcription Factor Cap1 Are Related to the Sfp1-Mediated Oxidative Stress Response

The Hog1 MAPK pathway and Cap1-mediated transcriptional regulation are involved in the C. albicans oxidative stress response. Hog1 phosphorylation and Cap1 are required for the response of C. albicans to oxidants and phagocytic killing [17,45]. Based on our results that show Sfp1 is involved in the C. albicans oxidative stress response, we were interested in determining the relationship among Hog1, Cap1, and Sfp1.
As shown by DNA microarray analysis (Table 1) and real-time qPCR (Figure 7A), SSK1 that encodes a component of the Hog1 signaling pathway, was upregulated in the sfp1Δ/sfp1Δ mutant compared to their expression in the other tested strains. In particular, C. albicans utilizes Ssk1 to adapt cells to oxidative stress [32]. As shown by Western blotting in Figure 7B, the sfp1Δ/sfp1Δ mutant contained a significant amount of phosphorylated Hog1 at time point zero, and Hog1 phosphorylation was strongly enhanced in cells treated with H2O2 for 15 and 30 min (Figure 7B). However, as shown by a longer exposure of blot, phosphorylated Hog1 was detected in the wild-type strain in cells treated with H2O2 (Figure S3). These results suggest that the Sfp1-mediated oxidative stress response involves the Hog1 signaling pathway.
Interestingly, the oxidative stress response genes controlled by Sfp1 (Table 1) overlapped with Cap1, including GCS1, GTT11, YCF1, CYS3, CIP1, EBP1, IFD6, and OYE32 [46,47]. Moreover, the expression of the CAP1 gene was upregulated in the sfp1Δ/sfp1Δ mutant compared to its expression in the wild-type and SFP1-reintegrated strains (Table 1 and Figure 7A). These results raise the possibility that the oxidative stress response of Sfp1 may involve regulating CAP1 expression.

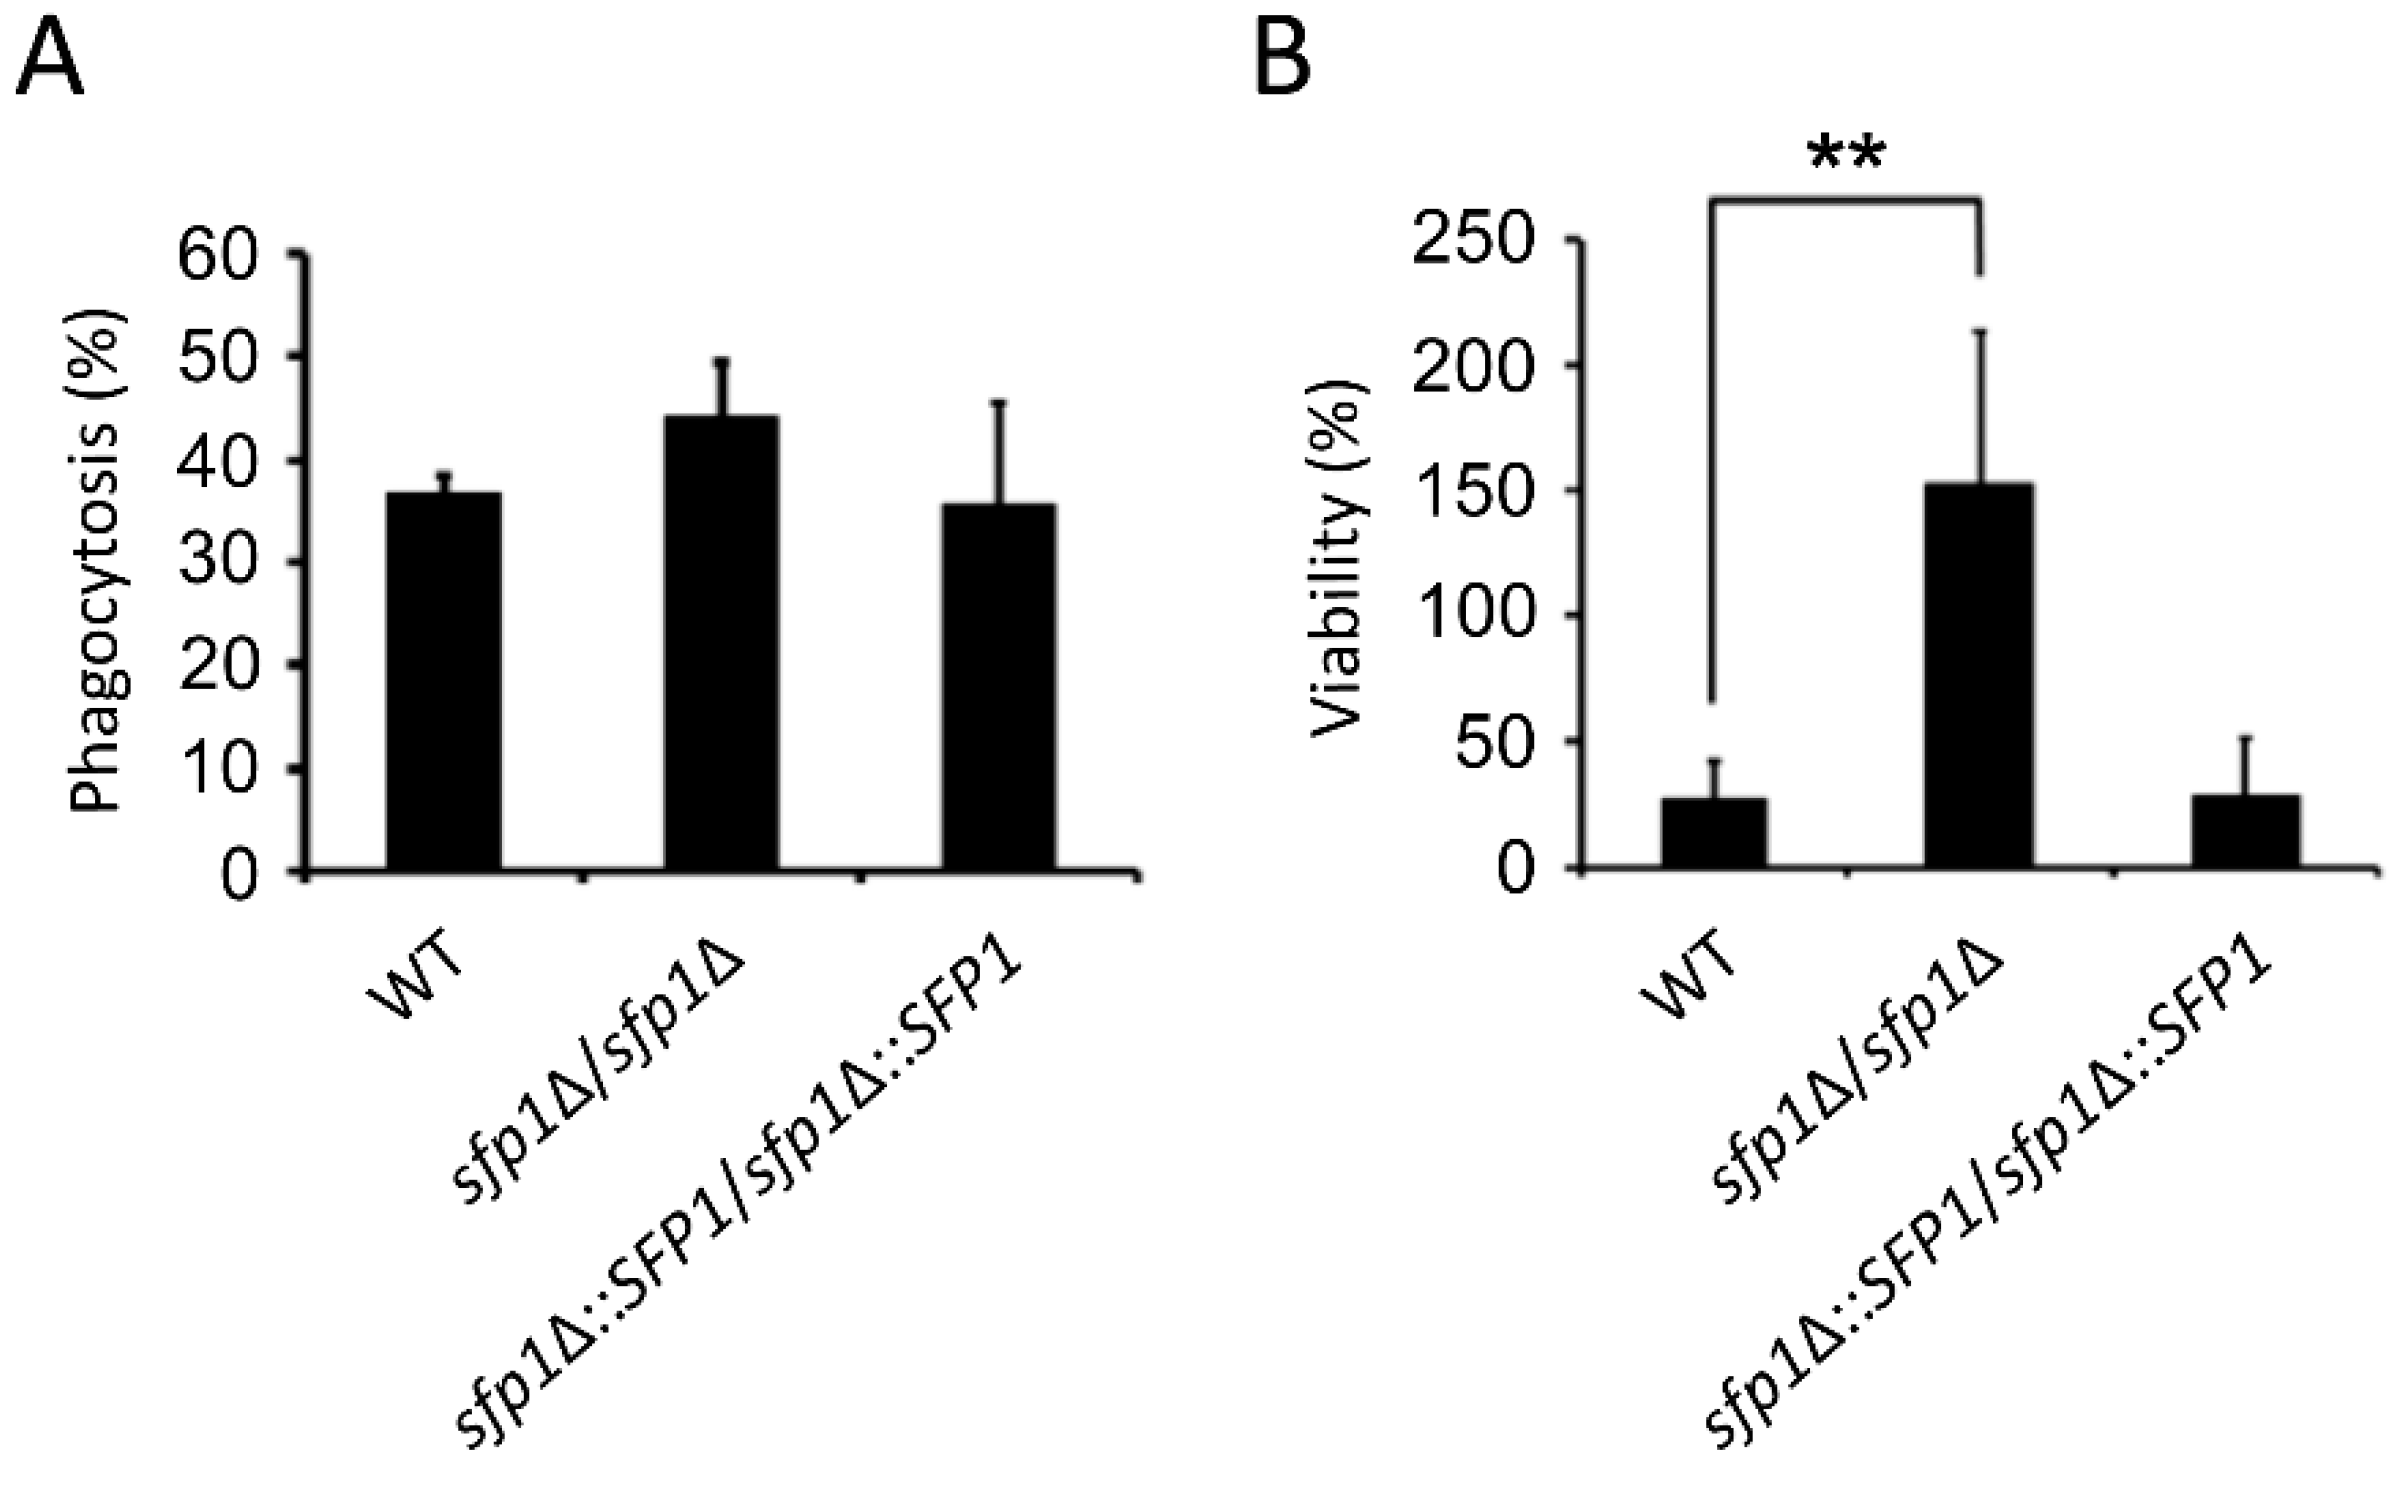
3.7. The sfp1Δ/sfp1Δ Mutant is Resistant to Macrophage Killing

During infection, C. albicans encounters host phagocytes that produce ROS to kill the pathogen. Due to the involvement of Sfp1 in the oxidative stress response, the interaction between the macrophage cell line RAW264.7 and C. albicans was investigated. There was no statistically significant difference in phagocytosis between the sfp1Δ/sfp1Δ mutant, wild-type, and SFP1-reintegrated strains (Figure 8A). However, the wild type and SFP1-reintegrated strains were relatively sensitive to macrophage killing and displayed ~30% viability (Figure 8B). In contrast, the sfp1Δ/sfp1Δ mutant was extremely resistant to macrophage killing (Figure 8B). Notably, growth of the sfp1Δ/sfp1Δ mutant was even enhanced in the macrophage.

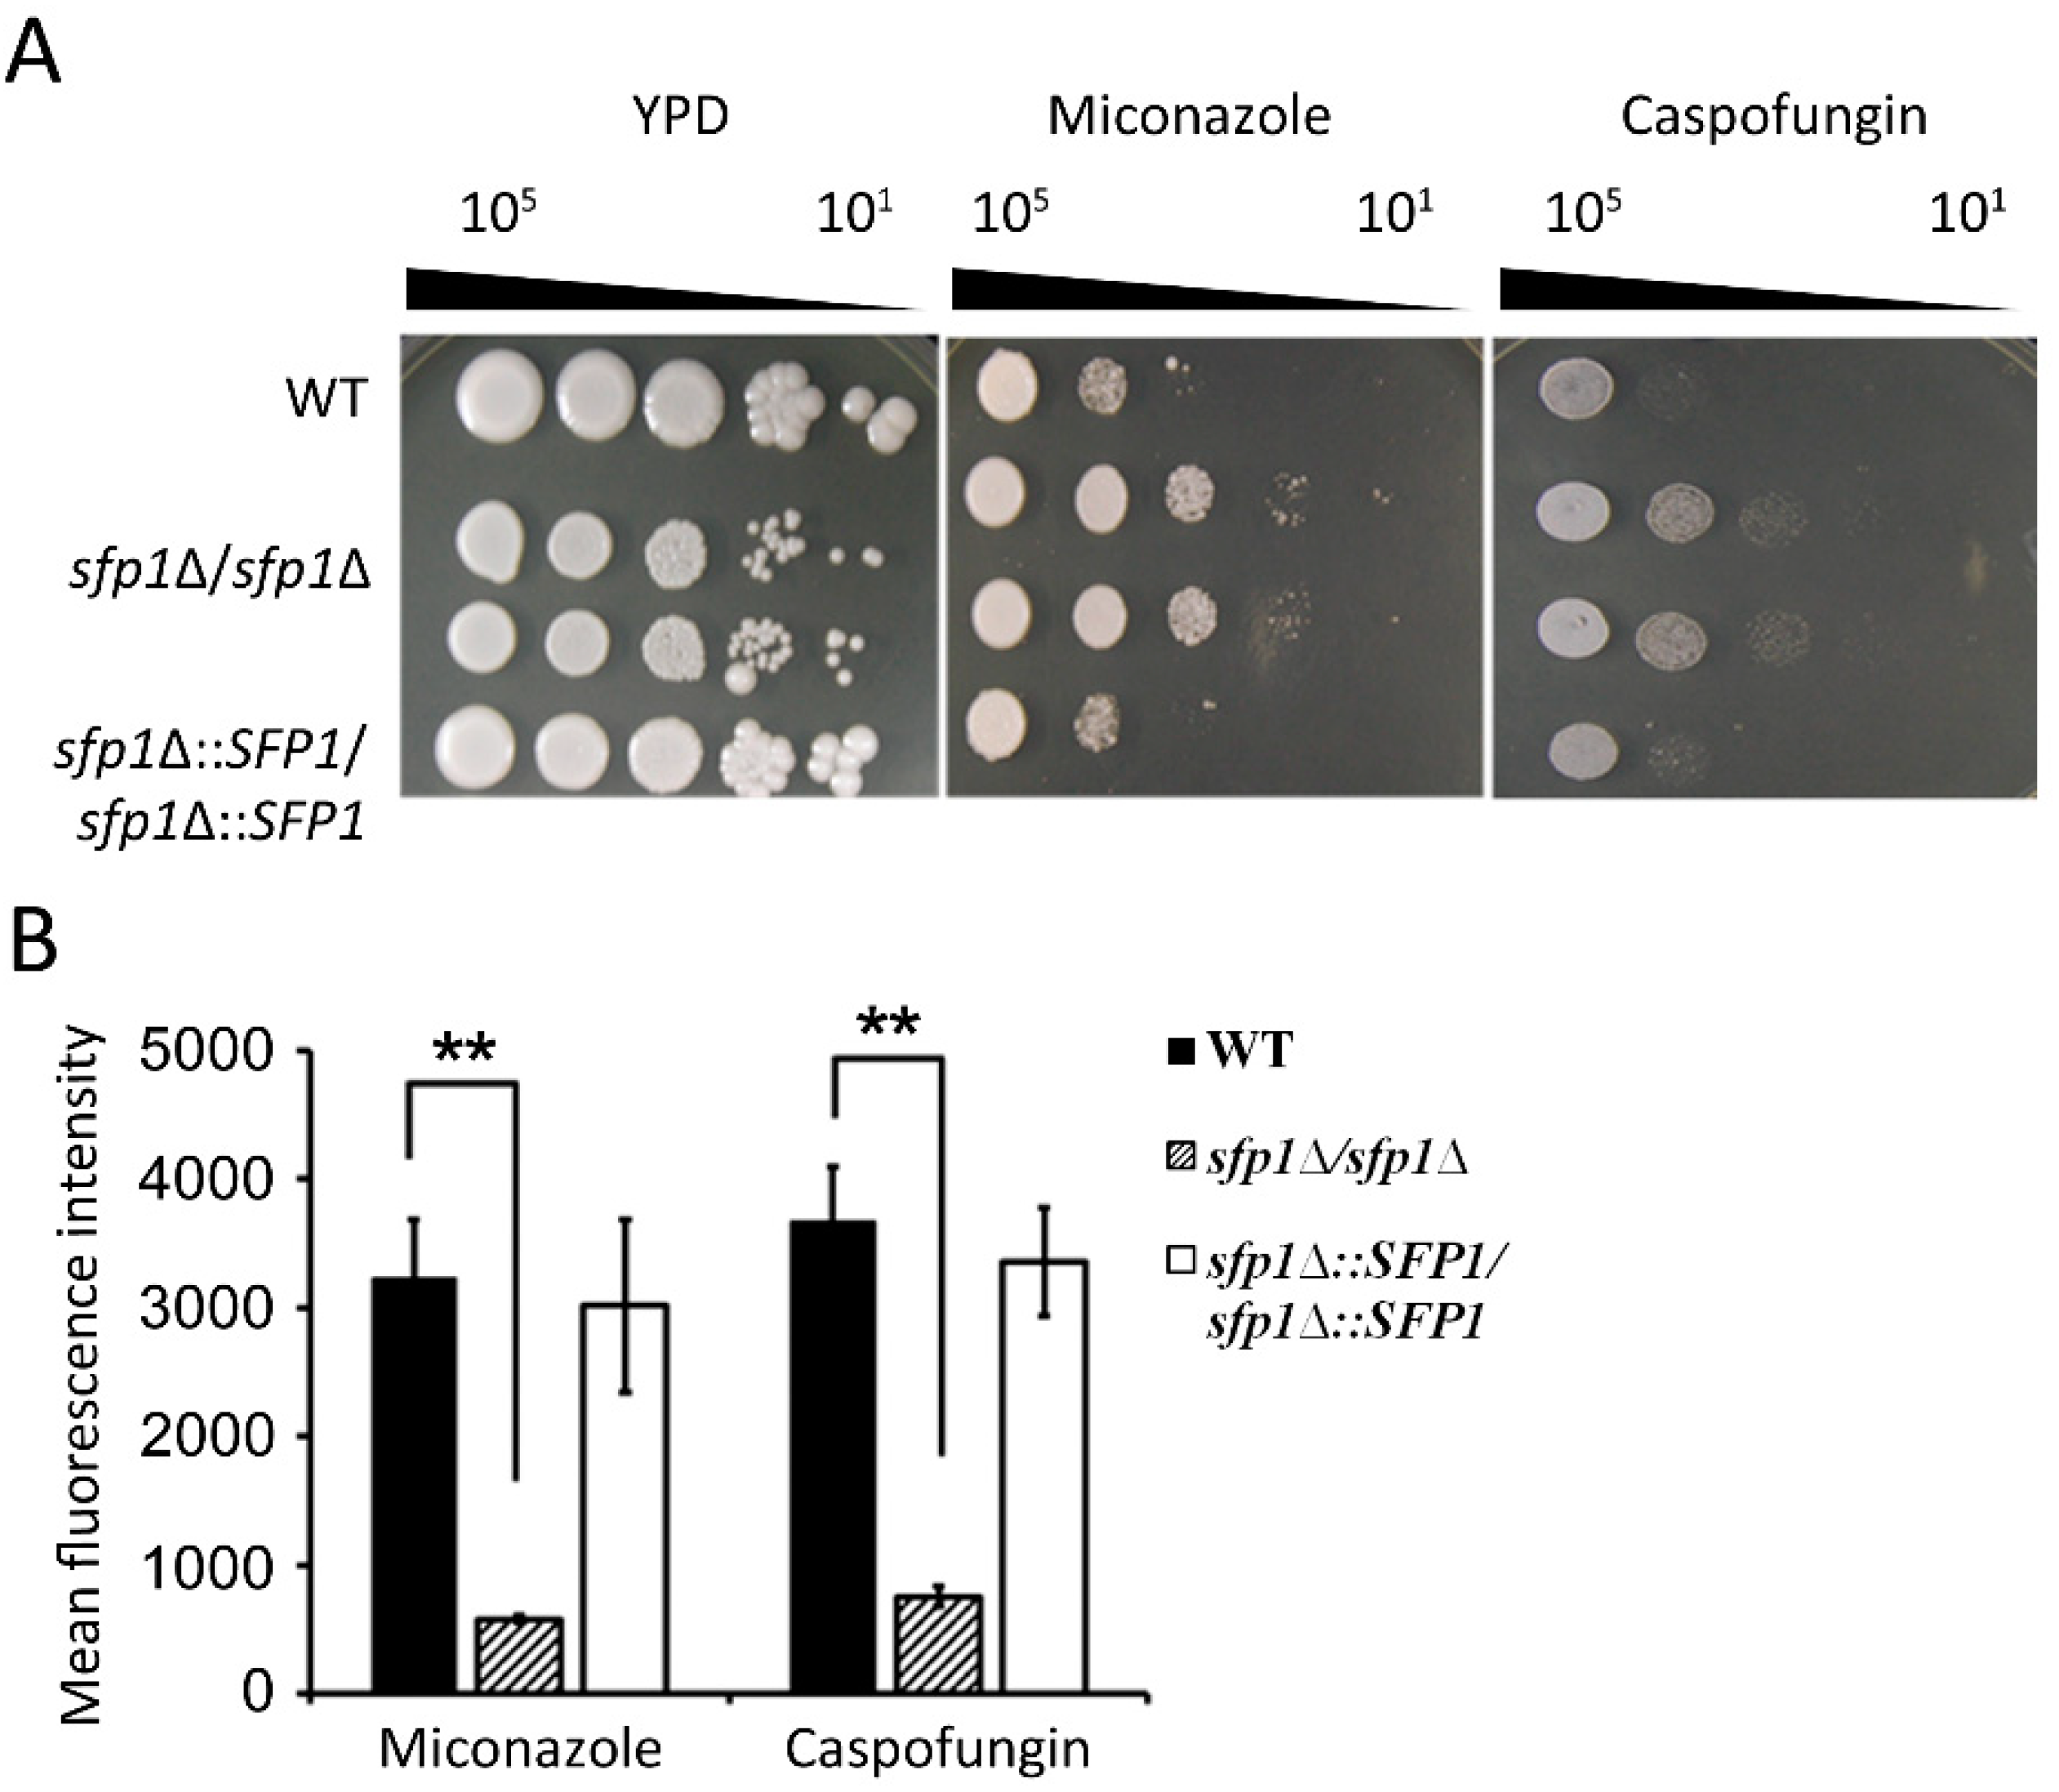
3.8. The sfp1Δ/sfp1Δ Mutant is Resistant to ROS-Generating Antifungals

Miconazole and caspofungin are commonly used antifungals that induce ROS to kill C. albicans [7,8]. In addition, the addition of antioxidants impairs ROS-generating antifungal efficacy [7,21]. Because the sfp1Δ/sfp1Δ mutant exhibits high antioxidative activity, we were interested in linking the susceptibility of the sfp1Δ/sfp1Δ mutant to ROS-generating antifungals. As shown in Figure 9A, the result of spot assay showed that the sfp1Δ/sfp1Δ mutant was resistant to miconazole and caspofungin, as opposed to the controls. Moreover, H2DCFDA staining was performed to measure the intracellular ROS content upon antifungal drug treatment. The sfp1Δ/sfp1Δ mutant exhibited less ROS accumulation with miconazole and caspofungin treatment than the controls (Figure 9B).

4. Discussion

C. albicans is challenged by oxidative stress from host phagocytes and antifungals [3,4]. C. albicans has complex antioxidant systems, signaling pathways, and transcriptional regulatory machinery to cope with oxidative stress. One key mechanism known to activate the expression of antioxidant genes is primarily mediated by Cap1, a bZIP transcription factor in the AP-1 family [47,48]. After exposure to H2O2, Cap1 is activated by the oxidation of its redox-active cysteine residues, allowing the nuclear accumulation of Cap1 [21]. Within the nucleus, Cap1 is phosphorylated and induces the expression of many genes, including CAT1, which encodes catalase, and TRX1, which encodes thioredoxin [46]. Moreover, C. albicans cells lacking CAP1 are sensitive to ROS and phagocyte killing [34,49]. Another mechanism related to the C. albicans oxidative response is Hog1 MAPK signaling [50]. Hog1 is activated in C. albicans in response to diverse stimuli, such as high doses of H2O2, which results in its nuclear accumulation [14]. Moreover, global transcriptional analysis using DNA microarray revealed that 46 core stress genes induced in response to H2O2 are Hog1-dependent [51].
In this study, we demonstrated that the transcription factor Sfp1 is also involved in the oxidative stress response of C. albicans. We showed that the sfp1Δ/sfp1Δ mutant possesses a higher total antioxidant capacity, Sod enzyme activity, GSH content, and glutathione peroxidase activity than the wild-type and SFP1-reintegrated strains (Figure 1, Figure 3, and Figure 6). In addition, the sfp1Δ/sfp1Δ mutant was more resistant to phagocyte killing and ROS-inducing antifungals (Figure 8 and Figure 9). Moreover, DNA microarray analysis and real-time qPCR revealed that the expression of many oxidative stress response-related genes was upregulated in the sfp1Δ/sfp1Δ mutant compared to their expression in the other two strains, including CAP1 (Table 1 and Figure 7A). Moreover, many oxidative stress response genes (e.g., SOD1, GCS1, GTT11, CIP1, EBP1, IFD6, and OYE32) were regulated by both Sfp1 and Cap1 [[46,47] and Table 1]. Recently, Sfp1 was found to reciprocally modulate carbon source-conditional stress adaptation with another transcription factor, Rtg3 [52]. Sfp1 regulates oxidative stress response genes in a carbon source-dependent manner [52]. In the study of Kastora et al. [52], the sfp1Δ/sfp1Δ mutant was more sensitive to H2O2 than the wild-type strain. These results contrasted with the increased sensitivity of the sfp1Δ/sfp1Δ mutant to H2O2 in this study (Figure 1). Our explanation for this result is that these two studies use C. albicans strains from a different genetic background and different concentrations of H2O2. Taken together, our and other studies highlight the complex transcription regulation network of the oxidative stress response. However, the epistatic relationship between Sfp1, Rtg3, and Cap1 needs to be further investigated by either construction of a double mutant or chromatin immunoprecipitation to determine the possible interaction between the Sfp1 protein and the CAP1 promoter. Additionally, whether Sfp1 directly controls oxidative stress genes also requires further study.
In addition to Cap1, Sfp1 is also associated with the Hog1 MAPK signaling pathway. As shown in Figure 7A, the sfp1Δ/sfp1Δ mutant exhibited increased gene expression of the response regulator SSK1, which is an upstream component of the Hog1 cascade, compared to its expression in the other tested strains [53]. In particular, Ssk1 is required for oxidative stress response [32,54], phagocyte killing, and virulence in a disseminate murine model of candidiasis [55,56]. Moreover, Hog1 phosphorylation was enhanced in the sfp1Δ/sfp1Δ mutant compared to that in the wild-type strain in the absence and presence of H2O2 (Figure 7). Finally, compared to the catalase Cat1, the glutathione system seems to play a greater role in H2O2 detoxification in the sfp1Δ/sfp1Δ mutant (Figure 5 and Figure 6). Glutathione is the most important thiol-containing molecule required to maintain the redox homeostasis, as it functions as redox buffer, antioxidant, and enzyme cofactor against oxidative stress [57,58,59]. Interestingly, the sfp1Δ/sfp1Δ mutant exhibited the upregulation of the MET1 and CYS3 genes (Table 1), which encode enzymes involved in methionine and cysteine biosynthesis, respectively. Methionine and cysteine are the precursors of glutathione biosynthesis [42]. Recently, the relationship between Hog1 and Sfp1 was revealed, in which Hog1 is required for Sfp1-dependent ribosome biogenesis (RiBi) gene expression and recruitment to target promoters [60]. However, future studies to examine the role of Hog1 and Sfp1 in C. albicans amino acid and glutathione biosynthesis are still needed.
In addition to C. albicans, transcription factors that are vital for controlling oxidative stress response have been also studied in other fungal species [61,62,63,64]. For example, Skn7 and Yap1 are the AP-1-like bZIP transcription factors in S. cerevisiae. Yap1 is the orthologue of C. albicans Cap1 and accumulates in the nucleus following exposure to H2O2 [62]. Previous studies indicated that Yap1 collaborates with Skn7 to control many oxidative stress response genes [62,65,66,67]. Similarly, Candida glabrata Yap1 and Skn7 are involved in oxidative stress response by cooperatively binding to the upstream region of core oxidative stress genes [68]. Moreover, Ada2 is suggested to orchestrate C. glabrata against ROS-mediated immune defenses during infection [69]. Evidence for Skn7 having a role in virulence is also reported in different fungal species [70]. Therefore, oxidative stress adaptation is not only essential for cell survival, but also an important virulence trait. In this study, our results showed the multiple functions of Sfp1 and the regulatory complexity of the C. albicans oxidative stress response. These results should also provide useful insight into the oxidative stress response in other important human fungal pathogens.

Supplementary Materials

The following are available online at https://0-www-mdpi-com.brum.beds.ac.uk/2076-2607/7/5/131/s1. Table S1: The C. albicans strains used in this study, Table S2: Oligonucleotides used in this study, Figure S1: Gene ontology (GO) distribution of C. albicans genes regulated by Sfp1. Figure S2: The SOD2 and SOD3 gene expression in the sfp1Δ/sfp1Δ mutant. Figure S3. Hog1 phosphorylation by Western blot with a longer exposure.

Author Contributions

Conceptualization, S.-Y.L., H.-F.C., and C.Y.L.; methodology, S.-Y.L., H.-F.C., Y.-P.X., and C.-Y.L.; validation, S.-Y.L. and H.-F.C.; formal analysis, S.-Y.L. and H.-F.C.; investigation, S.-Y.L. and H.-F.C.; resources, H.-F.C., Y.-C.Y., Y.-P.X., and C.-Y.L.; data curation, S.-Y.L. and H.-F.C.; writing—original draft preparation, S.-Y.L., C.-Y.L.; writing—review and editing, H.-F.C., Y.-C.Y., Y.-P.X., and C.-Y.L.; visualization, S.-Y.L., H.-F.C., Y.-C.Y., and C.-Y.L.; supervision, C.-Y.L., project administration, C.-Y.L., funding acquisition, C.-Y.L.

Funding

This research was funded by the Ministry of Science and Technology (Taiwan, ROC), grant number MOST105-2311-B-007-007-MY3.

Conflicts of Interest

The authors declare no conflict of interest.

References

  1. Odd, F. Candida and Candidiasis: A Review and Bibliography; Bailliere Tindal: London, UK, 1988. [Google Scholar]
  2. Arendrup, M.C.; Patterson, T.F. Multidrug-resistant Candida: Epidemiology, molecular mechanisms, and treatment. J. Infect. Dis. 2017, 216, S445–S451. [Google Scholar] [CrossRef]
  3. Dantas Ada, S.; Day, A.; Ikeh, M.; Kos, I.; Achan, B.; Quinn, J. Oxidative stress responses in the human fungal pathogen, Candida albicans. Biomolecules 2015, 5, 142–165. [Google Scholar] [CrossRef] [PubMed]
  4. Delattin, N.; Cammue, B.P.; Thevissen, K. Reactive oxygen species-inducing antifungal agents and their activity against fungal biofilms. Future Med. Chem. 2014, 6, 77–90. [Google Scholar] [CrossRef]
  5. Kaloriti, D.; Tillmann, A.; Cook, E.; Jacobsen, M.; You, T.; Lenardon, M.; Ames, L.; Barahona, M.; Chandrasekaran, K.; Coghill, G.; et al. Combinatorial stresses kill pathogenic Candida species. Med. Mycol. 2012, 50, 699–709. [Google Scholar] [CrossRef] [PubMed]
  6. Mesa-Arango, A.C.; Trevijano-Contador, N.; Roman, E.; Sanchez-Fresneda, R.; Casas, C.; Herrero, E.; Arguelles, J.C.; Pla, J.; Cuenca-Estrella, M.; Zaragoza, O. The production of reactive oxygen species is a universal action mechanism of amphotericin B against pathogenic yeasts and contributes to the fungicidal effect of this drug. Antimicrob. Agents Chemother. 2014, 58, 6627–6638. [Google Scholar] [CrossRef] [PubMed]
  7. Kobayashi, D.; Kondo, K.; Uehara, N.; Otokozawa, S.; Tsuji, N.; Yagihashi, A.; Watanabe, N. Endogenous reactive oxygen species Is an important mediator of miconazole antifungal effect. Antimicrob. Agents Chemother. 2002, 46, 3113–3117. [Google Scholar] [CrossRef]
  8. Hao, B.; Cheng, S.; Clancy, C.J.; Nguyen, H.M. Caspofungin kills Candida albicans by causing both cellular apoptosis and necrosis. Antimicrob. Agents Chemother. 2012, 57, 326–332. [Google Scholar] [CrossRef]
  9. Bink, A.; Vandenbosch, D.; Coenye, T.; Nelis, H.; Cammue, B.P.A.; Thevissen, K. Superoxide dismutases are involved in Candida albicans biofilm persistence against miconazole. Antimicrob. Agents Chemother. 2011, 55, 4033–4037. [Google Scholar] [CrossRef]
  10. Brucker, K.; Bink, A.; Meert, E.; Cammue, B.P.A.; Thevissen, K. Potentiation of antibiofilm activity of amphotericin B by superoxide dismutase inhibition. Oxid. Med. Cell. Longev. 2013, 2013, 1–7. [Google Scholar] [CrossRef]
  11. Komalapriya, C.; Kaloriti, D.; Tillmann, A.T.; Yin, Z.; Herrero-de-Dios, C.; Jacobsen, M.D.; Belmonte, R.C.; Cameron, G.; Haynes, K.; Grebogi, C.; et al. Integrative model of oxidative stress adaptation in the fungal pathogen Candida albicans. PLoS ONE 2015, 10, e0137750. [Google Scholar] [CrossRef] [PubMed]
  12. Broxton, C.N.; Culotta, V.C. SOD enzymes and microbial pathogens: Surviving the oxidative storm of infection. PLoS Pathog. 2016, 12, e1005295. [Google Scholar] [CrossRef]
  13. Wysong, D.R.; Christin, L.; Sugar, A.M.; Robbins, P.W.; Diamond, R.D. Cloning and sequencing of a Candida albicans catalase gene and effects of disruption of this gene. Infect. Immun. 1998, 66, 1953–1961. [Google Scholar]
  14. Smith, D.A.; Nicholls, S.; Morgan, B.A.; Brown, A.J.; Quinn, J. A conserved stress-activated protein kinase regulates a core stress response in the human pathogen Candida albicans. Mol. Biol. Cell 2004, 15, 4179–4190. [Google Scholar] [CrossRef]
  15. Arana, D.M.; Alonso-Monge, R.; Du, C.; Calderone, R.; Pla, J. Differential susceptibility of mitogen-activated protein kinase pathway mutants to oxidative-mediated killing by phagocytes in the fungal pathogen Candida albicans. Cell. Microbiol. 2007, 9, 1647–1659. [Google Scholar] [CrossRef] [PubMed]
  16. Alonso-Monge, R.; Navarro-Garcia, F.; Molero, G.; Diez-Orejas, R.; Gustin, M.; Pla, J.; Sanchez, M.; Nombela, C. Role of the mitogen-activated protein kinase Hog1p in morphogenesis and virulence of Candida albicans. J. Bacteriol. 1999, 181, 3058–3068. [Google Scholar]
  17. Patterson, M.J.; McKenzie, C.G.; Smith, D.A.; da Silva Dantas, A.; Sherston, S.; Veal, E.A.; Morgan, B.A.; MacCallum, D.M.; Erwig, L.-P.P.; Quinn, J. Ybp1 and Gpx3 signaling in Candida albicans govern hydrogen peroxide-induced oxidation of the Cap1 transcription factor and macrophage escape. Antioxid. Redox Signal. 2013, 19, 2244–2260. [Google Scholar] [CrossRef]
  18. Hwang, C.-S.S.; Rhie, G.-e.E.; Oh, J.-H.H.; Huh, W.-K.K.; Yim, H.-S.S.; Kang, S.-O.O. Copper- and zinc-containing superoxide dismutase (Cu/ZnSOD) is required for the protection of Candida albicans against oxidative stresses and the expression of its full virulence. Microbiology 2002, 148, 3705–3713. [Google Scholar] [CrossRef]
  19. Frohner, I.E.; Bourgeois, C.; Yatsyk, K.; Majer, O.; Kuchler, K. Candida albicans cell surface superoxide dismutases degrade host-derived reactive oxygen species to escape innate immune surveillance. Mol. Microbiol. 2009, 71, 240–252. [Google Scholar] [CrossRef] [PubMed]
  20. Miramón, P.; Dunker, C.; Kasper, L.; Jacobsen, I.D.; Barz, D.; Kurzai, O.; Hube, B. A family of glutathione peroxidases contributes to oxidative stress resistance in Candida albicans. Med. Mycol. 2014, 52, 223–239. [Google Scholar] [CrossRef] [PubMed]
  21. Roman, E.; Prieto, D.; Martin, R.; Correia, I.; Mesa Arango, A.C.; Alonso-Monge, R.; Zaragoza, O.; Pla, J. Role of catalase overproduction in drug resistance and virulence in Candida albicans. Future Microbiol. 2016. [Google Scholar] [CrossRef] [PubMed]
  22. Chen, H.-F.; Lan, C.-Y. Role of SFP1 in the regulation of Candida albicans biofilm formation. PLoS ONE 2015, 10, e0129903. [Google Scholar] [CrossRef]
  23. Hsu, P.C.; Chao, C.C.; Yang, C.Y.; Ye, Y.L.; Liu, F.C.; Chuang, Y.J.; Lan, C.Y. Diverse Hap43-independent functions of the Candida albicans CCAAT-binding complex. Eukaryot. Cell 2013, 12, 804–815. [Google Scholar] [CrossRef] [PubMed]
  24. Nailis, H.; Coenye, T.; Van Nieuwerburgh, F.; Deforce, D.; Nelis, H.J. Development and evaluation of different normalization strategies for gene expression studies in Candida albicans biofilms by real-time PCR. BMC Mol. Biol. 2006, 7, 25. [Google Scholar] [CrossRef]
  25. Livak, K.J.; Schmittgen, T.D. Analysis of relative gene expression data using real-time quantitative PCR and the 2(-Delta Delta C(T)) Method. Methods 2001, 25, 402–408. [Google Scholar] [CrossRef]
  26. Yu, Q.; Zhang, B.; Li, J.; Zhang, B.; Wang, H.; Li, M. Endoplasmic reticulum-derived reactive oxygen species (ROS) is involved in toxicity of cell wall stress to Candida albicans. Free Radic. Biol. Med. 2016, 99, 572–583. [Google Scholar] [CrossRef]
  27. Dai, B.-D.D.; Wang, Y.; Zhao, L.-X.X.; Li, D.-D.D.; Li, M.-B.B.; Cao, Y.-B.B.; Jiang, Y.-Y.Y. Cap1p attenuates the apoptosis of Candida albicans. FEBS J. 2013, 280, 2633–2643. [Google Scholar] [CrossRef]
  28. Beers, R.F.; Sizer, I.W. A spectrophotometric method for measuring the breakdown of hydrogen peroxide by catalase. J. Biol. Chem. 1952, 195, 133–140. [Google Scholar] [PubMed]
  29. Rahman, I.; Kode, A.; Biswas, S.K. Assay for quantitative determination of glutathione and glutathione disulfide levels using enzymatic recycling method. Nat. Protoc. 2006, 1, 3159–3165. [Google Scholar] [CrossRef]
  30. Maras, B.; Angiolella, L.; Mignogna, G.; Vavala, E.; Macone, A.; Colone, M.; Pitari, G.; Stringaro, A.; Dupré, S.; Palamara, A.T. Glutathione metabolism in Candida albicans resistant strains to fluconazole and micafungin. PLoS ONE 2014, 9, e98387. [Google Scholar] [CrossRef]
  31. Tsao, C.C.; Chen, Y.T.; Lan, C.Y. A small G protein Rhb1 and a GTPase-activating protein Tsc2 involved in nitrogen starvation-induced morphogenesis and cell wall integrity of Candida albicans. Fungal Genet. Biol. 2009, 46, 126–136. [Google Scholar] [CrossRef]
  32. Chauhan, N.; Inglis, D.; Roman, E.; Pla, J.; Li, D.; Calera, J.A.; Calderone, R. Candida albicans response regulator gene SSK1 regulates a subset of genes whose functions are associated with cell wall biosynthesis and adaptation to oxidative stress. Eukaryot. Cell 2003, 2, 1018–1024. [Google Scholar] [CrossRef]
  33. Wang, Y.; Cao, Y.Y.; Jia, X.M.; Cao, Y.B.; Gao, P.H.; Fu, X.P.; Ying, K.; Chen, W.S.; Jiang, Y.Y. Cap1p is involved in multiple pathways of oxidative stress response in Candida albicans. Free Radic. Biol. Med. 2006, 40, 1201–1209. [Google Scholar] [CrossRef] [PubMed]
  34. Zhang, X.; De Micheli, M.; Coleman, S.T.; Sanglard, D.; Moye-Rowley, W.S. Analysis of the oxidative stress regulation of the Candida albicans transcription factor, Cap1p. Mol. Microbiol. 2000, 36, 618–629. [Google Scholar] [CrossRef] [PubMed]
  35. Missall, T.A.; Lodge, J.K.; McEwen, J.E. Mechanisms of resistance to oxidative and nitrosative stress: Implications for fungal survival in mammalian hosts. Eukaryot. Cell 2004, 3, 835–846. [Google Scholar] [CrossRef] [PubMed]
  36. Lin, G.-Y.; Chen, H.-F.; Xue, Y.-P.; Yeh, Y.-C.; Chen, C.-L.; Liu, M.-S.; Cheng, W.-C.; Lan, C.-Y. The Antimicrobial Peptides P-113Du and P-113Tri Function against Candida albicans. Antimicrob. Agents Chemother. 2016, 60, 6369–6373. [Google Scholar] [CrossRef]
  37. Ramírez-Quijas, M.D.; Zazueta-Sandoval, R. Effect of oxidative stress on cell wall morphology in four pathogenic Candida species. Mycol. Prog. 2015, 14, 8. [Google Scholar] [CrossRef]
  38. Nakagawa, Y.; Koide, K.; Watanabe, K.; Morita, Y.; Mizuguchi, I.; Akashi, T. The expression of the pathogenic yeast Candida albicans catalase gene in response to hydrogen peroxide. Microbiol. Immunol. 1999, 43, 645–651. [Google Scholar] [CrossRef] [PubMed]
  39. Quintana-Cabrera, R.; Bolanos, J.P. Glutathione and gamma-glutamylcysteine in hydrogen peroxide detoxification. Methods Enzymol. 2013, 527, 129–144. [Google Scholar] [CrossRef]
  40. Grant, C.M.; Perrone, G.; Dawes, I.W. Glutathione and catalase provide overlapping defenses for protection against hydrogen peroxide in the yeast Saccharomyces cerevisiae. Biochem. Biophys. Res. Commun. 1998, 253, 893–898. [Google Scholar] [CrossRef]
  41. Garcerá, A.; Casas, C.; Herrero, E. Expression of Candida albicans glutathione transferases is induced inside phagocytes and upon diverse environmental stresses. FEMS Yeast Res. 2010, 10, 422–431. [Google Scholar] [CrossRef]
  42. Yadav, A.K.; Desai, P.R.; Rai, M.N.; Kaur, R.; Ganesan, K.; Bachhawat, A.K. Glutathione biosynthesis in the yeast pathogens Candida glabrata and Candida albicans: Essential in C. glabrata, and essential for virulence in C. albicans. Microbiology 2011, 157, 484–495. [Google Scholar] [CrossRef]
  43. Chen, J.J.; Boylan, L.M.; Wu, C.K.; Spallholz, J.E. Oxidation of glutathione and superoxide generation by inorganic and organic selenium compounds. Biofactors 2007, 31, 55–66. [Google Scholar] [CrossRef] [PubMed]
  44. Gutierrez-Escobedo, G.; Orta-Zavalza, E.; Castano, I.; De Las Penas, A. Role of glutathione in the oxidative stress response in the fungal pathogen Candida glabrata. Curr. Genet. 2013, 59, 91–106. [Google Scholar] [CrossRef]
  45. Alonso-Monge, R.; Navarro-García, F.; Román, E.; Negredo, A.I.; Eisman, B.; Nombela, C.; Pla, J. The Hog1 mitogen-activated protein kinase is essential in the oxidative stress response and chlamydospore formation in Candida albicans. Eukaryot. Cell 2003, 2, 351–361. [Google Scholar] [CrossRef] [PubMed]
  46. Znaidi, S.; Barker, K.S.; Weber, S.; Alarco, A.M.; Liu, T.T.; Boucher, G.; Rogers, P.D.; Raymond, M. Identification of the Candida albicans Cap1p regulon. Eukaryot. Cell 2009, 8, 806–820. [Google Scholar] [CrossRef]
  47. Moye-Rowley, W.S. Regulation of the transcriptional response to oxidative stress in fungi: Similarities and differences. Eukaryot. Cell 2003, 2, 381–389. [Google Scholar] [CrossRef] [PubMed]
  48. Kos, I.; Patterson, M.J.; Znaidi, S.; Kaloriti, D.; da Silva Dantas, A.; Herrero-de-Dios, C.M.; d’Enfert, C.; Brown, A.J.; Quinn, J. Mechanisms underlying the delayed activation of the Cap1 transcription factor in Candida albicans following combinatorial oxidative and cationic stress important for phagocytic potency. mBio 2016, 7, e00331. [Google Scholar] [CrossRef]
  49. Jimenez-Lopez, C.; Lorenz, M.C. Fungal immune evasion in a model host-pathogen interaction: Candida albicans versus macrophages. PLoS Pathog. 2013, 9, e1003741. [Google Scholar] [CrossRef] [PubMed]
  50. Smith, D.A.; Morgan, B.A.; Quinn, J. Stress signalling to fungal stress-activated protein kinase pathways. FEMS Microbiol. Lett. 2010, 306, 1–8. [Google Scholar] [CrossRef] [Green Version]
  51. Enjalbert, B.; Smith, D.A.; Cornell, M.J.; Alam, I.; Nicholls, S.; Brown, A.J.; Quinn, J. Role of the Hog1 stress-activated protein kinase in the global transcriptional response to stress in the fungal pathogen Candida albicans. Mol. Biol. Cell 2006, 17, 1018–1032. [Google Scholar] [CrossRef]
  52. Kastora, S.L.; Herrero-de-Dios, C.; Avelar, G.M.; Munro, C.A.; Brown, A.J.P. Sfp1 and Rtg3 reciprocally modulate carbon source-conditional stress adaptation in the pathogenic yeast Candida albicans. Mol. Microbiol. 2017, 105, 620–636. [Google Scholar] [CrossRef] [PubMed]
  53. Monge, R.A.; Roman, E.; Nombela, C.; Pla, J. The MAP kinase signal transduction network in Candida albicans. Microbiology 2006, 152, 905–912. [Google Scholar] [CrossRef]
  54. Menon, V.; De Bernardis, F.; Calderone, R.; Chauhan, N. Transcriptional profiling of the Candida albicans Ssk1p receiver domain point mutants and their virulence. FEMS Yeast Res. 2008, 8, 756–763. [Google Scholar] [CrossRef]
  55. Calera, J.A.; Zhao, X.J.; Calderone, R. Defective hyphal development and avirulence caused by a deletion of the SSK1 response regulator gene in Candida albicans. Infect. Immun. 2000, 68, 518–525. [Google Scholar] [CrossRef] [PubMed]
  56. Du, C.; Calderone, R.; Richert, J.; Li, D. Deletion of the SSK1 response regulator gene in Candida albicans contributes to enhanced killing by human polymorphonuclear neutrophils. Infect. Immun. 2005, 73, 865–871. [Google Scholar] [CrossRef] [PubMed]
  57. Grant, C.M.; Maclver, F.H.; Dawes, I.W. Glutathione is an essential metabolite required for resistance to oxidative stress in the yeast Saccharomyces cerevisiae. Curr. Genet. 1996, 29, 511–515. [Google Scholar] [CrossRef]
  58. Meister, A.; Anderson, M.E. Glutathione. Annu. Rev. Biochem. 1983, 52, 711–760. [Google Scholar] [CrossRef]
  59. Tillmann, A.T.; Strijbis, S.; Cameron, G.; Radmaneshfar, E.; Thiel, M.; Munro, C.A.; MacCallum, D.M.; Distel, B.; Gow, N.A.R.; Brown, A.J.P. Contribution of Fdh3 and Glr1 to glutathione redox state, stress adaptation and virulence in Candida albicans. PLoS ONE 2015, 10, e0126940. [Google Scholar] [CrossRef]
  60. Sellam, A.; Charillot, J.; Mallick, J.; Tebbji, F.; Richard, J.; Michael, A.; Cook, M.; Tyers, M. The p38/HOG stress-activated protein kinase network couples growth to division in Candida albicans. PLoS Genet. 2019, 15, e1008052. [Google Scholar] [CrossRef]
  61. Brown, A.J.P.; Cowen, L.E.; di Pietro, A.; Quinn, J. Stress adaptation. Microbiol. Spectr. 2017, 5, 66–75. [Google Scholar] [CrossRef]
  62. Morano, K.A.; Grant, C.M.; Moye-Rowley, W.S. The response to heat shock and oxidative stress in Saccharomyces cerevisiae. Genetics 2012, 190, 1157–1195. [Google Scholar] [CrossRef] [PubMed]
  63. Roetzer, A.; Gregori, C.; Jennings, A.M.; Quintin, J.; Ferrandon, D.; Butler, G.; Kuchler, K.; Ammerer, G.; Schuller, C. Candida glabrata environmental stress response involves Saccharomyces cerevisiae Msn2/4 orthologous transcription factors. Mol. Microbiol. 2008, 69, 603–620. [Google Scholar] [CrossRef] [PubMed]
  64. Zhao, H.; Chen, J.; Liua, J.; Han, B. A transcriptome analysis reveals the oxidative stress response in Saccharomyces cerevisiae. RSC. Adv. 2015, 5, 22923–22934. [Google Scholar] [CrossRef]
  65. Charizanis, C.; Juhnke, H.; Krems, B.; Entian, K.D. The oxidative stress response mediated via Pos9/Skn7 is negatively regulated by the Ras/PKA pathway in Saccharomyces cerevisiae. Mol. Gen. Genet. 1999, 261, 740–752. [Google Scholar] [CrossRef]
  66. Gomez-Pastor, R.; Garre, E.; Perez-Torrado, R.; Matallana, E. Trx2p-dependent regulation of Saccharomyces cerevisiae oxidative stress response by the Skn7p transcription factor under respiring conditions. PLoS ONE 2013, 8, e85404. [Google Scholar] [CrossRef]
  67. Lee, J.; Godon, C.; Lagniel, G.; Spector, D.; Garin, J.; Labarre, J.; Toledano, M.B. Yap1 and Skn7 control two specialized oxidative stress response regulons in yeast. J. Biol. Chem. 1999, 274, 16040–16046. [Google Scholar] [CrossRef]
  68. Roetzer, A.; Klopf, E.; Gratz, N.; Marcet-Houben, M.; Hiller, E.; Rupp, S.; Gabaldon, T.; Kovarik, P.; Schuller, C. Regulation of Candida glabrata oxidative stress resistance is adapted to host environment. FEBS Lett. 2011, 585, 319–327. [Google Scholar] [CrossRef] [PubMed]
  69. Kounatidis, I.; Ames, L.; Mistry, R.; Ho, H.L.; Haynes, K.; Ligoxygakis, P. A gost-pathogen interaction screen identifies ada2 as a mediator of Candida glabrata defenses against reactive oxygen species. G3 (Bethesda) 2018, 8, 1637–1647. [Google Scholar] [CrossRef]
  70. Fassler, J.S.; West, A.H. Fungal Skn7 stress responses and their relationship to virulence. Eukaryot. Cell 2011, 10, 156–167. [Google Scholar] [CrossRef]
Figure 1. Total antioxidant capacity of C. albicans. The cells were treated with or without 1 mM hydrogen peroxide for 2 h. Total antioxidant capacity was measured and expressed as molar Trolox equivalents. WT: wild-type strain; sfp1Δ/sfp1Δ: sfp1-deleted mutant; sfp1Δ::SFP1/sfp1Δ::SFP1: SFP1-reintegrated strain. The results are presented as the mean ± standard deviation (SD) of three independent experiments. * P < 0.05.
Microorganisms 07 00131 g001
Figure 2. Susceptibility of C. albicans to menadione and menadione-induced intracellular ROS generation. (A) The cells were ten-fold serially diluted and spotted onto YPD agar plates with or without 290 μM menadione. The agar plates were incubated at 30 °C for 3–4 days. Representative images of three independent experiments with identical results are shown. (B) Cells were treated with 870 μM menadione for 2 h, stained with 4 μg/mL of PI, and analyzed using a flow cytometer. The dead cells are expressed as PI-positive cells. (C) Cells were treated with 290 μM menadione for 2 h and stained with 20 μg/mL H2DCFDA. The mean fluorescence intensity of 10,000 cells was determined by flow cytometry. The results are presented as the mean ± standard deviation (SD) of three independent experiments. *** P < 0.001.
Microorganisms 07 00131 g002
Figure 3. SOD gene expression and activity in cells treated with menadione. (A) The expressions levels of SODs were analyzed using real-time qPCR after treatment of the cells with 170 μM menadione for 2 h. The PMA1 transcript was used as an endogenous control. (B) Cells were treated with 170 μM menadione for 2 h, and Sod enzyme activity was then measured. The results are presented as the mean ± standard deviation (SD) of three independent experiments. *** P < 0.001.
Microorganisms 07 00131 g003
Figure 4. Susceptibility of C. albicans to H2O2 and H2O2-induced intracellular ROS generation. (A) Cells were treated with various concentrations of H2O2 as indicated for 2 h and stained with 4 μg/mL PI. Cell viability was then quantified by flow cytometry. The dead cells are represented as PI-positive cells. (B) Cells were treated with 30 mM H2O2 for 2 h and stained with 20 μg/mL H2DCFDA. Intracellular ROS were quantified by flow cytometry. The results are presented as the mean ± standard deviation (SD) of three independent experiments. *** P < 0.001. ** P < 0.01. * P < 0.05. (C) Cells were treated with 30 mM H2O2 for 2 h. Cell surface structure was examined using SEM at 5500× magnification. Arrows point to the rough appearance of protrusions and disc-like depressions.
Microorganisms 07 00131 g004
Figure 5. Catalase gene expression and enzyme activity. (A) The expression level of the CAT1 gene was detected using real-time qPCR. The PMA1 transcript was used as an endogenous control. (B) Cells were treated with 1 mM H2O2 for 2 h, and catalase activity was determined. The results are presented as the mean ± standard deviation (SD) of three independent experiments. *** P < 0.001; * P < 0.05.
Microorganisms 07 00131 g005
Figure 6. Sfp1 regulates the glutathione system in response to H2O2. (A) GCS1, GPX2, and GTT11 gene expression levels were detected using real-time qPCR. The PMA1 transcript was used as an endogenous control. The results are presented as the mean ± standard deviation (SD) of three independent experiments. ** P < 0.01. * P < 0.05. (B) One colony was inoculated into YPD medium and grown at 30 °C overnight. This culture was harvested by centrifugation and washed with sterile double-distilled water (ddH2O). Cells were ten-fold serially diluted and spotted onto YPD agar with or without 3 mM sodium selenite. The agar plates were incubated at 30 °C for 3–4 days. Representative images of three independent experiments with identical results are shown. (C) Cells were treated with 1 mM H2O2 for 2 h. The GSH and GSSG content was determined by measuring TNB absorbance at 415 nm. The GSH content was determined as follows: [total glutathione]–2[GSSG]. The results are presented as the mean ± standard deviation (SD) of three independent experiments. ** P < 0.01. *** P < 0.001. (D) Cells were treated with 1 mM H2O2 for 2 h. The enzyme activity of glutathione peroxidase (Gpx) was determined by the oxidation of NADPH. The results are presented as the mean ± standard deviation (SD) of two independent experiments. * P < 0.05.
Microorganisms 07 00131 g006
Figure 7. Hog1 signaling and the Cap1 transcription factor are related to the Sfp1-mediated oxidative stress response. (A) Gene expression levels of CAP1 and SSK1 were analyzed using real-time qPCR. The PMA1 transcript was used as an endogenous control. The results are presented as the mean ± standard deviation (SD) of three independent experiments. *** P < 0.001. * P < 0.05. (B) After cell treatment with 10 mM H2O2 for 0, 15, and 30 min, Hog1 phosphorylation was assayed using Western blotting. Act1 was used as a loading control. Anti-phospho-p38 (Thr180/Tyr182) antibody (Cell Signaling, Inc.) was used to detect phosphorylated Hog1. Rabbit polyclone anti-β-actin antibody (GeneTex, Inc.) was used to detect Act1.
Microorganisms 07 00131 g007
Figure 8. The sfp1Δ/sfp1Δ mutant is resistant to macrophage-mediated killing. (A) C. albicans cells were cocultured with 2 × 10⁶ macrophage cells for 20 min at an MOI of 1. Data were obtained from three independent experiments by analyzing at least 300 macrophages per well. (B) A total of 105 C. albicans cells were cocultured with macrophages for 16 h at an MOI of 1:10. The cell viability was determined by CFU counting. The results are presented as the mean ± standard deviation (SD) of five independent experiments. ** P < 0.01.
Microorganisms 07 00131 g008
Figure 9. The effect of SFP1 deletion on cellular susceptibility to ROS-generating antifungals and the accumulation of intracellular ROS upon antifungal treatment. (A) One colony was inoculated into YPD medium and grown at 30 °C overnight. This culture was harvested by centrifugation and washed with sterile double-distilled water (ddH2O). Cells were ten-fold serially diluted and spotted onto YPD agar with or without 8 µg/mL of an antifungal. The agar plates were incubated at 30 °C for 3–4 days. Representative images of three independent experiments with identical results are shown. (B) Cells were treated with 3 µg/mL miconazole or 1 µg/mL caspofungin for 2 h. Intracellular ROS were measured using H2DCFDA staining and quantified by a flow cytometer. The results are presented as the mean ± standard deviation (SD) of three independent experiments. ** P < 0.01.
Microorganisms 07 00131 g009
Table 1. Relative expression of oxidative stress response genes in the sfp1-deleted vs wild-type strains. (P < 0.05).
ORFGeneFunctionRelative fold change (sfp1∆/∆: WT)
Transcription factor
orf19.1623CAP1bZIP transcription factor, responding to oxidative stress1.58
Hog MAPK pathway
orf19.5031SSK1Response regulator 2.01
Glutathione system
orf19.5059GCS1Gamma-glutamylcysteine synthetase2.32
orf19.85GPX2Glutathione peroxidase2.27
orf19.6947GTT11Glutathione S-transferase1.65
orf19.359GTT12Glutathione S-transferase1.70
orf19.356GTT13Glutathione S-transferase1.71
orf19.6478YCF1Glutathione S-conjugate transporter1.79
orf19.5673OPT7Glutathione transmembrane transporter4.04
orf19.6402CYS3Cystathionine gamma-lyase2.18
orf19.5811MET1Uroporphyrin-3 C-methyltransferase 3.59
Thioredoxin system
orf19.5180PRX1Thioredoxin peroxidase3.43
Oxidoreductase
orf19.113CIP1Oxidoreductase, induced by oxidative stress2.11
orf19.125EBP1NADPH oxidoreductase2.26
orf19.3131OYE32NAD(P)H oxidoreductase1.88
orf19.1048IFD6Aldo-keto reductase2.04
Others
orf19.5843SRR1Two-component system response regulator involving in multiple stress responses3.84
orf19.7293MPS1Monopolar spindle protein2.13
orf19.4772SHO1Adaptor protein1.87
orf19.2028MXR1Methionine sulfoxide reductase1.83

