
Effects of Dispersants and Biosurfactants on Crude-Oil Biodegradation and Bacterial Community Succession

 , , , , and
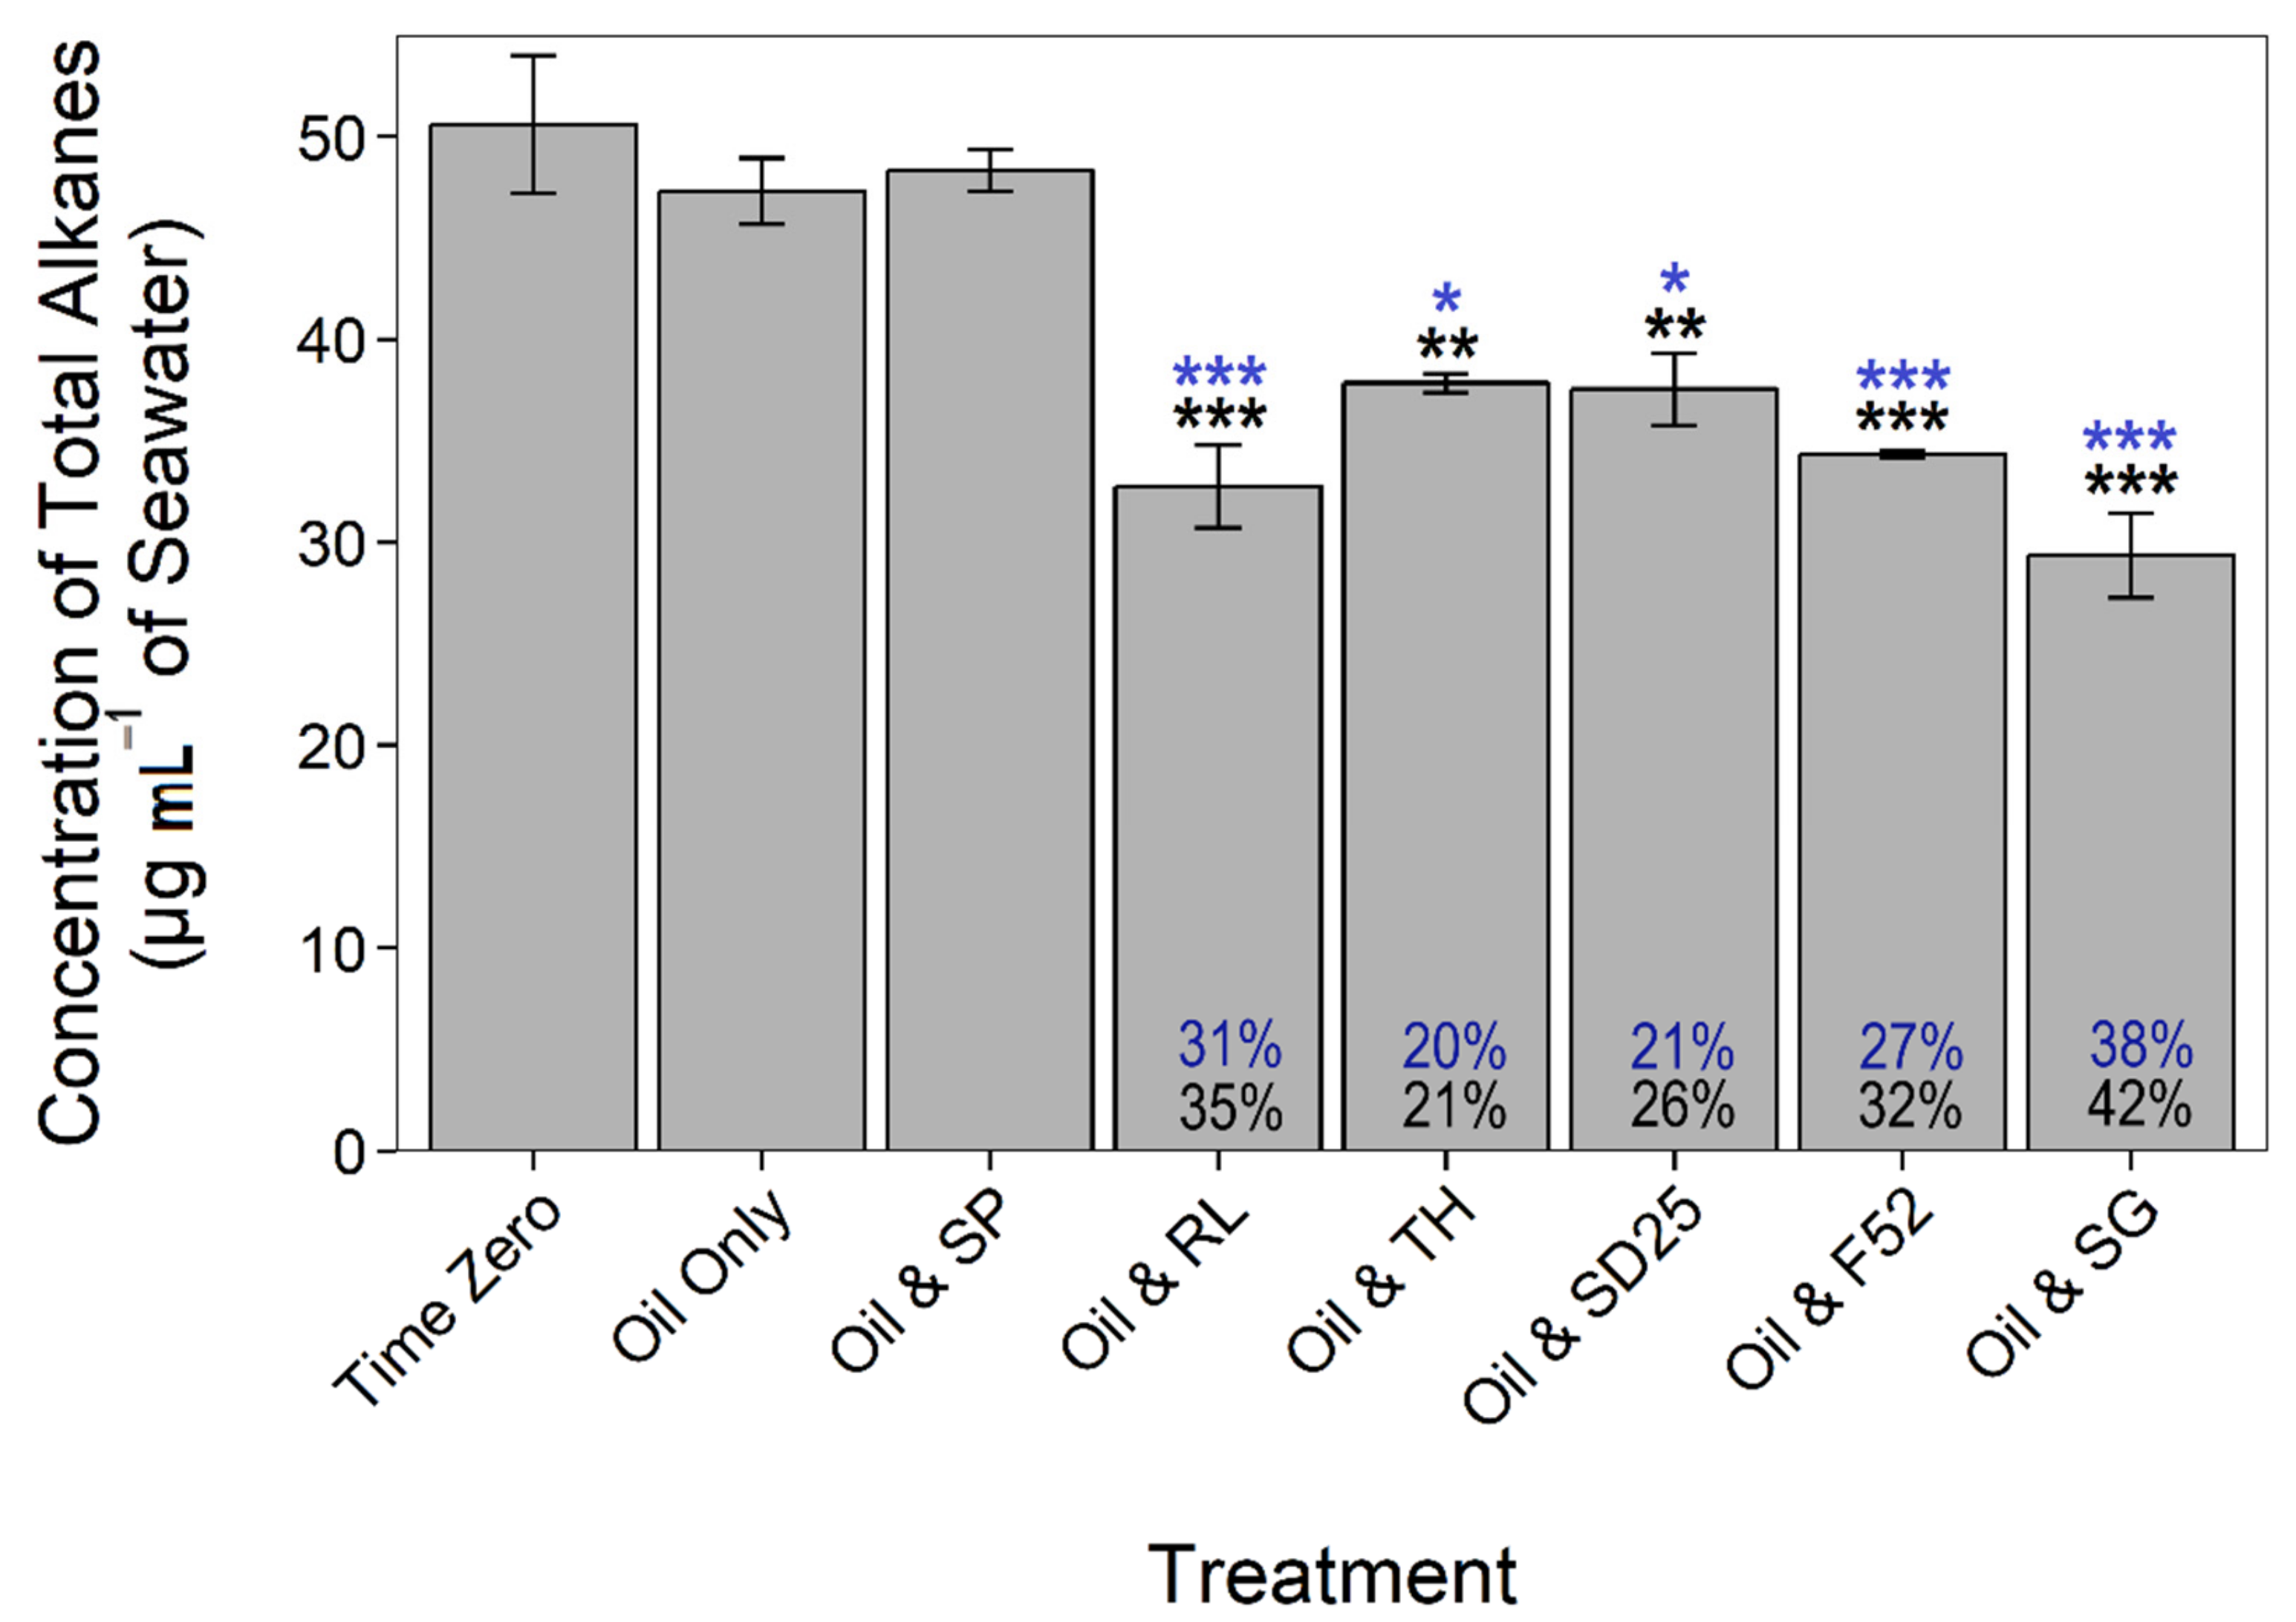
Abstract
:1. Introduction
2. Materials and Methods
2.1. Sampling Site
2.2. Microcosm Design and Sampling
2.3. Surface Tension
2.4. Hydrocarbon Degradation (GC–MS)
2.5. qPCR Analysis of Bacterial 16S rRNA Genes
2.6. Nutrient Concentration
2.7. Amplicon Sequencing and Bioinformatics
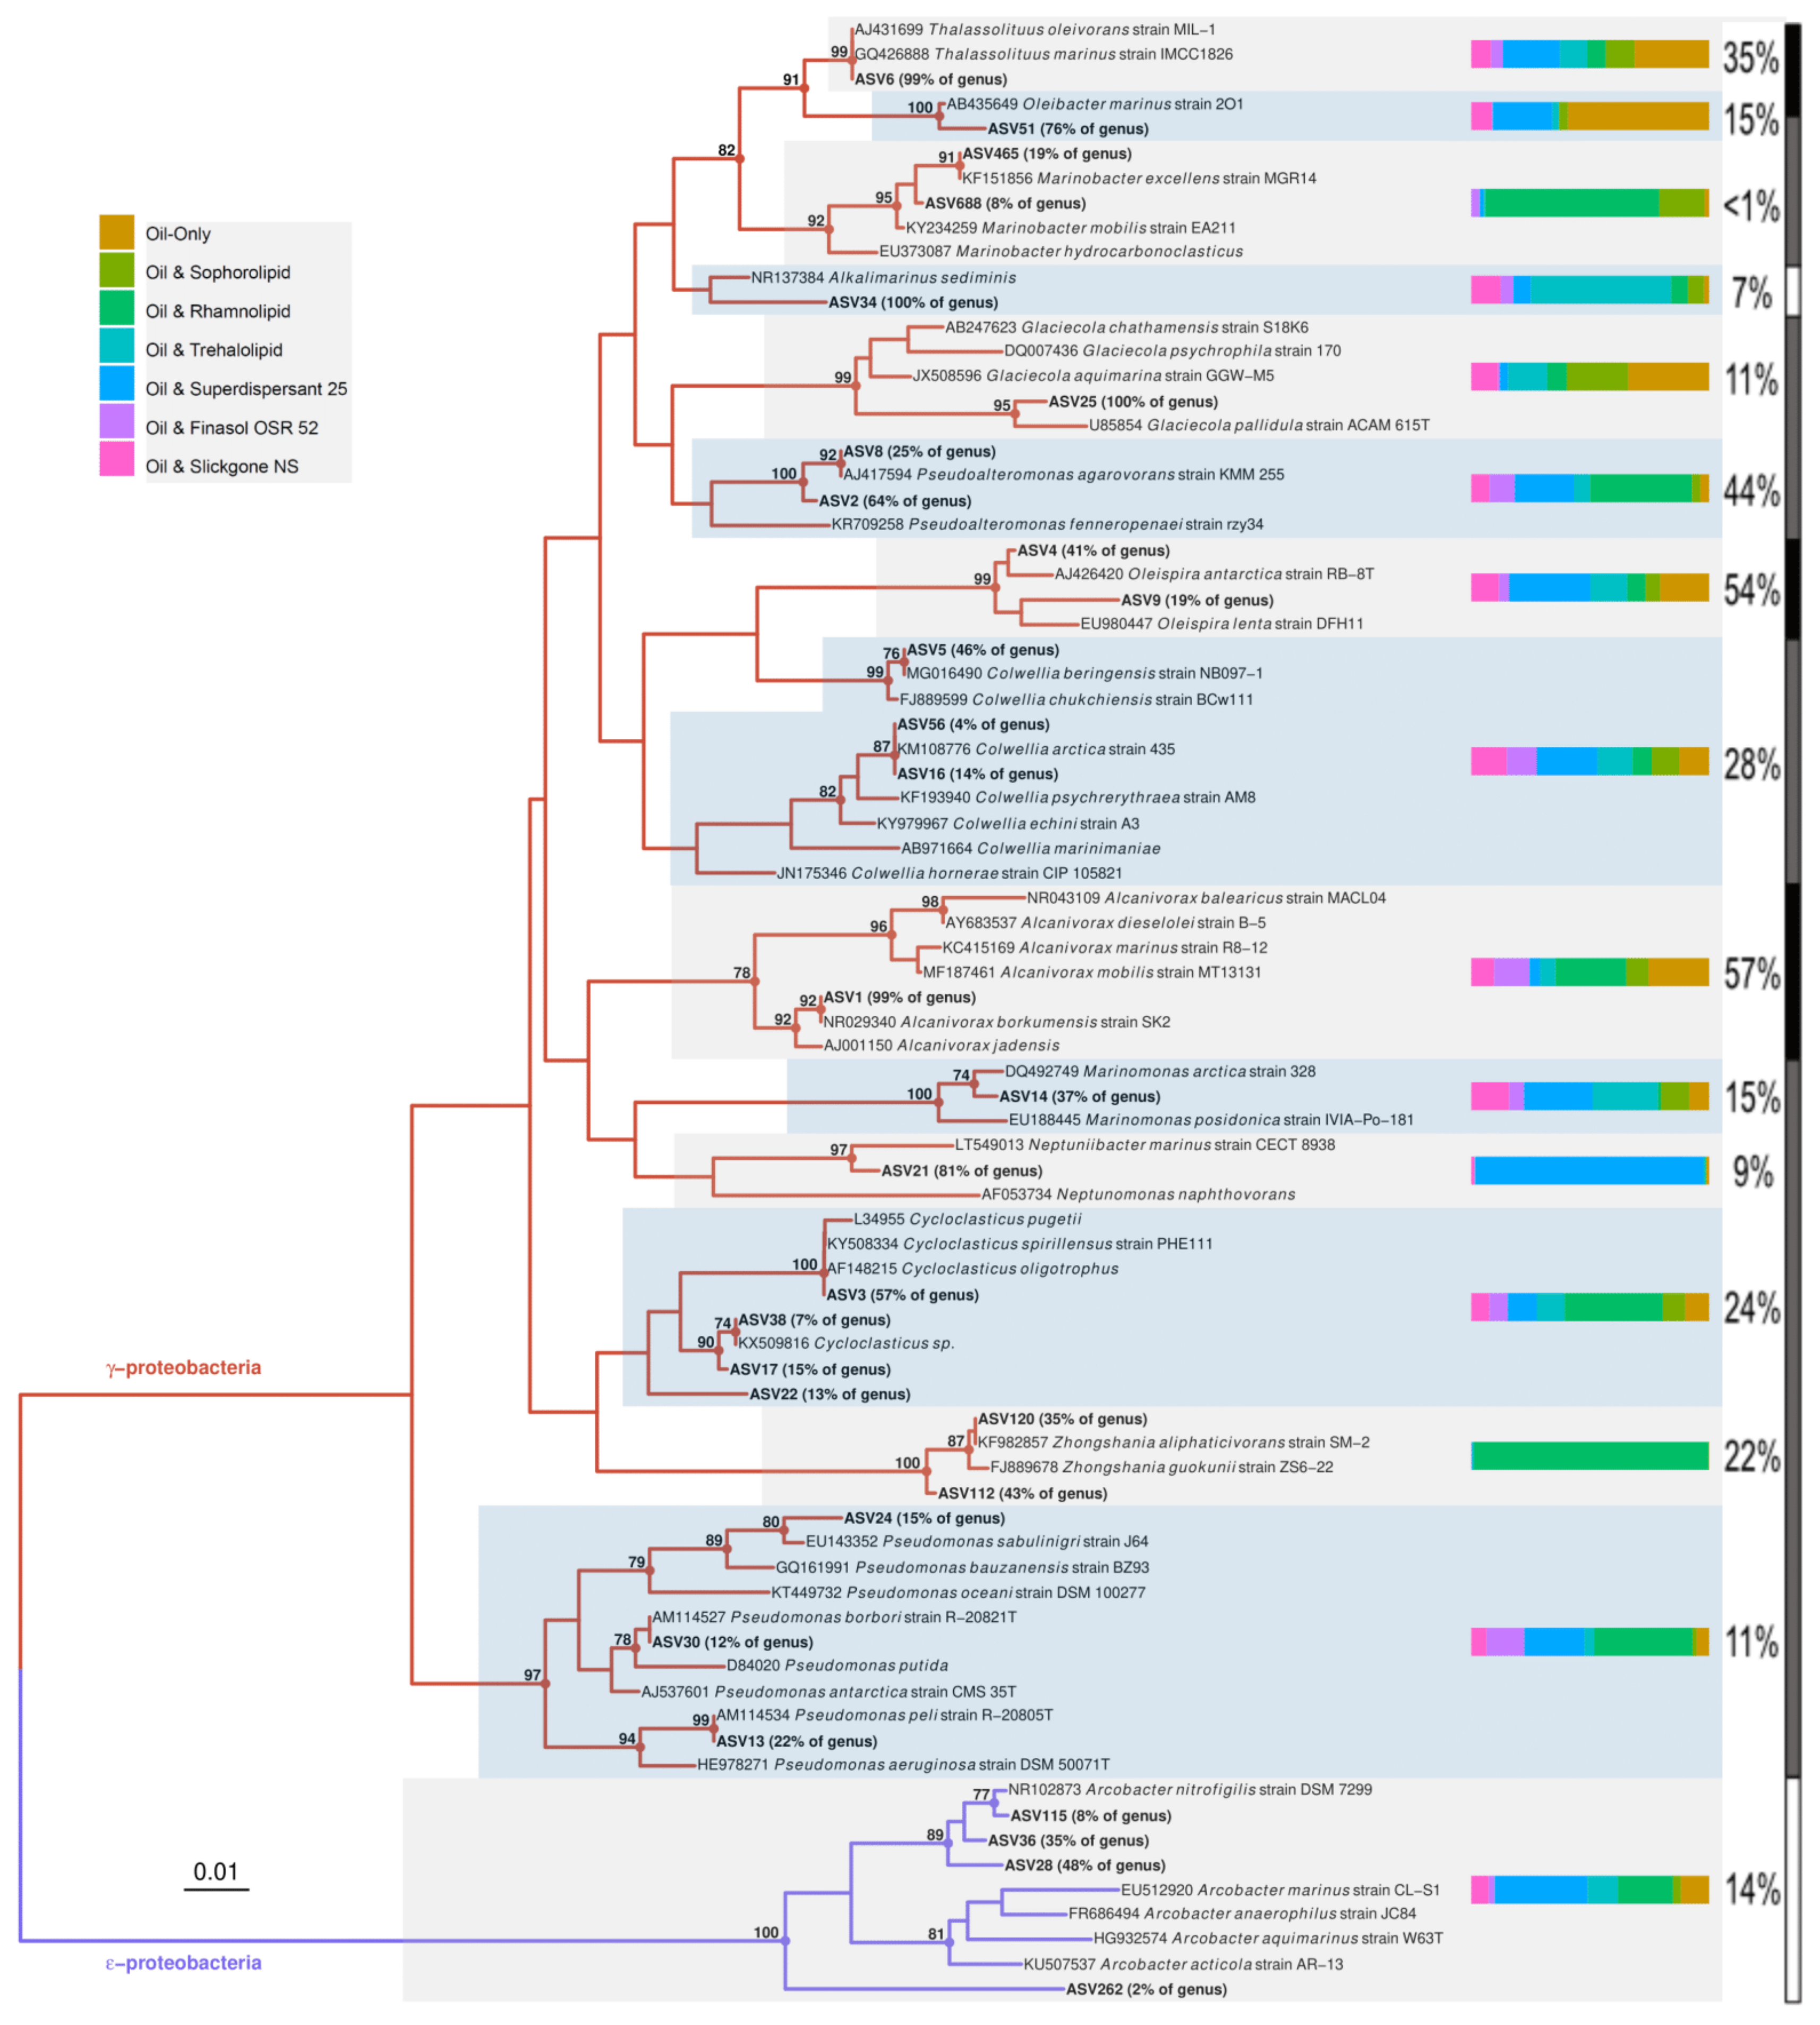
2.8. Phylogenetic Analysis
2.9. Statistical Analysis
3. Results
3.1. Effects of Dispersants and Biosurfactants on the Surface Tension of Seawater
3.2. Effects of Dispersants and Biosurfactants on Hydrocarbon Concentrations
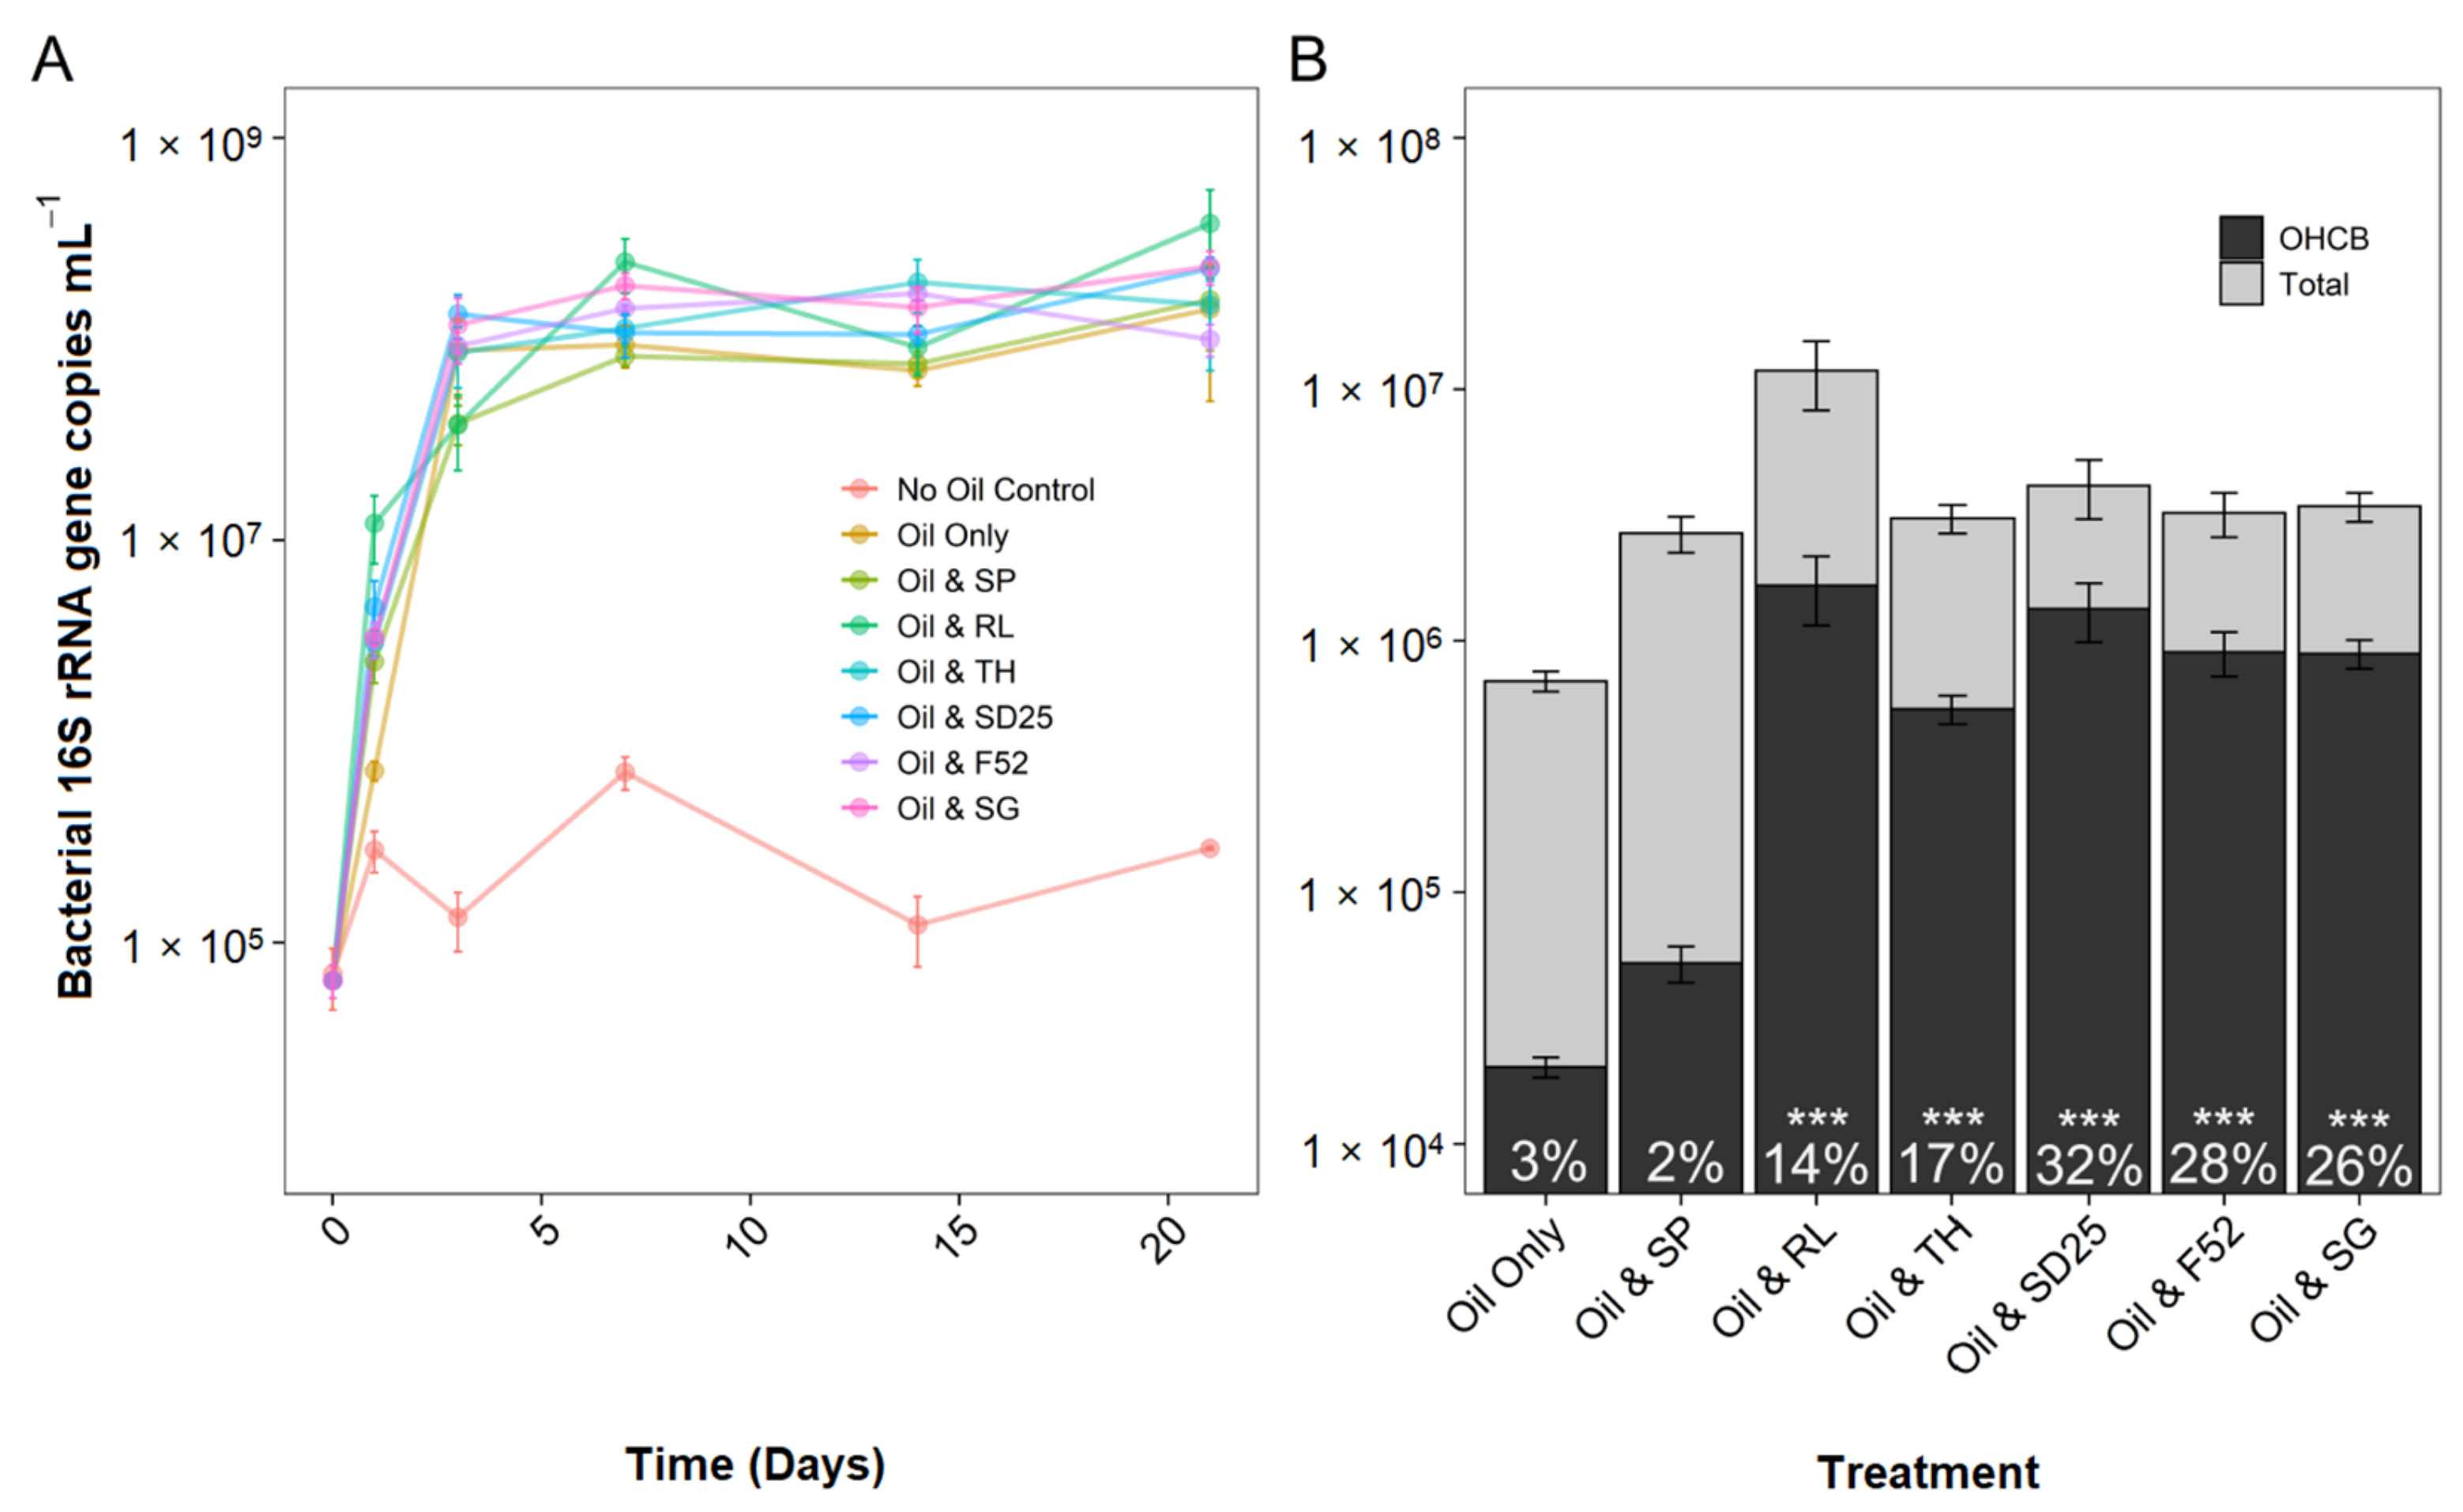
3.3. Effects of Oil and/or Dispersants/Biosurfactants on Bacterial Community Composition and Abundance
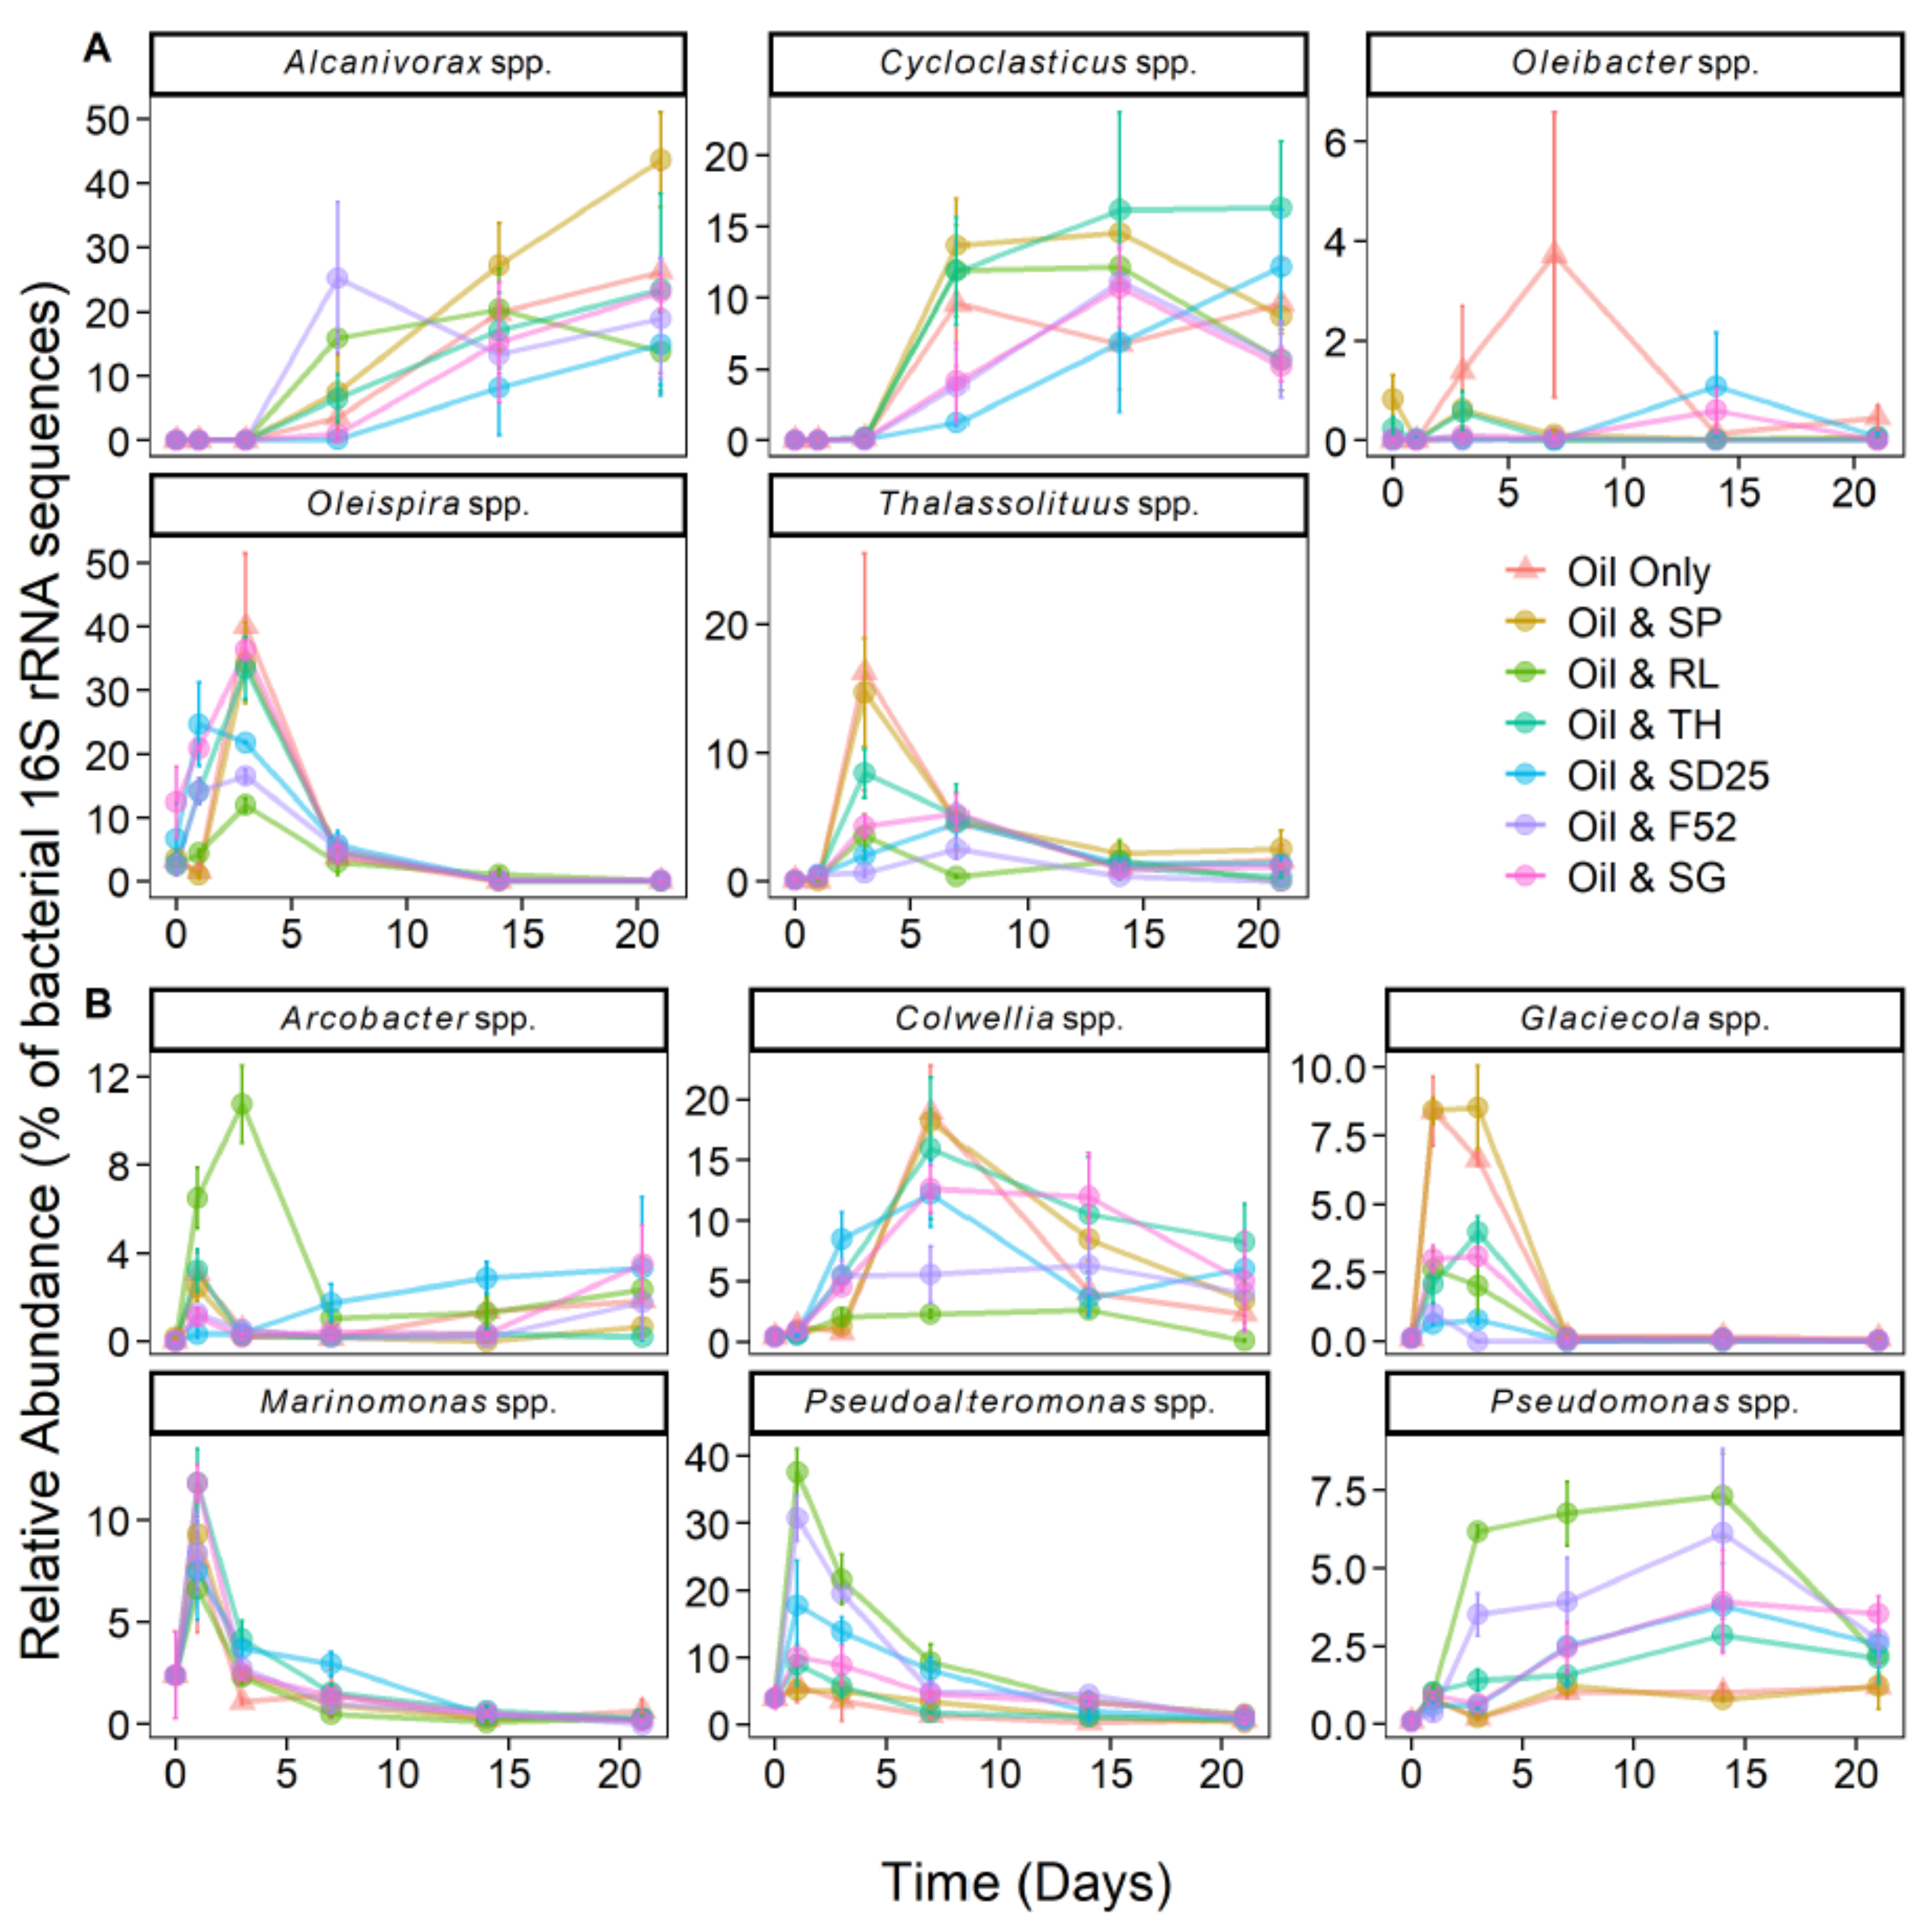
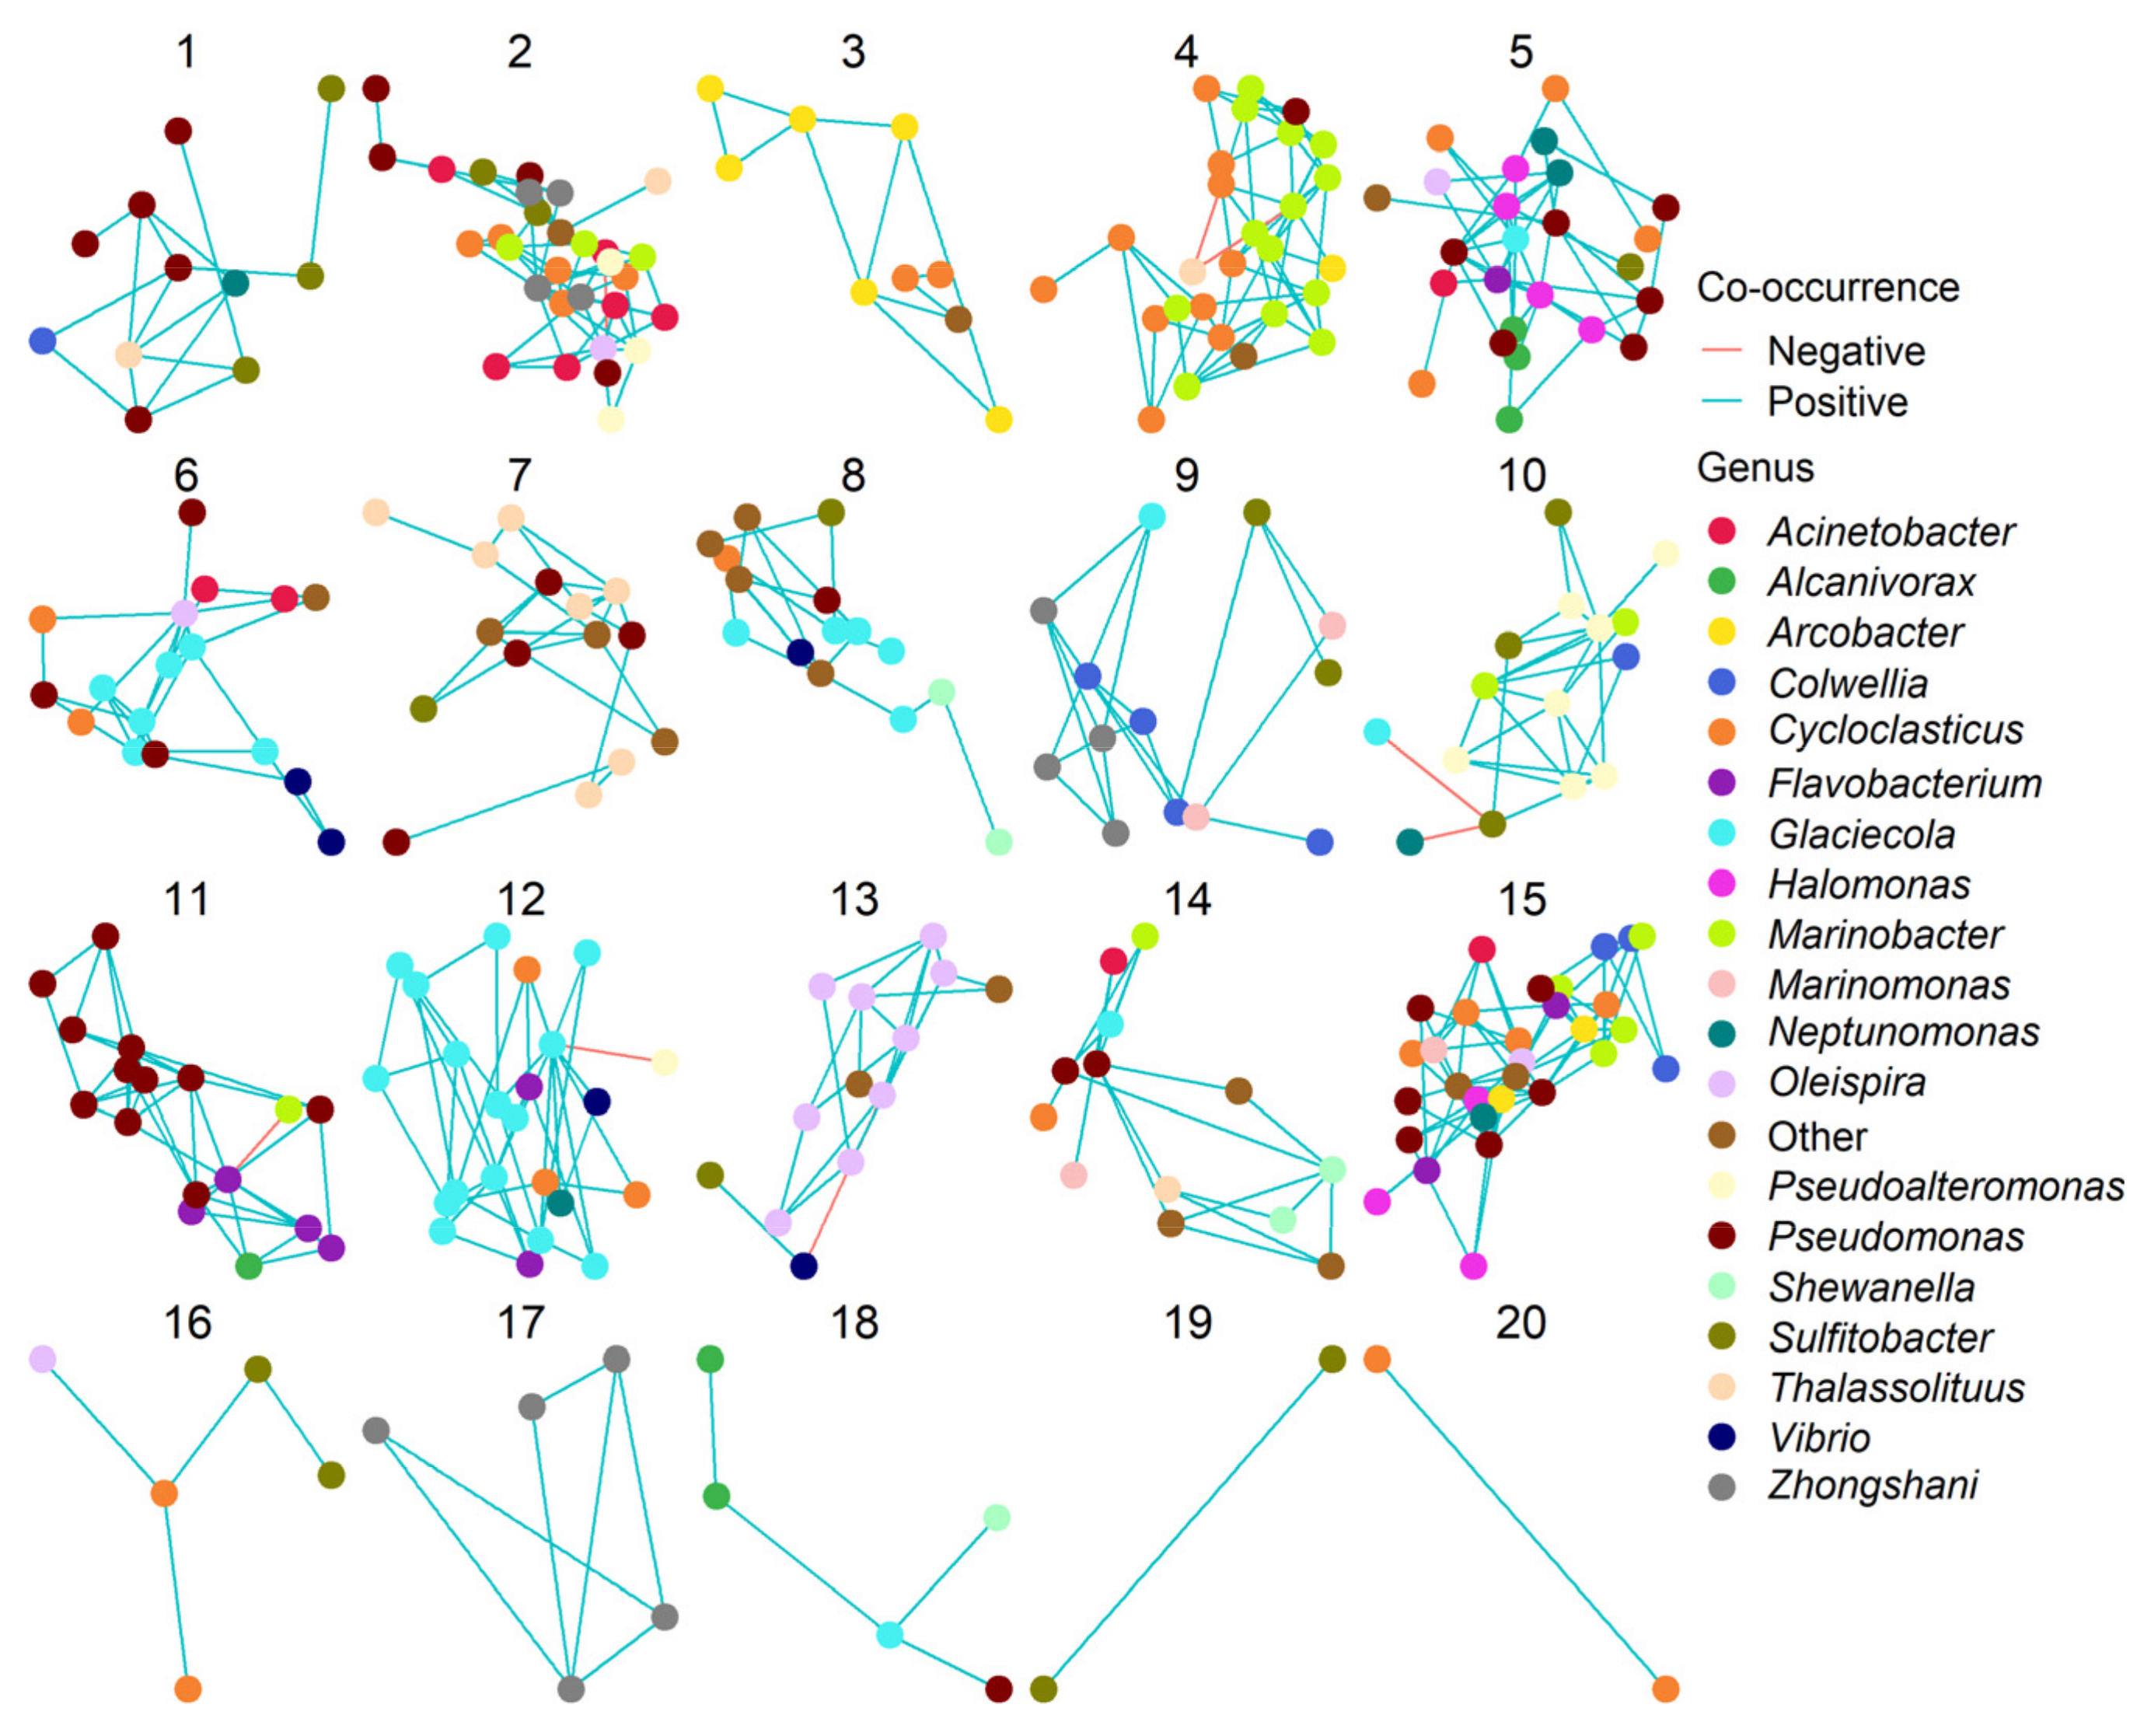
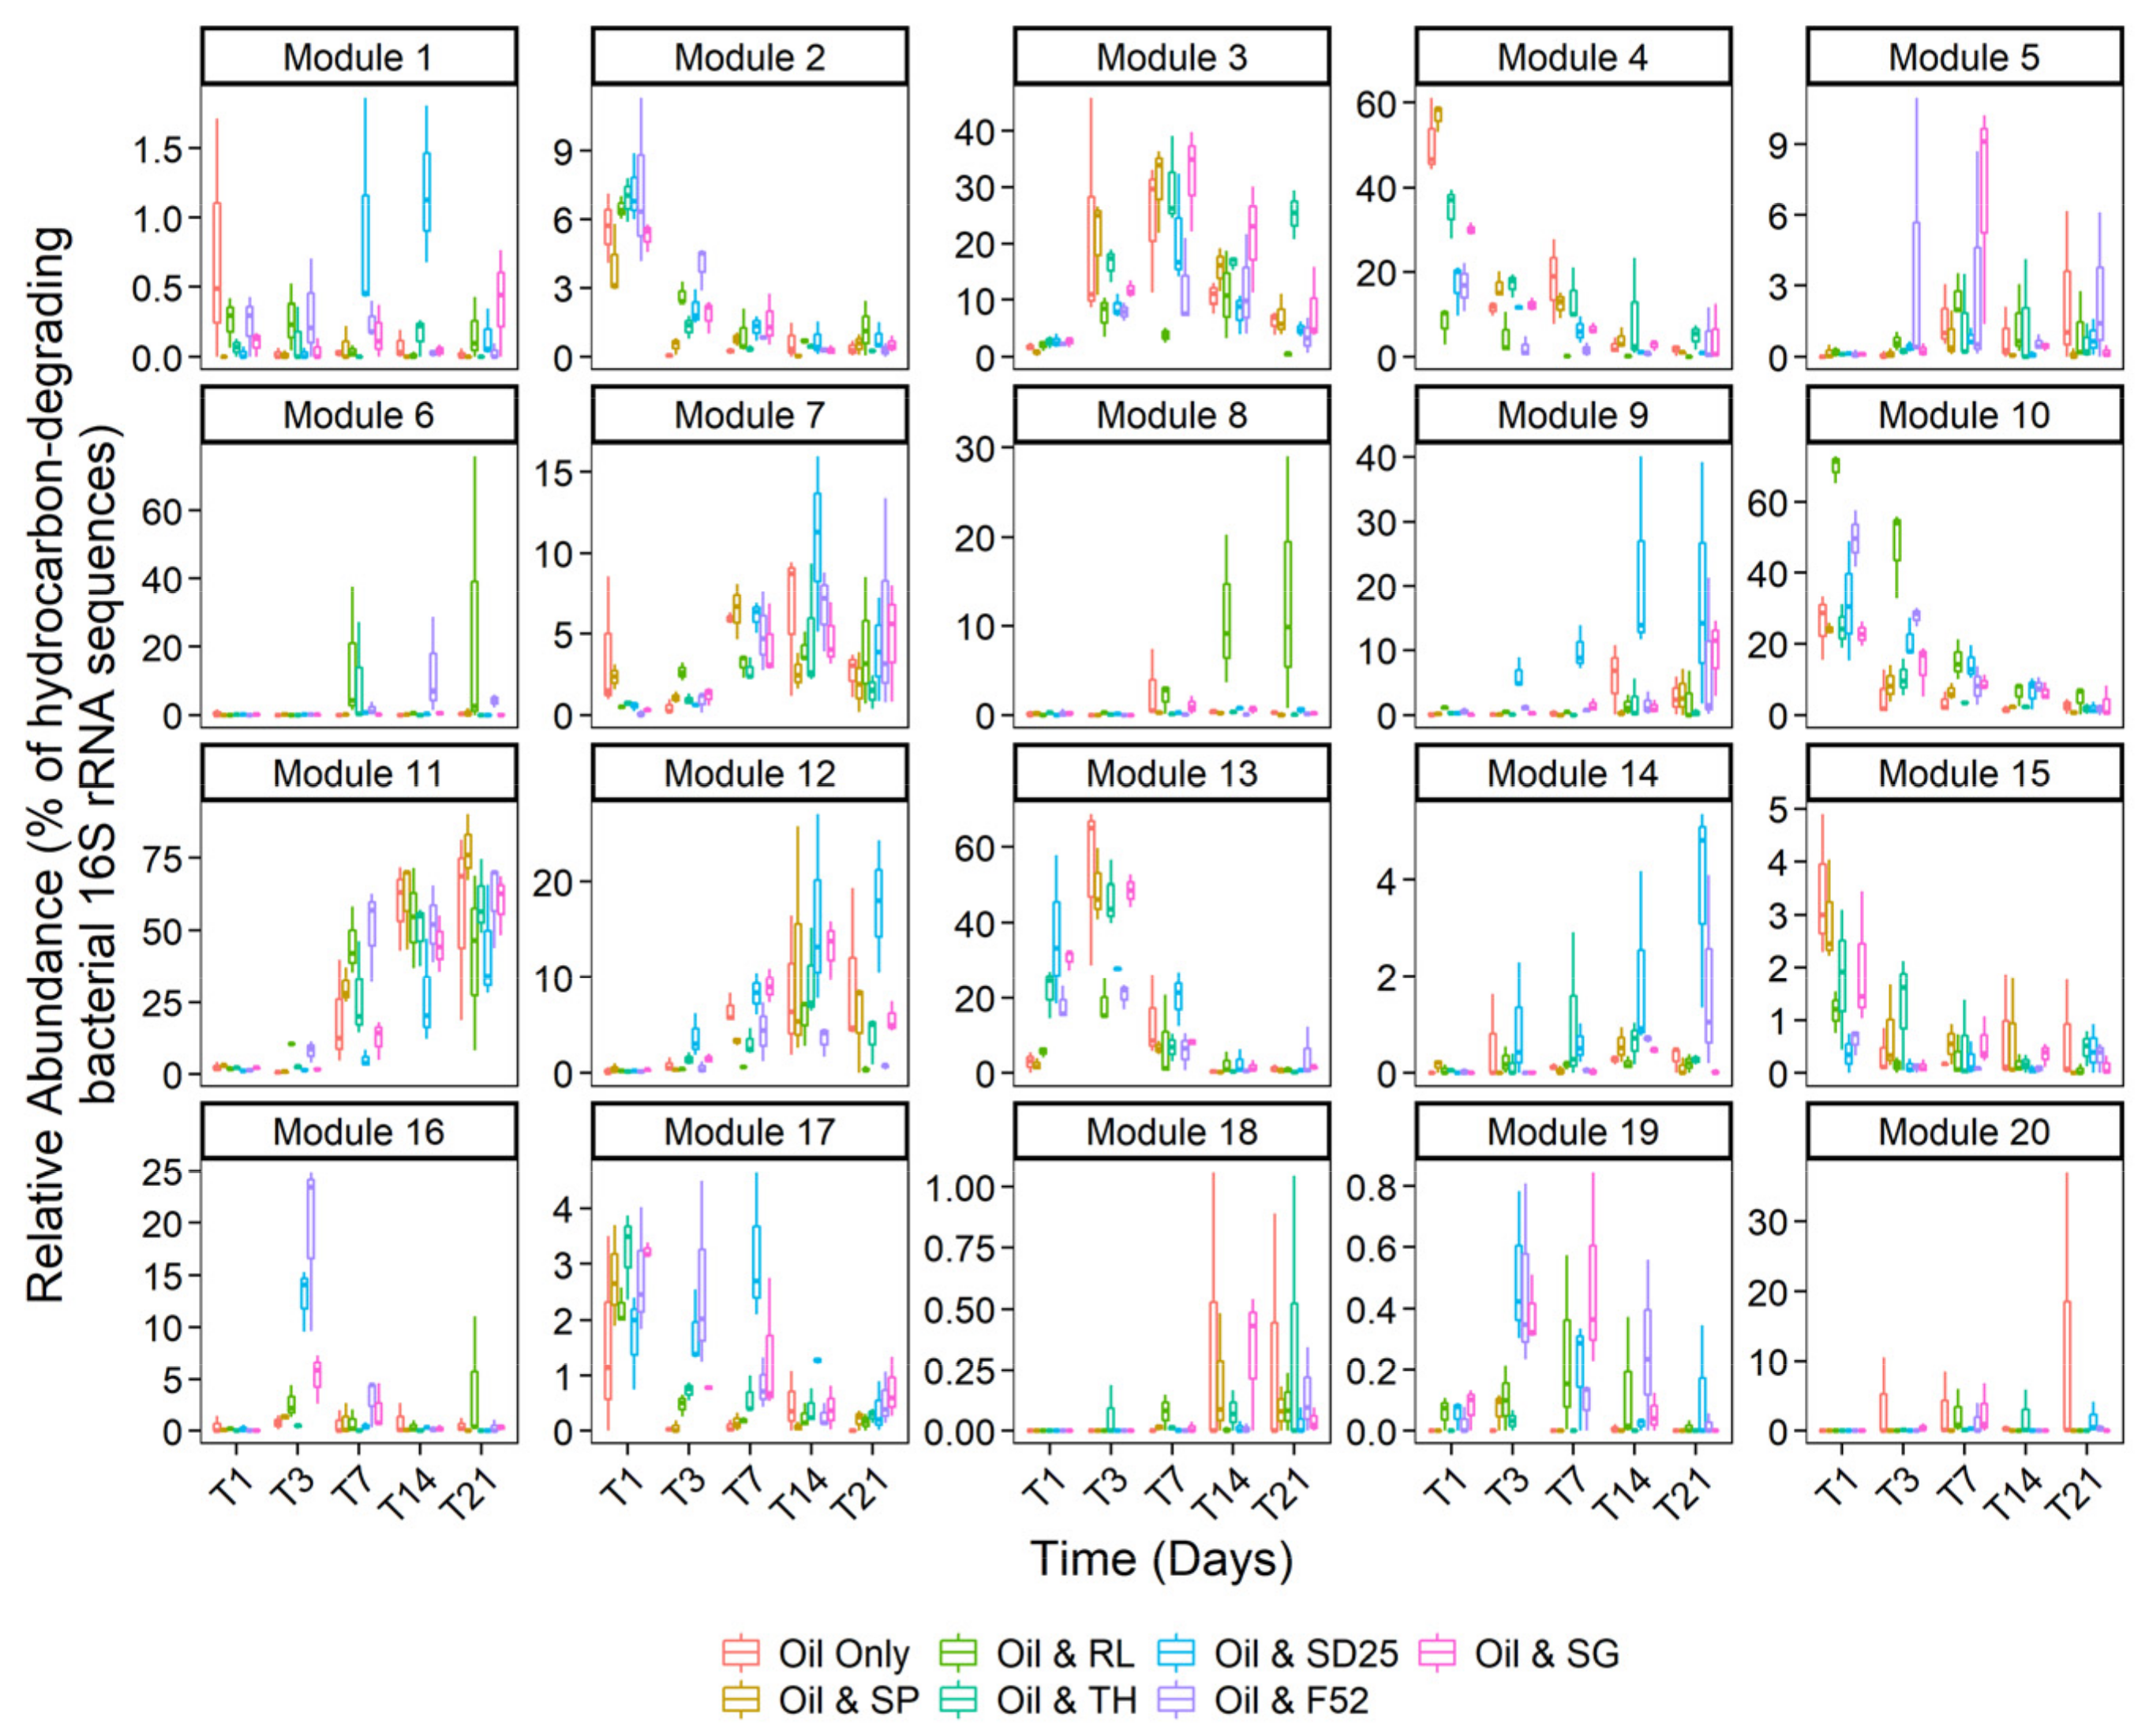
3.4. Effects of Oil and/or Dispersants/Biosurfactants on Bacterial Community Dynamics
4. Discussion
4.1. To What Extent Do Different Dispersants and Biosurfactants Enhance the Growth of Hydrocarbon-Degrading Bacteria and Accelerate Hydrocarbon Degradation?
4.2. The Psychrophilic OHCB Genus Oleispira Dominates in the First Few Days at the Relatively High Temperature of 16 °C
4.3. Does Niche Partitioning Explain the Observed OHCB Succession?
4.4. Do Dispersants or Biosurfactants Select for Specific Bacterial Genera?
4.5. Rhamnolipid Stimulates Pseudomonas Dominance—A Case of Advantageous Compatibility with Its Own Biosurfactant?
5. Conclusions
Supplementary Materials
Author Contributions
Funding
Institutional Review Board Statement
Informed Consent Statement
Data Availability Statement
Acknowledgments
Conflicts of Interest
References
- Burger, J. Oil Spills; Rutgers University Press: New Brunswick, NJ, USA, 1997; ISBN 9780813523385. [Google Scholar]
- Rystad Energy. Global Oil and Gas Discoveries Reach Four-Year High in 2019, Boosted by ExxonMobil’s Guyana Success. 2020. Available online: https://www.rystadenergy.com/newsevents/news/press-releases/global-oil-and-gas-discoveries-reach-four-year-high-in-2019/ (accessed on 18 May 2020).
- U.S. Energy Information Administration. Short-Term Energy Outlook (STEO); U.S. Energy Information Administration: Washington, DC, USA, 2020.
- ITOPF. Use of Dispersants to Treat Oil Spills; ITOPF: London, UK, 2011; Volume 4. [Google Scholar]
- Gopalan, B.; Katz, J. Turbulent shearing of crude oil mixed with dispersants generates long microthreads and microdroplets. Phys. Rev. Lett. 2010, 104. [Google Scholar] [CrossRef] [PubMed] [Green Version]
- Fingas, M. Oil Spill Dispersants: A Technical Summary. In Oil Spill Science and Technology; Gulf Professional Publishing: Houston, TX, USA, 2011; pp. 435–582. ISBN 9781856179430. [Google Scholar]
- Prince, R.C.; McFarlin, K.M.; Butler, J.D.; Febbo, E.J.; Wang, F.C.Y.; Nedwed, T. The primary biodegradation of dispersed crude oil in the sea. Chemosphere 2013, 90, 521–526. [Google Scholar] [CrossRef] [PubMed]
- Kujawinski, E.B.; Kido Soule, M.C.; Valentine, D.L.; Boysen, A.K.; Longnecker, K.; Redmond, M.C. Fate of dispersants associated with the Deepwater Horizon oil spill. Environ. Sci. Technol. 2011, 45, 1298–1306. [Google Scholar] [CrossRef] [PubMed]
- Brandvik, P.J.; Johansen, Ø.; Davies, E.J.; Leirvik, F.; Krause, D.F.; Daling, P.S.; Dunnebier, D.; Masutani, S.; Nagamine, I.; Storey, C.; et al. Subsea Dispersant Injection (SSDI)—Summary Findings from a Multi-Year Research and Development Industry Initiative. Int. Oil Spill Conf. Proc. 2017. [Google Scholar] [CrossRef]
- Atlas, R.M.; Hazen, T.C. Oil biodegradation and bioremediation: A tale of the two worst spills in U.S. history. Environ. Sci. Technol. 2011, 45, 6709–6715. [Google Scholar] [CrossRef] [Green Version]
- Hazen, T.C.; Dubinsky, E.A.; DeSantis, T.Z.; Andersen, G.L.; Piceno, Y.M.; Singh, N.; Jansson, J.K.; Probst, A.; Borglin, S.E.; Fortney, J.L.; et al. Deep-sea oil plume enriches indigenous oil-degrading bacteria. Science 2010, 330, 204–208. [Google Scholar] [CrossRef] [Green Version]
- Dubinsky, E.A.; Conrad, M.E.; Chakraborty, R.; Bill, M.; Borglin, S.E.; Hollibaugh, J.T.; Mason, O.U.M.; Piceno, Y.; Reid, F.C.; Stringfellow, W.T.; et al. Succession of hydrocarbon-degrading bacteria in the aftermath of the deepwater horizon oil spill in the gulf of Mexico. Environ. Sci. Technol. 2013, 47, 10860–10867. [Google Scholar] [CrossRef]
- Brakstad, O.G.; Ribicic, D.; Winkler, A.; Netzer, R. Biodegradation of dispersed oil in seawater is not inhibited by a commercial oil spill dispersant. Mar. Pollut. Bull. 2018, 129, 555–561. [Google Scholar] [CrossRef]
- Ribicic, D.; Netzer, R.; Winkler, A.; Brakstad, O.G. Microbial communities in seawater from an Arctic and a temperate Norwegian fjord and their potentials for biodegradation of chemically dispersed oil at low seawater temperatures. Mar. Pollut. Bull. 2018, 129, 308–317. [Google Scholar] [CrossRef]
- Prince, R.C.; Coolbaugh, T.S.; Parkerton, T.F. Oil dispersants do facilitate biodegradation of spilled oil. Proc. Natl. Acad. Sci. USA 2016, 113, E1421. [Google Scholar] [CrossRef] [Green Version]
- Brakstad, O.G.; Nordtug, T.; Throne-Holst, M. Biodegradation of dispersed Macondo oil in seawater at low temperature and different oil droplet sizes. Mar. Pollut. Bull. 2015, 93, 144–152. [Google Scholar] [CrossRef]
- Lindstrom, J.E.; Braddock, J.F. Biodegradation of petroleum hydrocarbons at low temperature in the presence of the dispersant Corexit 9500. Mar. Pollut. Bull. 2002, 44, 739–747. [Google Scholar] [CrossRef]
- Rahsepar, S.; Smit, M.P.J.; Murk, A.J.; Rijnaarts, H.H.M.; Langenhoff, A.A.M. Chemical dispersants: Oil biodegradation friend or foe? Mar. Pollut. Bull. 2016, 108, 113–119. [Google Scholar] [CrossRef]
- Hamdan, L.J.; Fulmer, P.A. Effects of COREXIT® EC9500A on bacteria from a beach oiled by the Deepwater Horizon spill. Aquat. Microb. Ecol. 2011, 63, 101–109. [Google Scholar] [CrossRef] [Green Version]
- Kleindienst, S.; Seidel, M.; Ziervogel, K.; Grim, S.; Loftis, K.; Harrison, S.; Malkin, S.Y.; Perkins, M.J.; Field, J.; Sogin, M.L.; et al. Chemical dispersants can suppress the activity of natural oil-degrading microorganisms. Proc. Natl. Acad. Sci. USA 2015, 112, 14900–14905. [Google Scholar] [CrossRef] [Green Version]
- IPIECA; IOGP. API Guidelines on Implementing Spill Impact Mitigation Assessment, SIMA; IPIECA/IOGP Oil Spill Response JIP; IPIECA: London, UK; The American Petroleum Institute: Washington, DC, USA; IOGP: London, UK, 2017. [Google Scholar]
- Kirby, M.; Neall, P.; Rooke, J.; Yardley, H. Formulation Changes in Oil Spill Dispersants: Are They Toxicologically Significant? In Oil Spill Science and Technology; Gulf Professional Publishing: Houston, TX, USA, 2011; pp. 629–642. ISBN 9781856179430. [Google Scholar]
- European Maritime Safety Agency. Manual on the Applicability of Oil Spill Dispersants—Version 2; European Maritime Safety Agency: Lisbon, Portgual, 2009. [Google Scholar]
- Chong, H.; Li, Q. Microbial production of rhamnolipids: Opportunities, challenges and strategies. Microb. Cell Fact. 2017, 16. [Google Scholar] [CrossRef] [Green Version]
- Banat, I.M.; Makkar, R.S.; Cameotra, S.S. Potential commercial applications of microbial surfactants. Appl. Microbiol. Biotechnol. 2000, 53, 495–508. [Google Scholar] [CrossRef]
- Kapellos, G.E. Microbial Strategies for Oil Biodegradation. Model. Microscale Transp. Biol. Process. 2017, 19–39. [Google Scholar] [CrossRef]
- Singh, P.; Patil, Y.; Rale, V. Biosurfactant production: Emerging trends and promising strategies. J. Appl. Microbiol. 2019, 126, 2–13. [Google Scholar] [CrossRef] [Green Version]
- Lang, S.; Wullbrandt, D. Rhamnose lipids—Biosynthesis, microbial production and application potential. Appl. Microbiol. Biotechnol. 1999, 51, 22–32. [Google Scholar] [CrossRef]
- Davila, A.M.; Marchal, R.; Vandecasteele, J.P. Sophorose lipid production from lipidic precursors: Predictive evaluation of industrial substrates. J. Ind. Microbiol. 1994, 13, 249–257. [Google Scholar] [CrossRef]
- White, D.A.; Hird, L.C.; Ali, S.T. Production and characterization of a trehalolipid biosurfactant produced by the novel marine bacterium Rhodococcus sp., strain PML026. J. Appl. Microbiol. 2013, 115, 744–755. [Google Scholar] [CrossRef]
- Banat, I.M. Biosurfactants production and possible uses in microbial enhanced oil recovery and oil pollution remediation: A review. Bioresour. Technol. 1995, 51, 1–12. [Google Scholar] [CrossRef]
- Vijayakumar, S.; Saravanan, V. Biosurfactants-types, sources and applications. Res. J. Microbiol. 2015, 10, 181–192. [Google Scholar] [CrossRef] [Green Version]
- Total-Fluides. Safety Data Sheet Finasol OSR 52; Total Fluides: Puteaux, France, 2012. [Google Scholar]
- Oil-Slick-Dispersants. Safety Data Sheet Superdispersant 25; Oil Slick Dispersants: Elvington, UK, 2015. [Google Scholar]
- DASIC-International. Slickgone NS Data Safety Sheet; DASIC-International: Hampshire, UK, 2002. [Google Scholar]
- Sambles, C.M.; White, D.A. Genome sequence of Rhodococcus sp. strain PML026, a trehalolipid biosurfactant producer and biodegrader of oil and alkanes. Genome Announc. 2015, 3. [Google Scholar] [CrossRef] [Green Version]
- ITOPF. Oil Tanker Spill Statistics 2019; ITOPF: London, UK, 2019; Volume 1. [Google Scholar]
- Little, D.I.; Little, A.E. Estuarine oil spill effects in the context of dispersant use changes. Int. Oil Spill Conf. Proc. 1991, 1, 507–518. [Google Scholar] [CrossRef]
- Gilson, D. Report on the Non-Mechanical Response for the T/V Exxon Valdez Oil Spill. 2006. Available online: https://www.pwsrcac.org/wp-content/uploads/filebase/programs/oil_spill_response_operations/Report%20on%20the%20Non-Mechanical%20Response%20for%20the%20Exxon%20Valdez%20Oil%20Spill.pdf (accessed on 18 May 2020).
- Coolbaugh, T.; Hague, E.; Cox, R.; Varghese, G. Joint Industry Sponsored Effort to Evaluate Post-Macondo Dispersant Research. Int. Oil Spill Conf. Proc. 2017. [Google Scholar] [CrossRef]
- Floch Le, S.; Dussauze, M.; François-Xavier, M.; Claireaux, G.; Theron, M.; Le Maire, P.; Nicolas-Kopec, A. DISCOBIOL: Assessment of the Impact of Dispersant Use for Oil Spill Response in Coastal or Estuarine Areas. Int. Oil Spill Conf. Proc. 2014, 2014, 491–503. [Google Scholar] [CrossRef] [Green Version]
- Gregson, B.H.; Metodieva, G.; Metodiev, M.V.; Golyshin, P.N.; McKew, B.A. Differential Protein Expression During Growth on Medium Versus Long-Chain Alkanes in the Obligate Marine Hydrocarbon-Degrading Bacterium Thalassolituus oleivorans MIL-1. Front. Microbiol. 2018, 9, 1–14. [Google Scholar] [CrossRef]
- Al-Mallah, M.; Goutx, M.; Mille, G.; Bertrand, J.C. Production of emulsifying agents during growth of a marine Alteromonas in sea water with eicosane as carbon source, a solid hydrocarbon. Oil Chem. Pollut. 1990, 6, 289–305. [Google Scholar] [CrossRef]
- Greenwood, N.; Devlin, M.J.; Best, M.; Fronkova, L.; Graves, C.; Milligan, A.; Barry, J.; van Leeuwen, S. Utilising eutrophication assessment directives from freshwater to marine systems in the Thames Estuary and Liverpool Bay, UK. Front. Mar. Sci. 2019, 6. [Google Scholar] [CrossRef]
- Coulon, F.; McKew, B.A.; Osborn, A.M.; McGenity, T.J.; Timmis, K.N. Effects of temperature and biostimulation on oil-degrading microbial communities in temperate estuarine waters. Environ. Microbiol. 2007, 9, 177–186. [Google Scholar] [CrossRef] [PubMed]
- Fingas, M. The Basics of Oil Spill Cleanup; CRC Press: Boca Raton, FL, USA, 2000. [Google Scholar]
- Lecomte Du Noüy, P. A new apparatus for measuring surface tension. J. Gen. Physiol. 1919, 1, 521–524. [Google Scholar] [CrossRef] [PubMed] [Green Version]
- Klindworth, A.; Pruesse, E.; Schweer, T.; Peplies, J.; Quast, C.; Horn, M.; Glöckner, F.O. Evaluation of general 16S ribosomal RNA gene PCR primers for classical and next-generation sequencing-based diversity studies. Nucleic Acids Res. 2013, 41, 1–11. [Google Scholar] [CrossRef]
- McKew, B.A.; Smith, C.J. Real-Time PCR Approaches for Analysis of Hydrocarbon-Degrading Bacterial Communities. In Hydrocarbon and Lipid Microbiology Protocols; McGenity, T.J., Timmis, K.N., Fernandez, B.N., Eds.; Springer Protocols Handbooks: Berlin/Heidelberg, Germany, 2015. [Google Scholar]
- R Development Core Team. R: A Language and Environment for Statistical Computing; R Foundation for Statistical Computing: Vienna, Austria, 2011; ISBN 3900051070. [Google Scholar]
- Callahan, B.J.; McMurdie, P.J.; Rosen, M.J.; Han, A.W.; Johnson, A.J.A.; Holmes, S.P. DADA2: High-resolution sample inference from Illumina amplicon data. Nat. Methods 2016, 13, 581–583. [Google Scholar] [CrossRef] [Green Version]
- Wang, Q.; Garrity, G.M.; Tiedje, J.M.; Cole, J.R. Naïve Bayesian classifier for rapid assignment of rRNA sequences into the new bacterial taxonomy. Appl. Environ. Microbiol. 2007, 73, 5261–5267. [Google Scholar] [CrossRef] [Green Version]
- Nei, M.; Saitou, N. The neighbor-joining method: A new method for reconstructing phylogenetic trees. Mol. Biol. Evol. 1987, 4, 406–425. [Google Scholar]
- Edgar, R.C. MUSCLE: Multiple sequence alignment with high accuracy and high throughput. Nucleic Acids Res. 2004, 32, 1792–1797. [Google Scholar] [CrossRef] [Green Version]
- Felsenstein, J. Confidence Limits on Phylogenies: An Approach Using the Bootstrap. Evolution 1985, 39, 783–791. [Google Scholar] [CrossRef]
- Tamura, K.; Nei, M. Estimation of the number of nucleotide substitutions in the control region of mitochondrial DNA in humans and chimpanzees. Mol. Biol. Evol. 1993, 10, 512–526. [Google Scholar] [CrossRef]
- Wang, W.; Wang, L.; Shao, Z. Diversity and Abundance of Oil-Degrading Bacteria and Alkane Hydroxylase (alkB) Genes in the Subtropical Seawater of Xiamen Island. Microb. Ecol. 2010, 60, 429–439. [Google Scholar] [CrossRef] [Green Version]
- Alzarhani, A.K.; Clark, D.R.; Underwood, G.J.C.; Ford, H.; Cotton, T.E.A.; Dumbrell, A.J. Are drivers of root-associated fungal community structure context specific? ISME J. 2019, 13, 1330–1344. [Google Scholar] [CrossRef]
- Venables, W.N.; Ripley, B.D. Modern Applied Statistics with S, 4th ed.; Springer: Berlin/Heidelberg, Germany, 2002; ISBN 0387954570. [Google Scholar]
- Lozada, M.; Marcos, M.S.; Commendatore, M.G.; Gil, M.N.; Dionisi, H.M. The Bacterial Community Structure of Hydrocarbon-Polluted Marine Environments as the Basis for the Definition of an Ecological Index of Hydrocarbon Exposure. Microbes Environ. 2014, 29, 269–276. [Google Scholar] [CrossRef] [Green Version]
- Clark, D.R. ecolFudge. Available online: https://github.com/Dave-Clark/ecolFudge (accessed on 1 October 2019).
- Kurtz, Z.D.; Müller, C.L.; Miraldi, E.R.; Littman, D.R.; Blaser, M.J.; Bonneau, R.A. Sparse and Compositionally Robust Inference of Microbial Ecological Networks. PLoS Comput. Biol. 2015, 11. [Google Scholar] [CrossRef] [Green Version]
- Becker, R.A.; Wilks, A.R.; Brownrigg, R.; Minka, T.P.; Deckmyn, A. Package “Maps”: Draw Geographical Maps; R Package Version 2.3-6. 2016. Available online: https://CRAN.R-project.org/package=maps (accessed on 18 May 2020).
- Kassambara, A. ‘ggpubr’: “ggplot2” Based Publication Ready Plots; R Package Version 0.3.0. 2020. Available online: https://CRAN.R-project.org/package=ggpubr (accessed on 18 May 2020).
- Oksanen, J.; Blanchet, F.G.; Friendly, M.; Kindt, R.; Legendre, P.; McGlinn, D.; Minchin, P.R.; O’Hara, R.B.; Simpson, G.L.; Solymos, P.; et al. Vegan: Community Ecology Package; R Package Version 2.5.6. 2019. Available online: https://CRAN.R-project.org/package=vegan (accessed on 18 May 2020).
- Auguie, B. gridExtra: Functions in Grid Graphics; R Package Version 2.3. CRAN Project 2017. Available online: https://CRAN.R-project.org/package=gridextra (accessed on 18 May 2020).
- Csardi, G.; Nepusz, T. The igraph software package for complex network research. InterJournal Complex Syst. 2006, 1695, 1–9. [Google Scholar]
- Pedersen, T.L. ggraph: An Implementation of Grammar of Graphics for Graphs and Networks; R Package Version 2.0.3. 2020. Available online: https://CRAN.R-project.org/package=ggraph (accessed on 18 May 2020).
- Wilke, C.O. ggtext: Improved Text Rendering Support for “ggplot2”; R Package Version 0.1.0. 2020. Available online: https://CRAN.R-project.org/package=ggtext (accessed on 18 May 2020).
- Hvitfeldt, E. paletteer: Comprehensive Collection of Color Palettes; R Package Version 1.2.0. 2020. Available online: https://CRAN.R-project.org/package=paletteer (accessed on 18 May 2020).
- Lenth, R. emmeans: Estimated Marginal Means, aka Least-Squares Means; R Package Version 1.4.7. Available online: https://CRAN.R-project.org/package=emmeans (accessed on 18 May 2020).
- Hope, R.M. Rmisc: Ryan Miscellaneous. 2013. Available online: https://CRAN.R-project.org/package=rmisc (accessed on 18 May 2020).
- Wilke, C.O. Cowplot: Streamlined Plot Theme and Plot Annotations for ggplot2. R Package Version 0.5.0. Available online: https://CRAN.R-project.org/package=cowplot (accessed on 18 May 2020).
- Bodenhofer, U.; Kothmeier, A.; Hochreiter, S. Apcluster: An R package for affinity propagation clustering. Bioinformatics 2011, 27, 2463–2464. [Google Scholar] [CrossRef]
- Pedersen, T.L. Patchwork: The Composer of Plots. Cran 2019. Available online: https://CRAN.R-project.org/package=patchwork (accessed on 18 May 2020).
- Yakimov, M.M.; Timmis, K.N.; Golyshin, P.N. Obligate oil-degrading marine bacteria. Curr. Opin. Biotechnol. 2007, 18, 257–266. [Google Scholar] [CrossRef]
- Radwan, S.S.; Khanafer, M.M.; Al-Awadhi, H.A. Ability of the so-called obligate hydrocarbonoclastic bacteria to utilize nonhydrocarbon substrates thus enhancing their activities despite their misleading name. BMC Microbiol. 2019, 19. [Google Scholar] [CrossRef]
- Zadjelovic, V.; Chhun, A.; Quareshy, M.; Silvano, E.; Hernandez-Fernaud, J.R.; Aguilo-Ferretjans, M.M.; Bosch, R.; Dorador, C.; Gibson, M.I.; Christie-Oleza, J.A. Beyond oil degradation: Enzymatic potential of Alcanivorax to degrade natural and synthetic polyesters. Environ. Microbiol. 2020, 22, 1356–1369. [Google Scholar] [CrossRef] [Green Version]
- Maier, G.; Nimmo-Smith, R.J.; Glegg, G.A.; Tappin, A.D.; Worsfold, P.J. Estuarine eutrophication in the UK: Current incidence and future trends. Aquat. Conserv. Mar. Freshw. Ecosyst. 2009, 19, 43–56. [Google Scholar] [CrossRef]
- Wrenn, B.A.; Haines, J.R.; Venosa, A.D.; Kadkhodayan, M.; Suidan, M.T. Effects of nitrogen source on crude oil biodegradation. J. Ind. Microbiol. 1994, 13, 279–286. [Google Scholar] [CrossRef]
- Li, Z.; Lee, K.; King, T.; Boufadel, M.C.; Venosa, A.D. Assessment of chemical dispersant effectiveness in a wave tank under regular non-breaking and breaking wave conditions. Mar. Pollut. Bull. 2008, 56, 903–912. [Google Scholar] [CrossRef]
- Brakstad, O.G.; Daling, P.S.; Faksness, L.G.; Almås, I.K.; Vang, S.H.; Syslak, L.; Leirvik, F. Depletion and biodegradation of hydrocarbons in dispersions and emulsions of the Macondo 252 oil generated in an oil-on-seawater mesocosm flume basin. Mar. Pollut. Bull. 2014, 84, 125–134. [Google Scholar] [CrossRef]
- North, E.W.; Adams, E.E.; Thessen, A.E.; Schlag, Z.; He, R.; Socolofsky, S.A.; Masutani, S.M.; Peckham, S.D. The influence of droplet size and biodegradation on the transport of subsurface oil droplets during the Deepwater Horizon spill: A model sensitivity study. Environ. Res. Lett. 2015, 10. [Google Scholar] [CrossRef]
- Prince, R.C.; Nash, G.W.; Hill, S.J. The biodegradation of crude oil in the deep ocean. Mar. Pollut. Bull. 2016, 111, 354–357. [Google Scholar] [CrossRef]
- Head, I.M.; Jones, D.M.; Röling, W.F.M. Marine microorganisms make a meal of oil. Nat. Rev. Microbiol. 2006, 4, 173–182. [Google Scholar] [CrossRef]
- Bejarano, A.C.; Levine, E.; Mearns, A.J. Effectiveness and potential ecological effects of offshore surface dispersant use during the Deepwater Horizon oil spill: A retrospective analysis of monitoring data. Environ. Monit. Assess. 2013, 185, 10281–10295. [Google Scholar] [CrossRef]
- Lee, K.; Nedwed, T.; Prince, R.C.; Palandro, D. Lab tests on the biodegradation of chemically dispersed oil should consider the rapid dilution that occurs at sea. Mar. Pollut. Bull. 2013, 73, 314–318. [Google Scholar] [CrossRef] [PubMed]
- Nedwed, T.; Coolbaugh, T. Do basins and beakers negatively bias dispersant-effectiveness tests? Int. Oil Spill Conf. Proc. 2008, 2008, 835–842. [Google Scholar] [CrossRef]
- Banat, I.M.; Satpute, S.K.; Cameotra, S.S.; Patil, R.; Nyayanit, N.V. Cost effective technologies and renewable substrates for biosurfactants’ production. Front. Microbiol. 2014, 5, 1–18. [Google Scholar] [CrossRef] [PubMed] [Green Version]
- Varjani, S.J.; Upasani, V.N. Critical review on biosurfactant analysis, purification and characterization using rhamnolipid as a model biosurfactant. Bioresour. Technol. 2017, 232, 389–397. [Google Scholar] [CrossRef]
- Norman, R.S.; Frontera-Suau, R.; Morris, P.J. Variability in Pseudomonas aeruginosa lipopolysaccharide expression during crude oil degradation. Appl. Environ. Microbiol. 2002, 68, 5096–5103. [Google Scholar] [CrossRef] [Green Version]
- Kang, S.W.; Kim, Y.B.; Shin, J.D.; Kim, E.K. Enhanced biodegradation of hydrocarbons in soil by microbial biosurfactant, sophorolipid. Appl. Biochem. Biotechnol. 2010, 160, 780–790. [Google Scholar] [CrossRef]
- Ashby, R.D.; Solaiman, D.K.Y.; Foglia, T.A. Property control of sophorolipids: Influence of fatty acid substrate and blending. Biotechnol. Lett. 2008, 30, 1093–1100. [Google Scholar] [CrossRef]
- Daverey, A.; Pakshirajan, K. Sophorolipids from Candida bombicola using mixed hydrophilic substrates: Production, purification and characterization. Colloids Surf. B Biointerfaces 2010, 79, 246–253. [Google Scholar] [CrossRef]
- Gregson, B.H.; Metodieva, G.; Metodiev, M.V.; Golyshin, P.N.; McKew, B.A. Protein expression in the obligate hydrocarbon-degrading psychrophile Oleispira antarctica RB-8 during alkane degradation and cold tolerance. Environ. Microbiol. 2020, 22, 1870–1883. [Google Scholar] [CrossRef] [Green Version]
- King, G.M.; Kostka, J.E.; Hazen, T.C.; Sobecky, P.A. Microbial Responses to the Deepwater Horizon Oil Spill: From Coastal Wetlands to the Deep Sea. Ann. Rev. Mar. Sci. 2015, 7, 377–401. [Google Scholar] [CrossRef] [Green Version]
- Brakstad, O.G.; Størseth, T.R.; Brunsvik, A.; Bonaunet, K.; Faksness, L.G. Biodegradation of oil spill dispersant surfactants in cold seawater. Chemosphere 2018, 204, 290–293. [Google Scholar] [CrossRef]
- Krolicka, A.; Boccadoro, C.; Mæland, M.; Preston, C.; Birch, J.; Scholin, C.; Baussant, T. Detection of oil leaks by quantifying hydrocarbonoclastic bacteria in cold marine environments using the Environmental Sample Processor. In Proceedings of the 37th AMOP Technical Seminar on Environmental Contamination and Response, Canmore, AB, Canada, 3–5 June 2014; pp. 791–807. [Google Scholar]
- Röling, W.F.M.; Milner, M.G.; Jones, D.M.; Lee, K.; Daniel, F.; Swannell, R.J.P.; Head, I.M. Robust hydrocarbon degradation and dynamics of bacterial communities during nutrient-enhanced oil spill bioremediation. Appl. Environ. Microbiol. 2002, 68, 5537–5548. [Google Scholar] [CrossRef] [Green Version]
- Garneau, M.É.; Michel, C.; Meisterhans, G.; Fortin, N.; King, T.L.; Greer, C.W.; Lee, K. Hydrocarbon biodegradation by Arctic sea-ice and sub-ice microbial communities during microcosm experiments, Northwest Passage (Nunavut, Canada). FEMS Microbiol. Ecol. 2016, 92. [Google Scholar] [CrossRef] [Green Version]
- Yakimov, M.M.; Giuliano, L.; Denaro, R.; Crisafi, E.; Chernikova, T.N.; Abraham, W.R.; Luensdorf, H.; Timmis, K.N.; Golyshin, P.N. Thalassolituus oleivorans gen. nov., sp. nov., a novel marine bacterium that obligately utilizes hydrocarbons. Int. J. Syst. Evol. Microbiol. 2004, 54, 141–148. [Google Scholar] [CrossRef] [PubMed]
- Yakimov, M.M.; Golyshin, P.N.; Lang, S.; Moore, E.R.B.; Abraham, W.R.; Lünsdorf, H.; Timmis, K.N. Alcanivorax borkumensis gen. nov., sp. nov., a new, hydrocarbon- degrading and surfactant-producing marine bacterium. Int. J. Syst. Bacteriol. 1998, 48, 339–348. [Google Scholar] [CrossRef] [PubMed] [Green Version]
- Schneiker, S.; Dos Santos, V.A.P.M.; Bartels, D.; Bekel, T.; Brecht, M.; Buhrmester, J.; Chernikova, T.N.; Denaro, R.; Ferrer, M.; Gertler, C.; et al. Genome sequence of the ubiquitous hydrocarbon-degrading marine bacterium Alcanivorax borkumensis. Nat. Biotechnol. 2006, 24, 997–1004. [Google Scholar] [CrossRef] [PubMed] [Green Version]
- Gregson, B.H.; Metodieva, G.; Metodiev, M.V.; McKew, B.A. Differential protein expression during growth on linear versus branched alkanes in the obligate marine hydrocarbon-degrading bacterium Alcanivorax borkumensis SK2T. Environ. Microbiol. 2019, 21, 2347–2359. [Google Scholar] [CrossRef] [Green Version]
- Cappello, S.; Yakimov, M. Alcanivorax. In Handbook of Hydrocarbon and Lipid Microbiology; McGenity, T.J., Ed.; Springer-Verlag: Berlin/Heidelberg, Germany, 2010; pp. 1737–1748. [Google Scholar]
- Dyksterhouse, S.E.; Gray, J.P.; Herwig, R.P.; Lara, J.C.; Staley, J.T. Cycloclasticus pugetii gen. nov., sp. nov., an Aromatic hydrocarbon- degrading bacterium from marine sediments. Int. J. Syst. Bacteriol. 1995, 45, 116–123. [Google Scholar] [CrossRef] [Green Version]
- Wang, Y.; Lau, P.C.K.; Button, D.K. A marine oligobacterium harboring genes known to be part of aromatic hydrocarbon degradation pathways of soil pseudomonads. Appl. Environ. Microbiol. 1996, 62, 2169–2173. [Google Scholar] [CrossRef] [Green Version]
- Röling, W.F.M.; Van Bodegom, P.M. Toward quantitative understanding on microbial community structure and functioning: A modeling-centered approach using degradation of marine oil spills as example. Front. Microbiol. 2014, 5, 1–12. [Google Scholar] [CrossRef]
- McGenity, T.J.; Folwell, B.D.; McKew, B.A.; Sanni, G.O. Marine crude-oil biodegradation: A central role for interspecies interactions. Aquat. Biosyst. 2012, 8, 1–19. [Google Scholar] [CrossRef] [Green Version]
- Cappello, S.; Caruso, G.; Zampino, D.; Monticelli, L.S.; Maimone, G.; Denaro, R.; Tripodo, B.; Troussellier, M.; Yakimov, M.; Giuliano, L. Microbial community dynamics during assays of harbour oil spill bioremediation: A microscale simulation study. J. Appl. Microbiol. 2007, 102, 184–194. [Google Scholar] [CrossRef]
- McKew, B.A.; Coulon, F.; Yakimov, M.M.; Denaro, R.; Genovese, M.; Smith, C.J.; Osborn, A.M.; Timmis, K.N.; McGenity, T.J. Efficacy of intervention strategies for bioremediation of crude oil in marine systems and effects on indigenous hydrocarbonoclastic bacteria. Environ. Microbiol. 2007, 9, 1562–1571. [Google Scholar] [CrossRef]
- Noh, J.; Kim, H.; Lee, C.; Yoon, S.J.; Chu, S.; Kwon, B.O.; Ryu, J.; Kim, J.J.; Lee, H.; Yim, U.H.; et al. Bioaccumulation of Polycyclic Aromatic Hydrocarbons (PAHs) by the Marine Clam, Mactra veneriformis, Chronically Exposed to Oil-Suspended Particulate Matter Aggregates. Environ. Sci. Technol. 2018, 52, 7910–7920. [Google Scholar] [CrossRef]
- Dombrowski, N.; Donaho, J.A.; Gutierrez, T.; Seitz, K.W.; Teske, A.P.; Baker, B.J. Reconstructing metabolic pathways of hydrocarbon-degrading bacteria from the Deepwater Horizon oil spill. Nat. Microbiol. 2016, 1, 1–7. [Google Scholar] [CrossRef]
- Suja, L.D.; Summers, S.; Gutierrez, T. Role of EPS, dispersant and nutrients on the microbial response and MOS formation in the subarctic Northeast Atlantic. Front. Microbiol. 2017, 8, 1–15. [Google Scholar] [CrossRef] [Green Version]
- Naysim, L.O.; Kang, H.J.; Jeon, C.O. Zhongshania aliphaticivorans sp. nov., an aliphatic hydrocarbon-degrading bacterium isolated from marine sediment, And transfer of Spongiibacter borealis Jang et al. 2011 to the genus Zhongshania as Zhongshania borealis comb. nov. Int. J. Syst. Evol. Microbiol. 2014, 64, 3768–3774. [Google Scholar] [CrossRef] [Green Version]
- Ribicic, D.; Netzer, R.; Hazen, T.C.; Techtmann, S.M.; Drabløs, F.; Brakstad, O.G. Microbial community and metagenome dynamics during biodegradation of dispersed oil reveals potential key-players in cold Norwegian seawater. Mar. Pollut. Bull. 2018, 129, 370–378. [Google Scholar] [CrossRef] [Green Version]
- Hubert, C.R.J.; Oldenburg, T.B.P.; Fustic, M.; Gray, N.D.; Larter, S.R.; Penn, K.; Rowan, A.K.; Seshadri, R.; Sherry, A.; Swainsbury, R.; et al. Massive dominance of Epsilonproteobacteria in formation waters from a Canadian oil sands reservoir containing severely biodegraded oil. Environ. Microbiol. 2012, 14, 387–404. [Google Scholar] [CrossRef] [Green Version]
- Chronopoulou, P.M.; Sanni, G.O.; Silas-Olu, D.I.; van der Meer, J.R.; Timmis, K.N.; Brussaard, C.P.D.; McGenity, T.J. Generalist hydrocarbon-degrading bacterial communities in the oil-polluted water column of the North Sea. Microb. Biotechnol. 2015, 8, 434–447. [Google Scholar] [CrossRef] [Green Version]
- Barnsley, E.A. Naphthalene metabolism by pseudomonads: The oxidation of 1,2-dihydroxynaphthalene to 2-hydroxychromene-2-carboxylic acid and the formation of 2′-hydroxybenzalpyruvate. Biochem. Biophys. Res. Commun. 1976, 72, 1116–1121. [Google Scholar] [CrossRef]
- Varjani, S.J.; Upasani, V.N. Biodegradation of petroleum hydrocarbons by oleophilic strain of Pseudomonas aeruginosa NCIM 5514. Bioresour. Technol. 2016, 222, 195–201. [Google Scholar] [CrossRef]
- Ramya, C.; Lakshmi, R.; Asha, D.; Sivamurugan, V.; Vasudevan, V.; Krishnan, M. Demonstration of bioprocess factors optimization for enhanced mono-rhamnolipid production by a marine Pseudomonas guguanensis. Int. J. Biol. Macromol. 2018, 108, 531–540. [Google Scholar] [CrossRef]
- Geys, R.; Soetaert, W.; Van Bogaert, I. Biotechnological opportunities in biosurfactant production. Curr. Opin. Biotechnol. 2014, 30, 66–72. [Google Scholar] [CrossRef] [PubMed]
- Zhang, G.; Wu, Y.; Qian, X.; Meng, Q. Biodegradation of crude oil by Pseudomonas aeruginosa in the presence of rhamnolipids. J. Zhejiang Univ. Sci. 2005, 6B, 725–730. [Google Scholar] [CrossRef] [PubMed] [Green Version]
- Caiazza, N.C.; Shanks, R.M.Q.; O’Toole, G.A. Rhamnolipids modulate swarming motility patterns of Pseudomonas aeruginosa. J. Bacteriol. 2005, 187, 7351–7361. [Google Scholar] [CrossRef] [PubMed] [Green Version]
- Chrzanowski, Ł.; Ławniczak, Ł.; Czaczyk, K. Why do microorganisms produce rhamnolipids? World J. Microbiol. Biotechnol. 2012, 28, 401–419. [Google Scholar] [CrossRef] [Green Version]
- Ibrar, M.; Zhang, H. Construction of a hydrocarbon-degrading consortium and characterization of two new lipopeptides biosurfactants. Sci. Total Environ. 2020, 714. [Google Scholar] [CrossRef]
- Marx, R.B.; Aitken, M.D. Bacterial chemotaxis enhances naphthalene degradation in a heterogeneous aqueous system. Environ. Sci. Technol. 2000, 34, 3379–3383. [Google Scholar] [CrossRef]
- Krell, T.; Lacal, J.; Reyes-Darias, J.A.; Jimenez-Sanchez, C.; Sungthong, R.; Ortega-Calvo, J.J. Bioavailability of pollutants and chemotaxis. Curr. Opin. Biotechnol. 2013, 24, 451–456. [Google Scholar] [CrossRef] [Green Version]
- Haba, E.; Pinazo, A.; Jauregui, O.; Espuny, M.J.; Infante, M.R.; Manresa, A. Physicochemical characterization and antimicrobial properties of rhamnolipids produced by Pseudomonas aeruginosa 47T2 NCBIM 40044. Biotechnol. Bioeng. 2003, 81, 316–322. [Google Scholar] [CrossRef] [Green Version]
- Kearns, D.B. A field guide to bacterial swarming motility. Nat. Rev. Microbiol. 2010, 8, 634–644. [Google Scholar] [CrossRef] [Green Version]


Publisher’s Note: MDPI stays neutral with regard to jurisdictional claims in published maps and institutional affiliations. |
© 2021 by the authors. Licensee MDPI, Basel, Switzerland. This article is an open access article distributed under the terms and conditions of the Creative Commons Attribution (CC BY) license (https://creativecommons.org/licenses/by/4.0/).
Share and Cite
Thomas, G.E.; Brant, J.L.; Campo, P.; Clark, D.R.; Coulon, F.; Gregson, B.H.; McGenity, T.J.; McKew, B.A. Effects of Dispersants and Biosurfactants on Crude-Oil Biodegradation and Bacterial Community Succession. Microorganisms 2021, 9, 1200. https://0-doi-org.brum.beds.ac.uk/10.3390/microorganisms9061200
Thomas GE, Brant JL, Campo P, Clark DR, Coulon F, Gregson BH, McGenity TJ, McKew BA. Effects of Dispersants and Biosurfactants on Crude-Oil Biodegradation and Bacterial Community Succession. Microorganisms. 2021; 9(6):1200. https://0-doi-org.brum.beds.ac.uk/10.3390/microorganisms9061200
Chicago/Turabian StyleThomas, Gareth E., Jan L. Brant, Pablo Campo, Dave R. Clark, Frederic Coulon, Benjamin H. Gregson, Terry J. McGenity, and Boyd A. McKew. 2021. "Effects of Dispersants and Biosurfactants on Crude-Oil Biodegradation and Bacterial Community Succession" Microorganisms 9, no. 6: 1200. https://0-doi-org.brum.beds.ac.uk/10.3390/microorganisms9061200