Article

Detection of Interactions between Proteins by Using Legendre Moments Descriptor to Extract Discriminatory Information Embedded in PSSM

1
Xinjiang Technical Institutes of Physics and Chemistry, Chinese Academy of Science, Urumqi 830011, China
2
University of Chinese Academy of Sciences, Beijing 100049, China
3
Department of Computing, Hong Kong Polytechnic University, Hong Kong, China
*
Authors to whom correspondence should be addressed.
These authors contributed equally to this work.
Submission received: 24 July 2017 / Accepted: 15 August 2017 / Published: 18 August 2017
(This article belongs to the Special Issue Computational Analysis for Protein Structure and Interaction)

Abstract

:
Protein-protein interactions (PPIs) play a very large part in most cellular processes. Although a great deal of research has been devoted to detecting PPIs through high-throughput technologies, these methods are clearly expensive and cumbersome. Compared with the traditional experimental methods, computational methods have attracted much attention because of their good performance in detecting PPIs. In our work, a novel computational method named as PCVM-LM is proposed which combines the probabilistic classification vector machine (PCVM) model and Legendre moments (LMs) to predict PPIs from amino acid sequences. The improvement mainly comes from using the LMs to extract discriminatory information embedded in the position-specific scoring matrix (PSSM) combined with the PCVM classifier to implement prediction. The proposed method was evaluated on Yeast and Helicobacter pylori datasets with five-fold cross-validation experiments. The experimental results show that the proposed method achieves high average accuracies of 96.37% and 93.48%, respectively, which are much better than other well-known methods. To further evaluate the proposed method, we also compared the proposed method with the state-of-the-art support vector machine (SVM) classifier and other existing methods on the same datasets. The comparison results clearly show that our method is better than the SVM-based method and other existing methods. The promising experimental results show the reliability and effectiveness of the proposed method, which can be a useful decision support tool for protein research.

1. Introduction

Proteins are a necessary component of the organism and are involved in almost all cellular activity in the organism. Protein-protein interactions (PPIs) play a very large part in most cellular processes. Studying protein interactions can provide insights into more biological processes, thereby better understanding the mechanisms of disease and developing disease-specific drugs. Hence, detection of the interactions of proteins has gradually become more important. In recent years, many high-throughput technologies have been designed for predicting PPIs, such as protein chips [1], immunoprecipitation [2,3], and yeast two-hybrid screening methods [4,5]. However, these methods are costly and time consuming. In addition, the above methods usually have high false positive rates and false negative prediction rates when dealing with large-scale experiments. Therefore, the development of reliable computational methods has important practical significance in promoting protein-protein interaction identification.
A number of computational methods have been proposed to detect PPIs based on different data types, such as phylogenetic profiles [6,7], literature mining knowledge [8], gene neighborhood [9,10], gene fusion [11,12], and sequence conservation [13,14]. However, these methods cannot work if the prior knowledge of a proteins is not available. Thanks to the rapid growth of protein sequence data, advances in computational methods for detecting PPIs have been promoted. Thus, many protein sequence-based approach have been proposed to identify PPIs. For example, Bock et al. [15] proposed a method that combined an SVM classifier with several physiochemical and structural descriptors to predict PPIs. Shen et al. developed a method based on SVM classifier and a conjoint triad feature extraction method. Chou et al. [16] introduced an approach named GO-PseAA to predicted PPIs that combined the method of pseudo-amino acid composition with the gene ontology. You et al. [17] present here a hierarchical model called PCA-EELM to predict PPIs only using the protein sequences. Several other methods have been reported in previous works, but there is still room for improving the accuracy and efficiency of PPI prediction [17,18,19,20,21,22,23,24,25,26,27,28,29,30].
In this paper, a novel sequence-based computational method was proposed for identifying PPIs that combines the probabilistic classification vector machine (PCVM) model with a novel protein sequence feature extraction scheme. More specifically, each amino acid sequence was represented as a position specific scoring matrix (PSSM) corresponding to physicochemical properties. Then, the Legendre moments (LMs) descriptor is applied to extract features from the PSSM that contain useful descriptive information. In addition, the principal component analysis (PCA) was used to reduce the influence of noise and feature dimensions. Finally, the probabilistic classification vector machine model was employed to detect PPIs. To assess the feasibility and effectiveness of the PCVM method, our proposed approach was implemented on two datasets, Yeast and Helicobacter pylori. The results show that the proposed method achieves satisfactory average accuracies of 96.37%, 93.48% respectively. To further validate the capabilities of our proposed approach, cross-species experiments were conducted on four separate datasets Mix_Celeg, Mix_Ecoli, Mix_Hsapi, and Mix_Mmusc. We also obtained good prediction accuracy in the cross-species experiments. In order to comprehensively evaluate the performance of the proposed method, we evaluated the PCVM classifier by comparing with the state-of-the-art support vector machine (SVM) classifier and other existing methods on the same dataset. The comparison results show that our method outperforms SVM and other previous methods.

2. Materials and Methodology

2.1. Godden Standard Datasets

We validate the proposed method on yeast and human datasets, which are collected from publicly-available interacting protein databases (DIP) [31]. In order to evaluate the proposed method accurately, we implemented a data preprocessing program to remove protein pairs with too high homologies and too few residues. As a result, we selected 5594 positive protein pairs for constructing positive datasets and 5594 negative protein pairs for constructing negative datasets from the Yeast dataset. Similarly, we selected 1458 protein pairs for constructing positive datasets and 1458 protein pairs for constructing negative datasets from the H. pylori dataset. Thus, the Yeast dataset contains a total of 11,188 protein pairs, and the H. pylori dataset contains a total of 2916 protein pairs.

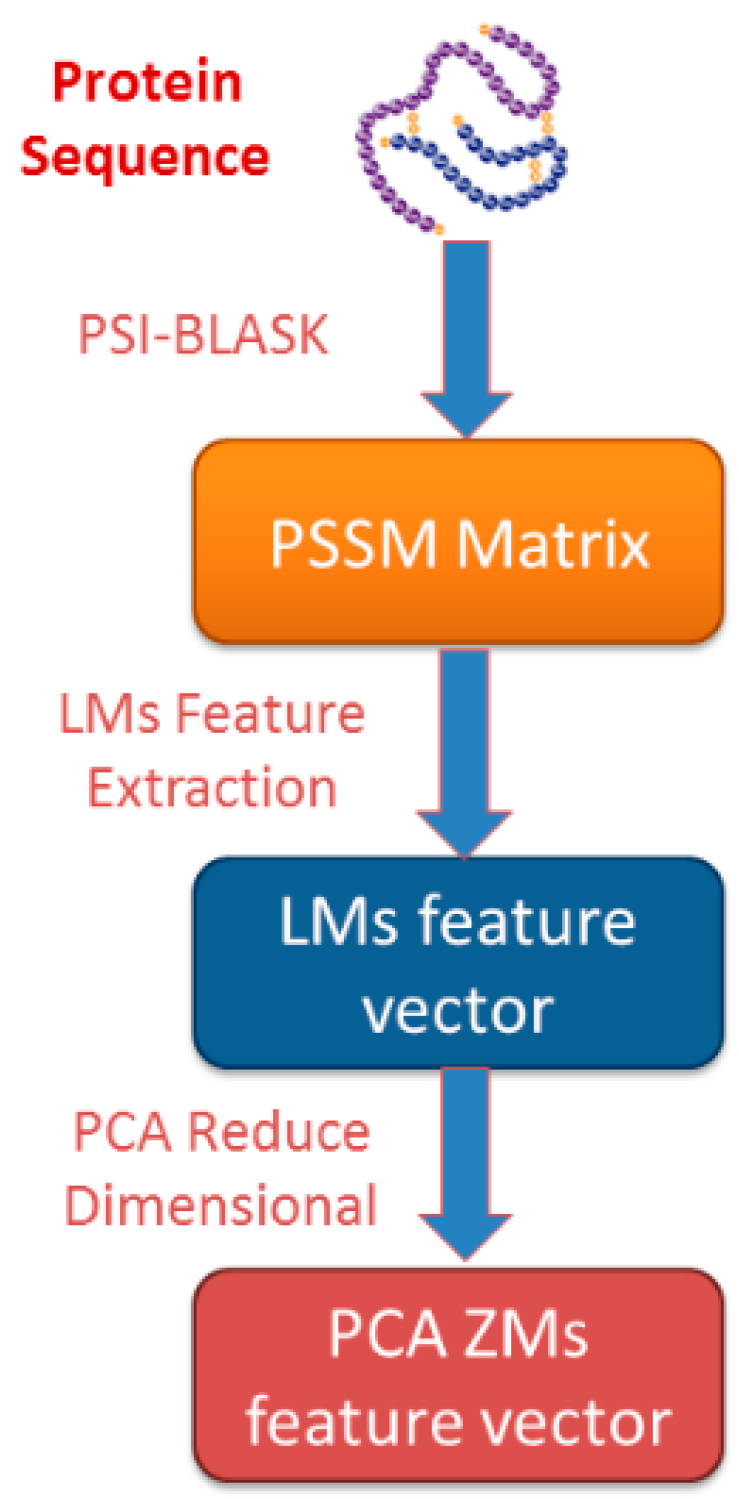
2.2. Position-Specific Scoring Matrix

The position specific scoring matrix (PSSM) was first applied to detect distantly-related proteins based on sequences proteins. A PSSM of a query protein is a R × 20 matrix D = { d i j : i = 1 ⋯ R and j = 1 ⋯ 20}, where the R represents the length of a protein sequence and the number 20 means 20 amino acids. As a scoring matrix, the element of PSSM represents a score of the j t h amino acid in the i t h position for the given query protein sequence, which was denoted as d i j = k = 1 20 p ( u , k ) × w ( v , k ) , where p ( u , k ) is the appearing frequency value of the k t h amino acid at position u of the probe, and w ( v , k ) is the value of Dayhoff’s mutation matrix between v t h and k t h amino acids. Thus, a high score denotes a well-conserved position while, on the contrary, a low score represents a weakly-conserved position [32,33].
PSSM is widely used in a variety of biological tasks, such as prediction of disulfide connectivity, protein subcellular localization, protein quaternary structural attributes, and folding patterns. In this study, the PSSM is used for detecting PPIs. More specific, we employed the Position-Specific Iterated BLAST (PSI-BLAST) to translate each protein sequence into a PSSM. In order to obtain richer evolutionary information, the PSI-BLAST default value is set; in other words, the e-value parameter is set to 0.001 and iterated three times [34,35,36].

2.3. Legendre Moments

The moment in which the Legendre polynomial is used as the kernel function is defined as the Legendre moment, which is introduced by Teague. Legendre moments are a type of class orthogonal moment, which is widely used in image analysis and pattern recognition. They are used to achieve near-zero values of the redundancy measure in a set of moment functions. Thus, the moments become independent features of correspondence [37,38,39,40,41].
The 2-D Legendre moments of order (m, n), with image intensity function f(x; y), are defined as:
L m n = μ m n 1 1 1 1 V m ( x ) V n ( x ) f ( x , y ) d x d y
where m , n = 0 , 1 , 2 , , μ m n = ( 2 m + 1 ) ( 2 n + 1 ) /4, and the m t h order LMs is given by:
V m ( x ) = 1 2 m m ! d m d x m ( x 2 1 ) m = 1 2 m k = 0 [ m / 2 ] 1 k ( p k ) ( 2 ( p k ) p ) x p 2 k
which has the following orthogonality:
1 1 V m ( x ) V n ( x ) = 2 2 m + 1 ϑ m n
where ϑ m n represents the Kronecher function.
An image of P × Q pixels with function f ( i , j ) can be expressed in discrete form as:
L m n = μ m n i = 1 P j = 1 Q h m n ( x , y ) f ( x , y )
where:
h m n ( x , y ) = x Δ x / 2 x + Δ x / 2 y Δ x / 2 y + Δ x / 2 V m ( x ) V n ( x ) d x d y
For the Legendre polynomials, there is an equation:
V m ( x ) d x = V m + 1 ( x ) V m 1 ( x ) 2 m + 1   x [ 1 , 1 ]
Hence, the following accuracy expression can be obtained by applying Equations (5) and (6):
L m n = μ m n i = 0 P 1 j = 0 Q 1 V m + 1 ( x + Δ x 2 ) V m 1 ( x + Δ x 2 ) V m + 1 ( x Δ x 2 ) + V m 1 ( x Δ x 2 ) 2 m + 1 × V n + 1 ( j + Δ y / 2 ) V n 1 ( j + Δ y / 2 ) V n + 1 ( j Δ j / 2 ) + V n 1 ( j Δ j / 2 ) 2 n + 1
As a result, we obtained 441 features by using Legendre moments on PSSM of a given protein sequence. Therefore, each protein pair contains 882 features. The principal component analysis (PCA) method was employed to reduce the influence of noise and obtain distinguishing features. PCA transforms the feature into a new coordinate system, so that the maximum variance of the feature projection is located on the first coordinate. Finally, each protein pair was represented by only 100 features [42,43,44]. The flowchart of the proposed feature extraction scheme is displayed in Figure 1.

2.4. Related Machine Learning Models

When solving many pattern recognition problems, support vector machines (SVMs) are considered as a good alternative to traditional classifiers since, especially in the high-dimensional data space, it has better generalization ability. However, support vector machines have several obvious disadvantages: (1) the number of support vectors increases linearly with the size of the training set; (2) appropriate parameters are critical to support vector machine learning results and generalization ability. At present, parameter optimization is a bottleneck in the application of SVMs; and (3) support vector machines do not yield probabilistic outputs. These problems can be solved by another machine learning technique named relevance vector machines (RVM), which uses Bayesian inference to yield parsimonious solutions for probabilistic classification. Compared to the SVM, the Bayesian theory of the RVM avoids the parameter settings of the SVM that usually require cross-validation-based post-optimizations. However, a major problem with relevance vector machines is that they may lead to some untrustworthy vectors for system decision-making. Since the weights of positive and negative classes in RVM are determined by the zero mean Gauss distribution, this leads to certain training points that belong to the negative class being assigned positive weights, and vice versa. To overcome this problem, the PCVM classifier was proposed, which gives different prior weights to different classes of training points, i.e., in the positive samples, left-truncated Gaussian is used and, in the negative samples, right-truncated Gaussian is used. The PCVM provides many advantages relative to the above methods: (1) PCVM generates probabilistic results for each output; (2) PCVM is a sparse prediction model with less computational complexity, which leads to a more rapid performance in the testing stage; and (3) PCVM adopts an efficient parameter optimization procedure, based on probabilistic reasoning and an expectation maximization (EM) algorithm, which saves the cross-validation grid search effort and improves the performance.

2.5. PCVM Algorithm

Probabilistic classification vector machine (PCVM) is a sparse classification model, which aims to solve the problem of stability classification for relevance vector machines. In binary classification, the PCVM predictive model f(x; w) is generated by choosing a learning function f(·) which is determined by unknown parameters w that is determined by learning given a set of input-target training pairs { x i ,   y i } i = 1 N , where y i = {−1, +1}. The prediction f(x; w) consists of a linear combination of M basis functions:
f   ( x ;   w ) = i = 1 M w i i , θ ( x ) + b
where the weight vector W = ( w 1 , , w M ) T is the parameter that decides the model, b represents the bias, and { 1 , θ ( x ) , M , θ ( x ) } denotes the basis function, (wherein θ represents the parameter vector of the basis function).
The linear output is mapped to the binary output by using the probit link function Ω ( x ) . The link function is the Gaussian cumulative distribution function and has the following form:
Ω ( x ) = x N ( t | 0 , 1 ) d t
After incorporating the kernel method with the probit link function, the model becomes:
F   ( X ;   w ,   b ) = Ω ( i = 1 M w i i , θ ( x ) + b ) = Ω ( Φ θ ( X ) W + b )
A truncated Gaussian distribution as a prior is adopted over each weight w i as follows:
p ( W | α ) = i = 1 M p ( w i | α i ) = i = 1 M N t ( w i | 0 , α i 1 )
A zero-mean Gaussian prior is used for b:
p ( b | β ) = N ( b | 0 ,   β 1 )
The N t ( w i | 0 , α i 1 ) denotes a truncated Gaussian function, α i is the precision of the corresponding parameter w i , β represents the precision of the normal distribution of b. When y i = + 1 , the truncated prior is a left-truncated Gaussian, and when y i = 1 , the prior is a right-truncated Gaussian. It can be denoted as:
p ( w i | α i ) = { 2 N ( w i | 0 , α i 1 ) y i w i 0 0 o t h e r s
We used the gamma distribution as the hyper prior of α and β and the employed EM algorithm for assigning the parameters of a PCVM model [45,46,47].

2.6. Initial Parameter Selection and Training

The PCVM has only one parameter, θ, which is automatically optimized in the training process. However, the EM algorithm converges easily to local maxima. The common method to avoid local extrema is to run the EM algorithm from different initialization points several times, and select the best initial point according to cross-validation error rate.
The best initial point of the PCVM is selected through the following procedure. The PCVM model was trained with nine initialization points over the first five training folds of each dataset. Hence, we obtain a 5 × 9 matrix of parameters that consist of these initial points, where the rows of the matrix denote the folds and the columns of the matrix represent the initializations. For each column, we reserve the initial point that produces the highest test accuracy, so that the matrix reduces from 45 to only five elements. Finally, we select the median over five parameters.

3. Results and Discussion

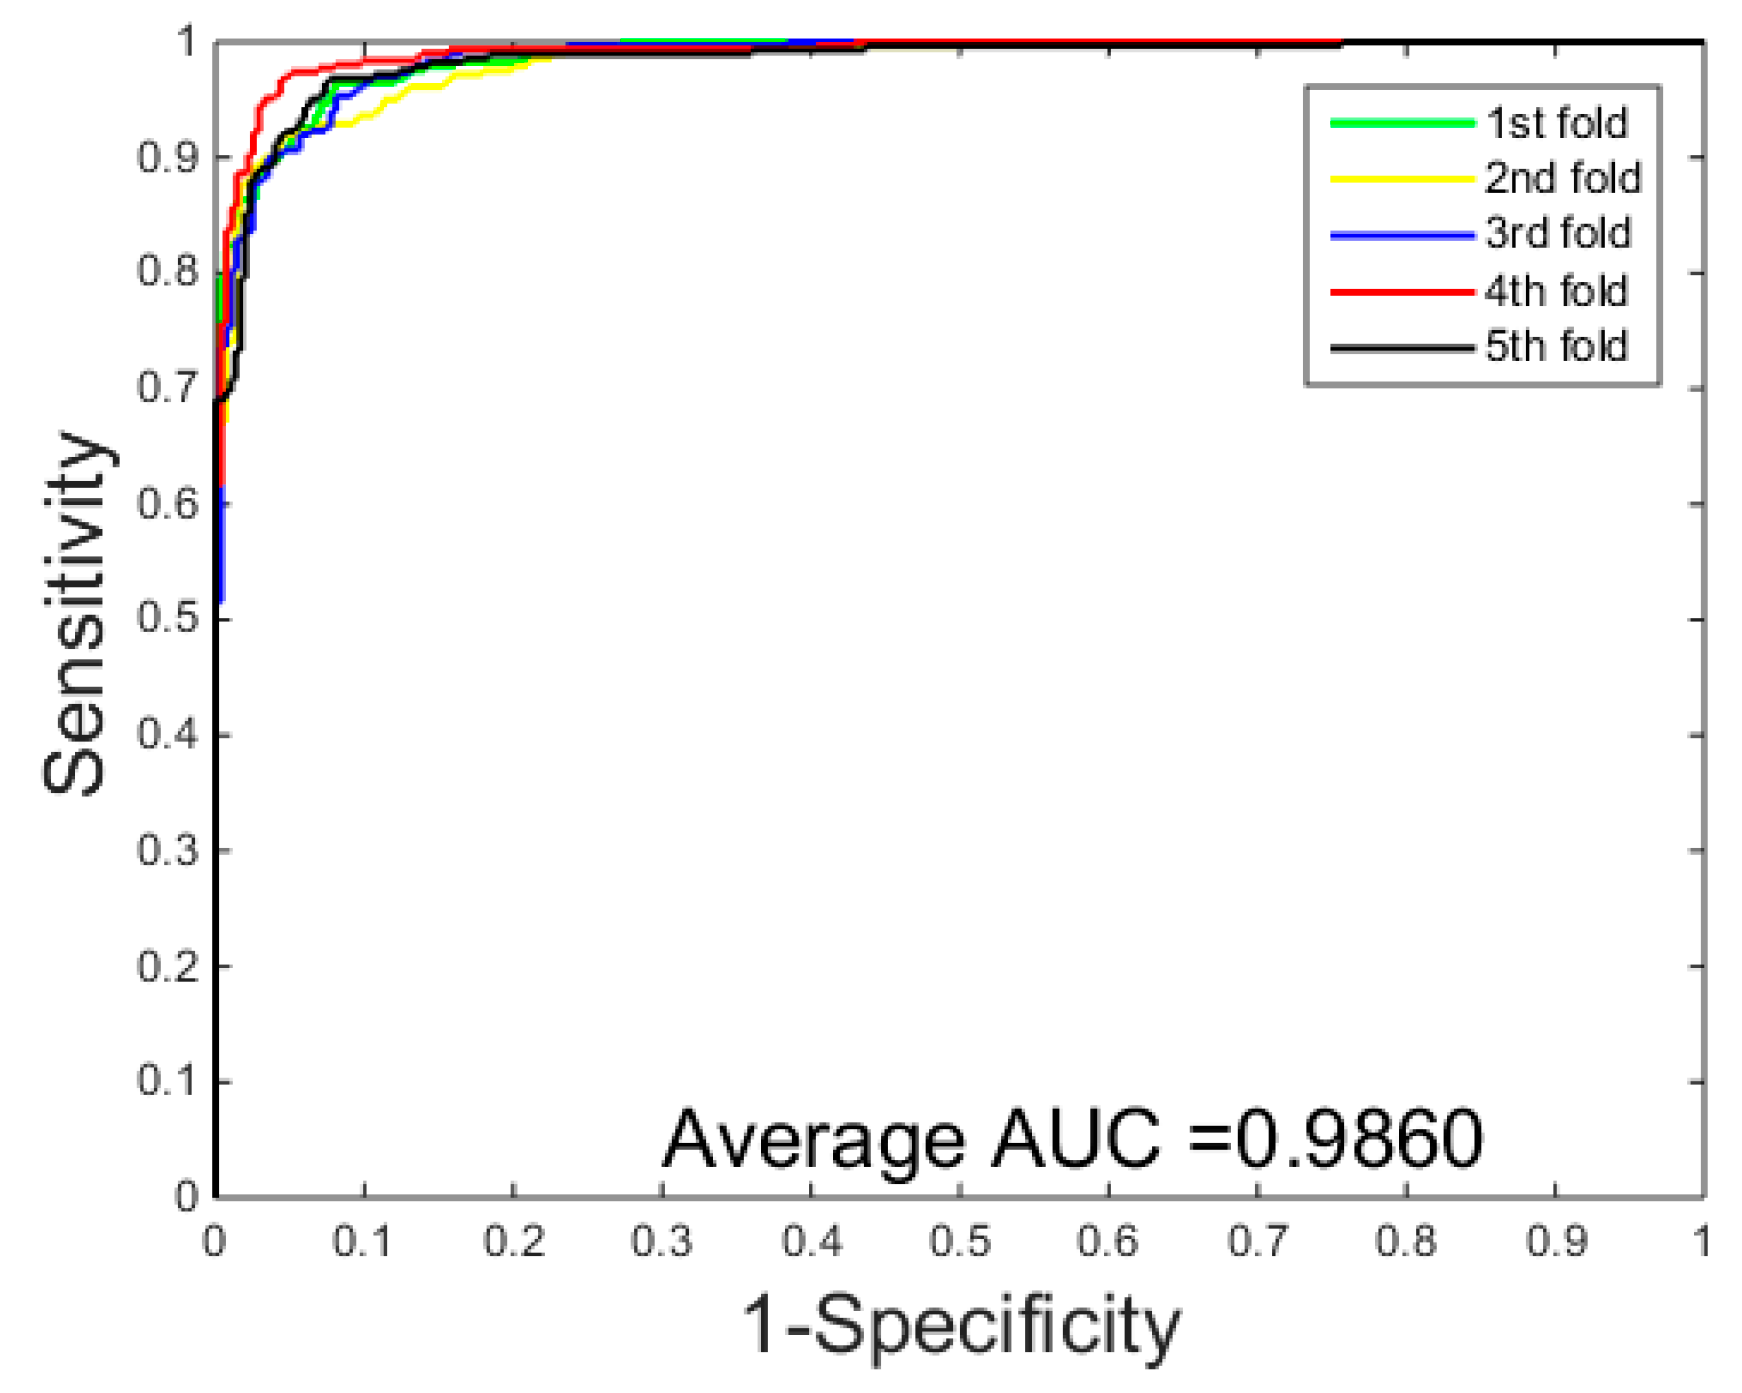
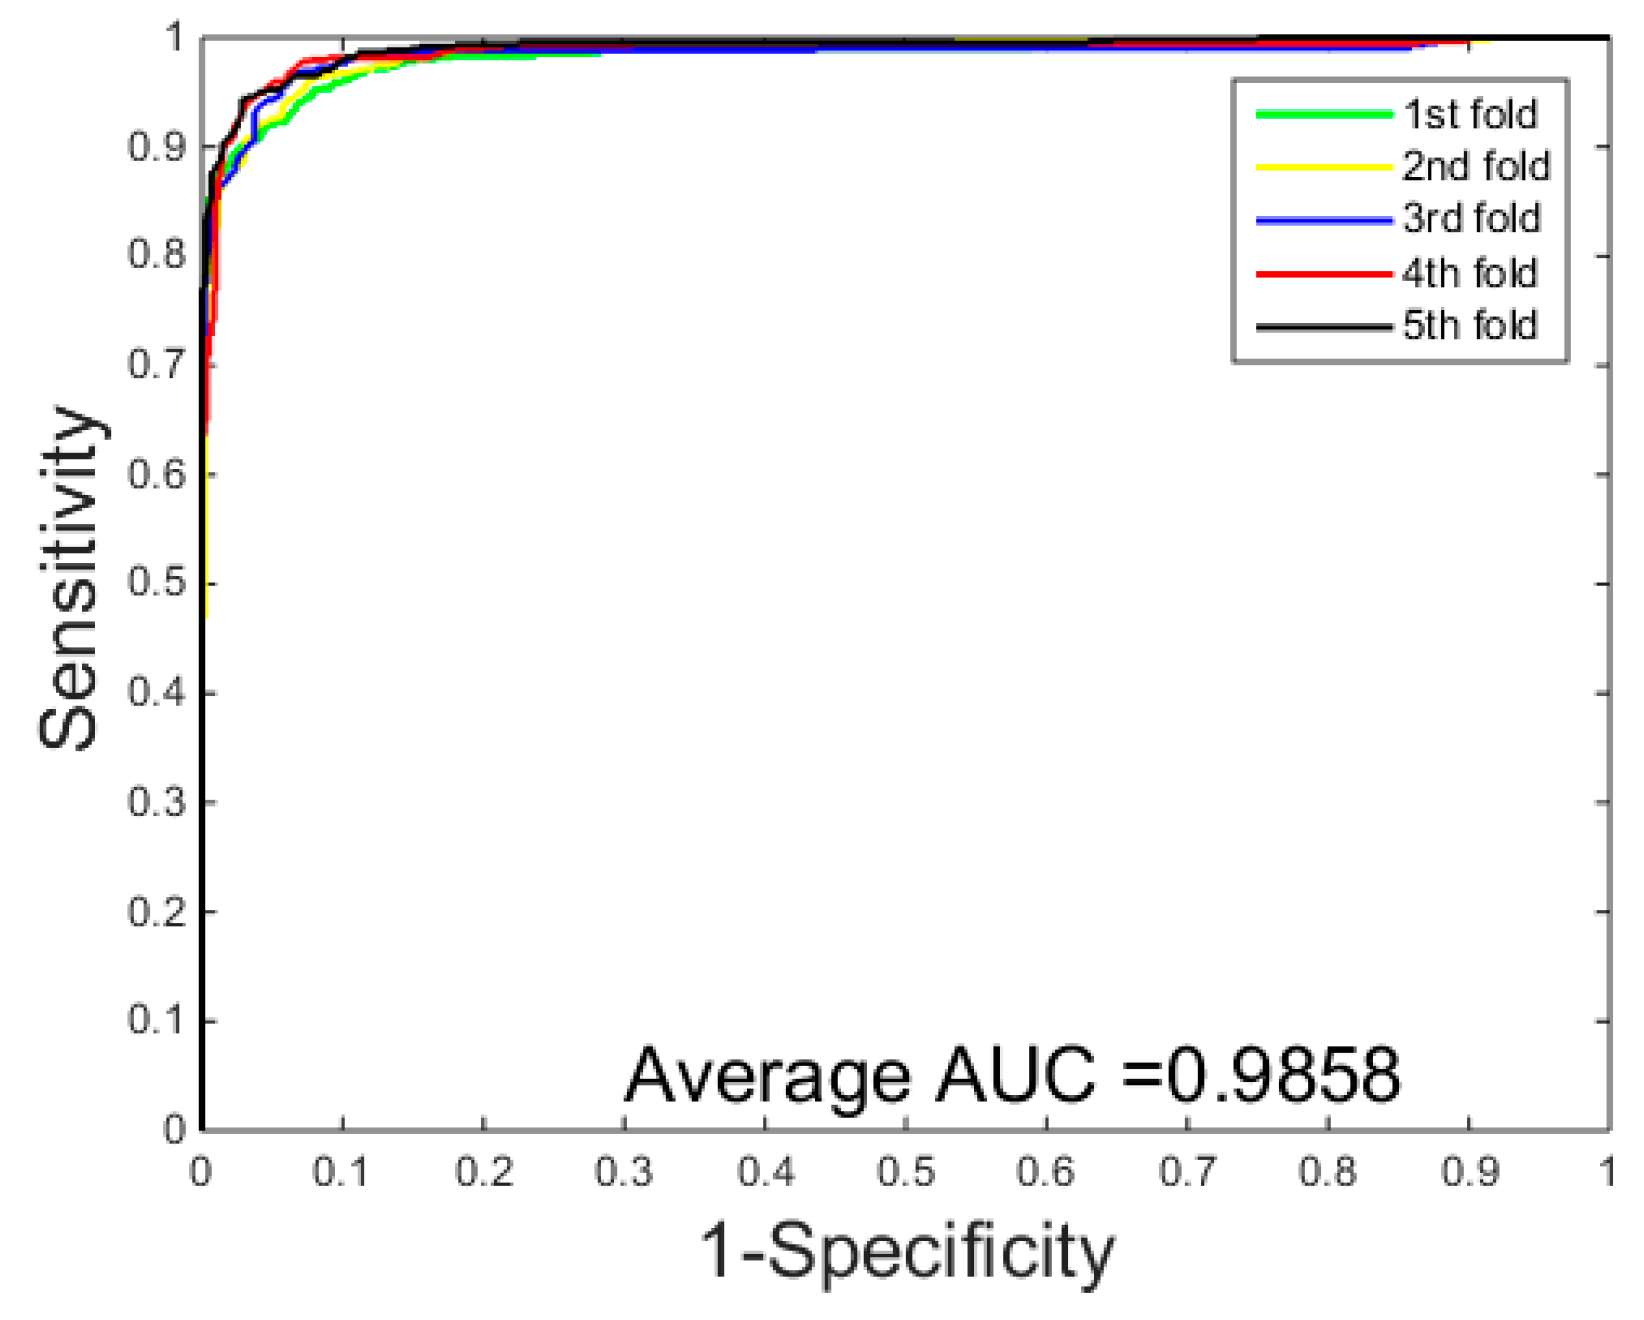
3.1. Performance Evaluation

For the purpose of measuring the performance of the proposed method, the following criteria (the set of metrics is valid only for the binary classification problem): the overall prediction accuracy (Acc), sensitivity (Sen), precision (Pre), and Matthews’s correlation coefficient (MCC) were calculated. They are defined as follows:
Ac = T P + T N T P + F P + T N + F N
Sn = T P T P + T N
Pe = T P F P + T P
Mcc = ( T P × T N ) ( F P × F N ) ( T P + F N ) × ( T N + F P ) × ( T P + F P ) × ( T N + F N )
where T P denotes the number of true positive that samples, having PPIs, that are predicted correctly, F P represents the number of false positive samples, having PPIs, that are predicted to be interaction. T N represents the number of true negative samples, true non-interacting pairs, that are predicted correctly. F N represents the number of false negative samples, true noninteracting pairs, that are predicted to be non-interacting. In addition, the receiver operating characteristic (ROC) curve is created and the area under an ROC curve (AUC) also is computed to further assess the performance [48,49]. For a more intuitive and easier-to-understand formulation about Equations (14)–(17), see Equation (14) of [50] or Equation (11) of [51], where a clear explanation was given for Ac, Sn, Pe, and Mcc, which is much easier for most experimental scientists to understand, particularly with respect to Mcc.

3.2. Assessment of Prediction

To validate the capabilities of the proposed model, we apply it on two approved datasets, Yeast and H. pylori datasets. In order to avoid the over-fitting in the experiment, the five-fold cross-validation is employed for performance evaluation.
When the proposed method was applied to detect PPIs on the Yeast dataset, it can be seen from Table 1 that we obtained the results of average accuracy, precision, sensitivity, and MCC of 96.37%, 96.60%, 96.15% and 93.00%, respectively. They standard deviations are 0.2%, 0.6%, 0.5% and 0.4%, respectively. When using the proposed method to predict PPIs on the H. pylori dataset, as can be seen from the Table 2, the proposed method also yielded good results of average accuracy, precision, sensitivity, and MCC of 93.48%, 94.40%, 95.46% and 87.79% and the standard deviations are 0.2%, 2.2%, 2.3% and 0.4%, respectively. The ROC curves performed on the two datasets are shown in Figure 2 and Figure 3. In order to further assess the performance of the PCVM method, the AUC values were calculated whose averages of the Yeast and H. pylori datasets are 99.33% and 98.60%, respectively.
The high prediction accuracy indicates that the PCVM classifier combining the LMs-PCA feature extraction strategy is effective and feasible for predicting PPIs. Furthermore, the low standard deviations suggest that the proposed method is robust and stable. The good performance is attributed to the feature extraction scheme, which not only preserves sufficient prior information, but also describes the sequence information of protein sequences. The PCVM classifier also has excellent predictive power.

3.3. Comparison the Proposed Method with the SVM-Based Approach

In order to see the feasibility of PCVM classifier, we compare it with the most advanced support vector machine (SVM) classifier. We employed LIBSVM tools [52] to implement the classification of SVM classifiers. For the sake of fairness, PCVM and SVM are executed on the same dataset using the same feature extraction scheme, respectively. The SVM parameters are c = 0.02 and g = 0.03 by using the grid search method, and other parameters use the default value.
The prediction results of the SVM-based methods are listed in Table 3 and Table 4. They ROC curves of SVM method on the Yeast dataset are displayed in Figure 4. We can see from the Table 3 that the SVM technology achieved an average accuracy of 92.47%, an average sensitivity of 92.50%, an average precision of 93.01%, and an average Mcc of 86.00% on the Yeast dataset, while the prediction results of the PCVM technology achieved 96.37% average accuracy, 96.60% average sensitivity, 96.15% average precision, and 93.00% average Mcc on the Yeast dataset. Similar results were found in the Table 4, The prediction of Helicobacter pylori by the SVM method achieved an average accuracy of 90.50%, an average sensitivity of 92.74%, an average precision of 90.08%, and an average Mcc of 82.60%, while the prediction results by the PCVM classifier achieved an average accuracy of 93.48%, an average sensitivity of 94.40%, an average precision of 95.46%, and an average Mcc of 87.79%. The results of the comparison with SVM clearly illustrate that the PCVM classifier outperforms the SVM classifier in predicting protein interactions. In addition, from Figure 2 and Figure 4, the ROC curve of the PCVM method is significantly better than that of the SVM classifier. This shows that the PCVM classifier is reliable and accurate model and can be competent to predict PPIs in efficient manner. The following reasons lead to better prediction results of the PCVM classifier than the SVM classifier: (1) the computation of the PCVM kernel function is greatly reduced; (2) PCVM overcomes the deficiency of the kernel function satisfying the Mercer condition; and (3) PCVM provides more reliable support vectors. Due to these reasons, the PCVM method can yield higher predictions.

3.4. Performance on Independent Dataset

There is no doubt that our proposed approach has a strong PPIs predictive capability on Yeast and H. pylori datasets. However, for the performance of the proposed method, we have further verified by performing it on other four species, include Mix_Celeg, Mix_Hsapi, Mix_Ecoli, and Mix_Mmusc. In this experiment, the selected 11,188 samples of the Yeast data have been adopted to generate a prediction model, the samples from four other species are used to assess the performance of the prediction mode. Table 5 listed the experiment results. From the Table 5, we can find that our prediction model achieves a promising result of average prediction accuracy of 92.60%, 92.80%, 80.10% and 89.14%, respectively. These promising results not only demonstrate that the mechanism of yeast protein interaction may be similar to the other species, but also indicate that Yeast protein sequences can be used for protein interaction prediction on other species data. At the same time, it suggests that the proposed method has good generalizability.

3.5. Comparison with Other Methods

Many methods have been developed for the identification of PPI. In order to assess the performance of the model effectively, we also compared it with existing method. Results obtained by different methods on the Yeast dataset are listed in Table 6. As can be seen from Table 6, Guo’s work accuracy is as high as 89.33% and Zhou’s work performed well with a minimum standard deviation of 0.33%. In addition, Yang’s work achieved a higher accuracy, reaching 90.24%. It is worth mentioning that the proposed method yields the best performance in light of the sensitivity, precision, accuracy, and MCC at 96.37%, 96.60%, 96.15% and 93.00%, respectively. The standard deviations are 0.2%, 0.6%, 0.5% and 0.4%, respectively. The results demonstrate that our method has higher prediction accuracy [53,54,55,56,57,58,59,60].
Table 7 shows the results of several methods on H. pylori dataset. From the Table 7, it can be found that the proposed method achieves the highest performance with 93.48% prediction accuracy, which is 5.98% higher than the maximum value of the other five methods. The same is true for precision, sensitivity, and MCC. The improvement of prediction performance of our method may derive from the new feature extraction scheme, which can extract highly-discriminative information, and the PCVM classifier guarantees accurate and stable prediction [61,62,63,64].

4. Conclusions

Predicting the interactions between proteins is important for understanding the activity of complex cells from a molecular point of view. In this paper, a new computational method is reported for predicting protein-protein interactions using only protein amino acid information. The proposed prediction model is built by combining the PCVM classifier with the LMs-PCA descriptor. It can be seen from the experimental results that the prediction accuracy of this method is obviously higher than that of the previous methods. In addition, our proposed method has good prediction accuracy for cross-species independent datasets. The improvement of our approach is mainly attributed by the use of the probabilistic classification vector machine (PCVM) classifier and the Legendre moments-principal component analysis (LMs-PCA) descriptor from the position specific scoring matrix (PSSM). All these results show that our proposed approach is a very promising, reliable, and efficient support tool for future proteomic studies [65].

Acknowledgments

This work is supported by the Natural Science Foundation of Xinjiang Province, under grants 2017D01A78. The authors would like to thank all anonymous reviewers for their constructive advice.

Author Contributions

Yan-Bin Wang, Zhu-Hong You, and Li-Ping Li conceived the algorithm, carried out the analyses, prepared the datasets, carried out the experiments, and wrote the manuscript. Yu-An Huang and Hai-Cheng Yi and Li-Bo Zhang designed, performed, and analyzed the experiments and wrote the manuscript. All authors read and approved the final manuscript.

Conflicts of Interest

The authors declare no conflict of interest.

References

  1. Rüetschi, U.; Rosén, A.; Karlsson, G.; Zetterberg, H.; Rymo, L.; Hagberg, H.; Jacobsson, B. Proteomic analysis using protein chips to detect biomarkers in cervical and amniotic fluid in women with intra-amniotic inflammation. J. Proteome Res. 1900, 4, 2236–2242. [Google Scholar] [CrossRef] [PubMed]
  2. Niranjanakumari, S.; Lasda, E.; Brazas, R.; Garcia-Blanco, M.A. Reversible cross-linking combined with immunoprecipitation to study RNA-protein interactions in vivo. Methods 2002, 26, 182–190. [Google Scholar] [CrossRef]
  3. Kuo, M.H.; Allis, C.D. In vivo cross-linking and immunoprecipitation for studying dynamic protein: DNA associations in a chromatin environment. Methods 1999, 19, 425–433. [Google Scholar] [CrossRef] [PubMed]
  4. Wallach, D.; Boldin, M.P.; Kovalenko, A.V.; Malinin, N.L.; Mett, I.L.; Camonis, J.H. The yeast two-hybrid screening technique and its use in the study of protein-protein interactions in apoptosis. Curr. Opin. Immunol. 1998, 10, 131–136. [Google Scholar] [CrossRef]
  5. Fang, Y.; Macool, D.; Xue, Z.; Heppard, E.; Hainey, C.; Tingey, S.; Miao, G.H. Development of a high-throughput yeast two-hybrid screening system to study protein-protein interactions in plants. Mol. Genet. Genom. 2002, 267, 142–153. [Google Scholar]
  6. Sun, J.; Xu, J.; Liu, Z.; Zhao, A.; Zhao, A.; Shi, T.; Li, Y. Refined phylogenetic profiles method for predicting protein–protein interactions. Bioinformatics 2005, 21, 3409–3415. [Google Scholar] [CrossRef] [PubMed]
  7. Weiller, G.F. Phylogenetic profiles: A graphical method for detecting genetic recombinations in homologous sequences. Mol. Biol. Evol. 1998, 15, 326–335. [Google Scholar] [CrossRef] [PubMed]
  8. Chiang, J.H.; Yu, H.C. Literature extraction of protein functions using sentence pattern mining. IEEE Trans. Knowl. Data Eng. 2005, 17, 1088–1098. [Google Scholar] [CrossRef]
  9. Ma, X.; Lee, H.; Wang, L.; Sun, F. CGI: A new approach for prioritizing genes by combining gene expression and protein-protein interaction data. Bioinformatics 2007, 23, 215–221. [Google Scholar] [CrossRef] [PubMed]
  10. Carroll, S.; Pavlovic, V. Protein classification using probabilistic chain graphs and the gene ontology structure. Bioinformatics 2006, 22, 1871–1878. [Google Scholar] [CrossRef] [PubMed]
  11. Enright, A.J.; Iliopoulos, I.; Kyrpides, N.C.; Ouzounis, C.A. Protein interaction maps for complete genomes based on gene fusion events. Nature 1999, 402, 86–90. [Google Scholar] [PubMed]
  12. Tsoka, S.; Ouzounis, C.A. Prediction of protein interactions: Metabolic enzymes are frequently involved in gene fusion. Nat. Genet. 2000, 26, 141–142. [Google Scholar] [CrossRef] [PubMed]
  13. Capra, J.A.; Laskowski, R.A.; Thornton, J.M.; Singh, M.; Funkhouser, T.A. Predicting protein ligand binding sites by combining evolutionary sequence conservation and 3D structure. PLoS Comput. Biol. 2009, 5, e1000585. [Google Scholar] [CrossRef] [PubMed]
  14. Aytuna, A.S.; Gursoy, A.; Keskin, O. Prediction of protein-protein interactions by combining structure and sequence conservation in protein interfaces. Bioinformatics 2005, 21, 2850–2855. [Google Scholar] [CrossRef] [PubMed]
  15. Bock, J.R.; Gough, D.A. Whole-proteome interaction mining. Bioinformatics 2003, 19, 125–135. [Google Scholar] [CrossRef] [PubMed]
  16. Chou, K.C.; Cai, Y.D. Predicting protein-protein interactions from sequences in a hybridization space. J. Proteome Res. 2006, 5, 316–322. [Google Scholar] [CrossRef] [PubMed]
  17. You, Z.H.; Lei, Y.K.; Zhu, L.; Xia, J.; Wang, B. Prediction of protein-protein interactions from amino acid sequences with ensemble extreme learning machines and principal component analysis. BMC Bioinform. 2013, 14, 1–11. [Google Scholar] [CrossRef] [PubMed]
  18. You, Z.H.; Yin, Z.; Han, K.; Huang, D.S.; Zhou, X. A semi-supervised learning approach to predict synthetic genetic interactions by combining functional and topological properties of functional gene network. BMC Bioinform. 2010, 11, 1–13. [Google Scholar] [CrossRef] [PubMed]
  19. You, Z.H.; Li, S.; Gao, X.; Luo, X.; Ji, Z. Large-scale protein-protein interactions detection by integrating big biosensing data with computational model. BioMed Res. Int. 2014, 2014, 598129. [Google Scholar] [CrossRef] [PubMed]
  20. You, Z.H.; Zhu, L.; Zheng, C.H.; Yu, H.J.; Deng, S.P.; Ji, Z. Prediction of protein-protein interactions from amino acid sequences using a novel multi-scale continuous and discontinuous feature set. BMC Bioinform. 2014, 15, S9. [Google Scholar] [CrossRef] [PubMed]
  21. Wang, Y.; You, Z.; Li, X.; Chen, X.; Jiang, T.; Zhang, J. PCVMZM: Using the probabilistic classification vector machines model combined with a Zernike moments descriptor to predict protein-protein interactions from protein sequences. Int. J. Mol. Sci. 2017, 18, 1029. [Google Scholar] [CrossRef] [PubMed]
  22. Guo, Y.; Yu, L.; Wen, Z.; Li, M. Using support vector machine combined with auto covariance to predict protein-protein interactions from protein sequences. Nucleic Acids Res. 2008, 36, 3025–3030. [Google Scholar] [CrossRef] [PubMed]
  23. Yang, L.; Xia, J.F.; Gui, J. Prediction of protein-protein interactions from protein sequence using local descriptors. Protein Peptide Lett. 2010, 17, 1085–1090. [Google Scholar] [CrossRef]
  24. Wong, L.; You, Z.H.; Ming, Z.; Li, J.; Chen, X.; Huang, Y.A. Detection of interactions between proteins through rotation forest and local phase quantization descriptors. Int. J. Mol. Sci. 2016, 17, 21. [Google Scholar] [CrossRef] [PubMed]
  25. Nanni, L.; Lumini, A. An ensemble of K-local hyperplanes for predicting protein-protein interactions. Bioinformatics 2006, 10, 1207–1210. [Google Scholar] [CrossRef] [PubMed]
  26. Nanni, L. Fusion of classifiers for predicting protein–protein interactions. Neurocomputing 2005, 68, 289–296. [Google Scholar] [CrossRef]
  27. Nanni, L. Letters: Hyperplanes for predicting protein-protein interactions. Neurocomputing 2005, 69, 257–263. [Google Scholar] [CrossRef]
  28. Jia, J.; Liu, Z.; Xiao, X.; Liu, B.; Chou, K.C. iPPBS-Opt: A sequence-based ensemble classifier for identifying protein-protein binding sites by optimizing imbalanced training datasets. Molecules 2016, 21, 95. [Google Scholar] [CrossRef] [PubMed]
  29. Jia, J.; Liu, Z.; Xiao, X.; Liu, B.; Chou, K.C. Identification of protein-protein binding sites by incorporating the physicochemical properties and stationary wavelet transforms into pseudo amino acid composition. J. Biomol. Struct. Dyn. 2015, 34, 1946–1961. [Google Scholar] [CrossRef] [PubMed]
  30. Jia, J.; Liu, Z.; Xiao, X.; Liu, B.; Chou, K.C. iPPI-Esml: An ensemble classifier for identifying the interactions of proteins by incorporating their physicochemical properties and wavelet transforms into PseAAC. J. Theor. Biol. 2015, 377, 47–56. [Google Scholar] [CrossRef] [PubMed]
  31. Wang, J.; Yang, B.; Revote, J.; Leier, A.; Marquez-Lago, T.T.; Webb, G.; Song, J.; Chou, K.C.; Lithgow, T. POSSUM: A bioinformatics toolkit for generating numerical sequence feature descriptors based on PSSM profiles. Bioinformatics 2017, in press. [Google Scholar] [CrossRef]
  32. Xenarios, I.; Rice, D.W.; Salwinski, L.; Baron, M.K.; Marcotte, E.M.; Eisenberg, D. DIP: The Database of Interacting Proteins: 2001 update. Nucleic Acids Res. 2000, 28, 289–291. [Google Scholar] [CrossRef] [PubMed]
  33. Jeong, J.C.; Lin, X.; Chen, X.W. On Position-Specific Scoring Matrix for Protein Function Prediction. IEEE/ACM Trans. Comput. Biol. Bioinform. 2011, 8, 308–315. [Google Scholar] [CrossRef] [PubMed]
  34. Chang, D.T.-H.; Huang, H.Y.; Syu, Y.T.; Wu, C.P. Real value prediction of protein solvent accessibility using enhanced PSSM features. BMC Bioinform. 2008, 9 (Suppl. S12), 1–12. [Google Scholar] [CrossRef] [PubMed]
  35. Sharma, A.; Lyons, J.; Dehzangi, A.; Paliwal, K.K. A feature extraction technique using bi-gram probabilities of position specific scoring matrix for protein fold recognition. IEEE Trans. Nanobiosci. 2013, 320, 41–46. [Google Scholar] [CrossRef] [PubMed]
  36. Kelley, L.A.; Maccallum, R.M.; Sternberg, M.J.E. Recognition of remote protein homologies using three-dimensional information to generate a position specific scoring matrix in the program 3D-PSSM. In Proceedings of the Third Annual International Conference on Computational Molecular Biology, Lyon, France, 11–14 April 1999; pp. 218–225. [Google Scholar]
  37. Zhang, H.; Shu, H.; Han, G.N.; Coatrieux, G.; Luo, L.; Coatrieux, J.L. Blurred Image Recognition by Legendre Moment Invariants. IEEE Trans. Image Process. A Publ. IEEE Signal Process. Soc. 2010, 19, 596–611. [Google Scholar] [CrossRef] [PubMed] [Green Version]
  38. Chong, C.W.; Raveendran, P.; Mukundan, R. Translation and scale invariants of Legendre moments. Pattern Recognit. 2004, 37, 119–129. [Google Scholar] [CrossRef]
  39. Hosny, K.M. Exact Legendre moment computation for gray level images. Pattern Recognit. 2007, 40, 3597–3605. [Google Scholar] [CrossRef]
  40. Zhang, H.; Shu, H.; Coatrieux, G.; Zhu, J.; Wu, Q.M.J.; Zhang, Y.; Zhu, H.; Luo, L. Affine legendre moment invariants for image watermarking robust to geometric distortions. IEEE Trans. Image Process. 2011, 20, 2189–2199. [Google Scholar] [CrossRef] [PubMed] [Green Version]
  41. Dai, X.; Zhang, H.; Shu, H.; Luo, L. Image recognition by combined invariants of legendre moment. In Proceedings of the IEEE International Conference on Information and Automation, Colombo, Sri Lanka, 17–19 December 2010; pp. 1793–1798. [Google Scholar]
  42. Baldi, P.; Hornik, K. Neural networks and principal component analysis: Learning from examples without local minima. Neural Netw. 1989, 2, 53–58. [Google Scholar] [CrossRef]
  43. Moore, B. Principal component analysis in linear systems: Controllability, observability, and model reduction. IEEE Trans. Autom. Control 2003, 26, 17–32. [Google Scholar] [CrossRef]
  44. Braak, C.J.F.T. CANOCO- A FORTRAN Program for Canonical Community Ordination by Canonical Correspondence Analysis, Principal Component Analysis and Redundancy Analysis; Version 2.1; Ministerie van Landbouw en Visserij: Wageningen, The Netherlands, 1988. [Google Scholar]
  45. Wang, Y.-B.; You, Z.-H.; Li, X.; Jiang, T.-H.; Chen, X.; Zhou, X.; Wang, L. Predicting protein-protein interactions from protein sequences by a stacked sparse autoencoder deep neural network. Mol. Biosyst. 2017, 13, 1336–1344. [Google Scholar] [CrossRef] [PubMed]
  46. Chen, H.; Tino, P.; Yao, X. Efficient probabilistic classification vector machine with incremental basis function selection. IEEE Trans. Neural Netw. Learn. Syst. 2014, 25, 356–369. [Google Scholar] [CrossRef] [PubMed]
  47. Chen, H.; Tino, P.; Yao, X. 1 Probabilistic classification vector machines. IEEE Trans. Neural Netw. 2009, 20, 901–914. [Google Scholar] [CrossRef] [PubMed]
  48. Hanley, J.A.; Mcneil, B.J. The meaning and use of the area under a receiver operating characteristic (ROC) curve. Radiology 1982, 143, 29–36. [Google Scholar] [CrossRef] [PubMed]
  49. Dodd, L.E.; Pepe, M.S. Partial AUC estimation and regression. Biometrics 2003, 59, 614–623. [Google Scholar] [CrossRef] [PubMed]
  50. Chen, W.; Feng, P.M.; Lin, H.; Chou, K.C. iRSpot-PseDNC: Identify recombination spots with pseudo dinucleotide composition. Nucleic Acids Res. 2013, 41, e68. [Google Scholar] [CrossRef] [PubMed]
  51. Lin, H.; Deng, E.Z.; Ding, H.; Chen, W.; Chou, K.C. iPro54-PseKNC: A sequence-based predictor for identifying sigma-54 promoters in prokaryote with pseudo k-tuple nucleotide composition. Nucleic Acids Res. 2014, 42, 12961. [Google Scholar] [CrossRef] [PubMed]
  52. Chang, C.C.; Lin, C.J. LIBSVM: A library for support vector machines. ACM Trans. Intell. Syst. Technol. 2007, 2, 389–396. [Google Scholar] [CrossRef]
  53. Zou, Q.; Li, X.B.; Jiang, W.R.; Lin, Z.Y.; Li, G.L.; Chen, K. Survey of MapReduce frame operation in bioinformatics. Brief. Bioinform. 2014, 15, 637. [Google Scholar] [CrossRef] [PubMed]
  54. Zou, Q.; Zeng, J.; Cao, L.; Ji, R. A novel features ranking metric with application to scalable visual and bioinformatics data classification. Neurocomputing 2016, 173, 346–354. [Google Scholar] [CrossRef]
  55. Zou, Q.; Mao, Y.; Hu, L.; Wu, Y.; Ji, Z. Mirclassify: An advanced web server for miRNA family classification and annotation. Comput. Biol. Med. 2014, 45, 157–160. [Google Scholar] [CrossRef] [PubMed]
  56. Zou, Q.; Hu, Q.; Guo, M.; Wang, G. HAlign: Fast multiple similar DNA/RNA sequence alignment based on the centre star strategy. Bioinformatics 2015, 31, 2475–2481. [Google Scholar] [CrossRef] [PubMed]
  57. Liu, B.; Long, R.; Chou, K.C. iDHS-EL: Identifying DNase I hypersensitive-sites by fusing three different modes of pseu-do nucleotide composition into an ensemble learning framework. Bioinformatics 2016, 32, 2411–2418. [Google Scholar] [CrossRef] [PubMed]
  58. Liu, B.; Liu, F.; Wang, X.; Chen, J.; Fang, L.; Chou, K.C. Pse-in-One: A web server for generating various modes of pseudo components of DNA, RNA, and protein sequences. Nucleic Acids Res. 2015, 43, W65–W71. [Google Scholar] [CrossRef] [PubMed]
  59. Liu, B.; Liu, F.; Fang, L.; Wang, X.; Chou, K.C. repDNA: A Python package to generate various modes of feature vectors for DNA sequences by incorporating user-defined physicochemical properties and sequence-order effects. Bioinformatics 2015, 31, 1307. [Google Scholar] [CrossRef] [PubMed]
  60. Liu, B.; Wang, S.; Long, R.; Chou, K.C. iRSpot-EL: Identify recombination spots with an ensemble learning approach. Bioinformatics 2017, 33, 35–41. [Google Scholar] [CrossRef] [PubMed]
  61. Qiu, W.R.; Sun, B.Q.; Xiao, X.; Xu, Z.C.; Chou, K.C. iHyd-PseCp: Identify hydroxyproline and hydroxylysine in proteins by incorporating sequence-coupled effects into general PseAAC. Oncotarget 2016, 7, 44310–44321. [Google Scholar] [CrossRef] [PubMed]
  62. Qiu, W.R.; Xiao, X.; Xu, Z.C.; Chou, K.C. iPhos-PseEn: Identifying phosphorylation sites in proteins by fusing different pseudo components into an ensemble classifier. Oncotarget 2016, 7, 51270–51283. [Google Scholar] [CrossRef] [PubMed]
  63. Qiu, W.R.; Sun, B.Q.; Xiao, X.; Xu, D.; Chou, K.C. iPhos-PseEvo: Identifying Human Phosphorylated Proteins by Incorporating Evolutionary Information into General PseAAC via Grey System Theory. Mol. Inform. 2017, 36. [Google Scholar] [CrossRef] [PubMed]
  64. Qiu, W.R.; Jiang, S.Y.; Sun, B.Q.; Xiao, X.; Cheng, X.; Chou, K.C. iRNA-2methyl: Identify RNA 2’-O-methylation sites by incorporating sequence-coupled effects into general PseKNC and ensemble classifier. Med. Chem. 2017, 13. [Google Scholar] [CrossRef] [PubMed]
  65. Chou, K.C. An unprecedented revolution in medicinal chemistry driven by the progress of biological science. Curr. Top. Med. Chem. 2017, 17, 2337–2358. [Google Scholar] [CrossRef] [PubMed]
Sample Availability: Samples of the compounds are not available from the authors.
Figure 1. The flowchart of the proposed feature extraction method.
Molecules 22 01366 g001
Figure 2. ROC curves performed of a probabilistic classification vector machines model (PCVM) on the Yeast dataset.
Molecules 22 01366 g002
Figure 3. ROC curves performed of PCVM model on the H. pylori dataset.
Molecules 22 01366 g003
Figure 4. ROC curves performed of the support vector machine (SVM) on the Yeast dataset.
Molecules 22 01366 g004
Table 1. Five-fold cross-validation results using our proposed method on the Yeast dataset.
Testing SetAcc (%)Sn (%)Pe (%)Mcc (%)
196.6797.5295.9393.55
296.3396.5995.9392.93
396.2596.4096.2492.78
496.4295.7896.9393.09
596.1796.6995.7492.63
Average96.37 ± 0.296.60 ± 0.696.15 ± 0.593.00 ± 0.4
Table 2. Five-fold cross-validation results using our proposed method on the H. pylori dataset.
Testing SetAcc (%)Sn (%)Pe (%)Mcc (%)
193.4894.7492.1587.81
293.4889.7296.5687.75
393.1489.9796.4287.20
493.6589.9497.8888.09
593.6692.6194.2788.12
Average93.48 ± 0.294.40 ± 2.295.46 ± 2.387.79 ± 0.4
Table 3. Five-fold cross-validation results using the SVM-based method on the Yeast dataset.
Testing SetAcc (%)Sn (%)Pe (%)Mcc (%)
192.8396.2090.2386.66
292.6797.1088.9186.38
392.2585.6099.0585.60
492.2598.1587.6585.62
592.3485.4599.2385.73
Average92.47 ± 0.392.50 ± 6.493.01 ± 5.786.00 ± 0.5
Table 4. Five-fold cross-validation results using the SVM-based method on the H. pylori dataset.
Testing SetAcc (%)Sn (%)Pe (%)Mcc (%)
190.7499.6584.2782.99
290.2299.6583.3882.14
390.7481.94100.0082.98
490.3982.4799.2282.48
590.41100.0083.5382.42
Average90.50 ± 0.292.74 ± 9.690.08 ± 8.782.60 ± 0.4
Table 5. Prediction results of the proposed method on four other species.
SpeciesTest PairsAccuracy
Mix_Celeg401392.60%
Mix_Ecoli695492.80%
Mix_Hsapi141280.10%
Mix_Mmusc31389.14%
Table 6. Practical predicting results of different methods on the Yeast dataset. N/A: Not Available.
ModelTesting SetAcc (%)Sen (%)Pre (%)MCC (%)
Guo [22]ACC89.33 ± 2.6789.93 ± 3.6888.87 ± 6.16N/A
AC87.36 ± 1.3887.30 ± 4.6887.82 ± 4.33N/A
Yang [23]Cod175.08 ± 1.1375.81 ± 1.2074.75 ± 1.23N/A
Cod280.04 ± 1.0676.77 ± 0.6982.17 ± 1.35N/A
Cod380.41 ± 0.4778.14 ± 0.9081.66 ± 0.99N/A
Cod486.15 ± 1.1781.03 ± 1.7490.24 ± 1.34N/A
You [17]PCA-EELM87.00 ± 0.2986.15 ± 0.4387.59 ± 0.3277.36 ± 0.44
Wong [24]RF-PR-LPQ93.92 ± 0.3691.10 ± 0.3196.45 ± 0.4588.56 ± 0.63
Proposed MethodPCVM96.37 ± 0.2096.60 ± 0.696.15 ± 0.593.00 ± 0.4
Table 7. Practical predicting results of different methods on the H. pylori dataset. N/A: Not Available.
ModelAcc (%)Sen (%)Pre (%)MCC (%)
Nanni [25]83.0086.0085.10N/A
Nanni [26]84.0086.0084.00N/A
Nanni and Lumini [27]86.6086.7085.00N/A
Z-H You [17]87.5088.9586.1578.13
L Nanni [26]84.0084.0084.00N/A
Proposed Method93.4894.4095.4687.79

