Normal Mode Analysis as a Routine Part of a Structural Investigation


Institute of Molecular Biology, Slovak Academy of Sciences, Dúbravská cesta 21, 845 51 Bratislava, Slovakia
*
Author to whom correspondence should be addressed.
Molecules 2019, 24(18), 3293; https://0-doi-org.brum.beds.ac.uk/10.3390/molecules24183293
Submission received: 29 July 2019
/
Revised: 30 August 2019
/
Accepted: 30 August 2019
/
Published: 10 September 2019
(This article belongs to the Special Issue Frontier of Protein Crystallography)
Abstract
:Normal mode analysis (NMA) is a technique that can be used to describe the flexible states accessible to a protein about an equilibrium position. These states have been shown repeatedly to have functional significance. NMA is probably the least computationally expensive method for studying the dynamics of macromolecules, and advances in computer technology and algorithms for calculating normal modes over the last 20 years have made it nearly trivial for all but the largest systems. Despite this, it is still uncommon for NMA to be used as a component of the analysis of a structural study. In this review, we will describe NMA, outline its advantages and limitations, explain what can and cannot be learned from it, and address some criticisms and concerns that have been voiced about it. We will then review the most commonly used techniques for reducing the computational cost of this method and identify the web services making use of these methods. We will illustrate several of their possible uses with recent examples from the literature. We conclude by recommending that NMA become one of the standard tools employed in any structural study.
1. Introduction
This special issue contains many articles describing several of the exciting new developments that have occurred in X-ray crystallography in recent years. In this review, we would like, however, to call attention to an old, well-established, but underused technique—Normal Mode Analysis (NMA). NMA is a technique that can be used to describe the flexible states accessible to a protein about an equilibrium position. These states have been shown repeatedly to have functional significance, and there have been many reviews dedicated to the applications of NMA to the study of biological macromolecules [1,2,3,4,5,6,7,8,9]. At least one book has also been written on this topic [10]. NMA is probably the least computationally expensive method for studying the dynamics of macromolecules, and advances in computer technology and algorithms for calculating normal modes over the last 20 years have made it nearly trivial for all but the largest systems. Despite this, it is still uncommon for NMA to be used as a component of the analysis of a structural study. For example, the number of Web of Science citations (excluding reviews) for the most commonly used NMA software over the last 20 years is only 1757, while the PDB grew by more than 141,000 structures during the same time period. Even allowing that a single study typically produces multiple structures, this is still an enormous discrepancy.
What makes this situation even more surprising is that NMA in some form has either been used as or suggested to be used as a tool for aiding molecular replacement [11,12] or for model refinement [12,13,14,15,16,17,18] since at least the early 1990s. It has also been used to help fit models into low-resolution cryo-EM maps [19,20,21] and interpret small-angle X-ray scattering (SAXS) results [22,23]. While it is true that, in earlier years, the equipment and expertise needed for X-ray crystallography and NMA were rarely found together, thereby necessitating separate studies, this no longer needs to be the case. There is no reason why NMA should not become a standard part of the analysis of any newly determined structure. In this review, we will describe NMA, outline its advantages and limitations, explain what can and cannot be learned from it, and address some criticisms and concerns that have been voiced about it. We will then review the most commonly used techniques for reducing the computational cost of this method and identify the web services making use of these methods. Finally, we will review a few select examples from the literature where NMA was used as part of a structural study to answer questions of dynamics by way of illustration, and we conclude with our recommendations. It should be noted at the beginning that our goal is to show how NMA can be useful for a typical structural study rather than to review all the applications of NMA to X-ray crystallography or to highlight the most impressive applications of NMA.
2. Normal Mode Analysis
Normal mode analysis is a technique that can be used to describe the flexible states accessible to a protein or other molecule about an equilibrium position. It is based on the physics used to describe small oscillations, which can be found in any book on classical mechanics [24]. The idea is that, when an oscillating system at equilibrium, for example, a protein in an energy minimum conformation, is slightly perturbed, a restoring force acts to bring the perturbed system back to its equilibrium configuration (the minimum energy conformation in the case of protein structures). A system is defined to be in equilibrium or at the bottom of a potential minimum when the generalized forces acting on the system are equal to zero. At the minimum energy conformation, represented by the generalized coordinates , the potential energy equation can be represented as a power series in q:
where and represent the instantaneous configuration of components i and j and the deviation of component i from its equilibrium configuration is given by . Superscripts of 0 indicate the equilibrium conformation. is the potential energy equation of the system and, for proteins, usually takes the form of one of the commonly used molecular dynamics force fields (an overview of these may be found in [25,26]). The first term in the series represents the minimum value of the potential and may be set to zero. The second term will be zero at any local minimum, so the potential can therefore be written
where is the Hessian matrix that contains the second derivatives of the potential with respect to the components of the system. The Hessian matrix contains information about how changes in the position of one component of the system are tied to changes in the others.
It is also necessary to consider the kinetic energy (T) of the system since we are interested in dynamics. For component i, this can be given by
where M is a diagonal matrix containing the mass of each particle. The entire equation of motion can be written as
One solution of this equation is the oscillatory equation
where is the amplitude of oscillation, is the frequency, and is a phase factor. By substituting this into Equation (4), the equation of motion can be rewritten into a standard eigenvalue equation:
where the matrix A contains the eigenvectors of the Hessian matrix V and is a diagonal matrix containing the eigenvalues. The eigenvectors are the normal mode vectors and describe in which direction and how far each particle in the system moves with respect to the others; the eigenvalues equal the squares of the frequencies with which all particles involved in each mode vibrate. Each eigenvector describes in which direction each particle moves and how far it moves with respect to all the other particles in the system, but it does not provide absolute displacements, meaning that simple NMA cannot generally be used to provide the displacement amplitudes of a given normal mode [7].
Generally, the vibrational energy of the system is equally divided across all modes such that the average oscillation amplitude of mode k scales at . Modes with higher frequencies, however, have energetically more expensive displacements than those with lower ones. Together, this means that the system experiences the greatest displacements along the lowest frequency or slowest modes: higher frequency modes typically describe rapid local motions, while low frequency modes describe slower collective ones or large-scale conformational changes. Assuming that the system is properly at equilibrium or in an energy minimum, the first six modes will have frequencies of 0. These represent collective translations and rotations of the whole molecule along or about the three Cartesian axes and do not change the internal potential energy of the system (these can be eliminated beforehand by imposing the conservation of linear and angular momenta on the system). The vibrational modes are orthogonal or normal to one another, meaning that they can move independently. The excitation of one mode does not trigger the motion of a different mode. The general motion of the system can be described by a superposition of all modes.
These normal modes yield analytical solutions to the equations of motion: for a given set of initial positions and velocities, NMA allows us to calculate where each atom of the system in question will be at any subsequent time subject to the small oscillation approximation. The system is assumed to fluctuate so little that it behaves for all practical purposes as a solid. Proteins have been experimentally observed to behave in this manner, but only at temperatures below 100–200 K [27,28,29]. Under these conditions, proteins, like other solids, can vibrate with specific modes of vibration, where each mode is characterized by a given frequency and a given atomic displacement pattern. Protein vibrations typically fall in the range from about 1–3500 cm. In the higher frequency modes, only a few directly bonded atoms have substantial displacements, but large parts of the structure often take part in the lowest frequency modes.
NMA has been used in chemistry since the 1950s where its utility was demonstrated by reproducing vibrational spectra [30,31,32]. It was first applied to a peptide in 1979 [33] before being used to study full proteins such as bovine pancreatic trypsin inhibitor (BPTI) [34,35,36], hexokinase [37], crambin [38], human lysozyme [38,39], ribonuclease [38], and myoglobin [40,41]. Extension to larger systems was, however, hampered by the computational expense of the method. More recently, thanks to both advances in computer equipment as well as new methods based on simpler models, it has become possible to examine larger structures, including the skeletal ryanodine receptor [42], virus capsids [43,44,45], Ca-ATPase [46], Myosin-II [46,47,48], F1-ATPase [49], GroEL [50,51,52], the ribosome [53,54,55], the C-ring of the bacterial flagellar motor [56], and the yeast nuclear pore complex [57].
2.1. The Elastic Network Model
Although NMA is less computationally expensive than molecular dynamics simulation, it is still not trivial for proteins containing many hundreds or thousands of residues. The first problem is that a given structure must be energy minimized before NMA to ensure that the starting conformation is in a true minimum with respect to the chosen force field. The minimization must proceed until machine precision is reached, typically below 0.001 kJ/mol-nm, which is much more computationally demanding than the minimizations normally employed for other tasks (these generally need to reach only 10–100 kJ/mol-nm). Frequently, the results of this process distort the structure to a greater or lesser extent, leading to NMA being carried out on a structure different from the initial one. The second problem, and the computationally limiting factor, is the diagonalization of the Hessian matrix. For classical NMA, all N atoms in a structure, normally including the hydrogen atoms, must be used, making the total matrix in size. For large proteins with thousands of atoms, this can become intractable very quickly. As a result, a number of coarse-grained approximate methods have been developed which overcome both of these limitations [4,7]. The most common and widely used of these methods is the elastic network model (ENM).
The general idea of ENMs, first put forward by Tirion [58], is to replace the complicated semi-empirical potentials used in standard NMA with a simple harmonic potential:
where is the distance between atoms or nodes i and j, is the distance in the initial structure, and C is a “stiffness” constant assumed to be the same for all i–j pairs. Note that, by design, the input configuration is assumed to be a minimum energy one, and thus energy minimization against a potential is unnecessary. in this equation refers to a cut-off radius and the given sum is restricted to all pairs less than this value. This value is somewhat arbitrary, but, in practice, values of between 7.0–8.0 Å are used based on the observed distances between non-bonded atoms in experimental structures [59,60] (methods with greater coarse-graining may increase this to 12.0 Å). Most often, only the C atoms are used for these calculations because they are sufficient for studying the backbone motions, which is all that is needed to characterize the low-frequency normal modes. Figure 1 illustrates the application of an elastic network model to hen egg-white lysozyme.
A number of different ways of implementing ENMs have been developed. The simplest form is the Gaussian network model (GNM) developed by Bahar and co-workers [61,62], which replaces the Hessian matrix with an Kirchoff or valency-adjacency matrix . This matrix is defined in terms of a spring constant , which is defined based on the assumption that the separation distance between the ith and jth C atoms in the protein follows a Gaussian distribution. The potential is given by
where is a vector expressing the fluctuations in distance between the ith and jth C atoms. This model assumes that the fluctuations are isotropic and, consequently, no information about the three-dimensional directions of motion can be obtained; however, eigenvalue decomposition of does allow the contribution of individual modes to the equilibrium dynamics, the relative displacement of residues along each mode axis, cross-correlation between residues in individual modes, and square displacement profiles to be calculated.
An extension to the GNM is the anisotropic network model (ANM), which is simply a coarse-grained NMA. Only the C atoms are considered and the potential given in Equation (7) is applied to them. This is the form originally suggested by Tirion [58] and incorporated and developed into the Molecular Modeling Toolkit (MMTK) by Hinsen [63], and widely used in a number of other tools, some of which will be described below. It gives the same information as the GNM and also gives information on the directionality of the fluctuations. The mean-square fluctuations (B-factors) and cross-correlations it produces do not agree quite as well with experiment as GNM, however [10,64,65]. On the other hand, ANMs can be used to generate alternative conformations in the close neighborhood of the initial structure by deforming the structure along the lowest frequency modes [5]. This prompted Zheng [60] and Lin and Song [66] to develop models which combined the best features of both into a single method. The ability to deform structures can be and has been used for a number of purposes, most notably for molecular replacement [11,12], SAXS [22,23], and fitting to cryo-EM maps [19,20,21].
While coarse-graining does allow ENMs to be scaled to very large molecular structures, it does suffer from the drawback of losing detailed information on local movements. The rotating-translating blocks (RTB) model of Sanejouand [67], which is implemented in the ElNémo web service [68], was constructed as a generalized method to alleviate this. In this approach, the protein or other macromolecule is divided into blocks made up of one or a few residues connected by elastic springs. Next, it is assumed that a good approximation to the low-frequency normal modes can be made by making linear combinations of the local rotations and translations of these individual blocks. Consequently, a projection matrix P is constructed and used to build a projected Hessian matrix :
and is diagonalized with , where is the eigenvector matrix diagonalizing and is the corresponding eigenvalue matrix. The resulting eigenvectors can be projected back into the full -dimensional space using , where is a matrix containing the lowest-frequency approximate normal modes. The limitations of the method arise from how the blocks are selected: it does not reproduce internal motions within the blocks, so a great deal of information can be lost if flexible regions are assumed to be rigid.
2.2. Concerns and Limitations
Some concerns are commonly expressed about the utility of NMA in general and ENM in particular [3]. For NMA, the most fundamental question is whether the conformational transitions of real biomolecules are actually harmonic. A number of neutron scattering and NMR [34,69,70,71,72,73] experiments have shown that the large-amplitude, low-frequency motions normal modes are often supposed to describe are actually anharmonic. The anharmonicity arises from severe solvent damping and the roughness of the potential energy surface of the real protein (that is, there are a number of local minima lying on the potential energy surface on the approach to the global minimum). It should be noted, however, that the NMA approximation is only valid over short time-scales and for small amplitude vibrations (according to the principles of statistical mechanics [74], at 300 K, the expected amplitude of a typical thermally-driven oscillation will be very small, typically less than 1 Å), not the much longer-period vibrations generally measured in these studies. More importantly, it is widely thought that large amplitude anharmonic motions do begin as small amplitude ones on a short time scale, which is exactly where the approximations are valid.
The anharmonicity of the motions can arise from a number of sources. For example, a ligand-induced conformational change (where a ligand might include anything from a water molecule to a whole protein) with an amplitude much larger than that given by low-frequency normal modes might begin with a low-amplitude thermal vibration, but can then become an activated process driven by the energy released as a consequence of the binding of the ligand. This extra energy could then push the structure farther along the corresponding low-frequency modes than thermal fluctuations alone.
The characteristic motions described by NMA have frequently been validated using principal components analysis (PCA) of molecular dynamics simulations. These simulations are presently able to describe motions with timescales of up to a few microseconds for smaller proteins. The mathematical formulations behind PCA and NMA are similar: both involve solving a system of linear equations, and the matrix diagonalized in PCA, the covariance matrix, is actually the inverse of the Hessian matrix used in NMA. The covariance matrix is filled empirically by analyzing a number of snapshots from a MD trajectory rather than by calculating a derivative. In both cases, the result tells us what motions a given structure are in principle able to execute starting from a given conformation. A number of studies have attempted to validate NMA low-frequency modes using short- or long-time MD simulations [75,76,77]. These studies generally find that the low-frequency normal modes and the first few principal components overlap considerably, meaning that they do generally describe the same types of motions, although there is not always a one-to-one correspondence between a given mode and its corresponding PC: sometimes, the order is permuted and other times a given PC may be composed of elements from more than one mode.
More fundamentally, the low-frequency normal modes from either all-atom or coarse-grained NMA have been shown to correspond to functionally relevant motions in proteins [5,7] and conformational transitions have been shown to follow one or only a few normal modes [78,79,80]. Three classic examples include hemoglobin, GroEL, and the ribosome. The allosteric conformational changes in hemoglobin in moving between its tense (T) form and its relaxed (R) form closely followed the collective motions captured by the second-lowest frequency mode [81,82]. A single, though rather high-frequency mode of the GroEL chaperonin (mode 18), was shown to describe the conformational change between the closed and open states of the GroEL–GroES complex structure [3,50,83]. Finally, the two subunits of the ribosome follow a ratchet-like motion, which is described by the third-lowest mode of the system [53,84]. In general, the opening and closing of domains or subunits in many enzymes follow their low-frequency modes [85,86], and ligand binding cooperatively triggers collective movements or stabilizes those conformers either favored by or accessible to the open conformation [3,87]. Several more recent examples will be described below.
A concern which might be raised against ENMs in particular is that such coarse-graining does not capture the actual motion of an all-atom NMA. In reply, it should be noted that coarse-grained NMA methods are not intended to capture the micro-level motions of individual side-chains, but the low-frequency large-scale motions of the modes with the largest collectivity. Indeed, the lowest frequency modes of all-atom NMA have been shown to be largely unchanged by differences in particular local interactions, and seem to depend only on the overall shape of the macromolecule [83,88,89,90,91,92,93,94]. Indeed, this observation was one of the original inspirations for the initial development of ENMs. The lowest frequency modes identified by ENMs have been shown to be largely the same as those from all-atom NMA [77,79,95], and at least one study has found that a coarse-grained NMA reproduces the range of conformations found experimentally in the HIV-1 protease [96]. Likewise, increasing the level of detail has also been shown to increase the ability of these models to estimate the anisotropic displacement parameters determined from 83 high-resolution structures [97], and a study in which the coarse-graining was increased from to found that the lowest-frequency mode produced by a level of coarse-graining still had a correlation of 0.73 with the lowest-frequency all atom mode [89].
This does, however, highlight one major limitation of any NMA: unless a given mutation makes a substantial change to the conformation of a protein, NMA will show that the dynamics are the same, even if the protein exhibits very different biochemical behavior. For example, in a recent MD study on the N-terminal domain of the human cardiac ryanodine receptor, we found that the dynamic behavior of three mutants differed notably from the wild-type using PCA, although the average structures were very similar (all RMSDs were below 1.5 Å) [98]. Normal mode analysis using both ElNémo [68] and ProDy [99,100] showed that the three lowest-frequency modes of all three mutants were very similar to those of the wild-type (the overlaps were more than 0.80 in all cases). It should be noted here that it has been shown, in the context of all-atom NMA that, when different conformations are used for calculating the normal modes, the pattern of atomic displacements (the eigenvectors) generally remained consistent, but the frequencies (the eigenvalues) varied significantly, sometimes even greatly enough to cause the rank order of the individual eigenvectors to change [7,101,102,103]. Thus, it is often necessary to consider a set of the lowest frequency normal modes rather than just the lowest individual ones.
2.3. Web-Based Tools Using ENMs
The coarse-grained NMA methods described above have been employed in a number of tools which are available online or can be downloaded for offline use. The most widely used of these are ElNémo [20,68], AD-ENM [104,105,106], NOMAD-Ref [107], oGNM [108] and its successors iGNM [109,110] and DynOmics [111], ANM 2.1 [112,113], HingeProt [114], MolMovDB [115,116], iMODS [117,118], the successor to DFprot [119], and WEBnm@ [120] (Table 1). All of these services make use of ENMs, though NOMAD-Ref also provides the possibility to do all-atom NMA for molecules of up to 5000 atoms. ElNémo, ANM 2.1, GNM, and HingeProt provide the source code for their underlying services for download. Other offline tools include Hinsen’s MMTK [63] (http://dirac.cnrs-orleans.fr/MMTK.html), and ProDy [99,100] (http://prody.csb.pitt.edu/). The different servers provide different services, which will be detailed below. Many of these methods have recently been reviewed by López-Blanco and Chacón [8].
ElNémo, one of the oldest NMA web servers [20,68], uses the RTB approximation and can therefore use all atoms in its normal mode calculations. The results provided include the degree of collectivity of the modes (defined as the fraction of residues affected by a particular mode), residue mean-squared displacement, distance fluctuation maps, and the correlation between the provided B-factors and the computed ones. If two structures of the same protein are provided in different conformations, overlap analysis can be used to identify the mode that contributes most to the given conformational change. It is also possible to generate alternative conformations of arbitrary amplitudes based on these modes for use in molecular replacement.
AD-ENM is also one of the oldest NMA servers [104,105,106]. In its present form, it can handle proteins, DNA, and RNA. Like ElNémo, it provides an option for determining the contribution of each normal mode to an observed conformational change, but it also has options for determining the effects on the overall structure that a conformational change to a subset of residues would have. That is, if new placements for only a few residues are known (or if even just the identity of these residues is known), then the server can predict how the rest of the structure will deform as a result. This feature was first used in a study by Zheng and Brooks [121] on the coupling between the local dynamics of the nucleotide binding sites of myosin and kinesin and the global dynamics of these proteins. In addition to ordinary NMA, AD-ENM also has a number of related tools, including DC-ENM [105] to generate alternative conformations of an input structure, PATH-ENM [106] for generating transition paths between two given macromolecular structures using a mixed elastic network model, iENM [122], which does the same but uses an interpolated elastic network model, and EMFF [21], which uses a modified elastic network model to fit an initial protein structure into a given cryo-EM map. A SAXS-based modeling tool has also been developed [22], but is not yet available for general use.
The NOMAD-Ref server [107] uses the RTB approach to compute all-atom normal mode analyses, but it also provides the opportunity to use GROMACS [123] to calculate a true all-atom NMA for molecules of up to 5000 atoms (about 260 residues since the H atoms must be explicitly included). Like ElNémo and AD-ENM, it can perform overlap analysis and create alternative structures. What makes it unique is that it provides tools for the refinement of structures produced by X-ray crystallography or cryo-EM (As of this writing, the NOMAD-Ref server has been offline for four months for upgrading).
DynOmics [111] is a portal for the ANM 2.1 [113], iGNM [109,110], and oGNM [108] services. It allows the user to either look up the results of an NMA on a structure from the PDB in the iGNM database or to carry out an analysis on an uploaded structure using both ANM and oGNM. A comprehensive set of results are provided. ANM provides molecular motions and animations. Full atomic structures for ANM-driven conformers can be generated and downloaded as well as trajectories in NMD files for viewing in VMD (Visual Molecular Dynamics), a popular MD viewing application [124]. The server also offers the possibility to incorporate environmental effects on the computed normal modes. This feature is especially well-developed for lipid bilayers. The effects of the environment on either the protein alone or the protein and the environment together can be examined. GNM provides the mean-square fluctuations of residues (B-factors) together with their correlation to the experimental ones, cross-correlations between residue fluctuations, an inter-residue contact map, and properties of the GNM mode spectrum. Domain separations, potential functional sites, and potential sensors and effectors can also be identified.
Like DynOmics, MolMovDB [115,116] is a portal to a number of different services, including a database of protein motions and a movie gallery [115,125], a morph server [126] for producing plausible pathways between two different conformations, and a number of hinge or rigid domain prediction tools [116].
Another service for predicting hinges, HingeProt [114], uses a combination of GNM and ANM to identify possible hinge residues in protein structures. iMODS [118], the successor to DFprot [119], carries out NMA using internal coordinates and calculates molecular deformability using conformal vector field theory [127]. It compares calculated and experimental B-factors, calculates the covariance matrix, and illustrates the elastic network using a two-dimensional matrix. WEBnm@ [120] uses Hinsen’s MMTK [63] to calculate its normal modes and provides atomic displacement analysis, visualizes the normal modes, determines which modes contribute to an observed conformational changes between two structures and plots the correlation matrix.
3. Applications
The utility of NMA for a typical structural study can best be seen by examining some of the structural studies that used it as part of the analysis. A search of PubMed for the terms “Crystal Structure” and “Normal Mode Analysis” in the title or abstract over the years 2000–2019 returned 55 papers, of which 38 described a crystal structure study that employed NMA as part of its analysis. Of these, three focused on more general biophysical properties, including the temperature dependence of coordinate shifts of the lysozyme structure [128], an improvement to the refinement of a low-resolution structure of the simian immunodeficiency virus coat protein gp120 [129], and the subtle conformational changes of a lysozyme crystal structure caused by altering its relative humidity [130]. There was also an unusual application where NMA was used to discover where the domain boundaries might lie in a protein where these were somewhat ambiguous [131]. The remaining studies could be loosely classified into two groups: the largest focused on categorizing the overall flexible motions of the protein, while the second concerned itself with how these motions might be correlated with ligand binding or catalytic activation.
3.1. Studies on Overall Flexible Motions
The greatest number of studies used NMA to characterize the general flexibility and domain movements of the protein under study [132,133,134,135,136,137,138,139,140,141,142,143,144,145,146,147,148]. The use of NMA in these studies runs from the simple to the sophisticated. Probably the simplest example is its application to the armadillo repeat domain (ARM) of the human adenomatous polyposis coli tumor suppressor protein [140]. In this study, a NMA was carried out on the ARM domains of this protein, -catenin, plakophilin 1 and p120 catenin, and the lowest frequency vibrational mode was found to be similar for all four: a left-to-right swinging motion of the N-terminal part relative to their C-terminal part. This suggested that the ARM domain, otherwise thought to be quite rigid, does have some intrinsic flexibility.
In a more sophisticated use of this technique, Stanek et al. [147] used NMA in their comprehensive structural and biochemical study of Aquifex aeolicus Hfq, an RNA-binding protein involved in the post-translational regulation of mRNA expression and turnover. Hfq self-assembles into homohexameric rings, which combine into larger dodecameric assemblies in small amounts. NMA showed that the most flexible part of Hfq was not likely to be functionally important because it was not involved in any of the lowest-frequency normal modes. NMA also showed that the N-terminal regions of the hexamer have great flexibility in solution but become rigid when packed against each other in the dodecameric complex. Finally, they were able to account for the conformation of the dodecameric P1 crystal form using one of the low frequency normal modes (a slight rotation of the two rings with respect to one another).
While individual point mutations and variations in sequence that do not change the overall shape of a protein lead to normal modes that are generally indistinguishable from the wild-type, mutations which do alter the conformation can be used to identify differences in dynamics. For example, Dian et al. [141] were able to show that a 39-residue deletion of the nuclear export factor CRM1 was less rigid than the wild-type form, which was able to account for the mutant’s lower thermal stability. In another study, Roy et al. [148] used a 10 ns MD simulation, NMA, and fluorescence lifetime spectroscopy to show that the conformational change exhibited by a given loop in the I249T mutation of the human cathepsin K protein reflected actual changes in the dynamics of the protein caused by the mutation and was not a crystal packing artifact.
As noted above, one of the uses of NMA is to produce possible alternative conformations and to confirm observed ones [132,133,134,135,136,137,146,147]. Confirming observed ones can take the form of verifying that different conformers observed in different crystal structures reflect real solution conformations and not crystal packing effects (e.g., [133,148]). Alternatively, NMA can be used to show how a given conformational change occurred; that is, it can be used to show the preferred directions of flexibility, which, in turn, can suggest possible functional consequences for the processes being studied (e.g., [135,136]). An example of using NMA for producing alternative conformations is Sathiyamoorthy et al. [146], where NMA was used to predict alternative solution forms which were then identified using SAXS. Less ambitiously, Ng et al. [137] used NMA to account for the fact that an archaeal homologue of the Schwachman–Bodian–Diamond syndrome protein appeared to exist as a very strong dimer in the crystal form, but as a monomer in solution.
Finally, a particularly sophisticated application involved the use of a hybrid NMA-geometric simulation method [149] together with NMR to show that calexcitin, which appears to form a single compact unit in the crystal structure, is actually comprised of two separate, well-constrained domains with a considerable degree of relatively independent motion [142]. This degree of flexibility allows the protein to open up an interdomain cleft to an extent much greater than was apparent from the crystal structure alone. In addition, the NMA-geometric simulation of a C-terminal mutant mimicking phosphorylation showed that the mutant, and therefore the phosphorylated wild-type form, had a greater range of motion in the C-terminal area, which appears to be associated with a putative GTPase activity in this protein.
3.2. Correlations with Ligand Binding and Catalytic Activation
The second most common application is to examine how normal modes might be used to describe the conformational changes that are observed or that might occur during substrate binding, product release, or catalytic activation [150,151,152,153,154,155,156,157,158,159,160,161,162,163]. This is probably one of the oldest uses of NMA and was applied at an early date to lysozyme [38,39,164]. In this protein, the two domains bend towards each other following a motion that can be effectively described using a single normal mode of the lowest frequency. The final closed state is similar to the conformation of the ligand-bound closed state. A particularly good example of this application is to the Leu/Ile/Val binding protein LivJ, part of the Escherichia coli ABC transport system [150]. In this example, shown in Figure 2, the protein also has a two-domain structure with a central cleft similar to lysozyme. In the presence of a substrate, the cleft closes through a hinged rigid-body domain movement. The conformation of the ligand bound state can be very well approximated by the lowest frequency hinge-bending mode calculated based on the open structure.
A similar analysis was done on the Salmonella typhimurium phosphoglucomutase [156]. Open and partially closed structures were available for this protein, together with the fully closed form of a eukaryotic homologue. The first low-frequency normal mode could be correlated with the conformational changes bringing the enzyme from its open to its partially closed form. A combination of two modes was able to bring the distance of two catalytically important residues from 14.2 to 6.9 Å, which is within 0.7 Å of the distance of the corresponding residues in the closed homologue structure, thereby mimicking the closed form of the enzyme.
Bodra et al. [162] used NMA to join structural and kinetic results together to describe how conformational changes in the subdomains of dehydroascorbate reductase 2 from Arabidopsis thaliana could be linked to the binding of its glutathione cofactor (GSH) or to the release of its oxidized form (GSSG). This enzyme operates using a bi-uni-uni-uni ping-pong mechanism in which the GSH cofactor and the dehydroascorbate (DHA) substrate interact with a catalytic cysteine residue in separate, sequential binding steps. In the structures reported in this study, the helix and its connecting loops are seen to be the most conformationally labile, and many of the residues involved in binding GSH can be found here, though not the catalytic cysteine. The lowest frequency collective motion described a twisting or breathing motion between the N-terminal thioredoxin-type domain and the C-terminal -helical domain, which partially opens and closes the active-site cleft. The largest motion occurred around the region and a solvent-exposed loop in the C-terminal domain which is not involved in substrate binding. A possible consequence of this motion is that the dynamics might regulate the affinity of the protein for GSH or GSSG. For example, the presence of GSH might favor one conformation over another or dynamics could rapidly release GSSG from the binding site to allow DHA to bind.
Finally, by following the conformational shifts of those parts of a protein containing catalytic residues, it is sometimes possible to answer questions about the protein’s catalytic activity even in the absence of a substrate. For example, Danyal et al. [161] prepared three independent mutations in the MoFe component of the Mo-dependent nitrogenase protein between the P cluster, which holds two iron-sulfur clusters, and the FeMo cofactor where N reduction actually takes place. Normally, the Fe protein, a separate component containing an iron-sulfur cluster, is needed to transfer electrons to the MoFe component for reduction to occur. The process goes as follows: after being reduced by flavodoxin or ferredoxin and binding 2 ATP molecules, the Fe protein binds to the FeMo protein, passes an electron, hydrolyzes its ATP, and leaves. The mutations in this study allowed this part of the enzyme to reduce a number of substrates, including H to H, azide to ammonia, and hydrazine to ammonia, when supplied with electrons from an external polyaminocarboxylate-ligated Eu. N could not be reduced in this way, and only the Fe protein can be used to reduce N, which suggests that the Fe protein plays a role other than simply donating electrons. NMA of an Fe–MoFe complex showed that motion of the Fe protein is correlated with a response inside the FeMo protein in the region between the P cluster and the MoFe cofactor, suggesting that there is a dynamic coupling between the Fe protein and the region of the MoFe protein lying between the P cluster and the MoFe cofactor. This could easily have consequences for intermolecular electron transfer and substrate reduction.
4. Conclusions
As we have shown above, normal mode analysis is a very useful technique for determining which conformational states are accessible to a given macromolecule. It can provide much of the same information given by more computationally expensive methods, such as molecular dynamics simulation, at only a fraction of the cost. It can be used to characterize the general flexibility and domain movements of a molecule, to produce possible alternative conformations and confirm observed ones, and to describe the conformational changes that occur or might occur during substrate binding, product release, or catalytic activation. We have illustrated each of these possibilities with recent examples from the literature. Moreover, aside from a general knowledge of protein structure and dynamics, very little specialized knowledge is needed to make use of the results of NMA, at least at their most basic level. NMA is also a very well-established technique with a number of easy to use tools available. For all of these reasons, we suggest that normal mode analysis should take its place as one of the standard tools of any structural study.
Author Contributions
Writing—original draft preparation, J.A.B.; literature search, J.A.B. and J.P.; writing—review and editing, J.A.B. and V.B.-H.; funding acquisition, V.B.-H.
Funding
This research was funded by Vedecká Grantová Agentúra MŠVVaŠ SR and SAV Grant No. 2/0140/16.
Acknowledgments
The authors would like to thank Eva Kutejová for general support during the writing of this review.
Conflicts of Interest
The authors declare no conflict of interest. The funders had no role in the preparation, in the writing, or in the decision to publish this manuscript.
Abbreviations
The following abbreviations are used in this manuscript:
| ANM | Anisotropic Network Model |
| BPTI | Bovine Pancreatic Trypsin Inhibitor |
| EM | Electron Microscopy |
| ENM | Elastic Network Model |
| GNM | Gaussian Network Model |
| MD | Molecular Dynamics |
| MMTK | Molecular Modeling Toolkit |
| NMA | Normal Mode Analysis |
| NMR | Nuclear Magnetic Resonance |
| PCA | Principal Components Analysis |
| PDB | Protein Data Bank |
| RMSD | Root-Mean Square Deviation |
| RTB | Rotating-Translating Blocks |
| SAXS | Small Angle X-ray Scattering |
References
- Case, D.A. Normal mode analysis of protein dynamics. Curr. Opin. Struct. Biol. 1994, 4, 285–290. [Google Scholar] [CrossRef]
- Brooks, B.R.; Janežič, D.; Karplus, M. Harmonic analysis of large systems. I. Methodology. J. Comput. Chem. 1995, 16, 1522–1542. [Google Scholar] [CrossRef]
- Ma, J. Usefulness and Limitations of Normal Mode Analysis in Modeling Dynamics of Biomolecular Complexes. Structure 2005, 13, 373–380. [Google Scholar] [CrossRef] [PubMed] [Green Version]
- Skjaerven, L.; Hollup, S.M.; Reuter, N. Normal mode analysis for proteins. J. Mol. Struct. THEOCHEM 2009, 898, 42–48. [Google Scholar] [CrossRef]
- Bahar, I.; Lezon, T.R.; Bakan, A.; Shrivastava, I.H. Normal Mode Analysis of Biomolecular Structures: Functional Mechanisms of Membrane Proteins. Chem. Rev. 2010, 110, 1463–1497. [Google Scholar] [CrossRef] [PubMed]
- Dykeman, E.C.; Sankey, O.F. Normal mode analysis and applications in biological physics. J. Phys. Condens. Matter 2010, 22, 423202. [Google Scholar] [CrossRef] [PubMed]
- Mahajan, S.; Sanejouand, Y.H. On the relationship between low-frequency normal modes and the large-scale conformational changes of proteins. Arch. Biochem. Biophys. 2015, 567, 59–65. [Google Scholar] [CrossRef] [PubMed]
- López-Blanco, J.R.; Chacón, P. New generation of elastic network models. Curr. Opin. Struct. Biol. 2016, 37, 46–53. [Google Scholar] [CrossRef] [PubMed]
- Tiwari, S.P.; Reuter, N. Conservation of intrinsic dynamics in proteins—What have computational models taught us? Curr. Opin. Struct. Biol. 2018, 50, 75–81. [Google Scholar] [CrossRef]
- Cui, Q.; Bahar, I. (Eds.) Normal Mode Analysis. Theory and Applications to Biological and Chemical Systems; Chapman & Hall/CRC: Boca Raton, FL, USA, 2006. [Google Scholar]
- Suhre, K.; Sanejouand, Y.H. On the potential of normal-mode analysis for solving difficult molecular-replacement problems. Acta Cryst. 2004, D60, 796–799. [Google Scholar] [CrossRef]
- Delarue, M. Dealing with structural variability in molecular replacement and crystallographic refinement through normal-mode analysis. Acta Cryst. 2008, D64, 40–48. [Google Scholar] [CrossRef] [PubMed]
- Diamond, R. On the Use of Normal Modes in Thermal Parameter Refinement: Theory and Application to the Bovine Pancreatic Trypsin Inhibitor. Acta Cryst. 1990, A46, 425–435. [Google Scholar] [CrossRef] [PubMed]
- Kidera, A.; Gō, N. Refinement of protein dynamic structure: Normal mode refinement. Proc. Natl. Acad. Sci. USA 1990, 87, 3718–3772. [Google Scholar] [CrossRef] [PubMed]
- Kundu, S.; Melton, J.S.; Sorensen, D.C.; Phillips, G.N., Jr. Dynamics of Proteins in Crystals: Comparison of Experiment with Simple Models. Biophys. J. 2002, 83, 723–732. [Google Scholar] [CrossRef] [Green Version]
- Delarue, M.; Dumas, P. On the use of low-frequency normal modes to enforce collective movements in refining macromolecular structural models. Proc. Natl. Acad. Sci. USA 2004, 101, 6957–6962. [Google Scholar] [CrossRef] [PubMed] [Green Version]
- Schröder, G.F.; Brunger, A.T.; Levitt, M. Combining Efficient Conformational Sampling with a Deformable Elastic Network Model Facilitates Structure Refinement at Low Resolution. Structure 2007, 15, 1630–1641. [Google Scholar] [CrossRef] [PubMed] [Green Version]
- Poon, B.K.; Chen, X.; Lu, M.; Vyas, N.K.; Quiocho, F.A.; Wang, Q.; Ma, J. Normal mode refinement of anisotropic thermal parameters for a supramolecular complex at 3.42-Å crystallographic resolution. Proc. Natl. Acad. Sci. USA 2007, 104, 7869–7874. [Google Scholar] [CrossRef]
- Tama, F.; Miyashita, O.; Brooks, C.L., III. Flexible Multi-scale Fitting of Atomic Structures into Low-resolution Electron Density Maps with Elastic Network Normal Mode Analysis. J. Mol. Biol. 2004, 337, 985–999. [Google Scholar] [CrossRef] [PubMed]
- Suhre, K.; Navaza, J.; Sanejouand, Y.H. NORMA: A tool for flexible fitting of high-resolution protein structures into low-resolution electron-microscopy-derived density maps. Acta Cryst. 2006, D62, 1098–1100. [Google Scholar] [CrossRef] [PubMed]
- Zheng, W. Accurate Flexible Fitting of High-Resolution Protein Structures into Cryo-Electron Microscopy Maps Using Coarse-Grained Pseudo-Energy Minimization. Biophys. J. 2011, 100, 478–488. [Google Scholar] [CrossRef] [Green Version]
- Zheng, W.; Tekpinar, M. Accurate Flexible Fitting of High-Resolution Protein Structures to Small-Angle X-Ray Scattering Data Using a Coarse-Grained Model with Implicit Hydration Shell. Biophys. J. 2011, 101, 2981–2991. [Google Scholar] [CrossRef] [PubMed] [Green Version]
- Panjkovich, A.; Svergun, D.I. Deciphering conformational transitions of proteins by small angle X-ray scattering and normal mode analysis. Phys. Chem. Chem. Phys. 2016, 18, 5707. [Google Scholar] [CrossRef] [PubMed]
- Goldstein, H. Classical Mechanics, 2nd ed.; Addison-Wesley: Reading, MA, USA, 1980; pp. 243–274. [Google Scholar]
- Ponder, J.W.; Case, D.A. Force fields for protein simulations. Adv. Protein Chem. 2003, 66, 27–85. [Google Scholar] [PubMed]
- González, M.A. Force fields and molecular dynamics simulations. Collect. SFN 2011, 12, 169–200. [Google Scholar] [CrossRef]
- Knapp, E.W.; Fischer, S.F.; Parak, F. Protein Dynamics from Mössbauer Spectra. The Temperature Dependence. J. Phys. Chem. 1982, 86, 5042–5047. [Google Scholar] [CrossRef]
- Zaccai, G. How Soft Is a Protein? A Protein Dynamics Force Constant Measured by Neutron Scattering. Science 2000, 288, 1604–1607. [Google Scholar] [CrossRef] [PubMed] [Green Version]
- Roh, J.H.; Novikov, V.N.; Gregory, R.B.; Curtis, J.E.; Chowdhuri, Z.; Sokolov, A.P. Onsets of Anharmonicity in Protein Dynamics. Phys. Rev. Lett. 2005, 95, 038101. [Google Scholar] [CrossRef] [PubMed]
- Wilson, E.B., Jr.; Decius, J.C.; Cross, P.C. Molecular Vibrations: The Theory of Infrared and Raman Vibrational Spectra; McGraw-Hill: New York, NY, USA, 1955. [Google Scholar]
- Shimanouchi, T. Stable conformations of polymer chains and model compound molecules. Discuss. Faraday Soc. 1970, 49, 60–69. [Google Scholar] [CrossRef]
- Itoh, K.; Shimanouchi, T. Vibrational frequencies and modes of α-helix. Biopolymers 1970, 9, 383–399. [Google Scholar] [CrossRef]
- Levy, R.M.; Karplus, M. Vibrational Approach to the Dynamics of an α-helix. Biopolymers 1979, 18, 2465–2495. [Google Scholar] [CrossRef]
- Noguti, T.; Gō, N. Collective variable description of small-amplitude conformational fluctuations in a globular protein. Nature 1982, 296, 776–778. [Google Scholar] [CrossRef] [PubMed]
- Brooks, B.; Karplus, M. Harmonic dynamics of proteins: Normal modes and fluctuations in bovine pancreatic trypsin inhibitor. Proc. Natl. Acad. Sci. USA 1983, 80, 6571–6575. [Google Scholar] [CrossRef] [PubMed]
- Levitt, M.; Sander, C.; Stern, P.S. The normal modes of a protein: Native bovine pancreatic trypsin inhibitor. Int. J. Quant. Chem. 1983, 24, 181–199. [Google Scholar] [CrossRef]
- Harrison, R.W. Vibrational Calculation of the Normal Modes of a Large Macromolecule: Methods and some Initial Results. Biopolymers 1984, 23, 2943–2949. [Google Scholar] [CrossRef] [PubMed]
- Levitt, M.; Sander, C.; Stern, P.S. Protein Normal-mode Dynamics: Trypsin Inhibitor, Crambin, Ribonuclease and Lysozyme. J. Mol. Biol. 1985, 181, 423–447. [Google Scholar] [CrossRef]
- Brooks, B.; Karplus, M. Normal modes for specific motions of macromolecules: Application to the hinge-bending mode of lysozyme. Proc. Natl. Acad. Sci. USA 1985, 82, 4995–4999. [Google Scholar] [CrossRef] [PubMed]
- Seno, Y.; Gō, N. Deoxymyoglobin Studied by the Conformational Normal Mode Analysis I. Dynamics of Globin and the Heme–Globin Interaction. J. Mol. Biol. 1990, 216, 95–109. [Google Scholar] [CrossRef]
- Seno, Y.; Gō, N. Deoxymyoglobin Studied by the Conformational Normal Mode Analysis II. The Conformational Change upon Oxygenation. J. Mol. Biol. 1990, 216, 111–126. [Google Scholar] [CrossRef]
- Zheng, W. Toward decrypting the allosteric mechanism of the ryanodine receptor based on coarse-grained structural and dynamic modeling. Proteins 2015, 83, 2307–2318. [Google Scholar] [CrossRef]
- Lee, B.H.; Jo, S.; Choi, M.k.; Kim, M.H.; Choi, J.B.; Kim, M.K. Normal mode analysis of Zika virus. Comput. Biol. Chem. 2018, 72, 53–61. [Google Scholar] [CrossRef]
- Tama, F.; Brooks, C.L., III. Diversity and Identity of Mechanical Properites of Icosahedral Viral Capsids Studied with Elastic Network Normal Mode Analysis. J. Mol. Biol. 2005, 345, 299–314. [Google Scholar] [CrossRef] [PubMed]
- Van Vlijmen, H.W.T.; Karplus, M. Normal Mode Calculations of Icosahedral Viruses with Full Dihedral Flexibility by Use of Molecular Symmetry. J. Mol. Biol. 2005, 350, 528–542. [Google Scholar] [CrossRef] [PubMed]
- Li, G.; Cui, Q. Analysis of Functional Motions in Brownian Molecular Machines with an Efficient Block Normal Mode Approach: Myosin-II and Ca2+-ATPase. Biophys. J. 2004, 86, 743–763. [Google Scholar] [CrossRef]
- Zheng, W.; Brooks, B. Identification of Dynamical Correlations within the Myosin Motor Domain by the Normal Mode Analysis of an Elastic Network Model. J. Mol. Biol. 2005, 346, 745–759. [Google Scholar] [CrossRef] [PubMed]
- Zheng, W.; Thirumalai, D. Coupling between Normal Modes Drives Protein Conformational Dynamics: Illustrations Using Allosteric Transitions in Myosin II. Biophys. J. 2009, 96, 2128–2137. [Google Scholar] [CrossRef] [PubMed] [Green Version]
- Cui, Q.; Li, G.; Ma, J.; Karplus, M. A Normal Mode Analysis of Structural Plasticity in the Biomolecular Motor F1-ATPase. J. Mol. Biol. 2004, 340, 345–372. [Google Scholar] [CrossRef]
- Ma, J.; Karplus, M. The allosteric mechanism of the chaperonin GroEL: A dynamic analysis. Proc. Natl. Acad. Sci. USA 1998, 95, 8502–8507. [Google Scholar] [CrossRef] [Green Version]
- Ma, J.; Sigler, P.B.; Xu, Z.; Karplus, M. A Dynamic Model for the Allosteric Mechanism of GroEL. J. Mol. Biol. 2000, 302, 303–313. [Google Scholar] [CrossRef]
- Keskin, O.; Bahar, I.; Flatow, D.; Covell, D.G.; Jernigan, R.L. Molecular Mechanisms of Chaperonin GroEL–GroES Function. Biochemistry 2002, 41, 491–501. [Google Scholar] [CrossRef]
- Tama, F.; Valle, M.; Frank, J.; Brooks, C.L., III. Dynamic reorganization of the functionally active ribosome explored by normal mode analysis and cryo-electron microscopy. Proc. Natl. Acad. Sci. USA 2003, 100, 9319–9323. [Google Scholar] [CrossRef] [Green Version]
- Yan, A.; Wang, Y.; Klochkowski, A.; Jernigan, R.L. Effects of Protein Subunits Removal on the Computed Motions of Partial 30S Structures of the Ribosome. J. Chem. Theory Comput. 2008, 4, 1757–1767. [Google Scholar] [CrossRef] [PubMed] [Green Version]
- Kurkcuoglu, O.; Kurkcuoglu, Z.; Doruker, P.; Jernigan, R.L. Collective dynamics of the ribosomal tunnel revealed by elastic network modeling. Proteins 2009, 75, 837–845. [Google Scholar] [CrossRef] [PubMed]
- Choi, M.k.; Jo, S.; Lee, B.H.; Kim, M.H.; Choi, J.B.; Kim, K.; Kim, M.K. Dynamic characteristics of a flagellar motor protein analyzed using an elastic network model. J. Mol. Graph. Model. 2017, 78, 81–87. [Google Scholar] [CrossRef] [PubMed]
- Lezon, T.R.; Sali, A.; Bahar, I. Global Motions of the Nuclear Pore Complex: Insights from Elastic Network Models. PLoS Comput. Biol. 2009, 5, e1000496. [Google Scholar] [CrossRef] [PubMed]
- Tirion, M.M. Large Amplitude Elastic Motions in Proteins from a Single-Parameter, Atomic Analysis. Phys. Rev. Lett. 1996, 77, 1905–1908. [Google Scholar] [CrossRef] [PubMed]
- Miyazawa, S.; Jernigan, R.L. Estimation of Effective Interresidue Contact Energies from Protein Crystal Structures: Quasi-Chemical Approximation. Macromolecules 1985, 18, 534–552. [Google Scholar] [CrossRef]
- Zheng, W. A Unification of the Elastic Network Model and the Gaussian Network Model for Optimal Description of Protein Conformational Motions and Fluctuations. Biophys. J. 2008, 94, 3853–3857. [Google Scholar] [CrossRef] [Green Version]
- Bahar, I.; Atilgan, A.R.; Erman, B. Direct evaluation of thermal fluctuations in proteins using a single-parameter harmonic potential. Fold. Des. 1997, 2, 173–181. [Google Scholar] [CrossRef] [Green Version]
- Haliloglu, T.; Bahar, I.; Erman, B. Gaussian Dynamics of Folded Proteins. Phys. Rev. Lett. 1997, 79, 3090–3093. [Google Scholar] [CrossRef]
- Hinsen, K. The Molecular Modeling Toolkit: A New Approach to Molecular Simulations. J. Comp. Chem. 2000, 21, 79–85. [Google Scholar] [CrossRef]
- Bahar, I.; Rader, A.J. Coarse-grained normal mode analysis in structural biology. Curr. Opin. Struct. Biol. 2005, 15, 586–592. [Google Scholar] [CrossRef] [PubMed] [Green Version]
- Chennubhotla, C.; Rader, A.J.; Yang, L.W.; Bahar, I. Elastic network models for understanding biomolecular machinery: From enzymes to supramolecular assemblies. Phys. Biol. 2005, 2, S173–S180. [Google Scholar] [CrossRef] [PubMed]
- Lin, T.L.; Song, G. Generalized spring tensor models for protein fluctuation dynamics and conformation changes. BMC Struct. Biol. 2010, 10 (Suppl. 1), S3. [Google Scholar] [CrossRef] [PubMed]
- Durand, P.; Trinquier, G.; Sanejouand, Y.H. A New Approach for Determining Low-Frequency Normal Modes in Macromolecules. Biopolymers 1994, 34, 759–771. [Google Scholar] [CrossRef]
- Suhre, K.; Sanejouand, Y.H. ElNémo: A normal mode web server for protein movements analysis and the generation of templates for molecular replacement. Nucleic Acids Res. 2004, 32, W610–W614. [Google Scholar] [CrossRef] [PubMed]
- Balog, E.; Becker, T.; Oettl, M.; Lechner, R.; Daniel, R.; Finney, J.; Smith, J.C. Direct Determination of Vibrational Density of States Change on Ligand Binding to a Protein. Phys. Rev. Lett. 2004, 93, 028103. [Google Scholar] [CrossRef] [PubMed]
- Cusack, S.; Smith, J.; Finney, J.; Tidor, B.; Karplus, M. Inelastic Neutron Scattering Analysis of Picosecond Internal Protein Dynamics. Comparison of Harmonic Theory with Experiment. J. Mol. Biol. 1988, 202, 903–908. [Google Scholar] [CrossRef]
- Réat, V.; Dunn, R.; Ferrand, M.; Finney, J.L.; Daniel, R.M.; Smith, J.C. Solvent dependence of dynamic transitions in protein solutions. Proc. Natl. Acad. Sci. USA 2000, 97, 9961–9966. [Google Scholar] [CrossRef] [Green Version]
- Smith, J.; Kuczera, K.; Karplus, M. Dynamics of myoglobin: Comparison of simulation results with neutron scattering spectra. Proc. Natl. Acad. Sci. USA 1990, 87, 1601–1605. [Google Scholar] [CrossRef]
- Smith, J.C. Protein dynamics: Comparison of simulations with inelastic neutron scattering experiments. Q. Rev. Biophys. 1991, 24, 227–291. [Google Scholar] [CrossRef]
- McQuarrie, D.A. Statistical Mechanics; Harper & Row: New York, NY, USA, 1976. [Google Scholar]
- Rueda, M.; Chacón, P.; Orozco, M. Thorough Validation of Protein Normal Mode Analysis: A Comparative Study with Essential Dynamics. Structure 2007, 15, 565–575. [Google Scholar] [CrossRef] [PubMed] [Green Version]
- Rueda, M.; Ferrer-Costa, C.; Meyer, T.; Pérez, A.; Camps, J.; Hospital, A.; Gelpi, J.L.; Orozco, M. A consensus view of protein dynamics. Proc. Natl. Acad. Sci. USA 2007, 104, 796–801. [Google Scholar] [CrossRef] [PubMed] [Green Version]
- Skjaerven, L.; Martinez, A.; Reuter, N. Principal component and normal mode analysis of proteins; a quantitative comparison using the GroEL subunit. Proteins 2011, 79, 232–243. [Google Scholar] [CrossRef] [PubMed]
- Marques, O.; Sanejouand, Y.H. Hinge-Bending Motion in Citrate Synthase Arising From Normal Mode Calculations. Proteins 1995, 23, 557–560. [Google Scholar] [CrossRef] [PubMed]
- Hinsen, K. Analysis of Domain Motions by Approximate Normal Mode Calculations. Proteins 1998, 33, 417–429. [Google Scholar] [CrossRef]
- Hinsen, K.; Thomas, A.; Field, M.J. Analysis of Domain Motions in Large Proteins. Proteins 1999, 34, 369–382. [Google Scholar] [CrossRef]
- Mouawad, L.; Perahia, D. Motions in Hemoglobin Studied by Normal Mode Analysis and Energy Minimization: Evidence for the Existence of Tertiary T-like Quaternary R-like Intermediate Structures. J. Mol. Biol. 1996, 258, 393–410. [Google Scholar] [CrossRef] [PubMed]
- Xu, C.; Trobi, D.; Bahar, I. Allosteric Changes in Protein Structure Computed by a Simple Mechanical Model: Hemoglobin T ↔ R2 Transition. J. Mol. Biol. 2003, 333, 153–168. [Google Scholar] [CrossRef] [PubMed]
- Zheng, W.; Brooks, B.R.; Thirumalai, D. Allosteric Transitions in the Chaperonin GroEL are Captured by a Dominant Normal Mode that is Most Robust to Sequence Variations. Biophys. J. 2007, 93, 2289–2299. [Google Scholar] [CrossRef] [PubMed] [Green Version]
- Wang, Y.; Rader, A.J.; Bahar, I.; Jernigan, R.L. Global ribosome motions revealed with elastic network model. J. Struct. Biol. 2004, 147, 302–314. [Google Scholar] [CrossRef] [PubMed]
- Yang, L.W.; Bahar, I. Coupling between Catalytic Site and Collective Dynamics: A Requirement for Mechanochemical Activity of Enzymes. Structure 2005, 13, 893–904. [Google Scholar] [CrossRef] [PubMed] [Green Version]
- Tama, F.; Sanejouand, Y.H. Conformational change of proteins arising from normal mode calculations. Protein Eng. 2001, 14, 1–6. [Google Scholar] [CrossRef] [PubMed]
- Tobi, D.; Bahar, I. Structural changes involved in protein binding correlate with intrinsic motions of proteins in the unbound state. Proc. Natl. Acad. Sci. USA 2005, 102, 18908–18913. [Google Scholar] [CrossRef] [PubMed] [Green Version]
- Ben Avraham, D. Vibrational normal-mode spectrum of globular proteins. Phys. Rev. B 1993, 47, 14559–14560. [Google Scholar] [CrossRef] [PubMed]
- Doruker, P.; Jernigan, R.L.; Bahar, I. Dynamics of Large Proteins through Hierarchical Levels of Coarse-Grained Structures. J. Comput. Chem. 2002, 23, 119–127. [Google Scholar] [CrossRef] [PubMed]
- Lu, M.; Ma, J. The Role of Shape in Determining Molecular Motions. Biophys. J. 2005, 89, 2395–2401. [Google Scholar] [CrossRef] [PubMed] [Green Version]
- Zheng, W.; Brooks, B.R.; Thirumalai, D. Low-frequency normal modes that describe allosteric transitions in biological nanomachines are robust to sequence variations. Proc. Natl. Acad. Sci. USA 2006, 103, 7664–7669. [Google Scholar] [CrossRef] [Green Version]
- Lezon, T.R.; Banavar, J.R.; Lesk, A.M.; Maritan, A. What Determines the Spectrum of Protein Native State Structures? Proteins 2006, 63, 273–277. [Google Scholar] [CrossRef]
- Nicolay, S.; Sanejouand, Y.H. Functional Modes of Proteins Are among the Most Robust. Phys. Rev. Lett. 2006, 96, 078104. [Google Scholar] [CrossRef]
- Tama, F.; Brooks, C.L., III. Symmetry, Form, and Shape: Guiding Principles for Robustness in Macromolecular Machines. Annu. Rev. Biophys. Biomol. Struct. 2006, 35, 115–133. [Google Scholar] [CrossRef]
- Bertaccini, E.J.; Trudell, J.R.; Lindahl, E. Normal-Mode Analysis of the Glycine Alpha1 Receptor by Three Separate Methods. J. Chem. Inf. Model. 2007, 47, 1572–1579. [Google Scholar] [CrossRef] [PubMed] [Green Version]
- Yang, L.; Song, G.; Carriquiry, A.; Jernigan, R.L. Close Correspondence between the Motions from Principal Component Analysis of Multiple HIV-1 Protease Structures and Elastic Network Modes. Structure 2008, 16, 321–330. [Google Scholar] [CrossRef] [PubMed] [Green Version]
- Kondrashov, D.A.; Van Wynsberghe, A.W.; Bannen, R.M.; Cui, Q.; Phillips, G.N., Jr. Protein Structural Variation in Computational Models and Crystallographic Data. Structure 2007, 15, 169–177. [Google Scholar] [CrossRef] [PubMed] [Green Version]
- Bauer, J.A.; Borko, V.; Pavlović, J.; Kutejová, E.; Bauerová-Hlinková, V. Disease-associated mutations alter the dynamic motion of the N-terminal domain of the human cardiac ryanodine receptor. J. Biomol. Struct. Dyn. 2019. [Google Scholar] [CrossRef] [PubMed]
- Bakan, A.; Meireles, L.M.; Bahar, I. ProDy: Protein Dynamics Inferred from Theory and Experiments. Bioinformatics 2011, 27, 1575–1577. [Google Scholar] [CrossRef] [PubMed]
- Bakan, A.; Dutta, A.; Mao, W.; Liu, Y.; Chennubhotla, C.; Lezon, T.R.; Bahar, I. Evol and ProDy for bridging protein sequence evolution and structural dynamics. Bioinformatics 2014, 30, 2681–2683. [Google Scholar] [CrossRef] [PubMed]
- Thomas, A.; Field, M.J.; Perahia, D. Analysis of the Low-frequency Normal Modes of the R State of Aspartate Transcarbamylase and a Comparison with the T State Modes. J. Mol. Biol. 1996, 261, 490–506. [Google Scholar] [CrossRef] [PubMed]
- Sanejouand, Y.H. On the role of CD4 conformational change in the HIV-cell fusion process. Acad. Sci. Paris 1997, 320, 163–170. [Google Scholar]
- Van Vlijmen, H.W.T.; Karplus, M. Analysis of Calculated Normal Modes of a Set of Native and Partially Unfolded Proteins. J. Phys. Chem. B 1999, 103, 3009–3021. [Google Scholar] [CrossRef]
- Zheng, W.; Doniach, S. A comparative study of motor-protein motions by using a simple elastic-network model. Proc. Natl. Acad. Sci. USA 2003, 100, 13253–13258. [Google Scholar] [CrossRef] [PubMed] [Green Version]
- Zheng, W.; Brooks, B. Normal-Modes-Based Prediction of Protein Conformational Changes Guided by Distance Constraints. Biophys. J. 2005, 88, 3109–3117. [Google Scholar] [CrossRef] [PubMed] [Green Version]
- Zheng, W.; Brooks, B.R.; Hummer, G. Protein conformational transitions explored by mixed elastic network models. Proteins 2007, 69, 43–57. [Google Scholar] [CrossRef] [PubMed]
- Lindahl, E.; Azuara, C.; Koehl, P.; Delarue, M. NOMAD-Ref: Visualization, deformation and refinement of macromolecular structures based on all-atom normal mode analysis. Nucleic Acids Res. 2006, 34, W52–W56. [Google Scholar] [CrossRef] [PubMed]
- Yang, L.W.; Rader, A.J.; Liu, X.; Jursa, C.J.; Chen, S.C.; Karimi, H.A.; Bahar, I. o GNM: Online computation of structural dynamics using the Gaussian Network Model. Nucleic Acids Res. 2006, 34, W24–W31. [Google Scholar] [CrossRef] [PubMed]
- Yang, L.W.; Liu, X.; Jursa, C.J.; Holliman, M.; Rader, A.J.; Karimi, H.A.; Bahar, I. iGNM: A database of protein functional motions based on Gaussian Network Model. Bioinformatics 2005, 21, 2978–2987. [Google Scholar] [CrossRef]
- Li, H.; Chang, Y.Y.; Yang, L.W.; Bahar, I. IGNM 2.0: The Gaussian network model database for biomolecular structural dynamics. Nucleic Acids Res. 2016, 44, D415–D422. [Google Scholar] [CrossRef]
- Li, H.; Chang, Y.Y.; Lee, J.Y.; Bahar, I.; Yang, L.W. DynOmics: Dynamics of structural proteome and beyond. Nucleic Acids Res. 2017, 45, W374–W380. [Google Scholar]
- Eyal, E.; Yang, L.W.; Bahar, I. Anisotropic network model: Systematic evaluation and a new web interface. Bioinformatics 2006, 21, 2619–2627. [Google Scholar] [CrossRef]
- Eyal, E.; Lum, G.; Bahar, I. The anisotropic network model web server at 2015 (ANM 2.0). Bioinformatics 2015, 31, 1487–1489. [Google Scholar] [CrossRef]
- Emekli, U.; Schneidman-Duhovny, D.; Wolfson, H.J.; Nussinov, R.; Haliloglu, T. HingeProt: Automated prediction of hinges in protein structures. Proteins 2008, 70, 1219–1227. [Google Scholar] [CrossRef]
- Flores, S.; Echols, N.; Milburn, D.; Hespenheide, B.; Keating, K.; Lu, J.; Wells, S.; Yu, E.Z.; Thorpe, M. The Database of Macromolecular Motions: New features added at the decade mark. Nucleic Acids Res. 2006, 34, D296–D301. [Google Scholar] [CrossRef] [PubMed]
- Flores, S.C.; Gerstein, M.B. FlexOracle: Predicting flexible hinges by identification of stable domains. BMC Bioinform. 2007, 8, 215. [Google Scholar] [CrossRef] [PubMed]
- Lopéz-Blanco, J.R.; Garzón, J.I.; Chacón, P. iMod: Multipurpose normal mode analysis in internal coordinates. Bioinformatics 2011, 27, 2843–2850. [Google Scholar] [CrossRef] [PubMed]
- López-Blanco, J.R.; Aliaga, J.I.; Quintana-Ortí, E.S.; Chacón, P. iMODS: Internal coordinates normal mode analysis server. Nucleic Acids Res. 2014, 42, W271–W276. [Google Scholar] [CrossRef] [PubMed]
- Garzón, J.I.; Kovacs, J.; Abagyan, R.; Chacón, P. DFprot: A webtool for predicting local chain deformability. Bioinformatics 2007, 23, 901–902. [Google Scholar] [CrossRef] [PubMed]
- Tiwari, S.P.; Fugelbakk, E.; Hollup, S.M.; Skjærven, L.; Cragnolini, T.; Grindhaug, S.H.; Tekle, K.M.; Reuter, N. WEBnm v2.0: Web server and services for comparing protein flexibility. BMC Bioinform. 2014, 15, 427. [Google Scholar] [CrossRef] [PubMed]
- Zheng, W.; Brooks, B. Probing the Local Dynamics of Nucleotide-Binding Pocket Coupled to the Global Dynamics: Myosin versus Kinesin. Biophys. J. 2005, 89, 167–178. [Google Scholar] [CrossRef] [PubMed] [Green Version]
- Tekpinar, M.; Zheng, W. Predicting order of conformational changes during protein conformational transitions using an interpolated elastic network model. Proteins 2010, 78, 2469–2481. [Google Scholar] [CrossRef] [PubMed]
- Abraham, M.J.; Murtola, T.; Schulz, R.; Páll, S.; Smith, J.C.; Hess, B.; Lindahl, E. GROMACS: High performance molecular simulations through parallelism from laptops to supercomputers. SoftwareX 2015, 1–2, 19–25. [Google Scholar] [CrossRef]
- Humphrey, W.; Dalke, A.; Schulten, K. VMD: Visual Molecular Dynamics. J. Mol. Graph. 1996, 14, 33–38. [Google Scholar] [CrossRef]
- Gerstein, M.; Krebs, W. A database of macromolecular motions. Nucleic Acids Res. 1998, 26, 4280–4290. [Google Scholar] [CrossRef] [PubMed] [Green Version]
- Krebs, W.G.; Gerstein, M. The morph server: A standardized system for analyzing and visualizing macromolecular motions in a database framework. Nucleic Acids Res. 2000, 28, 1665–1675. [Google Scholar] [CrossRef] [PubMed]
- Kovacs, J.A.; Chacón, P.; Abagyan, R. Predictions of Protein Flexibility: First-Order Measures. Proteins 2004, 56, 661–668. [Google Scholar] [CrossRef] [PubMed]
- Joti, Y.; Nakasako, M.; Kidera, A.; Go, N. Nonlinear temperature dependence of the crystal structure of lysozyme: Correlation between coordinate shifts and thermal factors. Acta Cryst. 2002, D58, 1421–1432. [Google Scholar] [CrossRef]
- Chen, X.; Lu, M.; Poon, B.K.; Wang, Q.; Ma, J. Structural improvement of unliganded simian immunodeficiency virus gp120 core by normal-mode-based X-ray crystallographic refinement. Acta Cryst. 2009, D65, 339–347. [Google Scholar] [CrossRef] [PubMed]
- Takayama, Y.; Nakasako, M. A few low-frequency normal modes predominantly contribute to conformational responses of hen egg white lysozyme in the tetragonal crystal to variations of molecular packing controlled by environmental humidity. Biophys. Chem. 2011, 159, 237–246. [Google Scholar] [CrossRef] [PubMed]
- Janowski, R.; Panjikar, S.; Eddine, A.N.; Kaufmann, S.H.E.; Weiss, M.S. Structural analysis reveals DNA binding properties of Rv2827c, a hypothetical protein from Mycobacterium tuberculosis. J. Struct. Funct. Genom. 2009, 10, 137–150. [Google Scholar] [CrossRef] [PubMed]
- Huyton, T.; Pye, V.E.; Briggs, L.C.; Flynn, T.C.; Beuron, F.; Kondo, H.; Ma, J.; Zhang, X.; Freemont, P.S. The crystal structure of murine p97/VCP at 3.6 Å. J. Struct. Biol. 2003, 144, 337–348. [Google Scholar] [CrossRef]
- Burk, D.L.; Xiong, B.; Breitbach, C.; Berghuis, A.M. Structures of aminoglycoside acetyltransferase AAC(6′)-Ii in a novel crystal form: Structural and normal-mode analyses. Acta Cryst. 2005, D61, 1273–1279. [Google Scholar] [CrossRef]
- McCoy, J.G.; Bitto, E.; Bingman, C.A.; Wesenberg, G.E.; Bannen, R.M.; Kondrashov, D.A.; Phillips, G.N., Jr. Structure and Dynamics of UDP–Glucose Pyrophosphorylase from Arabidopsis thaliana with Bound UDP–Glucose and UTP. J. Mol. Biol. 2007, 366, 830–841. [Google Scholar] [CrossRef]
- Bitto, E.; Bingman, C.A.; Kondrashov, D.A.; McCoy, J.G.; Bannen, R.M.; Wesenberg, G.E.; Phillips, G.N., Jr. Structure and dynamics of γ-SNAP: Insight into flexibility of proteins from the SNAP family. Proteins 2008, 70, 93–104. [Google Scholar] [CrossRef] [PubMed]
- Bitto, E.; Bingman, C.A.; Bittova, L.; Kondrashov, D.A.; Bannen, R.M.; Fox, B.G.; Markley, J.L.; Phillips, G.N., Jr. Structure of Human J-type Co-chaperone HscB Reveals a Tetracysteine Metal-binding Domain. J. Biol. Chem. 2008, 283, 30184–30192. [Google Scholar] [CrossRef] [PubMed] [Green Version]
- Ng, C.L.; Waterman, D.G.; Koonin, E.V.; Walters, A.D.; Chong, J.P.J.; Isupov, M.N.; Lebedev, A.A.; Bunka, D.H.J.; Stockley, P.G.; Oritiz-Lombardía, M.; et al. Conformational flexibility and molecular interactions of an archaeal homologue of the Schwachman-Bodian-Diamond syndrome protein. BMC Struct. Biol. 2009, 9, 32. [Google Scholar] [CrossRef] [PubMed]
- Fernández, D.; Boix, E.; Pallarès, I.; Avilés, F.X.; Vendrell, J. Analysis of a New Crystal Form of Procarboxypeptidase B: Further Insights into the Catalytic Mechanism. Biopolymers 2010, 93, 178–185. [Google Scholar] [CrossRef] [PubMed]
- Mukhopadhyay, A.; Kladova, A.V.; Bursakov, S.A.; Gavel, O.Y.; Calvete, J.J.; Shnyrov, V.L.; Moura, I.; Moura, J.J.G.; Romão, M.J.; Trincão, J. Crystal structure of the zinc-, cobalt-, and iron-containing adenylate kinase from Desulfovibrio gigas: A novel metal-containing adenylate kinase from Gram-negative bacteria. J. Biol. Inorg. Chem. 2011, 16, 51–61. [Google Scholar] [CrossRef] [PubMed]
- Zhang, Z.; Lin, K.; Gao, L.; Chen, L.; Shi, X.; Wu, G. Crystal structure of the armadillo repeat domain of adenomatous polyposis coli which reveals its inherent flexibility. Biochem. Biophys. Res. Commun. 2011, 412, 732–736. [Google Scholar] [CrossRef] [PubMed]
- Dian, C.; Bernaudat, F.; Langer, K.; Oliva, M.F.; Fornerod, M.; Schoehn, G.; Müller, C.W.; Petosa, C. Structure of a Truncation Mutant of the Nuclear Export Factor CRM1 Provides Insights into the Auto-Inhibitory Role of Its C-Terminal Helix. Structure 2013, 21, 1338–1349. [Google Scholar] [CrossRef] [Green Version]
- Erskine, P.T.; Fokas, A.; Muriithi, C.; Rehman, H.; Yates, L.A.; Bowyer, A.; Findlow, I.S.; Hagan, R.; Werner, J.M.; Miles, A.J.; et al. X-ray, spectroscopic and normal-mode dynamics of calexcitin: structure–function studies of a neuronal calcium-signalling protein. Acta Cryst. 2015, D71, 615–631. [Google Scholar] [CrossRef]
- Yates, L.A.; Durrant, B.P.; Fleurdépine, S.; Harlos, K.; Norbury, C.J.; Gilbert, R.J.C. Structural plasticity of Cid1 provides a basis for its distributive RNA terminal uridylyl transferase activity. Nucleic Acids Res. 2015, 43, 2968–2979. [Google Scholar] [CrossRef]
- Are, V.N.; Ghosh, B.; Kumar, A.; Gadre, R.; Makde, R.D. Crystal structure and dynamics of Spt16N-domain of FACT complex from Cicer arietinum. Int. J. Biol. Macromol. 2016, 88, 36–43. [Google Scholar] [CrossRef]
- Waugh, B.; Sen, U.; Banerjee, R. Crystal structure of phosphoglucomutase from Leishmania major at 3.5 Å resolution. Biochimie 2016, 121, 102–111. [Google Scholar] [CrossRef] [PubMed]
- Sathiyamoorthy, K.; Vijayalakshmi, J.; Tirupati, B.; Fan, L.; Saper, M.A. Structural analyses of the Haemophilus influenzae peptidoglycan synthase activator LpoA suggest multiple conformations in solution. J. Biol. Chem. 2017, 292, 17626–17642. [Google Scholar] [CrossRef] [PubMed]
- Stanek, K.A.; Patterson-West, J.; Randolph, P.S.; Mura, C. Crystal structure and RNA-binding properties of an Hfq homolog from the deep-branching Aquificae: conservation of the lateral RNA-binding mode. Acta Cryst. 2017, D73, 294–315. [Google Scholar] [CrossRef] [PubMed]
- Roy, S.; Chakraborty, S.D.; Biswas, S. Not all pycnodysostosis-related mutants of human cathepsin K are inactive–crystal structure and biochemical studies of an active mutant I249T. FEBS J. 2018, 285, 4265–4280. [Google Scholar] [CrossRef] [PubMed]
- Jimenez-Roldan, J.E.; Freedman, R.B.; Römer, R.A.; Wells, S.A. Rapid simulation of protein motion: Merging flexibility, rigidity and normal mode analyses. Phys. Biol. 2012, 9, 016008. [Google Scholar] [CrossRef] [PubMed]
- Trakhanov, S.; Vyas, N.K.; Luecke, H.; Kristensen, D.M.; Ma, J.; Quiocho, F.A. Ligand-Free and -Bound Structures of the Binding Protein (LivJ) of the Escherichia coli ABC Leucine/Isoleucine/Valine Transport System: Trajectory and Dynamics of the Interdomain Rotation and Ligand Specificity. Biochemistry 2005, 44, 6597–6608. [Google Scholar] [CrossRef] [PubMed]
- Akif, M.; Suhre, K.; Verma, C.; Mande, S.C. Conformational flexibility of Mycobacterium tuberculosis thioredoxin reductase: Crystal structure and normal-mode analysis. Acta Cryst. 2005, D61, 1603–1611. [Google Scholar]
- Han, B.W.; Bingman, C.A.; Mahnke, D.K.; Bannen, R.M.; Bednarek, S.Y.; Sabina, R.L.; Phillips, G.N., Jr. Membrane Association, Mechanism of Action, and Structure of Arabidopsis Embryonic Factor 1 (FAC1). J. Biol. Chem. 2009, 281, 14939–14947. [Google Scholar] [CrossRef]
- Oruganti, S.; Zhang, Y.; Li, H.; Robinson, H.; Terns, M.P.; Terns, R.M.; Yang, W.; Li, H. Alternative Conformations of the Archaeal Nop56/58-Fibrillarin Complex Imply Flexibility in Box C/D RNPs. J. Mol. Biol. 2007, 371, 1141–1150. [Google Scholar] [CrossRef]
- Schmidberger, J.W.; Wilce, J.A.; Tsang, J.S.H.; Wilce, M.C.J. Crystal Structures of the Substrate Free-enzyme, and Reaction Intermediate of the HAD Superfamily Member, Haloacid Dehalogenase DehIVa from Burkholderia cepacia MBA4. J. Mol. Biol. 2007, 368, 706–717. [Google Scholar] [CrossRef]
- Kumar, P.; Joshi, D.C.; Akif, M.; Akhter, Y.; Hasnain, S.E.; Mande, S.C. Mapping Conformational Transitions in Cyclic AMP Receptor Protein: Crystal Structure and Normal-Mode Analysis of Mycobacterium tuberculosis apo-cAMP receptor protein. Biophys. J. 2010, 98, 305–314. [Google Scholar] [CrossRef] [PubMed]
- Mehra-Chaudhary, R.; Mick, J.; Tanner, J.J.; Henzel, M.T.; Beamer, L.J. Crystal structure of a bacterial phosphoglucomutase, an enzyme involved in the virulence of multiple human pathogens. Proteins 2011, 79, 1215–1229. [Google Scholar] [CrossRef] [PubMed]
- Takeda, S.; Koike, R.; Nitanai, Y.; Minakata, S.; Maéda, Y.; Ota, M. Actin capping protein and its inhibitor CARMIL: How intrinsically disordered regions function. Phys. Biol. 2011, 8, 035005. [Google Scholar] [CrossRef] [PubMed]
- Tarnawski, M.; Krzywda, S.; Bialek, W.; Jaskolski, M.; Szczepaniak, A. Structure of the RuBisCO chaperone RbcX from the thermophilic cyanobacterium Thermosynechococcus elongatus. Acta Cryst. 2011, F67, 851–857. [Google Scholar]
- Bloudoff, K.; Rodionov, D.; Schmeing, T.M. Crystal Structures of the First, Condensation Domain of CDA Synthetase Suggest Conformational Changes during the Synthetic Cycle of Nonribosomal Peptide Synthetases. J. Mol. Biol. 2013, 425, 3137–3150. [Google Scholar] [CrossRef] [PubMed]
- Takasuka, T.E.; Bianchetti, C.M.; Tobimatsu, Y.; Bergeman, L.F.; Ralph, J.; Fox, B.G. Structure-guided analysis of catalytic specificity of the abundantly secreted chitosanase SACTE_5457 from Streptomyces Sp. SirexAA-E. Proteins 2014, 82, 1245–1257. [Google Scholar] [CrossRef]
- Danyal, K.; Rasmussen, A.J.; Keable, S.M.; Inglet, B.S.; Shaw, S.; Zadvornyy, O.A.; Duval, S.; Dean, D.R.; Raugei, S.; Peters, J.W. Fe Protein-Independent Substrate Reduction by Nitrogenase MoFe Protein Variants. Biochemistry 2015, 54, 2456–2462. [Google Scholar] [CrossRef] [PubMed] [Green Version]
- Bodra, N.; Young, D.; Rosado, L.A.; Pallo, A.; Wahni, K.; De Proft, F.; Huang, J.; Van Breusegem, F.; Messens, J. Arabidopsis thaliana dehydroascorbate reductase 2: Conformational flexibility during catalysis. Sci. Rep. 2017, 7, 42494. [Google Scholar] [CrossRef] [PubMed]
- Dong, J.; Li, F.; Gao, F.; Wei, J.; Lin, Y.; Zhang, Y.; Lou, J.; Liu, G.; Dong, Y.; Liu, L.; et al. Structure of tRNA-Modifying Enzyme TiaS and Motions of Its Substrate Binding Zinc Ribbon. J. Mol. Biol. 2018, 430, 4183–4194. [Google Scholar] [CrossRef] [PubMed]
- Bruccoleri, R.E.; Karplus, M.; McCammon, J.A. The Hinge-Bending Mode of a Lysozyme–Inhibitor Complex. Biopolymers 1986, 25, 1767–1802. [Google Scholar] [CrossRef]
Figure 1.
Illustration of the application ofNMA using an elastic network model to hen egg-white lysozyme (PDB ID 6lyz). (a) The lysozyme structure in cyan as a cartoon ribbon is overlaid with the elastic network model used for NMA. The C atoms are shown as green spheres. All C atoms within a radius of 7.3 Å are connected by black lines. (b) Lysozyme’s well-known hinge-bending motion is captured by the lowest-frequency non-zero mode. In this illustration, the arrows show the direction of motion, with longer arrows indicating greater motion.

Figure 2.
An illustration of how the conformational change between the open and substrate-bound forms of LivJ can be described using only a few low-frequency modes. The NMA was carried out on the open, unbound form of LivJ using the offline form of ElNémo [20,68]. In both panels, the unbound form is shown in purple, the substrate-bound form is shown in green, and the valine substrate is shown as Van der Waals spheres. (a) Most of the substrate-bound conformation can be reproduced by applying the lowest-frequency mode to the open form. The magenta structure shows the results of applying only the lowest-frequency mode to the open form of LivJ. The RMSD between this conformation and the substrate-bound form is 2.3 Å as compared to 6.5 Å between the open and substrate-bound forms. (b) The closed form can be even more closely approximated using a combination of five of the lowest-frequency modes (cyan). The RMSD between this form and the substrate-bound form is only 1.5 Å.


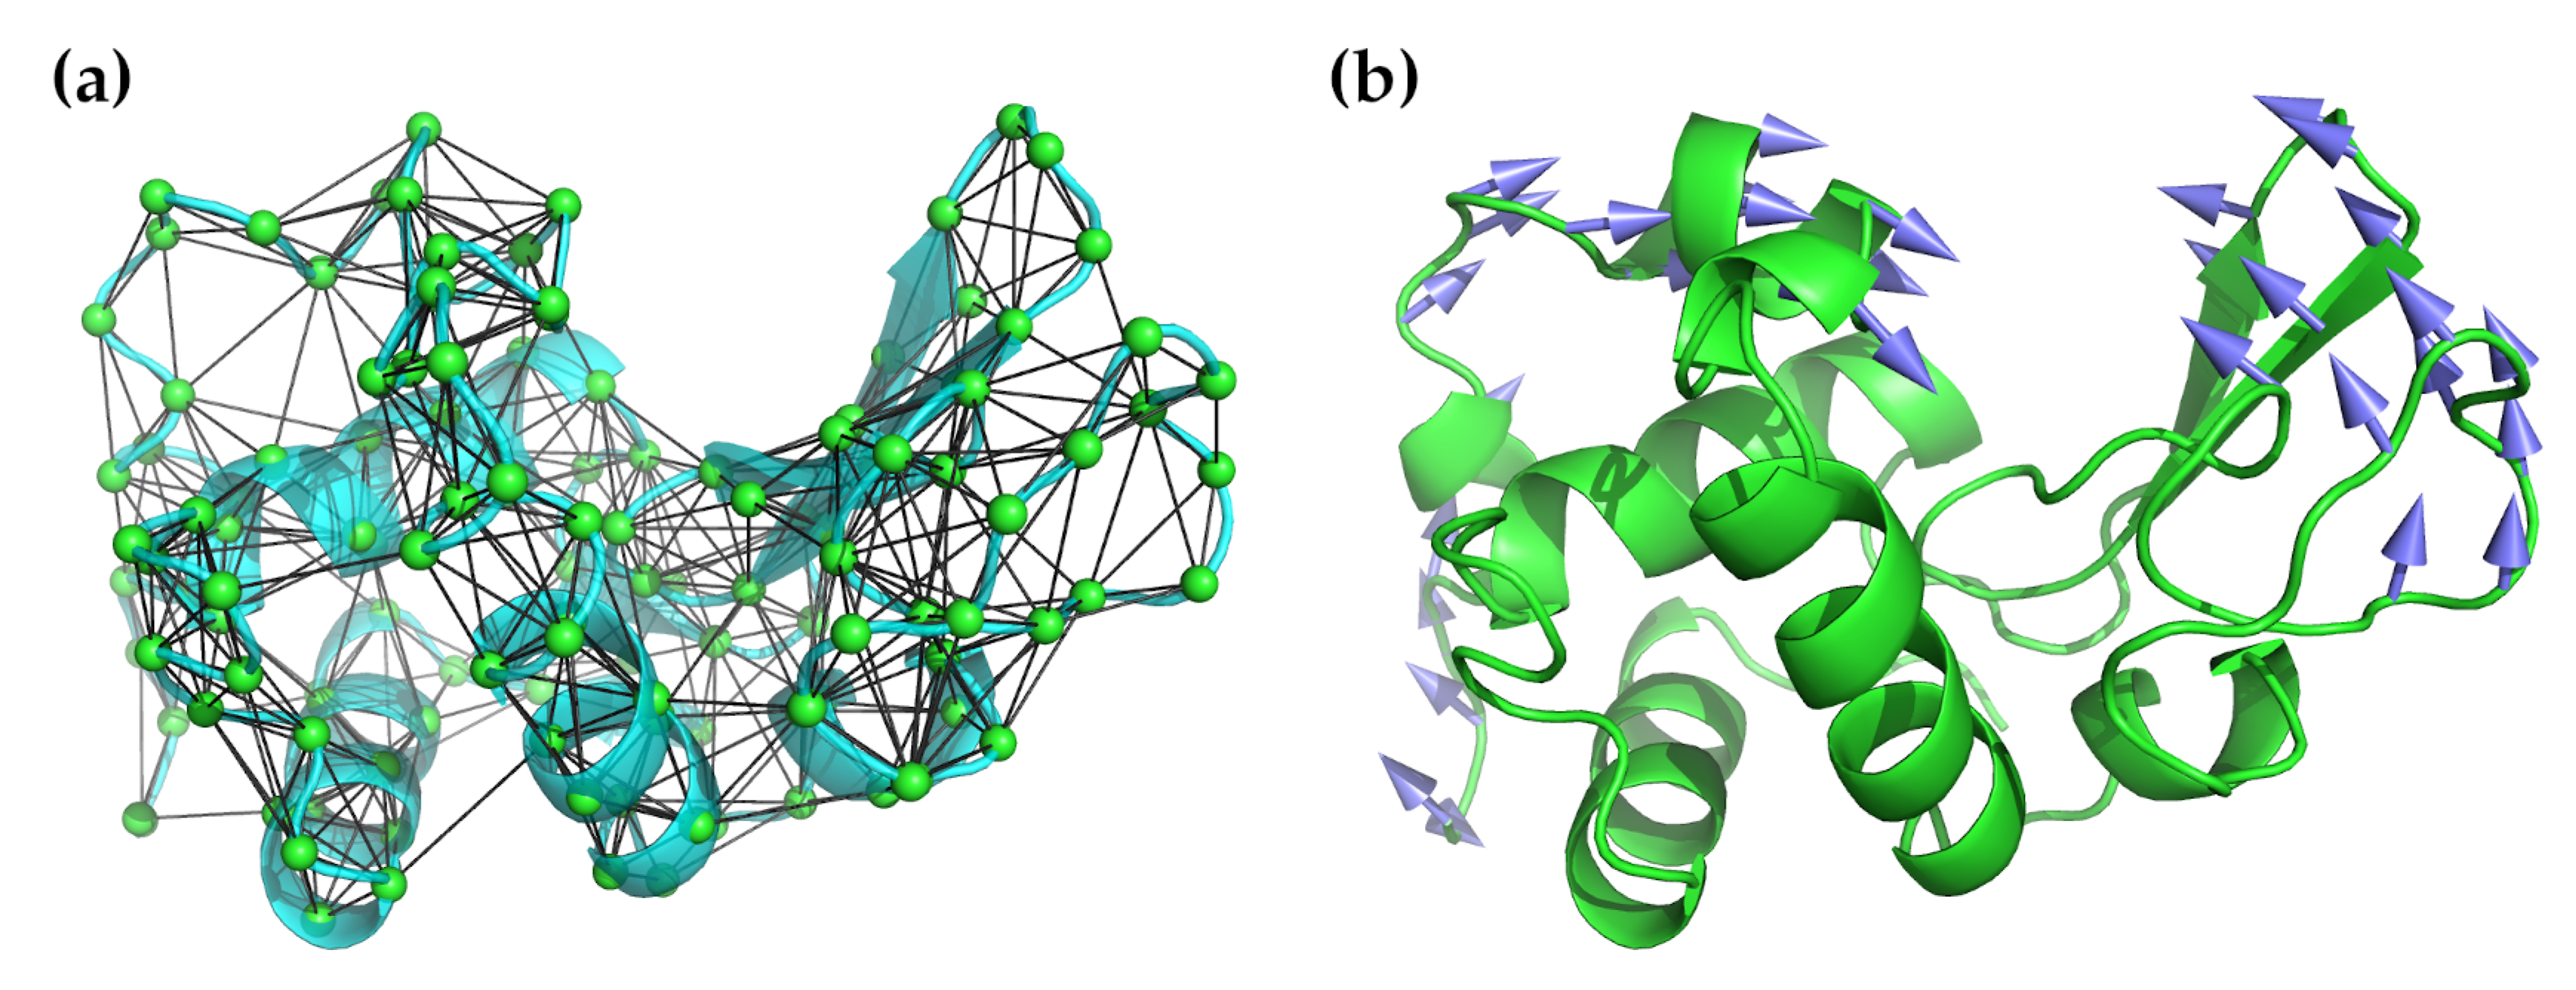
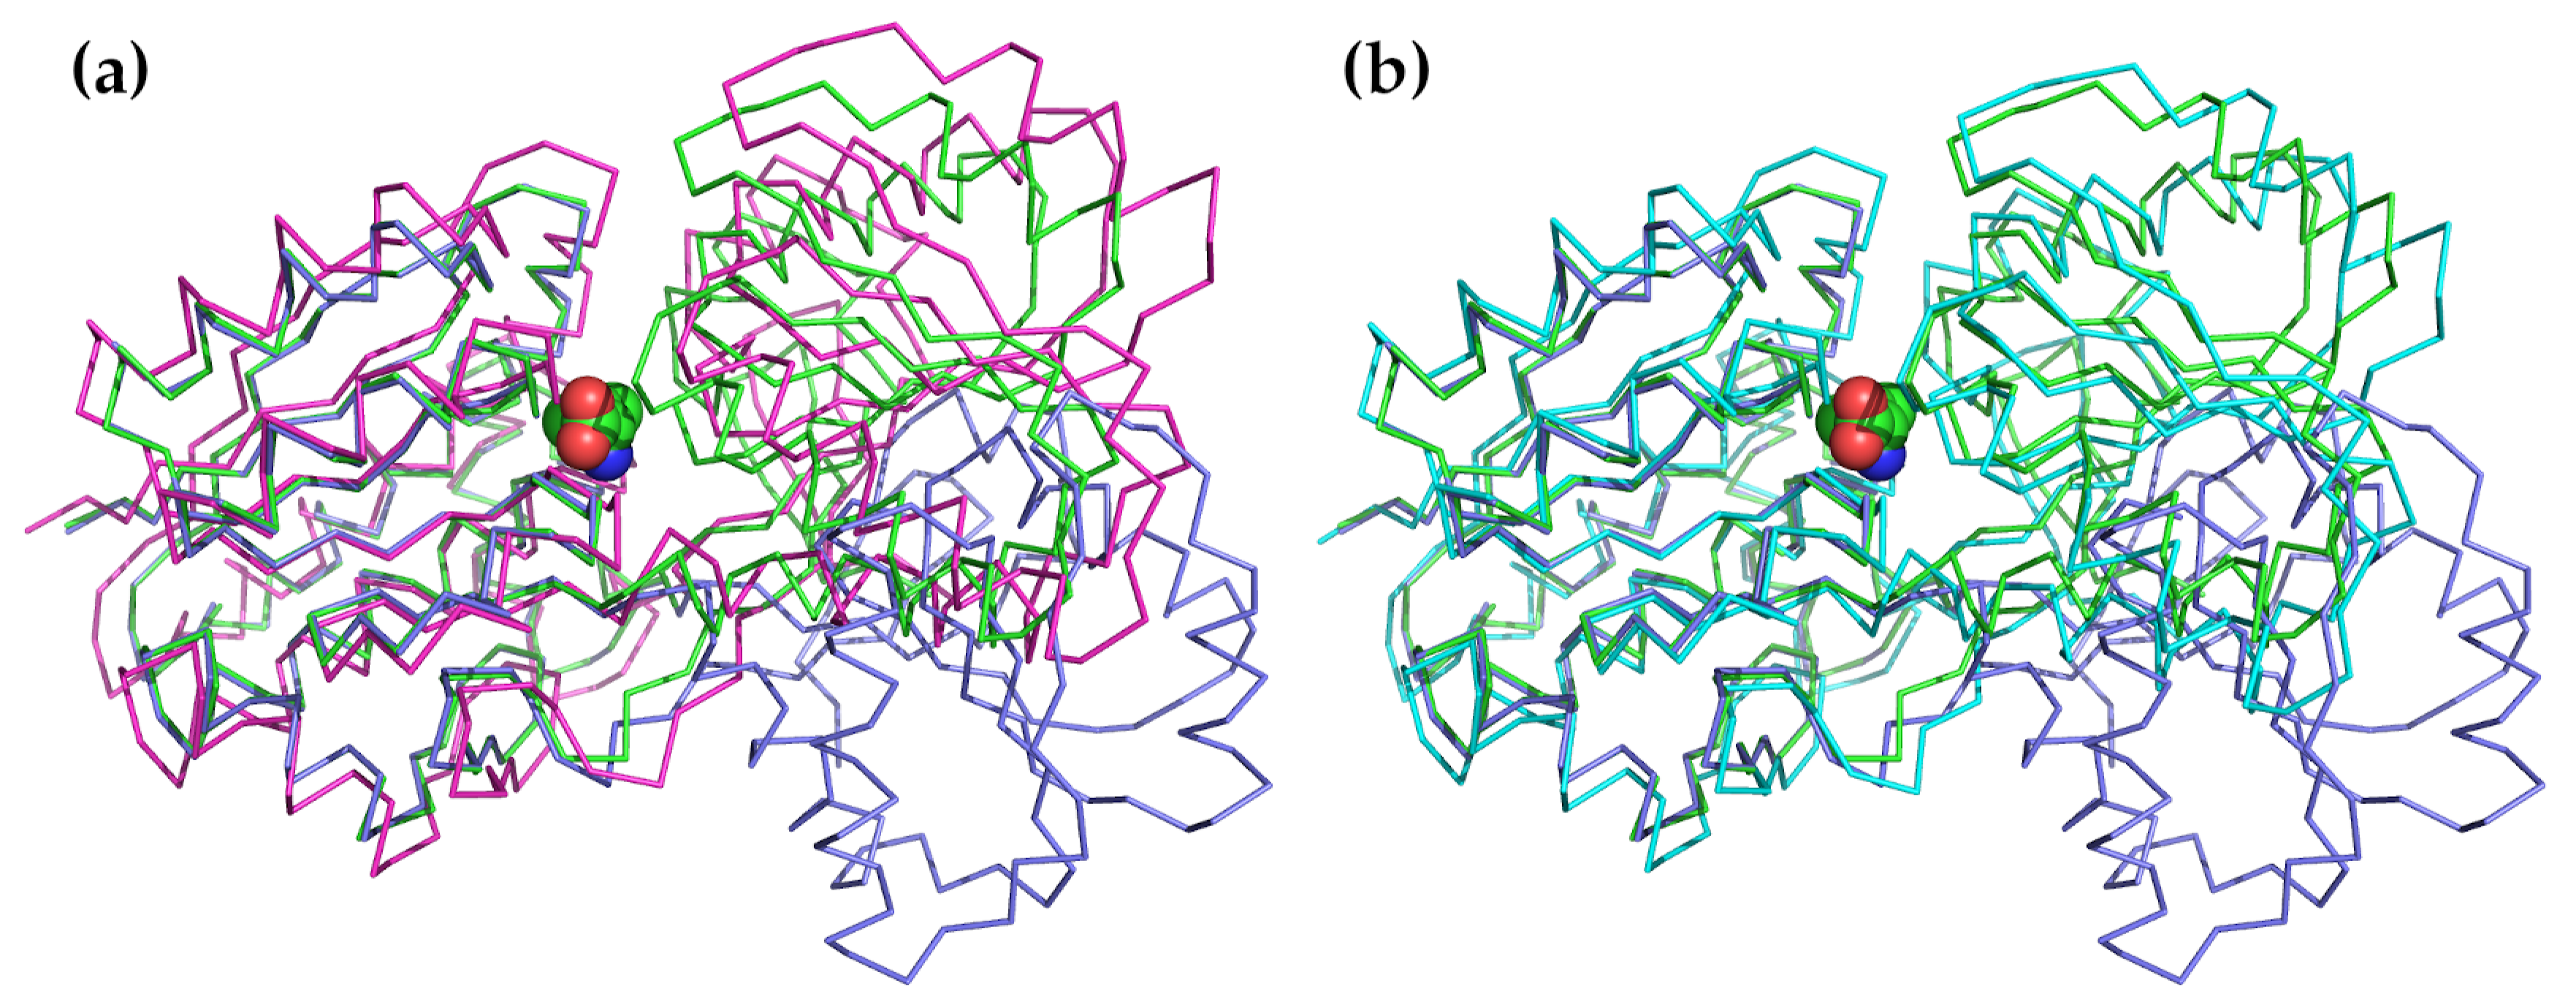
Table 1.
The most commonly used NMA web services.
| Service | url | Reference |
|---|---|---|
| ElNémo | http://www.sciences.univ-nantes.fr/elnemo/ | [20,68] |
| AD-ENM | https://enm.lobos.nih.gov/index.html | [104,105,106] |
| NOMAD-Ref | http://lorentz.immstr.pasteur.fr/nomad-ref.php | [107] |
| oGNM | https://dyn.life.nthu.edu.tw/oGNM/oGNM.php | [108] |
| iGNM | http://gnm.csb.pitt.edu/index.php | [109,110] |
| DynOmics | http://gnm.csb.pitt.edu/index.php | [111] |
| ANM 2.1 | http://anm.csb.pitt.edu/ | [112,113] |
| HingeProt | http://www.prc.boun.edu.tr/appserv/prc/hingeprot/hingeprot.html | [114] |
| MolMovDB | http://molmovdb.org/ | [115,116] |
| iMODS | http://imods.chaconlab.org/ | [117,118] |
| WEBnm@ | http://apps.cbu.uib.no/webnma/home | [120] |
© 2019 by the authors. Licensee MDPI, Basel, Switzerland. This article is an open access article distributed under the terms and conditions of the Creative Commons Attribution (CC BY) license (http://creativecommons.org/licenses/by/4.0/).
Share and Cite
MDPI and ACS Style
Bauer, J.A.; Pavlović, J.; Bauerová-Hlinková, V. Normal Mode Analysis as a Routine Part of a Structural Investigation. Molecules 2019, 24, 3293. https://0-doi-org.brum.beds.ac.uk/10.3390/molecules24183293
AMA Style
Bauer JA, Pavlović J, Bauerová-Hlinková V. Normal Mode Analysis as a Routine Part of a Structural Investigation. Molecules. 2019; 24(18):3293. https://0-doi-org.brum.beds.ac.uk/10.3390/molecules24183293
Chicago/Turabian StyleBauer, Jacob A., Jelena Pavlović, and Vladena Bauerová-Hlinková. 2019. "Normal Mode Analysis as a Routine Part of a Structural Investigation" Molecules 24, no. 18: 3293. https://0-doi-org.brum.beds.ac.uk/10.3390/molecules24183293