
Cellular Uptake of Silica and Gold Nanoparticles Induces Early Activation of Nuclear Receptor NR4A1

 , , , , and
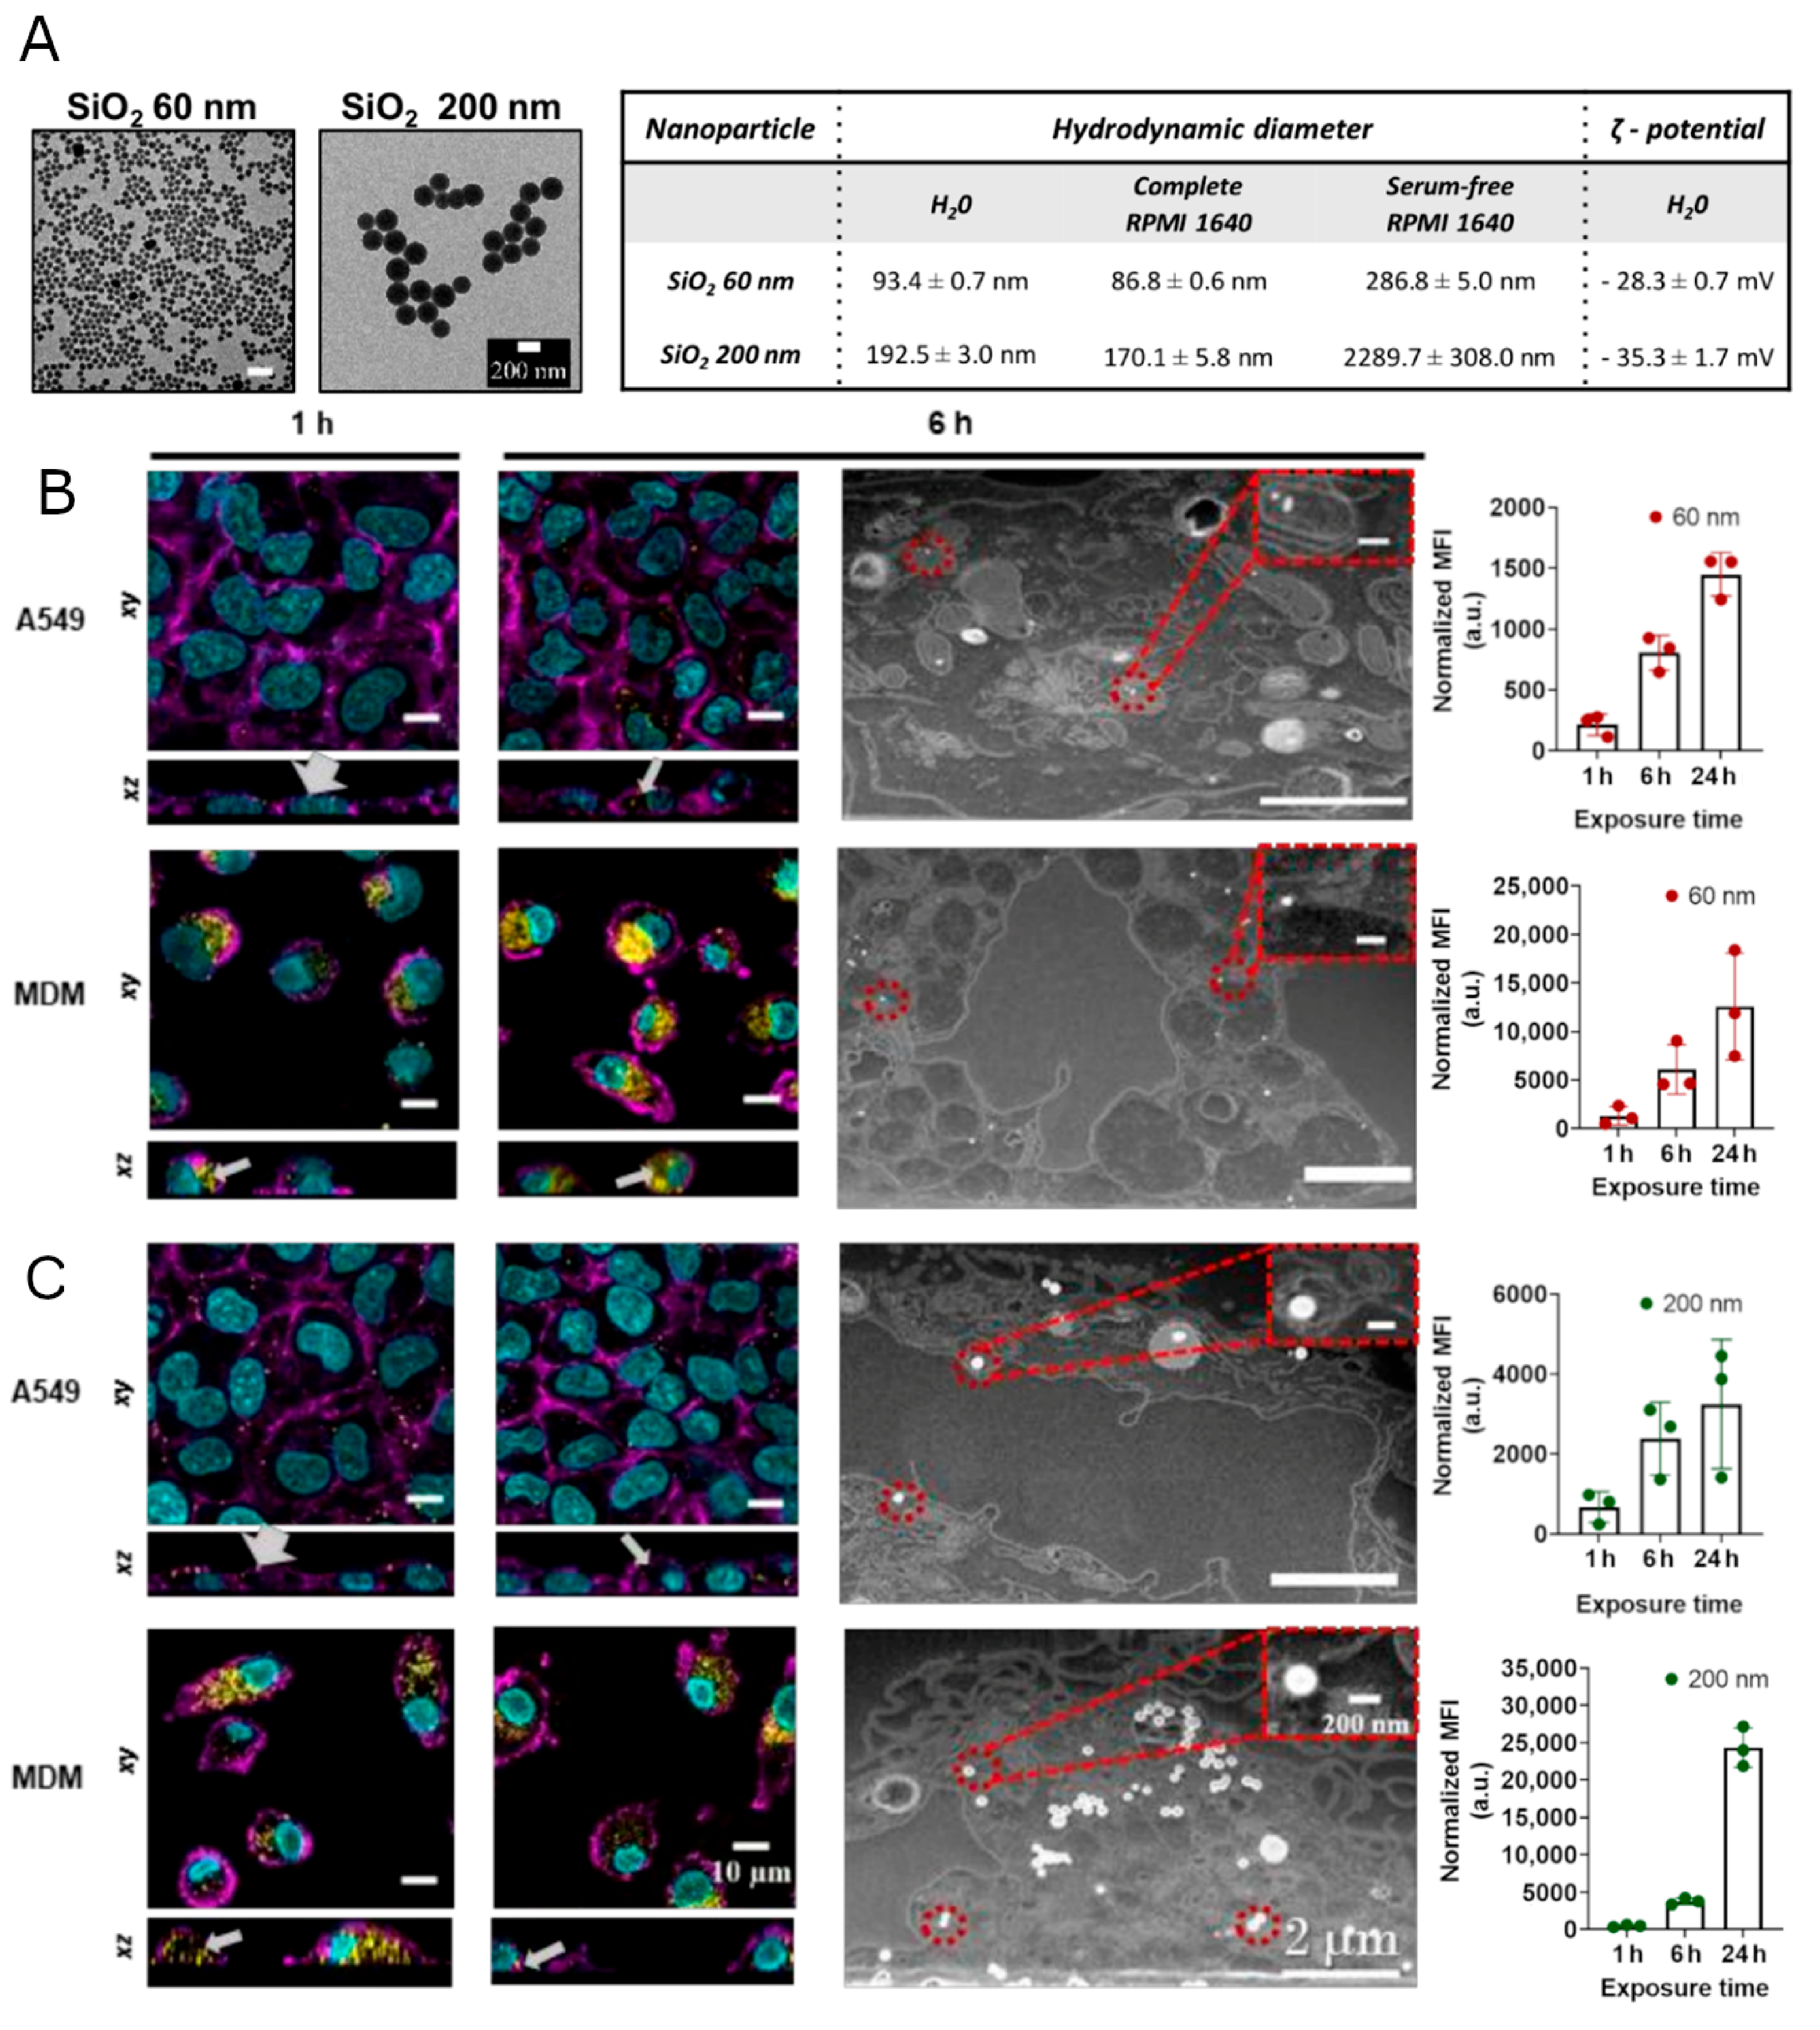
Abstract
:1. Introduction
2. Materials and Methods
2.1. Synthesis of Nonporous SiO2-Rhodamine B NPs
2.2. Synthesis of Au NPs
2.3. Fluoresbrite® Yellow-Green Polystyrene (PS)-Based Latex NPs
2.4. Physicochemical Characterization
2.5. Cell Culture
2.6. NPs Exposure
2.7. Cytotoxicity Assay
2.8. Flow Cytometry
2.9. Fluorescence Imaging
2.10. Co-Localization Analysis
2.11. Dye Leaching from SiO2-Rho B NPs
2.12. Focused Ion Beam-Scanning Electron Microscopy (FIB-SEM)
2.13. Total RNA Isolation and Illumina Sequencing (RNA-Seq)
2.14. Real-Time qRT-PCR
2.15. Western Blot
2.16. Statistical Analyses
3. Results and Discussion
3.1. Interaction and Localization of SiO2 NPs in MDMs and A549 Cells

3.2. Regulation of Gene and Protein Expression upon Uptake of SiO2 NPs

3.3. Expression of NR4A1 in Macrophages upon Exposure to Au and PS NPs

4. Conclusions
Supplementary Materials
Author Contributions
Funding
Data Availability Statement
Acknowledgments
Conflicts of Interest
References
- Bourquin, J.; Milosevic, A.; Hauser, D.; Lehner, R.; Blank, F.; Petri-Fink, A.; Rothen-Rutishauser, B. Biodistribution, Clearance, and Long-Term Fate of Clinically Relevant Nanomaterials. Adv. Mater. 2018, 30, 1704307. [Google Scholar] [CrossRef] [PubMed]
- Yildirimer, L.; Thanh, N.T.K.; Loizidou, M.; Seifalian, A.M. Toxicology and clinical potential of nanoparticles. Nano Today 2011, 6, 585–607. [Google Scholar] [CrossRef] [PubMed] [Green Version]
- Moore, T.L.; Rodriguez-Lorenzo, L.; Hirsch, V.; Balog, S.; Urban, D.; Jud, C.; Rothen-Rutishauser, B.; Lattuada, M.; Petri-Fink, A. Nanoparticle colloidal stability in cell culture media and impact on cellular interactions. Chem. Soc. Rev. 2015, 44, 6287–6305. [Google Scholar] [CrossRef] [PubMed] [Green Version]
- Shen, Z.; Ye, H.; Yi, X.; Li, Y. Membrane Wrapping Efficiency of Elastic Nanoparticles during Endocytosis: Size and Shape Matter. ACS Nano 2019, 13, 215–228. [Google Scholar] [CrossRef]
- Inoue, M.; Sakamoto, K.; Suzuki, A.; Nakai, S.; Ando, A.; Shiraki, Y.; Nakahara, Y.; Omura, M.; Enomoto, A.; Nakase, I.; et al. Size and surface modification of silica nanoparticles affect the severity of lung toxicity by modulating endosomal ROS generation in macrophages. Part. Fibre Toxicol. 2021, 18, 21. [Google Scholar] [CrossRef]
- Jiang, W.; Kim, B.Y.S.; Rutka, J.T.; Chan, W.C.W. Nanoparticle-mediated cellular response is size-dependent. Nat. Nanotechnol. 2008, 3, 145–150. [Google Scholar] [CrossRef]
- Sousa de Almeida, M.; Susnik, E.; Drasler, B.; Taladriz-Blanco, P.; Petri-Fink, A.; Rothen-Rutishauser, B. Understanding nanoparticle endocytosis to improve targeting strategies in nanomedicine. Chem. Soc. Rev. 2021. [Google Scholar] [CrossRef]
- Iversen, T.-G.; Skotland, T.; Sandvig, K. Endocytosis and intracellular transport of nanoparticles: Present knowledge and need for future studies. Nano Today 2011, 6, 176–185. [Google Scholar] [CrossRef]
- Park, J.H.; Oh, N. Endocytosis and exocytosis of nanoparticles in mammalian cells. Int. J. Nanomed. 2014, 9 (Suppl. 1), 51. [Google Scholar] [CrossRef] [Green Version]
- Yang, S.-A.; Choi, S.; Jeon, S.M.; Yu, J. Silica nanoparticle stability in biological media revisited. Sci. Rep. 2018, 8, 185. [Google Scholar] [CrossRef] [Green Version]
- Ding, L.; Yao, C.; Yin, X.; Li, C.; Huang, Y.; Wu, M.; Wang, B.; Guo, X.; Wang, Y.; Wu, M. Size, Shape, and Protein Corona Determine Cellular Uptake and Removal Mechanisms of Gold Nanoparticles. Small 2018, 14, 1801451. [Google Scholar] [CrossRef]
- Shapero, K.; Fenaroli, F.; Lynch, I.; Cottell, D.C.; Salvati, A.; Dawson, K.A. Time and space resolved uptake study of silicananoparticles by human cells. Mol. BioSyst. 2011, 7, 371–378. [Google Scholar] [CrossRef] [Green Version]
- Annika Mareike Gramatke, I.-L.H. Size and Cell Type Dependent Uptake of Silica Nanoparticles. J. Nanomed. Nanotechnol. 2014, 5. [Google Scholar] [CrossRef]
- Sun, D.; Gong, L.; Xie, J.; He, X.; Chen, S.; Luodan, A.; Li, Q.; Gu, Z.; Xu, H. Evaluating the toxicity of silicon dioxide nanoparticles on neural stem cells using RNA-Seq. RSC Adv. 2017, 7, 47552–47564. [Google Scholar] [CrossRef]
- Yazdimamaghani, M.; Moos, P.J.; Ghandehari, H. Global gene expression analysis of macrophage response induced by nonporous and porous silica nanoparticles. Nanomed. Nanotechnol. Biol. Med. 2018, 14, 533–545. [Google Scholar] [CrossRef]
- Murugadoss, S.; Lison, D.; Godderis, L.; Van Den Brule, S.; Mast, J.; Brassinne, F.; Sebaihi, N.; Hoet, P.H. Toxicology of silica nanoparticles: An update. Arch. Toxicol. 2017, 91, 2967–3010. [Google Scholar] [CrossRef]
- Uboldi, C.; Bonacchi, D.; Lorenzi, G.; Hermanns, M.I.; Pohl, C.; Baldi, G.; Unger, R.E.; Kirkpatrick, C.J. Gold nanoparticles induce cytotoxicity in the alveolar type-II cell lines A549 and NCIH441. Part. Fibre Toxicol. 2009, 6, 18. [Google Scholar] [CrossRef] [Green Version]
- Lin, C.; Zhao, X.; Sun, D.; Zhang, L.; Fang, W.; Zhu, T.; Wang, Q.; Liu, B.; Wei, S.; Chen, G.; et al. Transcriptional activation of follistatin by Nrf2 protects pulmonary epithelial cells against silica nanoparticle-induced oxidative stress. Sci. Rep. 2016, 6, 21133. [Google Scholar] [CrossRef] [Green Version]
- Zhao, X.; Wei, S.; Li, Z.; Lin, C.; Zhu, Z.; Sun, D.; Bai, R.; Qian, J.; Gao, X.; Chen, G.; et al. Autophagic flux blockage in alveolar epithelial cells is essential in silica nanoparticle-induced pulmonary fibrosis. Cell Death Dis. 2019, 10, 127. [Google Scholar] [CrossRef] [Green Version]
- Kusaka, T.; Nakayama, M.; Nakamura, K.; Ishimiya, M.; Furusawa, E.; Ogasawara, K. Effect of Silica Particle Size on Macrophage Inflammatory Responses. PLoS ONE 2014, 9, e92634. [Google Scholar] [CrossRef]
- Zhang, Q.; Hitchins, V.M.; Schrand, A.M.; Hussain, S.M.; Goering, P.L. Uptake of gold nanoparticles in murine macrophage cells without cytotoxicity or production of pro-inflammatory mediators. Nanotoxicology 2011, 5, 284–295. [Google Scholar] [CrossRef] [PubMed]
- Bachand, G.D.; Allen, A.; Bachand, M.; Achyuthan, K.E.; Seagrave, J.C.; Brozik, S.M. Cytotoxicity and inflammation in human alveolar epithelial cells following exposure to occupational levels of gold and silver nanoparticles. J. Nanoparticle Res. 2012, 14, 1212. [Google Scholar] [CrossRef]
- Vanhecke, D.; Kuhn, D.A.; de Aberasturi, D.J.; Balog, S.; Milosevic, A.; Urban, D.; Peckys, D.; de Jonge, N.; Parak, W.J.; Petri-Fink, A.; et al. Involvement of two uptake mechanisms of gold and iron oxide nanoparticles in a co-exposure scenario using mouse macrophages. Beilstein J. Nanotechnol. 2017, 8, 2396–2409. [Google Scholar] [CrossRef] [PubMed]
- Hoppstädter, J.; Seif, M.; Dembek, A.; Cavelius, C.; Huwer, H.; Kraegeloh, A.; Kiemer, A.K. M2 polarization enhances silica nanoparticle uptake by macrophages. Front. Pharmacol. 2015, 6, 1–12. [Google Scholar] [CrossRef] [Green Version]
- Hinderliter, P.M.; Minard, K.R.; Orr, G.; Chrisler, W.B.; Thrall, B.D.; Pounds, J.G.; Teeguarden, J.G. ISDD: A computational model of particle sedimentation, diffusion and target cell dosimetry for in vitro toxicity studies. Part. Fibre Toxicol. 2010, 7, 36. [Google Scholar] [CrossRef] [Green Version]
- Stöber, W.; Fink, A.; Bohn, E. Controlled growth of monodisperse silica spheres in the micron size range. J. Colloid Interface Sci. 1968, 26, 62–69. [Google Scholar] [CrossRef]
- Larson, D.R.; Ow, H.; Vishwasrao, H.D.; Heikal, A.A.; Wiesner, U.; Webb, W.W. Silica Nanoparticle Architecture Determines Radiative Properties of Encapsulated Fluorophores. Chem. Mater. 2008, 20, 2677–2684. [Google Scholar] [CrossRef]
- Brown, K.R.; Natan, M.J. Hydroxylamine Seeding of Colloidal Au Nanoparticles in Solution and on Surfaces. Langmuir 1998, 14, 726–728. [Google Scholar] [CrossRef]
- Brown, K.R.; Walter, D.G.; Natan, M.J. Seeding of Colloidal Au Nanoparticle Solutions. 2. Improved Control of Particle Size and Shape. Chem. Mater. 2000, 12, 306–313. [Google Scholar] [CrossRef]
- Enustun, B.V.; Turkevich, J. Coagulation of Colloidal Gold. J. Am. Chem. Soc. 1963, 85, 3317–3328. [Google Scholar] [CrossRef]
- Crippa, F.; Rodriguez-Lorenzo, L.; Hua, X.; Goris, B.; Bals, S.; Garitaonandia, J.S.; Balog, S.; Burnand, D.; Hirt, A.M.; Haeni, L.; et al. Phase Transformation of Superparamagnetic Iron Oxide Nanoparticles via Thermal Annealing: Implications for Hyperthermia Applications. ACS Appl. Nano Mater. 2019, 2, 4462–4470. [Google Scholar] [CrossRef] [Green Version]
- Lehmann, A.D.; Brandenberger, C.; Blank, F.; Gehr, P.; Rothen-Rutishauser, B. A 3D Model of the Human Epithelial Airway Barrier. Altern. Technol. Anim. Test. 2010, 14, 239–260. [Google Scholar]
- Barosova, H.; Drasler, B.; Petri-Fink, A.; Rothen-Rutishauser, B. Multicellular Human Alveolar Model Composed of Epithelial Cells and Primary Immune Cells for Hazard Assessment. J. Vis. Exp. 2020. [Google Scholar] [CrossRef]
- Petersen, E.J.; Hirsch, C.; Elliott, J.T.; Krug, H.F.; Aengenheister, L.; Arif, A.T.; Bogni, A.; Kinsner-Ovaskainen, A.; May, S.; Walser, T.; et al. Cause-and-Effect Analysis as a Tool To Improve the Reproducibility of Nanobioassays: Four Case Studies. Chem. Res. Toxicol. 2020, 33, 1039–1054. [Google Scholar] [CrossRef]
- Stauffer, W.; Sheng, H.; Lim, H.N. EzColocalization: An ImageJ plugin for visualizing and measuring colocalization in cells and organisms. Sci. Rep. 2018, 8, 15764. [Google Scholar] [CrossRef]
- Stopford, W.; Turner, J.; Cappellini, D.; Brock, T. Bioaccessibility testing of cobalt compounds. J. Environ. Monit. 2003, 5, 675. [Google Scholar] [CrossRef]
- Robinson, M.D.; Oshlack, A. A scaling normalization method for differential expression analysis of RNA-seq data. Genome Biol. 2010. [Google Scholar] [CrossRef] [Green Version]
- Ritchie, M.E.; Phipson, B.; Wu, D.; Hu, Y.; Law, C.W.; Shi, W.; Smyth, G.K. limma powers differential expression analyses for RNA-sequencing and microarray studies. Nucleic Acids Res. 2015, 43, e47. [Google Scholar] [CrossRef]
- Pfaffl, M.W. A new mathematical model for relative quantification in real-time RT-PCR. Nucleic Acids Res. 2001, 29, e45. [Google Scholar] [CrossRef]
- Zook, J.M.; MacCuspie, R.I.; Locascio, L.E.; Halter, M.D.; Elliott, J.T. Stable nanoparticle aggregates/agglomerates of different sizes and the effect of their size on hemolytic cytotoxicity. Nanotoxicology 2011, 5, 517–530. [Google Scholar] [CrossRef] [Green Version]
- Gunawan, C.; Lim, M.; Marquis, C.P.; Amal, R. Nanoparticle–protein corona complexes govern the biological fates and functions of nanoparticles. J. Mater. Chem. B 2014, 2, 2060. [Google Scholar] [CrossRef] [PubMed]
- Gustafson, H.H.; Holt-Casper, D.; Grainger, D.W.; Ghandehari, H. Nanoparticle uptake: The phagocyte problem. Nano Today 2015, 10, 487–510. [Google Scholar] [CrossRef] [PubMed] [Green Version]
- Rothen-Rutishauser, B.M.; Kiama, S.G.; Gehr, P. A Three-Dimensional Cellular Model of the Human Respiratory Tract to Study the Interaction with Particles. Am. J. Respir. Cell Mol. Biol. 2005, 32, 281–289. [Google Scholar] [CrossRef] [PubMed]
- Wang, X.-J.; Sun, Z.; Villeneuve, N.F.; Zhang, S.; Zhao, F.; Li, Y.; Chen, W.; Yi, X.; Zheng, W.; Wondrak, G.T.; et al. Nrf2 enhances resistance of cancer cells to chemotherapeutic drugs, the dark side of Nrf2. Carcinogenesis 2008, 29, 1235–1243. [Google Scholar] [CrossRef] [PubMed] [Green Version]
- Huotari, J.; Helenius, A. Endosome maturation. EMBO J. 2011, 30, 3481–3500. [Google Scholar] [CrossRef] [PubMed]
- Keller, S.; Berghoff, K.; Kress, H. Phagosomal transport depends strongly on phagosome size. Sci. Rep. 2017, 7, 17068. [Google Scholar] [CrossRef] [Green Version]
- Bourquin, J.; Septiadi, D.; Vanhecke, D.; Balog, S.; Steinmetz, L.; Spuch-Calvar, M.; Taladriz-Blanco, P.; Petri-Fink, A.; Rothen-Rutishauser, B. Reduction of Nanoparticle Load in Cells by Mitosis but Not Exocytosis. ACS Nano 2019, 13, 7759–7770. [Google Scholar] [CrossRef]
- Longmire, M.; Choyke, P.L.; Kobayashi, H. Clearance properties of nano-sized particles and molecules as imaging agents: Considerations and caveats. Nanomedicine 2008, 3, 703–717. [Google Scholar] [CrossRef] [Green Version]
- Kim, S.O.; Ono, K.; Tobias, P.S.; Han, J. Orphan Nuclear Receptor Nur77 Is Involved in Caspase-independent Macrophage Cell Death. J. Exp. Med. 2003, 197, 1441–1452. [Google Scholar] [CrossRef]
- Koenis, D.S.; Medzikovic, L.; van Loenen, P.B.; van Weeghel, M.; Huveneers, S.; Vos, M.; Evers-van Gogh, I.J.; Van den Bossche, J.; Speijer, D.; Kim, Y.; et al. Nuclear Receptor Nur77 Limits the Macrophage Inflammatory Response through Transcriptional Reprogramming of Mitochondrial Metabolism. Cell Rep. 2018, 24, 2127–2140.e7. [Google Scholar] [CrossRef] [Green Version]
- Hamers, A.A.J.; Argmann, C.; Moerland, P.D.; Koenis, D.S.; Marinković, G.; Sokolović, M.; de Vos, A.F.; de Vries, C.J.M.; van Tiel, C.M. Nur77-deficiency in bone marrow-derived macrophages modulates inflammatory responses, extracellular matrix homeostasis, phagocytosis and tolerance. BMC Genom. 2016, 17, 162. [Google Scholar] [CrossRef] [Green Version]
- Waters, K.M.; Masiello, L.M.; Zangar, R.C.; Tarasevich, B.J.; Karin, N.J.; Quesenberry, R.D.; Bandyopadhyay, S.; Teeguarden, J.G.; Pounds, J.G.; Thrall, B.D. Macrophage Responses to Silica Nanoparticles are Highly Conserved across Particle Sizes. Toxicol. Sci. 2009, 107, 553–569. [Google Scholar] [CrossRef] [Green Version]
- Kersting, M.; Olejnik, M.; Rosenkranz, N.; Loza, K.; Breisch, M.; Rostek, A.; Westphal, G.; Bünger, J.; Ziegler, N.; Ludwig, A.; et al. Subtoxic cell responses to silica particles with different size and shape. Sci. Rep. 2020, 10, 21591. [Google Scholar] [CrossRef]
- Dalzon, B.; Aude-Garcia, C.; Collin-Faure, V.; Diemer, H.; Béal, D.; Dussert, F.; Fenel, D.; Schoehn, G.; Cianférani, S.; Carrière, M.; et al. Differential proteomics highlights macrophage-specific responses to amorphous silica nanoparticles. Nanoscale 2017, 9, 9641–9658. [Google Scholar] [CrossRef] [Green Version]
- Chen, L.; Liu, J.; Zhang, Y.; Zhang, G.; Kang, Y.; Chen, A.; Feng, X.; Shao, L. The toxicity of silica nanoparticles to the immune system. Nanomedicine 2018, 13, 1939–1962. [Google Scholar] [CrossRef] [Green Version]
- Fedeli, C.; Segat, D.; Tavano, R.; Bubacco, L.; De Franceschi, G.; de Laureto, P.P.; Lubian, E.; Selvestrel, F.; Mancin, F.; Papini, E. The functional dissection of the plasma corona of SiO 2 -NPs spots histidine rich glycoprotein as a major player able to hamper nanoparticle capture by macrophages. Nanoscale 2015, 7, 17710–17728. [Google Scholar] [CrossRef]
- Francia, V.; Yang, K.; Deville, S.; Reker-Smit, C.; Nelissen, I.; Salvati, A. Corona Composition Can Affect the Mechanisms Cells Use to Internalize Nanoparticles. ACS Nano 2019, 13, 11107–11121. [Google Scholar] [CrossRef]
- Maier, T.; Güell, M.; Serrano, L. Correlation of mRNA and protein in complex biological samples. FEBS Lett. 2009, 583, 3966–3973. [Google Scholar] [CrossRef] [Green Version]
- Schmid, O.; Stoeger, T. Surface area is the biologically most effective dose metric for acute nanoparticle toxicity in the lung. J. Aerosol Sci. 2016, 99, 133–143. [Google Scholar] [CrossRef] [Green Version]
- Kou, L.; Sun, J.; Zhai, Y.; He, Z. The endocytosis and intracellular fate of nanomedicines: Implication for rational design. Asian J. Pharm. Sci. 2013, 8, 1–10. [Google Scholar] [CrossRef] [Green Version]
- Konduru, N.V.; Molina, R.M.; Swami, A.; Damiani, F.; Pyrgiotakis, G.; Lin, P.; Andreozzi, P.; Donaghey, T.C.; Demokritou, P.; Krol, S.; et al. Protein corona: Implications for nanoparticle interactions with pulmonary cells. Part. Fibre Toxicol. 2017, 14, 42. [Google Scholar] [CrossRef] [PubMed] [Green Version]
- Tabish, T.A.; Dey, P.; Mosca, S.; Salimi, M.; Palombo, F.; Matousek, P.; Stone, N. Smart Gold Nanostructures for Light Mediated Cancer Theranostics: Combining Optical Diagnostics with Photothermal Therapy. Adv. Sci. 2020, 7, 1903441. [Google Scholar] [CrossRef] [PubMed]


Publisher’s Note: MDPI stays neutral with regard to jurisdictional claims in published maps and institutional affiliations. |
© 2022 by the authors. Licensee MDPI, Basel, Switzerland. This article is an open access article distributed under the terms and conditions of the Creative Commons Attribution (CC BY) license (https://creativecommons.org/licenses/by/4.0/).
Share and Cite
Sousa de Almeida, M.; Taladriz-Blanco, P.; Drasler, B.; Balog, S.; Yajan, P.; Petri-Fink, A.; Rothen-Rutishauser, B. Cellular Uptake of Silica and Gold Nanoparticles Induces Early Activation of Nuclear Receptor NR4A1. Nanomaterials 2022, 12, 690. https://0-doi-org.brum.beds.ac.uk/10.3390/nano12040690
Sousa de Almeida M, Taladriz-Blanco P, Drasler B, Balog S, Yajan P, Petri-Fink A, Rothen-Rutishauser B. Cellular Uptake of Silica and Gold Nanoparticles Induces Early Activation of Nuclear Receptor NR4A1. Nanomaterials. 2022; 12(4):690. https://0-doi-org.brum.beds.ac.uk/10.3390/nano12040690
Chicago/Turabian StyleSousa de Almeida, Mauro, Patricia Taladriz-Blanco, Barbara Drasler, Sandor Balog, Phattadon Yajan, Alke Petri-Fink, and Barbara Rothen-Rutishauser. 2022. "Cellular Uptake of Silica and Gold Nanoparticles Induces Early Activation of Nuclear Receptor NR4A1" Nanomaterials 12, no. 4: 690. https://0-doi-org.brum.beds.ac.uk/10.3390/nano12040690