Article

Nutritionally Optimized, Culturally Acceptable, Cost-Minimized Diets for Low Income Ghanaian Families Using Linear Programming

by
Esa-Pekka A. Nykänen
1,
Hanna E. Dunning
1,
Richmond N. O. Aryeetey
2,
Aileen Robertson
1 and
Alexandr Parlesak
1,*
1
Institute for Nursing and Nutrition, Faculty of Health, Global Nutrition and Health, University College Copenhagen, Sigurdsgade 26, 2200 Copenhagen, Denmark
2
Department of Population, Family and Reproductive Health, University of Ghana, LG 13 Legon, Accra, Ghana
*
Author to whom correspondence should be addressed.
Submission received: 11 March 2018 / Revised: 29 March 2018 / Accepted: 3 April 2018 / Published: 7 April 2018

Abstract

:
The Ghanaian population suffers from a double burden of malnutrition. Cost of food is considered a barrier to achieving a health-promoting diet. Food prices were collected in major cities and in rural areas in southern Ghana. Linear programming (LP) was used to calculate nutritionally optimized diets (food baskets (FBs)) for a low-income Ghanaian family of four that fulfilled energy and nutrient recommendations in both rural and urban settings. Calculations included implementing cultural acceptability for families living in extreme and moderate poverty (food budget under USD 1.9 and 3.1 per day respectively). Energy-appropriate FBs minimized for cost, following Food Balance Sheets (FBS), lacked key micronutrients such as iodine, vitamin B12 and iron for the mothers. Nutritionally adequate FBs were achieved in all settings when optimizing for a diet cheaper than USD 3.1. However, when delimiting cost to USD 1.9 in rural areas, wild foods had to be included in order to meet nutritional adequacy. Optimization suggested to reduce roots, tubers and fruits and to increase cereals, vegetables and oil-bearing crops compared with FBS. LP is a useful tool to design culturally acceptable diets at minimum cost for low-income Ghanaian families to help advise national authorities how to overcome the double burden of malnutrition.

1. Introduction

The Ghanaian population is experiencing a nutrition transition where a double burden of both undernutrition and an increasing prevalence of obesity and non-communicable diseases exist [1,2]. Malnutrition has remained the top cause of disability-adjusted-life-years in Ghana for the last twelve years [3].
Forty-two percent of women and 66% of children aged 6–59 months have either mild, moderate or severe anaemia [4]. The current level of iodine deficiency is considered to be “high and of major public health significance” by World Health Organization (WHO) standards [5]. Six percent of the women and 10% of the men are underweight (Body-mass index < 18.5) [4]. Nineteen percent of the Ghanaian children are stunted, with those residing in rural areas more likely to be stunted (22%) compared to those living in urban areas (15%) [4]. The consequences of stunting are high child mortality and morbidity, reduced cognitive development, productivity loss associated with care of sick children [6] and weakened national productivity [7]. Long term consequences include lower academic achievement, lower economic productivity in adulthood and poor maternal reproductive outcomes [8].
While undernutrition persists, simultaneously there is a growing prevalence of diet-related non-communicable diseases. Around one quarter of adults (27.8% of women and 21.8% of men) are overweight and 21.9% and 6.0% respectively are obese [9]. Increases in prevalence have been observed over the past 18 years and prevalence is higher in urban areas [9]. High prevalence of obesity leads to increased risk of hypertension, dyslipidaemia, type 2 diabetes and cerebrovascular diseases and is associated with a higher premature mortality [10]. For example, the incidence of both cerebrovascular and ischemic heart disease has increased by 15% each between 2005 and 2016 [3].
Intake of a diverse diet rich with micronutrients can help reduce the double burden of diet related diseases but lower income groups may not be able to afford the cost [11,12]. Around one third of the Ghanaian population live on USD 3.1 (Ghanaian Cedi, GHS 11.9) or less and one in eight on USD 1.9 (GHS 7.3) or less per day [13].
Linear programming (LP) is a useful tool for constructing fully nutritious and health-promoting diets optimized for cost-efficiency [14,15,16,17]. LP can be used to help advice policy makers which local foods can be recommended as being the most cost-effective [12]. The production of these foods can be supported by the government and their consumption promoted within the Dietary and Physical Activity Guidelines for Ghana [18,19]. Constraints based on national food consumption patterns can be built in to the analysis in an effort to achieve social acceptability [12,20].
The main goal of this study is to create a list of affordable foods (food baskets, FBs) that fulfil all Ghanaian nutrient recommendations while also helping to reduce risk of diet related non-communicable disease for low-income families of four. This can help authorities to design appropriate food production policies and refine their food based dietary guidelines.

2. Materials and Methods

2.1. Food Prices

Food prices were collected from a total of 11 urban market places and supermarkets in the Greater Accra, Central and Ashanti regions and from 8 rural market places from the Ashanti and Volta regions between February and April 2016. Depending on availability, prices were collected for a total of 266 food items in urban and 141 food items in rural areas. Between 1 and 11 prices for each food item were collected from supermarkets (urban only), corner stores, hawkers and market places. The median price of each item was used to minimize the effect of any outliers. Only the prices of raw or minimally processed foods were collected. Foods such as cheese, groundnut paste and local dishes such as “kenkey fante” (fermented ground corn), which were widely eaten, were included (Table S1). The prices were collected between February and April 2016 by local staff. Locals were hired to minimize any bias resulting by foods being more expensive if bought by non-Ghanaians. Information regarding the availability of wild foods, which could be harvested or collected at no financial cost, such as Jute (bush-okra) leaves, moringa leaves and giant African snails, was obtained from agriculture teachers working at the local Ngleshie Amanfro Senior High School.

2.2. Nutrient Contents

As much as possible, the West African food composition tables were used (Food and Agriculture Organization of the United Nations (FAO) [21]. Other sources used for nutrient composition included: Mozambican [22], American (SR28) [23], British (CoFID) [24], Danish (FoodData) [25], Finnish (Fineli) [26] and Norwegian [27] food composition databases. The nutrient values for cooked items were used when appropriate. The non-edible proportion of each food was calculated such as skin, stones and bones. Missing nutrient values were obtained from peer reviewed published articles [28,29] or by using values of similar varieties of foods. For processed foods (e.g., canned mackerel in tomato sauce) the nutrient values for each ingredient were calculated.

2.3. Recommended Energy and Nutrient Intakes

The lower and upper boundaries for the recommended energy intakes (REIs) and recommended nutrient intakes (RNIs) for each family member were obtained from FAO and WHO (Table 1) [30,31]. The mean urban and rural household sizes in Ghana are 3.5 and 4.3, respectively [32]. Therefore, a Ghanaian food basket (FB) was created for an average family of four: 18–29.9-year-old woman (65 kg body weight and an assumed physical activity level of 1.75 (moderately active category [30])); 30–59.9-year-old man (65 kg bodyweight and an assumed physical activity level of 1.75); 5–5.9-year-old boy; and an 8–8.9-year-old girl. The estimates of body weight were based on the Ghanaian Demographic and Health Survey 2014 [4].

2.4. Optimization of the Local Food Baskets Using Linear Programming

Linear programming (LP) is an algorithm for maximizing or minimizing a given linear function for a set of constraints. LP is characterized by 3 features: the goal function, the decision variables and a list of linear constraints [33]. In the initial calculations, the goal function is the sum of the cost of each food in the FB; the decision variables consist of the weight of each food in the FB; and the linear constraints consist of the energy and nutrient recommendations (Table 1). To apply the algorithm to solve the LP system of inequalities, Microsoft Excel was used along with the open-source add-in OpenSolver [34].
The underlying objective function is defined as:
G D = c 0 + c 1 X 1 + c 2 X 2 +   + c n X n ,
In Equation (1), GD stands for the goal determinant (e.g., total cost of the FB), c is the food-specific constant (e.g., specific cost in Cedi/kg food) and X is the amount of the corresponding food. Two different LP models with two different GDs were applied in the current study: either the total cost of the family member’s FB or the total departure from Ghanaian food supply patterns as reported by FAO’s Food Balance Sheets (see below) [35]. Both GDs, total cost and total deviation from prevailing food supply, were minimized. The implementation of the (non-linear) abs function into LP was done as described in detail by Darmon et al. [12].
All calculated models were subjected to constraints of nutritional adequacy, meaning that all nutrient contents of all reported food baskets were within the ranges as indicated in Table 1. The energy content of all FBs was set to meet the recommendations on energy intake by FAO/WHO [30].
Three different FBs were calculated, depending on urban or rural settings and whether or not wild foods were included:
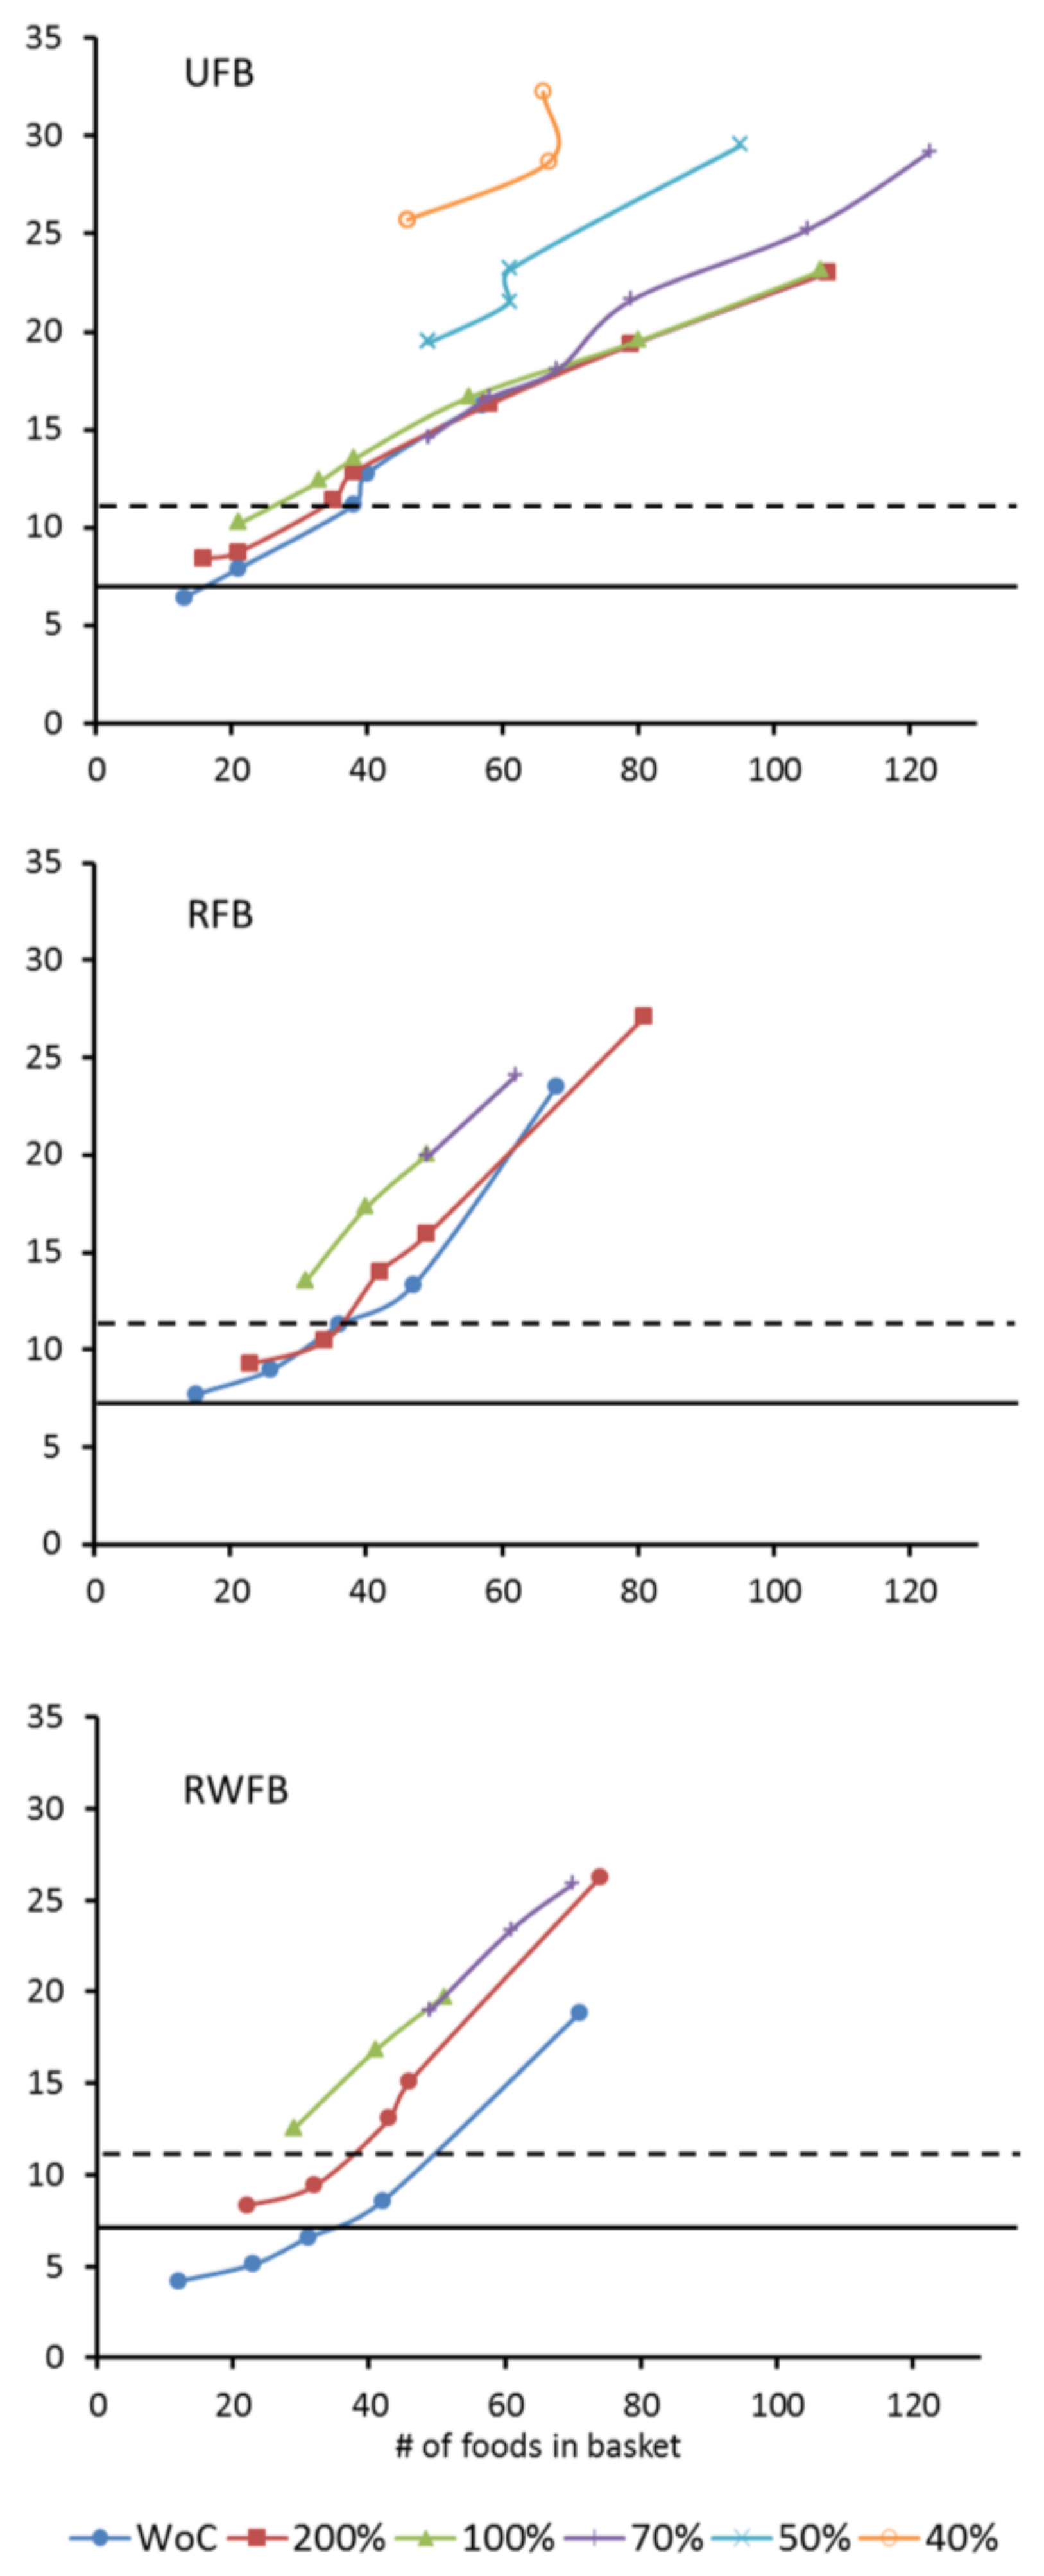
  • An urban food basket (UFB): foods available in supermarkets and market places in the cities of Accra, Kasoa, Ngleshi Amanfro, Cape Coast and Kumasi.
  • A rural food basket (RFB): foods available in market places in the rural areas of Abono, Amedzofe, Vane, Fume and Kpedze.
  • A rural wild food basket (RWFB): foods available in rural market places, similar to RFB, plus locally available wild foods.
After the WHO/FAO energy and nutrient recommendations for each family member were satisfied (Table 1), the family’s FB was calculated by merging each of the 4 family members’ lists of foods into one FB. To optimize for social and cultural acceptability, the following two constraints were incorporated into the LP models that used the total cost as GD (Models i and ii):
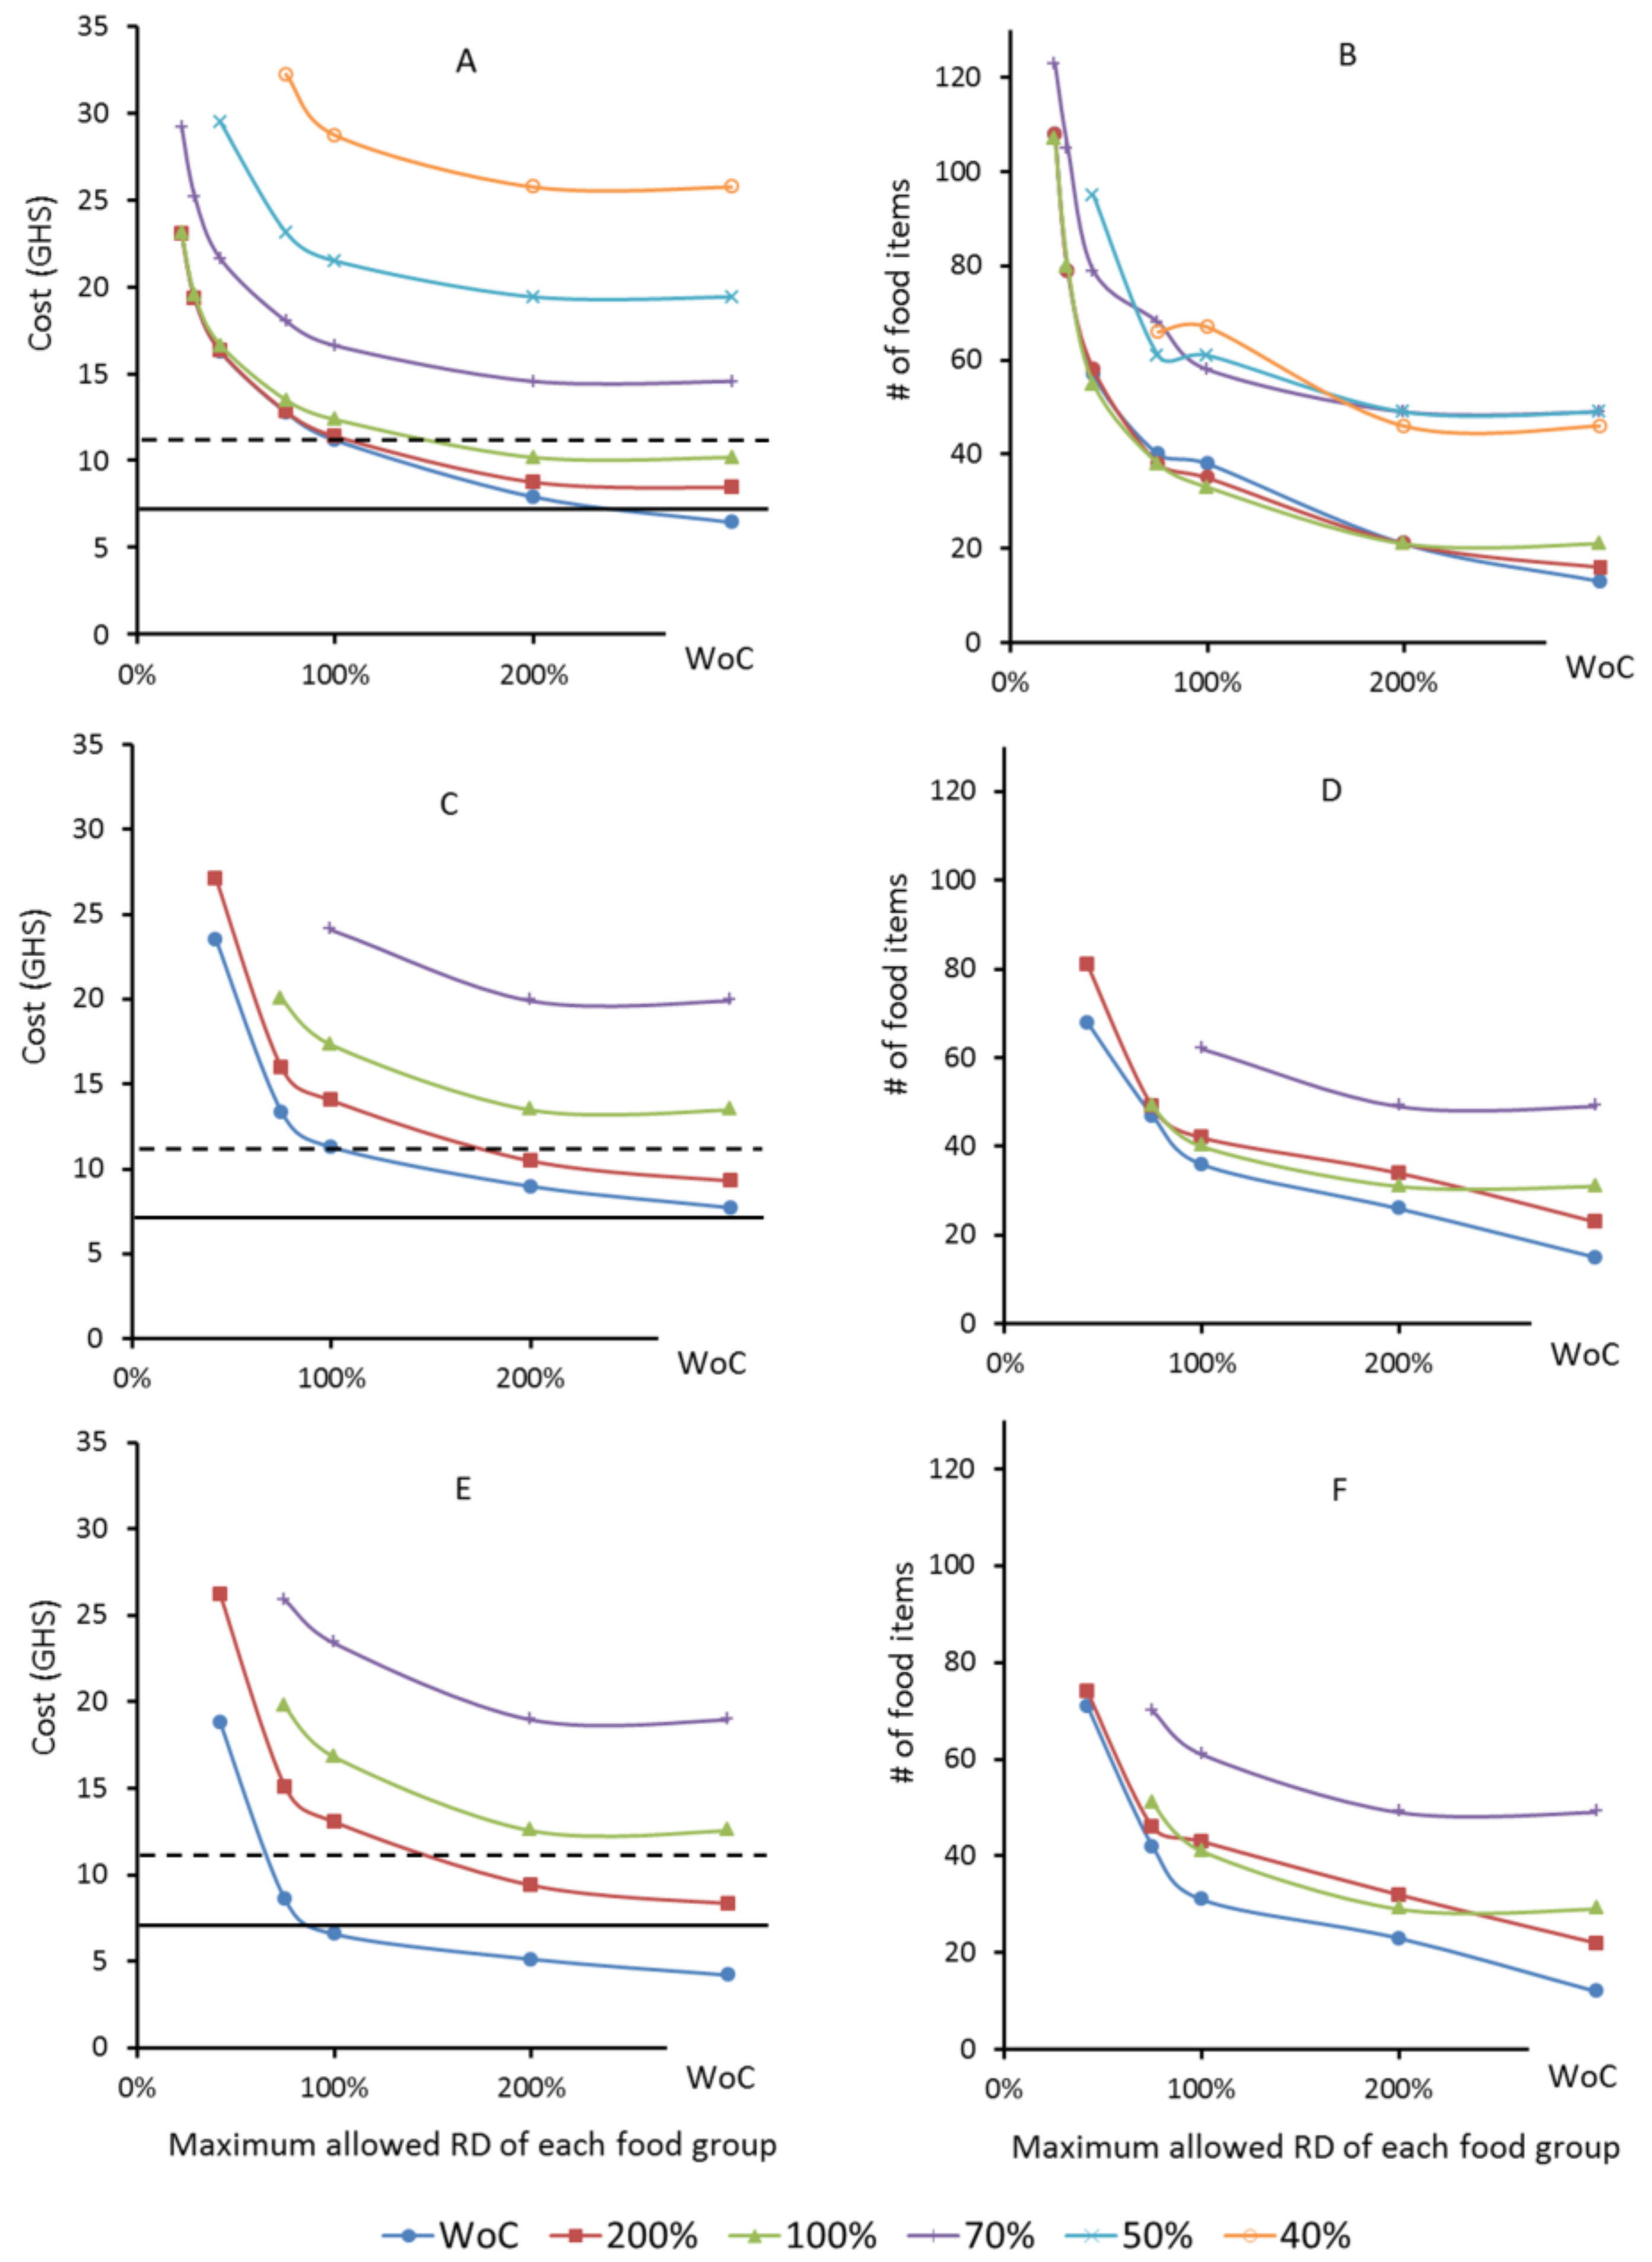
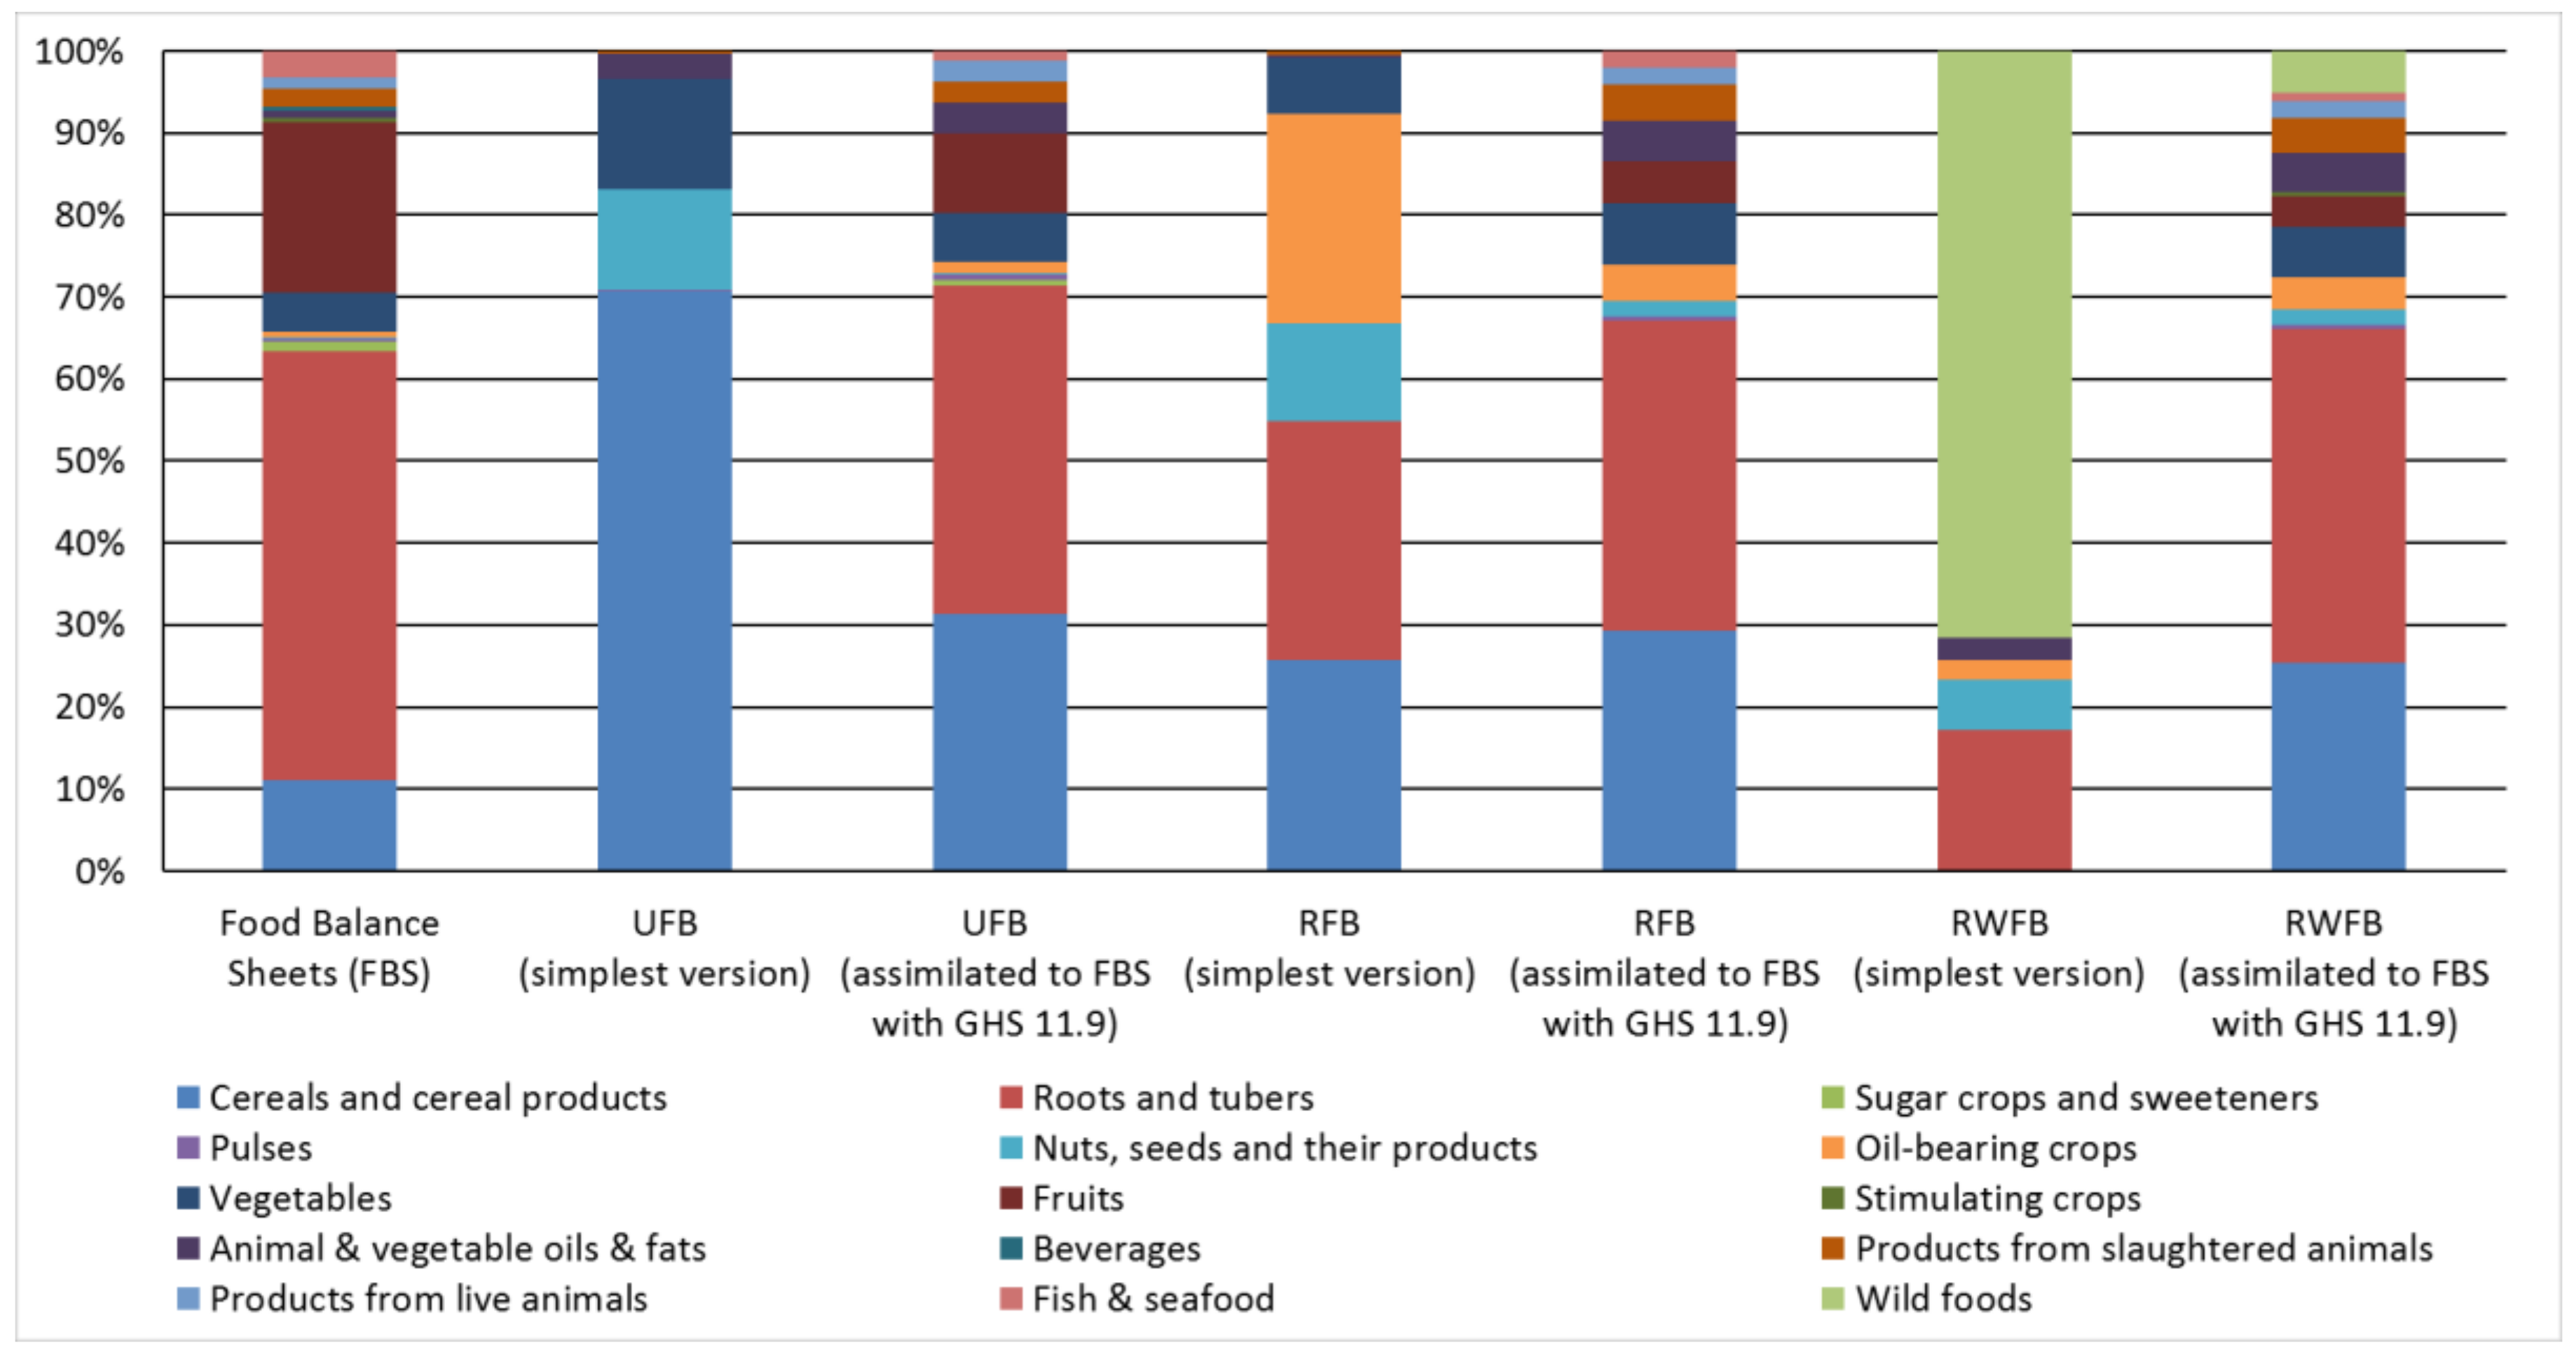
  • Groups of foods, in the FB, were constrained progressively into proportions that deviate as little as possible from those reported in the Food Balance Sheets (FBS) for Ghana from 2011 [35]. The total Relative Deviation (RD) for each food group was calculated as the sum of all relative differences between the FBS values minus the sum of foods contained in each food group in the FB:
    R D = i = 1 n abs ( m i M i ) M i ,
    In Equation (2), mi stands for the summed weights of all raw foods in a category, Mi stands for the food supply of the corresponding category and i represents the running index of the categories (n = 31 in total, Table S1). The cost and the composition of the FB were calculated in a stepwise manner based on constrained maximum RDs per food group (200%, 100%, 70%, 50% and 40%). Constraining the RD resulted in a weight delimitation of the foods in the optimized FBs for each category (as indicated in Supplementary Table 1) that guaranteed a similarity to the prevailing FBS. The lower the delimiting value of RD, the more similar the resulting FB matched the food supply spectrum of the FBS [35].
  • In order to prevent having to eat the same monotonous diet every day and to diversify the diet, the weight of a single food within its group was constrained to a maximum in a stepwise manner (200%, 100%, 70%, 50% and 40%). For example, to enforce a minimum of 3 different foods in a group, the contribution of each food was limited to below 50% of the food group’s weight.
  • In a third model, the GD to be minimized for was set to be the total RD. When calculating the FBs that were most similar to the FAO’s Food Balance Sheets (FBS), the goal function of LP was changed to minimum absolute values of the sum of all RDs [12,15], while all nutritional constraints were maintained. Cost was constrained to rates of extreme and moderate poverty of USD 1.9 (GHS 7.3) or USD 3.1 (GHS 11.9) per adult per day [13] where about half of the average household income is spent on food and beverages [36]. To avoid unrealistically small amounts of food, which cannot be purchased, these FBs were calculated on a one-month basis.

3. Results

3.1. Cost-Minimized Food Baskets Similar to FBS to Fulfil Recommended Energy Intake (REI) Only

Cost-minimized FBs for Ghanaian families of four, similar to the Ghanaian FBS (maximum RD = 0%) and fulfilling all the REIs but without applying constraints for recommended micronutrient intakes, showed a relative shortfall of calcium, iodine, riboflavin, folate and niacin in both urban and rural settings within the ranges of 37–46%, 38–42%, 48–64%, 73–78% and 65–78%, respectively, depending on the setting. Vitamins A and B12 recommendations were met by 35% and 57% respectively but only in the urban basket. The recommended intake of iron for mothers was not achieved in any of these baskets (44–54% compared with recommendations).

3.2. Simple Optimized Food Basket Solutions

The nutrient shortfall described above could be overcome by using 12–13 foods (Table 2) at a total cost of GHS 6.4 and GHS 7.7 (USD 1.7 and USD 2.0) per day, respectively, for an urban (UFB) and rural (RFB) family of four. When wild local foods were incorporated into the RFB the cost could be reduced to GHS 4.2 (USD 1.1) per day (Table 2) with over two thirds of its total weight consisting of wild foods, mostly green leafy vegetables.
In both the UFB and RFB, beef liver was the only animal food selected and this contributed to less than 1% of their total weight. Sugar crops (i.e., sugar cane), oil-bearing and stimulating crops (i.e., coffee, fruits, products from live animals (e.g., eggs or milk), fish and seafood were not selected by LP for the simplest versions of the UFB and the RFB (Table 2). The RWFB contained considerable amounts of giant African snails (Table 2).
The micronutrients determining the cost of the FBs were the minimum recommendation levels for calcium, iodine, riboflavin, niacin, vitamins B12 and C along with the polyunsaturated fatty acids (Table 3). Similarly, the upper limit recommendations for protein, saturated fatty acids and total sugar constrained the cost. Vitamins A and E, folate and iron were constraints only in urban or rural settings (Table 3). Achieving the recommendations for these nutrients automatically meant that all the other nutrients listed in Table 1 were covered. Interestingly, if a higher recommended level of protein was permitted, the overall cost of the basket would drop.

3.3. Cost of Increasing Dietary Diversity

Only a few foods (11–14) are needed to cover all nutrient recommendations for one day (Table 2). Subsequently, the composition and cost of 69 additional FBs were calculated, all of which met the energy and nutrient recommendations. The proportion of each food was limited within each food group to ensure a greater daily variation. The number of foods in urban and rural FBs increased from 13 up to 108 and from 14 up to 68 respectively. If wild foods were incorporated into the rural basket the number of foods rose from 11 up to 71 (Figure 1). As the number of foods increased so did the cost: up to GHS 23.0, 23.5 and 18.8 (USD 6.0, 6.1 and 4.9) per day for the UFB, RFB and RWFB, respectively.

3.4. Alignment of the Food Baskets with Food Balance Sheets (FBS)

Meeting all FAO and WHO nutrient recommendations for a family of four required a minimum of 23% averaged RD from the Ghanaian FBS in the urban areas, whereas in both of the rural scenarios a minimum of 42% averaged RD had to be allowed (Figure 1). Increasing the similarity of the FBs to the FBS was associated with a higher variety of foods and considerably increased cost (Figure 1). Thus, the more similar the FBs are to Ghanaian FBS, the more expensive they become (Figure 1) and a greater variety of food also results in higher cost (Figure 2).
The total energy per capita based on the Ghanaian FBS was 2940 kcal/day [35]. To achieve a feasible total weight of foods for each family member, the weight of each FBS category was standardized according to the corresponding recommended energy intake (e.g., 2550 kcal/day for the mother, Table 1). For example, according to the FBS the supply of maize and maize products per capita is 222 g per day, which standardized for the mother’s basket equalled 193 g per day (222 g × 2550 kcal/2940 kcal).

3.5. Food Baskets That Are Affordable for Families Living on Only USD 1.9 Per Day

FBs, calculated for budgets of GHS 7.3 (USD 1.9) per day per family and optimized for similarity with FBS, resulted in 22 foods being selected for the urban basket (Table 4). In rural areas, GHS 7.3 per day was not enough to cover the cost of a basket that would meet all energy and nutrient recommendations (Table 2) without including wild foods in the FBs. Inclusion of wild foods resulted in a FB consisting of 30 food items (Table 4). Cassava and maize products, such as banku flour, comprised about three quarters of the total weight of the UFB and animal foods contributed to less than 1% of the total weight. In rural areas, more than one quarter of the total weight came from wild foods such as mango, moringa and giant African snails. The share of animal foods in the RWFB was less than 4%.

3.6. Food Baskets That Are Affordable for Families Living on USD 3.1 Per Day

Monthly FBs that were optimized for similarity with the FBS, on USD 3.1 (GHS 11.9) per day, comprised of 36, 31 and 39 foods for the UFB, RFB and RWFB respectively for a Ghanaian family of four (Table 5). The number of obtainable portions from the indicated weights can be calculated by dividing them by standard portion sizes for the corresponding foods as reported in the food composition databases [22,23,24,25,26,27].
The food groups (cereals, roots and tubers) in these FBs were relatively more similar to the FBS compared with the less costly baskets (Figure 3). Cereals, roots and tubers contributed to around two thirds of total weight and consisted mainly of corn, cassava and their products whereas the amount of fruits was lower; and the amount of animal products and vegetable oils and fats was higher (Figure 3).

4. Discussion

The nutrient analysis of the cost-minimized FBs that fulfilled only the recommended energy intakes but mirrored the Ghanaian Food Balance Sheets [35], highlights that the average Ghanaian food availability may be low in iron, iodine, vitamin A and folic acid (WHO/FAO recommendations). It is therefore not surprising to find a high prevalence of anaemia, goitre, night blindness, birth defects such as neural tube defects and stunting [4,32,37,38]. At the same time, the prevalence of noncommunicable diseases (NCDs) such as high blood pressure and cardiovascular disease is increasing in Ghana [39,40]. Considering the apparently low nutrient but high energy density of the Ghanaian food supply, it can be expected that the population will remain at risk of developing a double burden of malnutrition [1,2]. Government policies need to focus on how to leverage food-based solutions to eliminate micronutrient deficiencies and stunting in young children and reduce prevalence of obesity and NCDs in the population as a whole.
Other authors have designed a linear programming diet model to determine the least costly basket of food items containing 13 food items that satisfy some of the recommended daily nutritional requirements of the average Ghanaian without addressing aspects of cultural acceptability and variety [41]. However one of the challenges of the LP methodology is that a limited number of foods are selected (Table 2) and this is likely to become too monotonous over a prolonged period and also not culturally acceptable [20]. In order to increase the chances of the FB being culturally acceptable it has been recommended to make the baskets as similar as possible to a population’s usual eating patterns [12,16] and to increase their dietary diversity [20]. Therefore, two constraints were enforced in our LP model to increase acceptability and diversity and both were associated with increasing cost (Figure 1 and Figure 2). A well-known barrier to being able to eat a healthy diet, is its cost [42]. This study aimed to identify what combination of foods can be purchased at a minimum cost while, at the same time, meeting the nutritional recommendations for a Ghanaian family of four and help to prevent diet-related diseases including obesity and NCDs.
The Ghanaian rural population appear to be more disadvantaged concerning the price of food compared with urban dwellers. For example, the least expensive nutritionally adequate and health promoting RFB for one day (Table 2) is 29% more expensive than the urban equivalent. FBs from urban settings, constrained to USD 3.1, were more diverse compared to their rural counterparts when no wild foods were included. When applying cost thresholds of USD 1.9 per person and day (extreme poverty) and assuming that 50% of the household’s income is spent on food, nutritionally adequate FBs could only be identified for the urban basket but not for the rural one. Adding only USD 0.11 (GHS 0.42) to the rural food budget would cover the cost of simplest FB for the rural population as well. Alternatively, under the USD 1.9 constraint, a nutritionally adequate solution in rural areas demands the inclusion of wild foods (Table 4). However, their use is limited due to: seasonality, local availability, considerable time consumption for harvest and their content of potentially toxic substances such as nitrates [43].
One potential to further reduce the cost would be to cultivate those foods that provide cost-delimiting nutrients, that is, iron, calcium, vitamin A, riboflavin, niacin and vitamin B12 and foods containing polyunsaturated fatty acids (Table 3). This could be for commercial purposes or subsistence farming or both. A further reduction in cost for nutritionally adequate FBs might be achieved by government subsidies such as the LEAP cash transfer program [44]. This would generate a possibility to further allow increased access to nutritious food by populations with limited financial resources. Such foods might be: dried soybeans and red whole-grain millet for iron; beef and chicken liver and dried false sesame leaves for vitamin A; iron and riboflavin, dried soya beans and dried false sesame leaves for folate [21].
Based on this study’s results, cost-effective, nutritionally adequate and healthy eating guidelines (Figure 3) for low-income Ghanaian families suggest reducing the intake of roots, tubers and fruits (with the exception of wild mango) and to increase the provision of cereals, vegetables and oil-bearing crops (e.g., soy and groundnuts), if available. For food categories where their availability might be relatively low in some areas (fish and seafood, sugar crops and sweeteners), the model suggests a further reduction. Of note, although all categories that were not cereals, roots and tubers contributed to only about third of the FB’s weight, they were essential to cover all RNIs.
The dietary patterns suggested by the models (Figure 3) match to a great extent the Dietary and Physical Activity Guidelines for Ghana [19]. Particularly the recommendations that a major part of a healthy diet should consist of cereals, roots and vegetables and a minor part should be fats, refined sugars and salts are mirrored in the results using LP. However, the relatively high intake of fresh fruit and moderate intake of meat, poultry, milk products and eggs recommended within Ghanaian FBDG appears to be too expensive for low-income families. The Ghanaian authorities may wish to review the dietary guidelines and consider what steps can be taken to alter the guidelines or help make healthy food more affordable to the population who are living under the poverty line. These steps can potentially avoid economic consequences of the current trajectory of the Ghanaian double burden of malnutrition [4].
The fact that all food prices were collected on-site guarantees local availability of the foods and a minimal feasibility of the suggested FBs. Some limitation of the validity of the results may arise from the fact that only the food supply (FBS) but not the food consumption was used as a reference point for cultural acceptability. Implementation of food consumption data of the Ghanaian population is desirable in further development of Ghanaian optimized FBs when those are available. Moreover, longitudinal studies on food availability and prices may contribute to the development of season-independent FBs with higher food variety. Intervention studies involving low-income groups would provide useful information concerning how practical the modelled food baskets are. Such studies should also take foods into consideration that have been cultivated in home gardens or received as a gift.

5. Conclusions

In Ghana, the prevalence of undernutrition (e.g., stunting and micronutrient deficiencies), obesity and diet related non-communicable diseases will increasingly affect vulnerable families with limited economic resources. The prevention of the double burden of malnutrition in Ghana will depend on healthy nutritious foods being culturally acceptable and readily available at affordable prices.
Using LP, culturally acceptable food baskets of minimum cost could be developed for urban and rural low-income Ghanaian families for a month when assuming that half of the household income is spent on food. These FBs fulfil all nutrient recommendations and, at the same time, can help to prevent obesity and diet-related NCDs. In addition, a further potential could be to reduce the prevalence of micronutrient deficiencies by promoting the production of more nutrient-dense foods that are rich in iron, folic acid, vitamin A, calcium, riboflavin, niacin and vitamin B12, plus foods rich in polyunsaturated fatty acids. Such foods might be soybeans, red millet, false sesame leaves as well as beef and chicken liver. The results were calculated using the local market prices so that findings could be helpful for the authorities to advise the entire food system including agriculture and horticulture sectors and the food producers and distributors, in order to support the local economy.

Supplementary Materials

The following are available online at https://0-www-mdpi-com.brum.beds.ac.uk/2072-6643/10/4/461/s1. Table S1: List of included Ghanaian foods.

Acknowledgments

The authors would like to thank Mark Appiah and other supporters for the identification of local food items, translations and price collection in Ghana and Amy Faircloth for her support regarding the practical arrangements.

Author Contributions

E.-P.A.N. and H.E.D. designed the lists of the locally available foods, collected food prices on-site and arranged the data into databases. E.-P.A.N. implemented food composition data into these databases. E.-P.A.N. and A.P. adapted the LP methodology to the data and wrote all drafts of the manuscript. A.R., R.N.O.A. and H.E.D. critically reviewed and commented on the manuscript.

Conflicts of Interest

The authors declare no conflict of interest.

References

  1. Doku, D.T.; Neupane, S. Double burden of malnutrition: Increasing overweight and obesity and stall underweight trends among Ghanaian women. BMC Public Health 2015, 15, 670. [Google Scholar] [CrossRef] [PubMed]
  2. Tuoyire, D.A.; Kumi-Kyereme, A.; Doku, D.T. Socio-demographic trends in overweight and obesity among parous and nulliparous women in Ghana. BMC Obes. 2016, 3, 44. [Google Scholar] [CrossRef] [PubMed]
  3. Institute for Health Metrics and Evaluation. Ghana. Available online: http://www.healthdata.org/ghana (accessed on 13 February 2018).
  4. Ghana Statistical Service; Ghana Health Service; The DHS Program ICF International. Ghana Demographic and Health Survey 2014. Key Indicators. April 2015. Available online: http://www.statsghana.gov.gh/docfiles/DHS_Report/Ghana_DHS_2014-KIR-21_May_2015.pdf (accessed on 23 February 2018).
  5. Ghana Statistical Service; Ghana Health Service; The DHS Program ICF International. Ghana Demographic and Health Survey 2014. October 2015. Available online: https://dhsprogram.com/pubs/pdf/FR307/FR307.pdf (accessed on 23 February 2018).
  6. World Health Organization (WHO). Childhood Stunting: Challenges and opportunities. Report of a Promoting Healthy Growth and Preventing Childhood Stunting colloquium. World Health Organization: Geneva, 2014. Available online: http://apps.who.int/iris/bitstream/10665/107026/1/WHO_NMH_NHD_GRS_14.1_eng.pdf (accessed on 23 February 2018).
  7. National Development Planning Commission, Republic of Ghana. The Cost of Hunger in Africa, Ghana. Social and Economic Impact of Child Undernutrition on Ghana’s Long-Term Development. Available online: https://static1.squarespace.com/static/527789a2e4b0a23a823e44cd/t/57bc383eebbd1a30a1b5f412/1471953104396/GHANA_Report+FINAL.pdf (accessed on 6 March 2018).
  8. Dewey, K.G.; Begum, K. Long-term consequences of stunting in early life: Long-term consequences of stunting. Matern. Child. Nutr. 2011, 7, 5–18. [Google Scholar] [CrossRef] [PubMed]
  9. Ofori-Asenso, R.; Agyeman, A.A.; Laar, A.; Boateng, D. Overweight and obesity epidemic in Ghana—A systematic review and meta-analysis. BMC Public Health 2016, 16, 1239. [Google Scholar] [CrossRef] [PubMed]
  10. Centers for Disease Control and Prevention. The Health Effects of Overweight and Obesity. CDC. Available online: https://www.cdc.gov/healthyweight/effects/index.html (accessed on 13 February 2018).
  11. Jones, N.R.V.; Conklin, A.I.; Suhrcke, M.; Monsivais, P. The growing price gap between more and less healthy foods: Analysis of a novel longitudinal UK dataset. PLoS ONE 2014, 9, e109343. [Google Scholar] [CrossRef] [PubMed]
  12. Darmon, N.; Ferguson, E.L.; Briend, A. A Cost constraint alone has adverse effects on food selection and nutrient density: An analysis of human diets by linear programming. J. Nutr. 2002, 132, 3764–3771. [Google Scholar] [CrossRef] [PubMed]
  13. World Bank. Macro Poverty Outlook Ghana. Available online: http://pubdocs.worldbank.org/en/517001477329249847/pdf/mpo-am16-gha.pdf (accessed on 23 February 2018).
  14. Smith, V.E. Linear Programming Models for the Determination of Palatable Human Diets. Am. J. Agric. Econ. 1959, 41, 272–283. [Google Scholar] [CrossRef]
  15. Darmon, N.; Ferguson, E.; Briend, A. Linear and nonlinear programming to optimize the nutrient density of a population’s diet: An example based on diets of preschool children in rural Malawi. Am. J. Clin. Nutr. 2002, 75, 245–253. [Google Scholar] [CrossRef] [PubMed]
  16. Rambeloson, Z.J.; Darmon, N.; Ferguson, E.L. Linear programming can help identify practical solutions to improve the nutritional quality of food aid. Public Health Nutr. 2008, 11, 395–404. [Google Scholar] [CrossRef] [PubMed]
  17. Parlesak, A.; Geelhoed, D.; Robertson, A. Toward the prevention of childhood undernutrition: Diet diversity strategies using locally produced food can overcome gaps in nutrient supply. Food Nutr. Bull. 2014, 35, 191–199. [Google Scholar] [CrossRef] [PubMed]
  18. Food and Agriculture Organization of the United Nations. Food-Based Dietary Guidelines. Available online: http://www.fao.org/nutrition/education/food-dietary-guidelines/home/en/ (accessed on 13 February 2018).
  19. Ministry of Health, Ghana. Dietary and Physical Activity Guidelines for Ghana, December 2009. Available online: http://alwag.org/education/courses/pa-guide.pdf (accessed on 22 February 2018).
  20. Parlesak, A.; Tetens, I.; Dejgård Jensen, J.; Smed, S.; Gabrijelčič Blenkuš, M.; Rayner, M.; Darmon, N.; Robertson, A. Use of Linear Programming to Develop Cost-Minimized Nutritionally Adequate Health Promoting Food Baskets. Available online: http://journals.plos.org/plosone/article?id=10.1371/journal.pone.0163411 (accessed on 12 February 2018).
  21. Food and Agriculture Organization of the United Nations West African Food Composition Table, 2012. Available online: http://www.fao.org/docrep/015/i2698b/i2698b00.pdf (accessed on 12 February 2018).
  22. Korkalo, L.; Hauta-Alus, H.; Mutanen, M. Food composition Tables for Mozambique. Version 2. October 2011. Available online: http://www.helsinki.fi/food-and-environment/research/groups/Food_composition_tables_for_Mozambique.pdf (accessed on 22 February 2018).
  23. United States Department of Agriculture (USDA). USDA National Nutrient Database for Standard Reference, Release 28. Available online: https://www.ars.usda.gov/northeast-area/beltsville-md/beltsville-human-nutrition-research-center/nutrient-data-laboratory/docs/sr28-download-files/ (accessed on 13 February 2018).
  24. Public Health England. McCance and Widdowson’s The Composition of Foods Integrated Dataset 2015. Available online: https://www.gov.uk/government/publications/composition-of-foods-integrated-dataset-cofid (accessed on 13 February 2018).
  25. DTU Food, National Food Institute Denmark. Danish Food Composition Databank. Available online: http://www.foodcomp.dk/v7/fcdb_download.asp (accessed on 23 February 2018).
  26. National Institute for Health and Welfare, Finland. National Food Composition Database in Finland (Fineli). Available online: https://fineli.fi/fineli/en/index? (accessed on 13 February 2018).
  27. The Norwegian Food Safety Authority; University of Oslo. Matvaretabellen. Available online: http://www.matvaretabellen.no/ (accessed on 13 February 2018).
  28. Agunbiade, S.O.; Ojezele, M.O.; Alao, O.O. Evaluation of the nutritional, phytochemical compositions and likely medicinal benefits of Vernomia amygdalina, Talinum triangulare and Ocimum basilicum leafy-vegetables. Adv. Biol. Res. 2015, 9, 151–155. [Google Scholar] [CrossRef]
  29. Annan-Prah, A.; Agyeman, J.A. Nutrient content and survival of selected pathogenic bacteria in kenkey used as a weaning food in Ghana. Acta Trop. 1997, 65, 33–42. [Google Scholar] [CrossRef]
  30. Food and Agricultural Organization of the United Nations; United Nations University; World Health Organization. Food and Nutrition Technical Report Series: Human Energy Requirements. Report of a Joint FAO/WHO/UNU Expert Consultation. Rome, 17–24 October 2001. Available online: http://www.fao.org/3/a-y5686e.pdf (accessed on 23 February 2018).
  31. World Health Organization; Food and Agriculture Organization of the United Nations. Vitamin and Mineral Requirements in Human Nutrition. Rome, 2004. Available online: http://apps.who.int/iris/bitstream/10665/42716/1/9241546123.pdf?ua=1 (accessed on 23 February 2018).
  32. Ghana Statistical Service, 2011. Available online: https://dhsprogram.com/pubs/pdf/FR262/FR262.pdf (accessed on 23 February 2018).
  33. Dantzig, G.B. Maximization of a linear function of variables subject to linear inequalities. In Activity Analysis of Production and Allocation, 1st ed.; Koopmans, T.C., Ed.; Wiley & Chapman-Hall: New York, NY, USA; London, UK, 1951; pp. 339–347. [Google Scholar]
  34. Mason, A.J. OpenSolver—An open source add-in to solve linear and integer programmes in Excel. In Operations Research Proceedings 2011; Klatte, D., Lüthi, H.-J., Schmedders, K., Eds.; Springer: Berlin/Heidelberg, Germany, 2012; ISBN 978-3-642-29209-5. [Google Scholar]
  35. Food and Agricultural Organization of the United Nations. Food Balance Sheets, FAOSTAT Dataset. Available online: http://www.fao.org/faostat/en/?#data/FBS (accessed on 20 February 2018).
  36. Ghana Statistical Service. Ghana Living Standards Survey 6 (With a Labour Force Module) 2012-2013, Round Six (GLSS6). Available online: http://www.statsghana.gov.gh/docfiles/glss6/GLSS6_Main%20Report.pdf (accessed on 24 February 2018).
  37. Van den Broek, N.; Dou, L.; Othman, M.; Neilson, J.P.; Gates, S.; Gülmezoglu, A.M. Vitamin A supplementation during pregnancy for maternal and newborn outcomes. In Cochrane Database of Systematic Reviews; The Cochrane Collaboration, Ed.; John Wiley & Sons, Ltd.: Chichester, UK, 2010. [Google Scholar]
  38. Alhassan, A.; Adam, A.; Nangkuu, D. Prevalence of neural tube defect and hydrocephalus in Northern Ghana. J. Med. Biomed. Sci. 2017, 6, 18–23. [Google Scholar]
  39. Bosu, W.K. Epidemic of hypertension in Ghana: A systematic review. BMC Public Health 2010, 10. [Google Scholar] [CrossRef] [PubMed]
  40. Roth, G.A.; Forouzanfar, M.H.; Moran, A.E.; Barber, R.; Nguyen, G.; Feigin, V.L.; Naghavi, M.; Mensah, G.A.; Murray, C.J.L. Demographic and Epidemiologic Drivers of Global Cardiovascular Mortality. N. Engl. J. Med. 2015, 372, 1333–1341. [Google Scholar] [CrossRef] [PubMed]
  41. Darko, A.F.; Allen, B.; Mazunda, J.; Rahimzai, R.; Dobbins, C. Cost-minimizing food budgets in Ghana. J. Dev. Agric. Econ. 2013, 5, 135–141. [Google Scholar] [CrossRef]
  42. Darmon, N.; Drewnowski, A. Contribution of food prices and diet cost to socioeconomic disparities in diet quality and health: A systematic review and analysis. Nutr. Rev. 2015, 73, 643–660. [Google Scholar] [CrossRef] [PubMed]
  43. Matallana González, M.C.; Martínez-Tomé, M.J.; Torija Isasa, M.E. Nitrate and nitrite content in organically cultivated vegetables. Food Addit. Contam. Part B 2010, 3, 19–29. [Google Scholar] [CrossRef] [PubMed]
  44. Laar, A.K.; Aryeetey, R.N.O.; Mpereh, M.; Zotor, F.B. Improving nutrition-sensitivity of social protection programmes in Ghana. Proc. Nutr. Soc. 2017, 76, 516–523. [Google Scholar] [CrossRef] [PubMed]
Figure 1. Cost (A,C,E) and diversity (B,D,F) of food baskets (FBs) for a Ghanaian family of four. Each point within the charts represents a nutritionally adequate FB. The FBs were optimized based on the foods available in the urban (UFB: urban food basket, Charts A,B) or in the rural environment (RFB: rural food basket, Charts C,D). Charts E+F build also on foods available in rural areas but include wild foods (RWFB: rural wild food basket). In the charts, each line represents a set of FBs that underlies the same constraint on the maximum contribution of a single food per food group (without constraint (WoC), 200%, 100%, 70%, 50% and 40%). Values on the X-axes indicate maximum allowed relative deviation (RD) from food group weights reported by most recent Ghanaian Food Balance Sheets [35]. The horizontal lines indicate threshold limits for poverty (USD 3.1, GHS 11.9, dashed) and extreme poverty (USD 1.9, GHS 7.3, solid). GHS, Ghanaian Cedi.
Nutrients 10 00461 g001
Figure 2. Correlation between cost and food diversity for single food baskets for a Ghanaian family of four. Charts refer to the UFB, the RFB and the RFB with wild foods included (RWFB). Each line represents a set of food baskets (FBs) that underlie the same maximum allowed contribution of a single food per category as described in the legend of Figure 1. The horizontal lines indicate threshold limits for poverty (USD 3.1, GHS 11.9, dashed) and extreme poverty (USD 1.9, GHS 7.3, solid).
Nutrients 10 00461 g002
Figure 3. Food categories constituting the current food supply (left column), the simplest version of the UFB, RFB and RWFB and their more culturally acceptable forms that were aligned to current supply of food categories. The wild foods consisted of mango, dandelion, moringa, amaranth leaves, Jew’s mallow leaves, Giant African snails and waterleaves. FBS: Food Balance Sheets.
Nutrients 10 00461 g003
Table 1. Recommended energy intakes (REIs) and recommended nutrient intakes (RNIs) [29,30] applied as constraints for linear optimization of all calculated food baskets. SFAs, saturated fatty acids; n-3 and n-6 PUFAs, omega-3 and omega-6 polyunsaturated fatty acids; TFAs, trans-fatty acids; RAE, retinol activity equivalent. All recommendations refer to one day.
Age/Energy/Nutrient Adult FemaleAdult MaleGirlBoy
Age (year)18.0–29.930.0–59.98.0–8.95.0–5.9
Energy (kcal)2550285016981467
Protein (g)54.0–95.658.0–106.926.2–63.717.1–55.0
Fat (g)56.7–85.047.5–95.028.3–56.624.5–48.9
SFAs (g)<28.3<31.7<18.9<16.3
PUFAs (g)17.0–28.319.0–31.711.3–18.99.8–16.3
n-3 PUFAs (g)2.83–5.673.17–6.331.89–3.771.63–3.26
n-6 PUFAs (g)14.17–22.6715.83–25.339.43–15.098.15–13.04
TFAs (g)<2.83<3.17<1.89<1.63
Cholesterol (mg)<300<300<300<300
Carbohydrate available (g)351–478392–534233–318201–275
Fibre (g)≥25.0≥25.0≥16.6≥12.2
Total sugars (g)<31.9<35.6<21.2<18.3
Na (mg)<2000<2000<2000<2000
K (mg)≥3510≥3510≥2337≥1688
Ca (mg)≥1000≥1000≥700≥600
Mg (mg)≥220≥260≥100≥76
Fe (mg)≥29.4≥13.7≥8.9≥6.3
Zn (mg)≥4.9≥7.0≥5.6≥4.8
Se (µg)≥26≥34≥21≥22
Iodine (µg)≥150≥150≥120≥90
Vit A-RAE (µg)≥500≥600≥500≥450
Thiamine (mg)≥1.10≥1.20≥0.90≥0.60
Riboflavin (mg)≥1.10≥1.30≥0.90≥0.60
Vit B6 (mg)≥1.30≥1.30≥1.00≥0.60
Vit B12 (µg)≥2.40≥2.40≥1.80≥1.2
Vit C (mg)≥45.0≥45.0≥35.0≥30.0
Vit E (mg)≥7.5≥10.0≥7.0≥5
Folate (µg)≥400≥400≥300≥200
Niacin (mg)≥16.0≥14.0≥12.0≥8.0
Table 2. Simplest versions of Ghanaian food baskets for the urban environment (UFB, 12 foods), for the rural environment (RFB, 13 foods) and for the rural environment including wild foods (RWFB, 12 foods). During the cost optimization by linear programming, these food baskets were not constrained to achieve any forms of diversity or similarity to current food supply patterns. GHS, Ghanaian Cedi.
CategoryFood ItemUFBRFBRWFB
Weight (g)Cost (GHS)Weight (g)Cost (GHS)Weight (g)Cost (GHS)
Cereals and cereal productsBanku flour5511
Maize, white, flour refined 610.2
Millet, red, whole grain12552.555461.39
Oats, dried360.28310.37
Wheat, whole grains630.25
Roots and tubersCassava, flour, gari, yellow 7261.639002.03
Legumes Cowpea, white, dried20.01
Groundnut, dried 680.54210.17
Groundnut, paste 10.01
Groundnut, roasted 350.32
Soy bean, flour 5681.9690.23
Nuts, seeds and their productsCoconut, whole, immature kernel, fresh3330.212970.193180.2
Vegetables and their productsOkra, dried, grounded 1121.08
Cabbage, green2290.5
Cocoyam leaves 590.11
False sesame (yaudo) leaves, dried1290.72
Animal & vegetable oils & fatsSoy oil260.29
Vegetable oil580.3760.041441.13
Products from slaughtered animalsBeef liver100.21140.240.06
MiscellaneousSalt, iodized170.04170.06150.05
Wild foodsDandelion 7440
Jew’s mallow (ademe) leaves 17260
Giant African snails 9380
Water leaves 3290
Sums27096.4425077.7352434.19
Table 3. Nutrients that work as active constraints on the cost of Ghanaian food baskets. A shaded cell indicates an active constraint for the UFB (U; lower limit, orange; upper limit, blue), the RFB (R; lower limit, beige; upper limit, green) or the RWFB (W; lower limit, brown; upper limit, violet). Lowering the lower limits and increasing the upper limits of active constraints would result in reduced cost. SFA, saturated fatty acids; PUFA, polyunsaturated fatty acids; Vit, vitamin.
Limits Family Member MacronutrientsMineralsTrace ElementsVitamins
ProteinSFAn-3 PUFAn-6 PUFATotal SugarSodiumCalciumIronIodineVit ARiboflavinNiacinFolateVit B12Vit CVit E
URWURWURWURWURWURWURWURWURWURWURWURWURWURWURWURW
Lower limits Mother
Father
Girl
Boy
Upper limitsMother
Father
Girl
Boy
Table 4. Composition of a monthly urban food basket (UFB, 22 foods) and rural food basket including wild foods (RWFB, 30 foods) costing GHS 7.3 (USD 1.9) per day which has been optimized for similarity towards the most recent food supply patterns from FAOs food balance sheets [35]. GHS 7.3 per day did not cover the cost for a rural food basket without including wild foods.
Food CategoryFoodUFBRFBRWFB
Mass (kg)Cost (GHS)Mass (kg)Cost (GHS)Mass (kg)Cost (GHS)
Cereals & cereal productsBanku flour46.3384.2No solutions below 7.31 GHS/day
Bread, “Sugarbread” 0.191.0
Maize, white, flour refined 5.0616.7
Maize, yellow, whole kernel, dried0.591.41.365.5
Millet, red, whole grain3.406.92.456.2
Oats, dried1.2810.2 0.334.0
Pearl millet, whole grain (with bran) 1.092.9
Wheat flour, white 1.827.7
Wheat, whole grain5.3621.1
Roots and tubersCassava, flour, gari, yellow 38.7287.2
Cassava, tuber, raw16.2625.6
Sugar crops and sweetenersSugar 0.170.6
PulsesCowpea, white, dried0.642.3
Cowpea, red, dried 0.462.0
Nuts, seeds and their productsCoconut, immature kernel fresh kernel, fresh1.000.6 1.460.9
Colanut 0.241.9
Oil-bearing cropsGroundnut, dried 2.5820.3
Soya bean, dried0.090.4
Soya bean, flour0.261.9 4.2714.3
Vegetables and their productsFalse sesame, leaves, dried3.2318.1
Onion, red0.361.0
Onion, white 1.755.0
FruitsBanana, white flesh0.451.1 0.460.6
Lemon 0.412.7
Papaya, ripe2.255.4
Stimulating cropsCoffee, instant, powder0.011.9 0.024.4
Animal & vegetable oils & fatsSoya oil1.2614.2
Vegetable oil1.8611.9 2.7121.3
Products from slaughtered animalsBeef liver0.346.7 0.142.0
Beef, kidney 0.020.2
Beef, meat, lean, boneless 0.304.3
Beef, thigh, boneless0.292.6
Chicken, liver 0.222.4
Products from live animalsButter, from cow’s milk (without salt)0.030.9
Egg, chicken0.292.5 0.302.9
Fish & seafoodWhitefish, frozen 0.523.4
MiscellaneousSalt, iodized0.541.4 0.521.9
Wild foodsGiant African snails, with shell 1.940.0
Mango 3.570.0
Moringa leaf 17.460.0
Water leaf 0.250.0
Total86.12222.41 90.78222.41
Table 5. Composition of a monthly urban food basket (UFB, 36 foods), rural food basket without wild foods (RFB, 31 foods) and rural food basket including wild foods (RWFB, 39 foods) costing GHS 11.9 (USD 3.1) per day which has been optimized for similarity towards the most recent food supply patterns from FAOs food balance sheets [35].
Food CategoryFood ItemUFBRFBRWFB
Mass (kg)Cost (GHS)Mass (kg)Cost (GHS)Mass (kg)Cost (GHS)
Cereals & cereal productsBanku flour11.2920.5
Bread, “Sugarbread”1.487.83.6520.12.7815.4
Bread, wheat, white0.893.5
Kenkey fante, maize version 0.570.9
Maize, white, flour refined 6.4221.24.5315.0
Maize, yellow, whole kernel, dried4.199.7 1.325.4
Millet, red, whole grain1.362.84.0610.31.924.9
Millet, whole grain, flour (with bran)1.8811.7
Oats, dried, raw0.030.20.485.80.485.8
Pearl millet, whole grain (with bran) 0.942.50.942.5
Rice, brown 4.1822.14.1822.1
Rice flour, white2.4713.1
Rice, Thai fragrant5.9326.2
Rice, white 4.4216.64.4216.6
Wheat flour, white 1.034.31.898.0
Wheat, whole grain2.8011.0
Roots and tubersCassava, tuber27.4143.2
Cassava, flour, gari, white13.8752.3
Cassava, flour, gari, yellow 23.5553.025.4657.3
Cocoyam, tuber 8.9116.88.9116.8
Water yam, tuber 2.413.1
Sugar crops & sweetenersSugar, white0.622.6
Legumes and their productsCowpea, white, dried0.642.3
“Okogrono,” bean, dried 0.462.90.462.9
Nuts, seeds and their productsCashew nut0.2312.4
Coconut, immature kernel 1.460.91.460.9
Colanut 0.241.90.241.9
Oil-bearing cropsGroundnut, dried0.956.9
Soya bean, dried0.402.1
Soya bean, flour 3.8412.83.6412.2
VegetablesFalse sesame, leaves, dried4.5425.5
Okra, dried, grounded 4.5643.83.8436.9
Onion, red1.714.7
Onion, shallot 0.140.6
Onion, white 1.614.61.755.0
FruitsBanana, white flesh0.451.10.460.60.460.6
Grapefruit5.7014.2
Lemon 0.412.70.412.7
Papaya, ripe 3.572.42.521.7
Watermelon3.906.7
Stimulating cropsCoffee, instant, powder0.022.40.024.40.024.4
Cocoa, powder 0.3713.7
Animal & vegetable oils & fatsVegetable oil2.4915.94.1832.94.3834.5
Soya oil0.9310.4
Palm oil, refined0.392.0
Products from slaughtered animalsBeef liver0.326.4
Beef, meat, lean, boneless 0.304.30.304.3
Beef, thigh, boneless0.292.6
Beef, tripe, frozen0.070.7
Chicken, back, with bone, frozen 2.0112.72.0112.7
Chicken, leg, with bone, frozen1.9712.6
Chicken, liver 0.111.2
Goat, liver 1.0022.10.8919.6
Pig, foot, frozen 0.577.20.486.1
Products from live animalsButter, (cow’s milk), unsalted0.030.9
Egg, chicken0.292.50.302.90.302.9
Milk, UHT, banana flavour flavoured, 3.2% fat2.3217.41.5016.61.5016.6
Fish & seafoodAfrican ghost crab, whole, fresh0.834.6
Tuna, whole, fresh0.362.5
Mudfish, dried, salted 1.5911.30.433.0
Whitefish, frozen 0.120.80.543.6
MiscellaneousSalt, iodized0.501.30.481.70.501.8
Wild foodsAmaranth leaves 2.620.0
Giant African snails, with shell 0.570.0
Mango 1.050.0
Moringa leaves, fresh 0.430.0
Total103.54362.886.46362.891.11362.8

