Defining ‘Unhealthy’: A Systematic Analysis of Alignment between the Australian Dietary Guidelines and the Health Star Rating System


Abstract
:1. Introduction
2. Methods
2.1. Data Source
2.2. Product Classification
2.3. Calculation of the Health Star Rating
2.4. Classification of Foods under the Australian Dietary Guidelines
2.5. Statistical Analysis
- Apparent outliers that scored a low HSR but were assigned ‘core’ status by the ADGs were not considered ‘genuine outliers’ if they were sufficiently ‘high in’ salt, saturated fat and/or sugar to warrant at least one red traffic light.
- Apparent outliers that scored a high HSR but were assigned ‘discretionary’ status by the ADGs were not considered ‘genuine outliers’ if nutrient values for salt, saturated fat and/or sugar were not sufficiently high to warrant at least one red traffic light.
3. Results
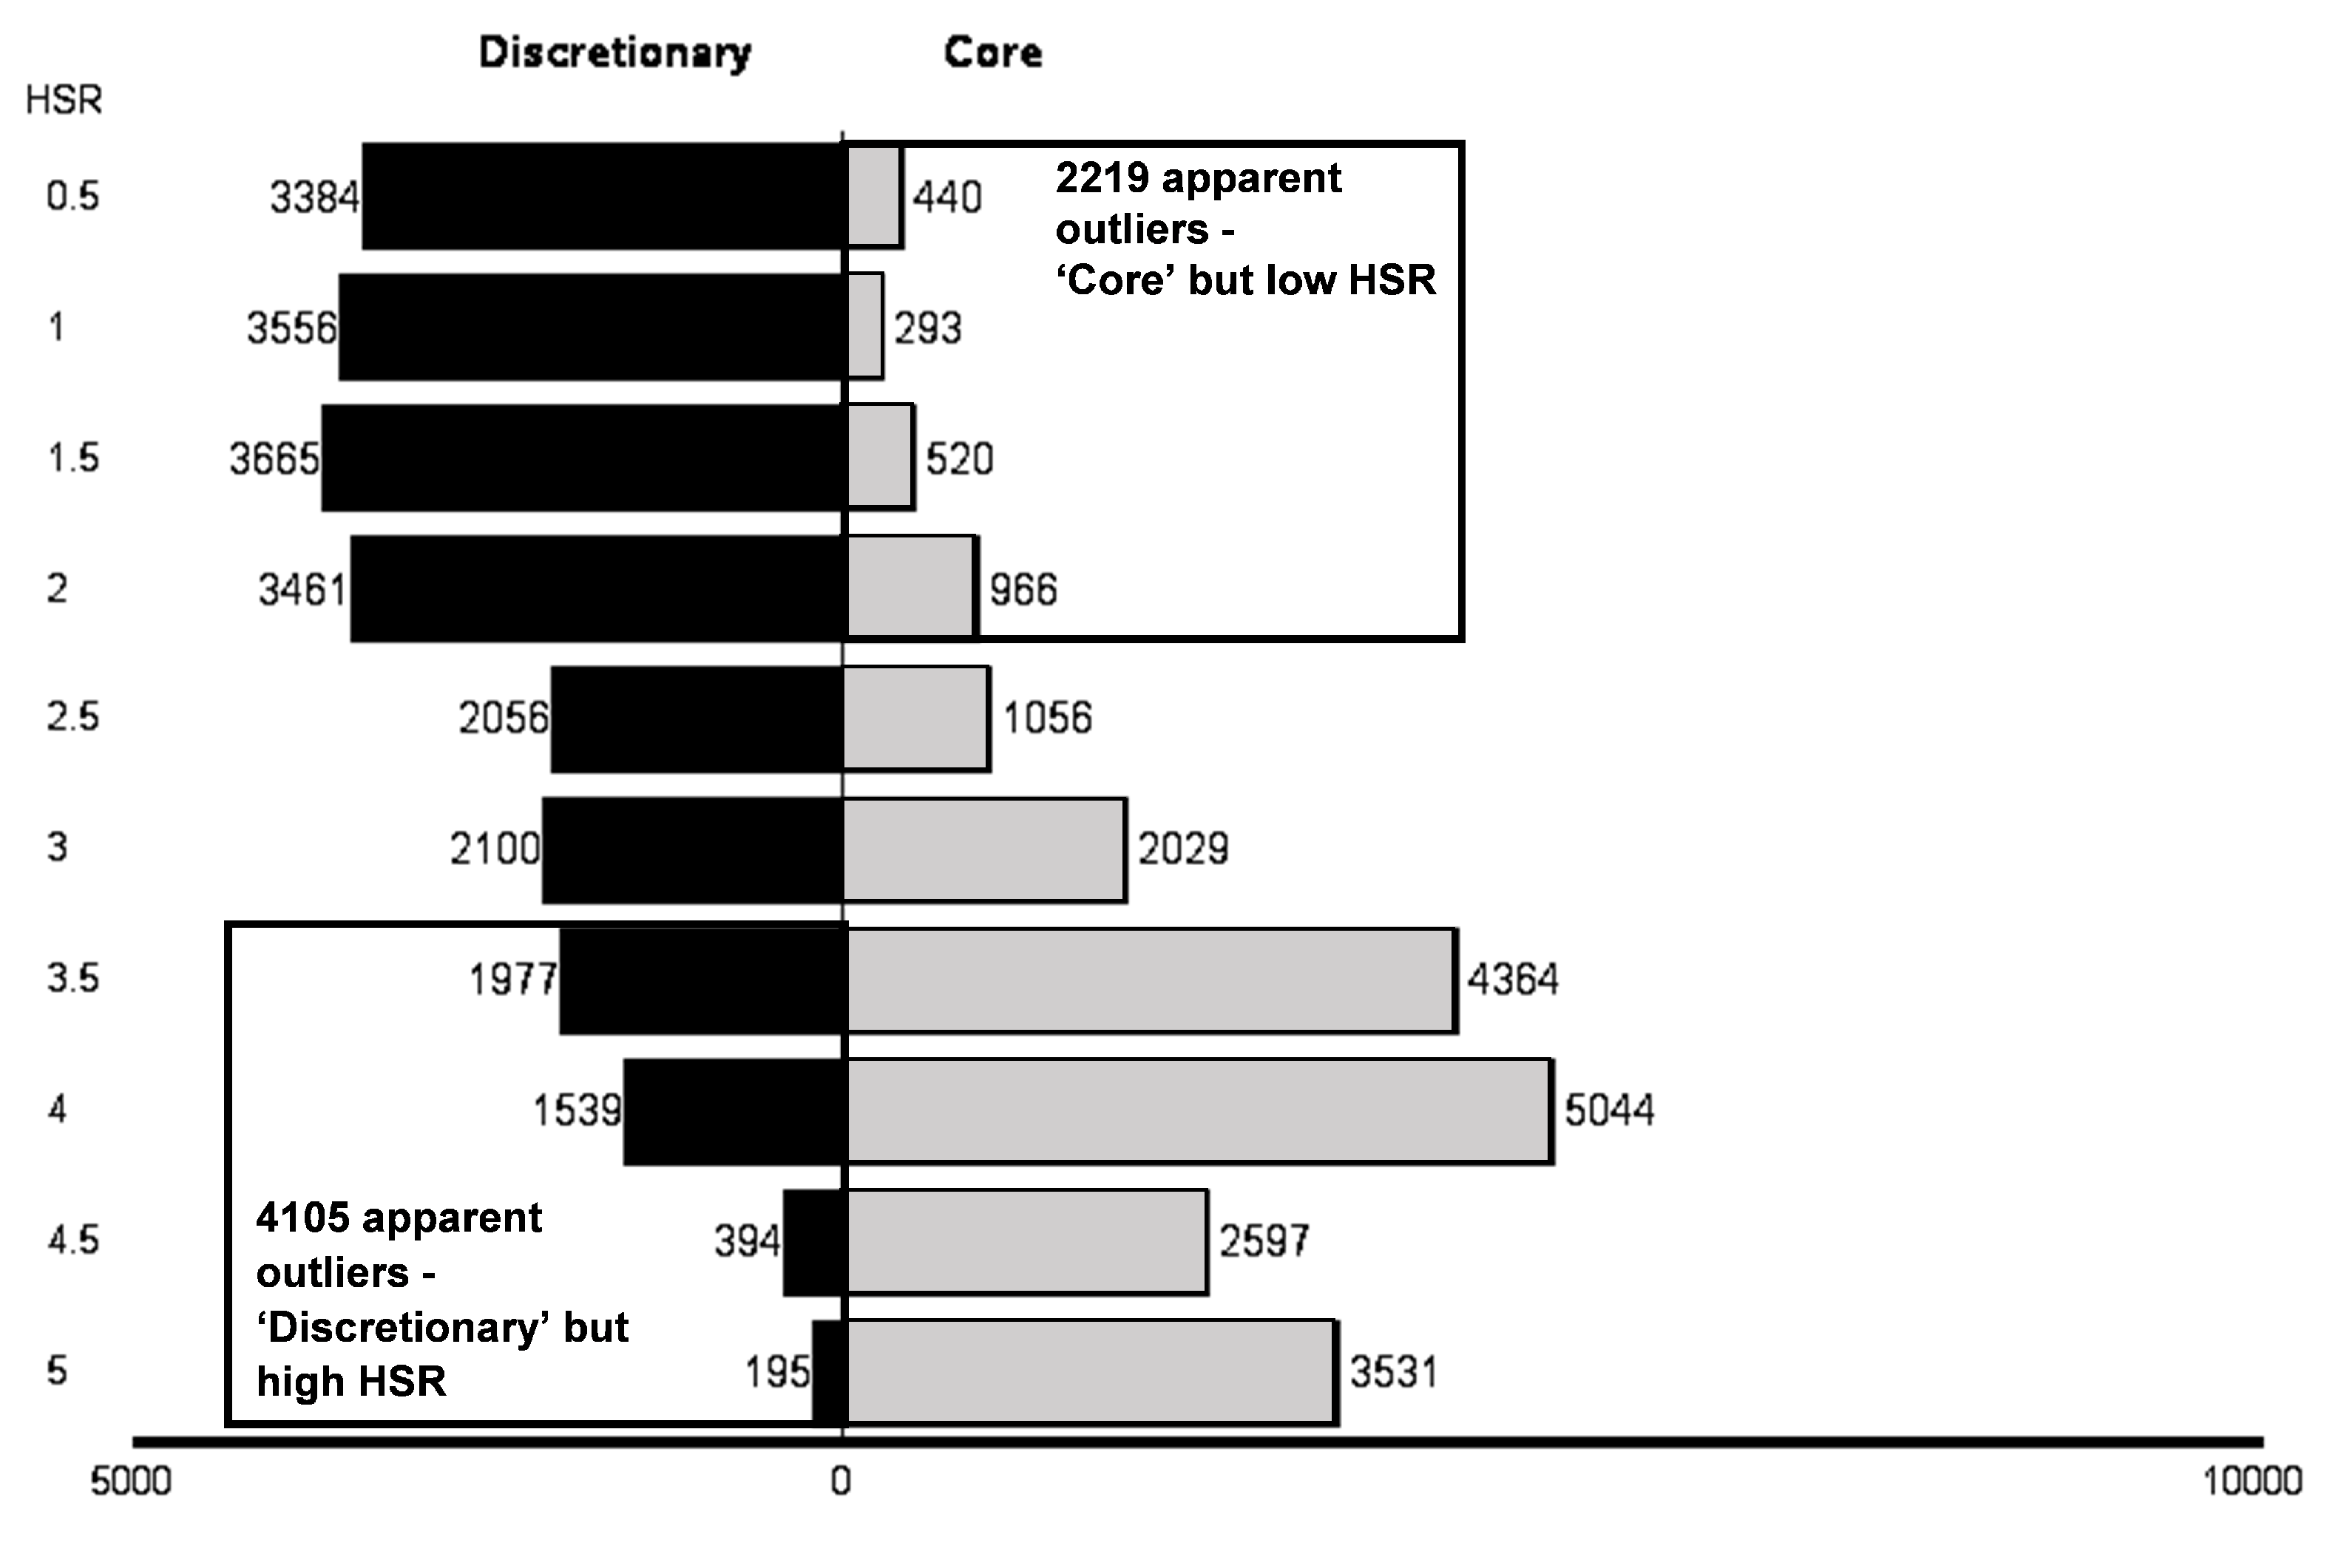
3.1. HSR Distribution by Core and Discretionary
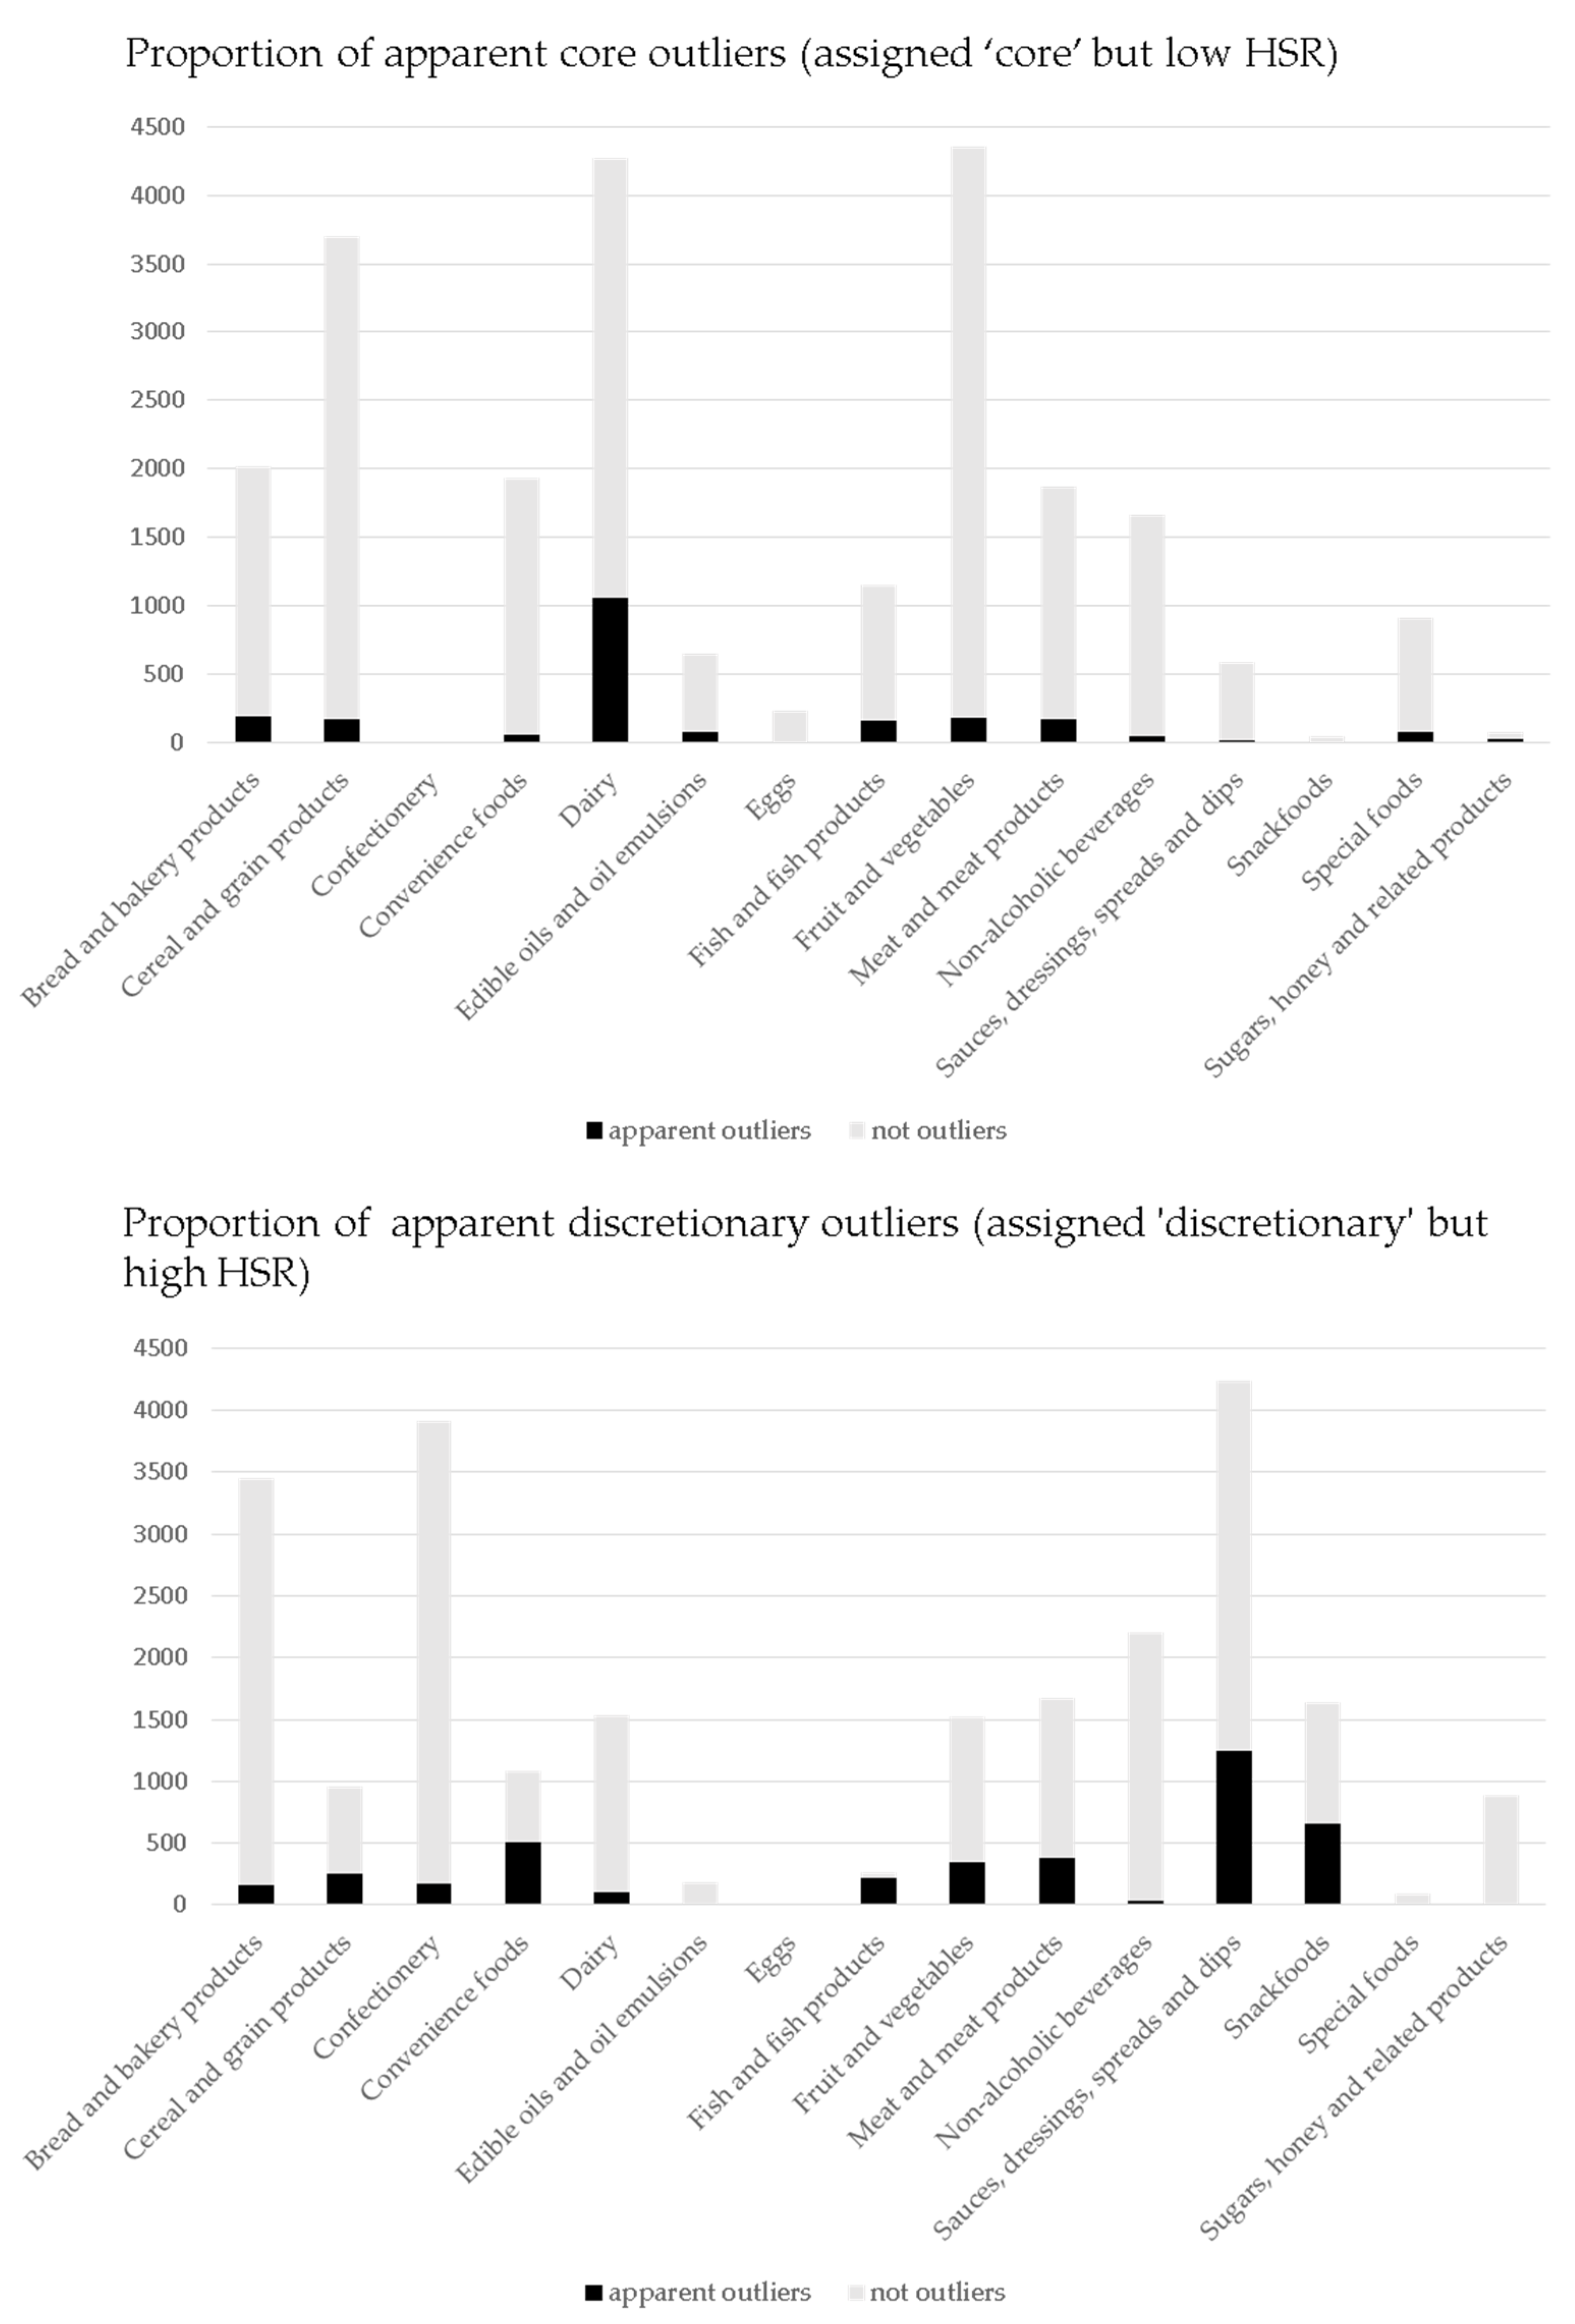
3.2. Apparent Outliers
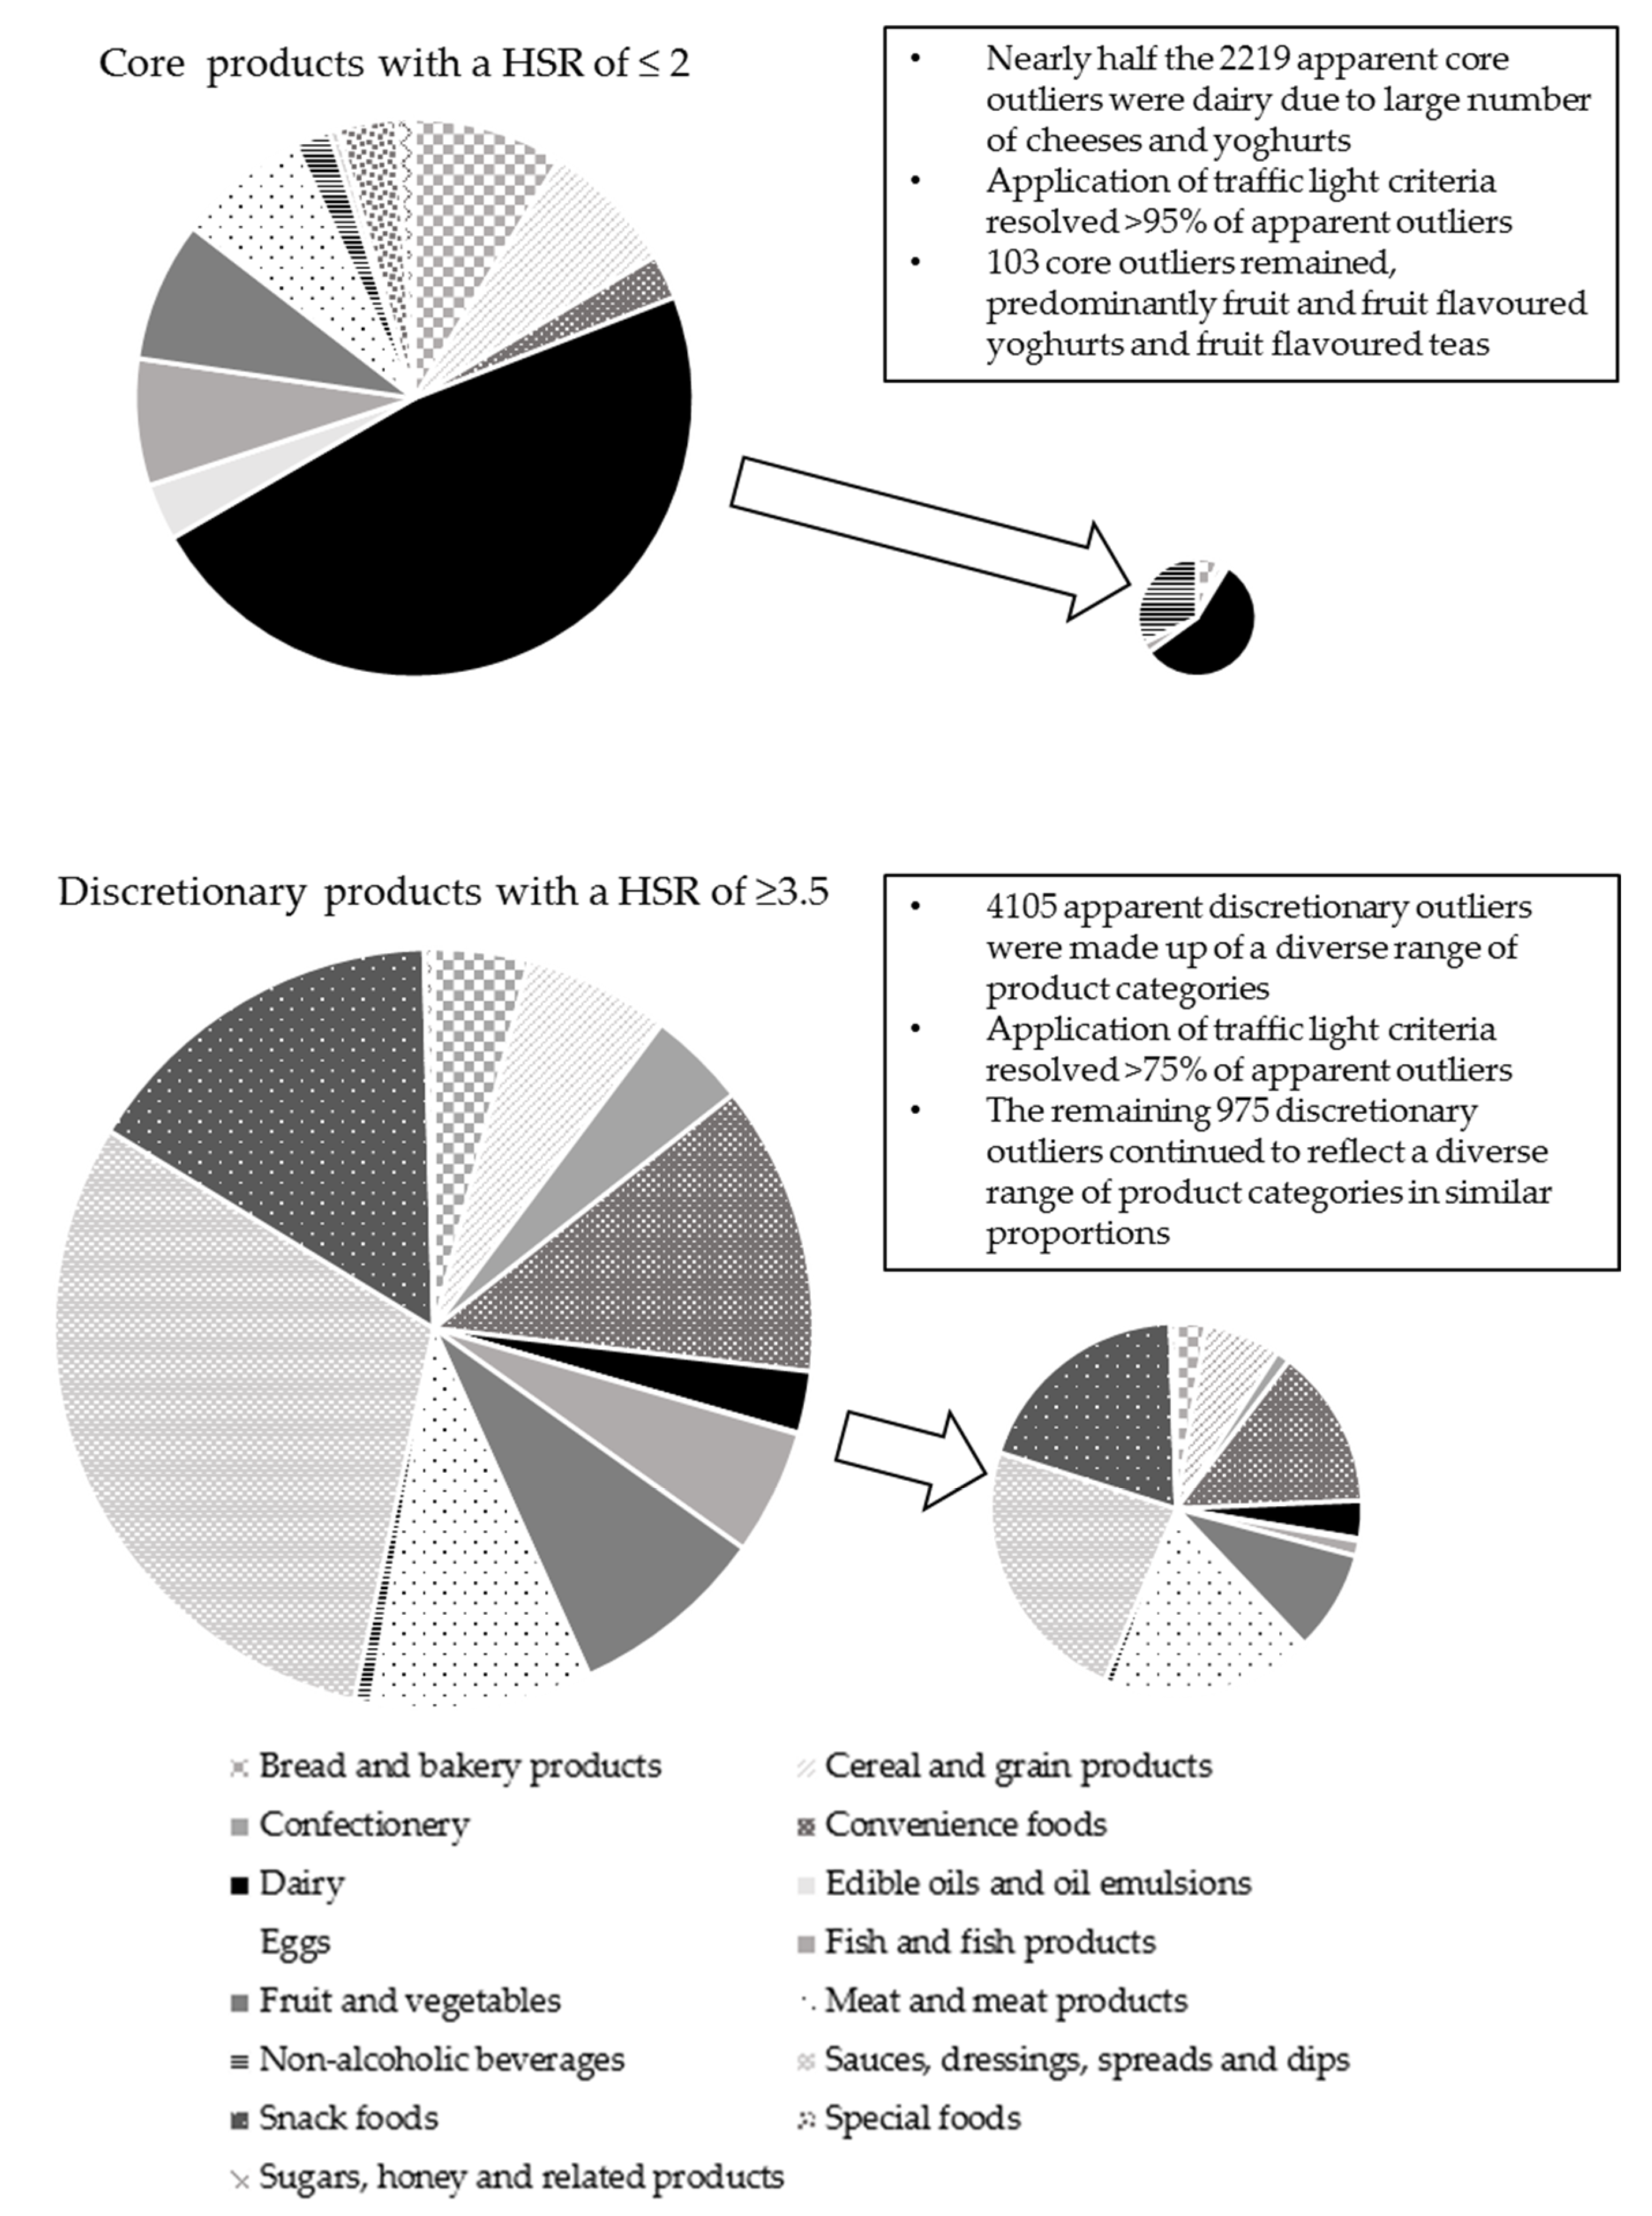
3.3. Application of Traffic Light Cut-Offs
4. Discussion
5. Conclusions
Acknowledgments
Author Contributions
Conflicts of Interest
Appendix A. Australian Health Star Rating graphic and Australian Guide to Healthy Eating


Appendix B. Core and Discretionary Outliers by Major Food Group, Category, Traffic Light, ADG/HSR Failure and Policy Recommendation
| Major Food Categories (Extracts of Relevant ADG Text *) | n | Saturated fat Traffic Light Red | Sodium Traffic Light Red | Total Sugar Traffic Light Red | n ADG Failure | n HSR Failure | Policy Recommendation (Where n ≥ 10) |
| Bread and Bakery | |||||||
| Guideline 2: Go for wholegrains. Wholemeal or wholegrain varieties are preferable because they provide more dietary fibre, vitamins and minerals than refined grain (cereal) foods... Grain (cereal) foods which have high amounts of added saturated fats, added sugars, and/or salt such as most cakes, muffins, pies, pastries and biscuits are not included in this group but are classified ‘discretionary’ choices. | |||||||
| Biscuits | |||||||
| Savoury biscuits | 76 | 49 | 65 | 8 | 74 | 2 | Review ABS table, including kJ cut-off for biscuits |
| Plain dry biscuits | 49 | 4 | 22 | 0 | 48 | 1 | Review ABS table, including kJ cut-off for biscuits |
| Bread | |||||||
| Flat bread | 29 | 6 | 24 | 0 | 29 | 1 | None. Less healthy options of core foods |
| Other bread | 20 | 11 | 0 | 18 | 20 | 0 | None. Less healthy options of core foods |
| Cakes, muffins and pastries | |||||||
| Pancake mix | 17 | 1 | 12 | 6 | 14 | 3 | Review ABS table |
| Crepe mix | 4 | 4 | 1 | 4 | 4 | 0 | |
| Cereal and grain products | |||||||
| Guideline 2: Go for wholegrains. Wholemeal or wholegrain varieties are preferable because they provide more dietary fibre, vitamins and minerals than refined grain (cereal) foods... Grain (cereal) foods which have high amounts of added saturated fats, added sugars, and/or salt such as most cakes, muffins, pies, pastries and biscuits are not included in this group but are classified ‘discretionary’ choices. | |||||||
| Noodles | |||||||
| Flavoured noodles | 88 | 79 | 83 | 1 | 88 | 0 | Review ABS table |
| Plain noodles | 6 | 2 | 3 | 0 | 5 | 1 | |
| Pastas | |||||||
| Packet pastas | 28 | 0 | 28 | 0 | 28 | 0 | Review ABS table |
| Fresh filled pasta | 10 | 10 | 4 | 0 | 10 | 0 | |
| Plain dry pasta | 3 | 0 | 3 | 0 | 3 | 0 | |
| Other grains and cereals (e.g., breadcrumbs) | 11 | 1 | 11 | 0 | 11 | 0 | Review ABS table |
| Breakfast cereals | |||||||
| Muesli | 6 | 6 | 0 | 1 | 6 | 0 | |
| Granola | 4 | 4 | 0 | 2 | 4 | 0 | |
| Flakes | 3 | 0 | 3 | 0 | 3 | 0 | |
| Sweet cereals | 3 | 1 | 0 | 3 | 3 | 0 | |
| Others | 2 | 0 | 0 | 1 | 1 | 1 | |
| Rice | |||||||
| Packet flavoured rice | 4 | 0 | 4 | 0 | 1 | 0 | |
| Dry rice | 1 | 0 | 1 | 0 | 1 | 0 | |
| Cous cous | 5 | 0 | 5 | 0 | 5 | 0 | |
| Confectionery | - | - | - | - | - | - | |
| Convenience foods | |||||||
| Guideline 2: Eat a wide variety of nutritious foods from the five food groups… Guideline 3: Limit intake of foods containing saturated fats, added salt, added sugars and alcohol. | |||||||
| Pre-prepared salads and snacks | |||||||
| Antipasto | 14 | 4 | 12 | 1 | 13 | 1 | Review ABS table |
| Others (salad, sushi, sandwich) | 8 | 3 | 8 | 1 | 8 | 0 | |
| Pizza | 20 | 0 | 18 | 4 | 18 | 0 | Review ABS table. Consider salt cut-off |
| Other frozen foods not specified | 9 | 9 | 3 | 0 | 9 | 0 | |
| Soups | 3 | 0 | 3 | 0 | 3 | 0 | |
| Dairy | |||||||
| Guideline 2: Include milk, yoghurt and cheese and/or alternatives—mostly reduced fat Full fat cheeses should be limited to 2–3 serves per week, and varieties which are lower in salt are preferable | |||||||
| Cheese | |||||||
| Hard and semi-hard cheeses | 283 | 283 | 270 | 0 | 283 | 0 | Review ABS table, core status given salt and sat fat |
| Soft cheeses | 177 | 177 | 73 | 0 | 177 | 0 | Review ABS table, core status given salt and sat fat |
| Processed cheeses | 30 | 30 | 30 | 0 | 30 | 0 | Review ABS table, core status given salt and sat fat |
| Sheep/goat cheese | 13 | 13 | 12 | 0 | 13 | 0 | Review ABS table, core status given salt and sat fat |
| Soy cheese | 9 | 9 | 9 | 0 | 9 | 0 | Review ABS table, core status given salt and sat fat |
| Yoghurt | |||||||
| Yoghurt with fruit | 204 | 82 | 0 | 145 | 163 | 41 | Review ABS table, core status given sat fat and sugar HSR failures suggest review sugar, added sugars |
| Flavoured yoghurt | 105 | 64 | 0 | 75 | 95 | 10 | Review ABS table, core status given sat fat and sugar HSR failures suggest review sugar, added sugars |
| Natural yoghurts | 57 | 53 | 0 | 6 | 55 | 2 | Review ABS table, core status given sat fat and sugar |
| Non-dairy yoghurts (coconut) | 23 | 23 | 0 | 0 | 23 | 0 | Review ABS table (Coconut products) |
| Yoghurt mixes | 24 | 6 | 0 | 22 | 22 | 2 | HSR impacted by ‘as prepared’ |
| Yoghurts with muesli or non-fruit additions | 19 | 11 | 0 | 18 | 19 | 0 | Review ABS table, core status given sat fat and sugar Review sugar, added sugars in HSR algorithm |
| Drinking yoghurt | 1 | 0 | 0 | 0 | 0 | 1 | |
| Milks | |||||||
| Coconut milks and creams | 79 | 79 | 0 | 0 | 79 | 0 | Review ABS table (Coconut products) |
| Dairy milks | 19 | 15 | 0 | 15 | 19 | 0 | Review ABS table, core status given sat fat and sugar Review sugar, added sugars in HSR algorithm |
| Other milks | 2 | 2 | 2 | 0 | 2 | 0 | |
| Cream products | |||||||
| Mascarpone | 9 | 9 | 0 | 0 | 9 | 0 | |
| Desserts (crème caramel) | 2 | 2 | 0 | 2 | 2 | 0 | |
| Edible oils and oil emulsions | |||||||
| Guideline 3: Limit intake of foods containing saturated fats, added salt, added sugars and alcohol. Replace high fat foods which contain predominately saturated fats such as butter, cream, cooking margarine, coconut and palm oil with foods which contain predominately polyunsaturated and monounsaturated fats such as oils, spreads, nut butters/pastes and avocado. | |||||||
| Coconut oils | 43 | 43 | 0 | 0 | 43 | 0 | Review ABS table. ADG text suggest avoid. |
| Cooking oils (e.g., rice bran) | 16 | 16 | 0 | 0 | 16 | 0 | Review ABS table |
| Edible oils (e.g., margarine) | 11 | 11 | 0 | 0 | 11 | 0 | Review ABS table |
| Cooking spray oils (e.g., coconut) | 3 | 3 | 0 | 0 | 3 | 0 | |
| Eggs | - | - | - | - | - | - | |
| Guideline 2: Choose lean meat and poultry, fish, eggs and/or plant-based alternatives | |||||||
| Fish and fish products | |||||||
| Guideline 2: Choose lean meat and poultry, fish, eggs and/or plant-based alternatives Fresh, frozen and canned varieties of meats, poultry or fish are all suitable, but choose varieties that are low in salt and saturated fat. Processed meats such as salami, mettwurst, bacon and ham are not part of this food group. They are classified as discretionary choices because they are high in saturated fat and/or salt. | |||||||
| Chilled fish | |||||||
| Smoked salmon | 82 | 1 | 82 | 0 | 82 | 0 | Review ABS table |
| Other chilled raw fish | 7 | 3 | 4 | 1 | 6 | 1 | |
| Canned fish | |||||||
| Anchovies | 24 | 2 | 24 | 0 | 24 | 0 | Review ABS table |
| Canned herring | 9 | 0 | 8 | 0 | 8 | 0 | |
| Canned salmon | 5 | 0 | 3 | 0 | 3 | 2 | |
| Other canned fish | 8 | 5 | 4 | 0 | 8 | 0 | |
| Other fish products not specified | 28 | 9 | 24 | 0 | 27 | 1 | Review ABS table |
| Fruit and vegetables | |||||||
| Guideline 2: Tuck into vegetables and fruit. Fresh, frozen, canned or dried varieties of vegetables and fruit are all suitable foods. Check the ingredients list and choose varieties of canned vegetables without added salt and canned fruit in natural juice, not syrup Vegetables and fruit to limit: …dried fruit can also stick to the teeth and increase the risk of tooth decay. For this reason…dried fruit should be consumed only occasionally and in small amounts. The intake of some salted, dried, fermented or pickled vegetables has been associated with increased risk of some cancers, so intake of these foods should be limited. Also limit intake of fried vegetables such as potato and vegetable chips and crisps, which add extra kilojoules and salt. Chips and crisps are included in ‘discretionary choices’ | |||||||
| Fruit | |||||||
| Dried fruit | 54 | 50 | 3 | 43 | 54 | 0 | Review ABS table and ADG text on dried fruit |
| Fruit-based products (e.g., date balls) | 20 | 5 | 1 | 18 | 20 | 0 | Review ABS table and ADG text on dried fruit |
| Coconut chunks | 10 | 10 | 4 | 4 | 10 | 0 | Review ABS table (coconut products) |
| Fruit in syrup | 3 | 3 | 0 | 3 | 3 | 0 | |
| Vegetables | |||||||
| Sundried tomatoes | 6 | 1 | 6 | 4 | 6 | 0 | |
| Other veg. products (namkeem, fried shallot) | 3 | 2 | 1 | 0 | 3 | 0 | |
| Nuts and seeds | |||||||
| Nuts, salted and sweet-coated | 6 | 6 | 3 | 3 | 6 | 0 | |
| Herbs and spices | |||||||
| Herb pastes | 32 | 0 | 32 | 14 | 32 | 0 | Review ABS table. Potential new category |
| Spice mixes | 43 | 9 | 38 | 5 | 43 | 0 | Review ABS table. HSR impacted by as prepared. |
| Curry powders | 4 | 0 | 4 | 0 | 4 | 0 | |
| Meat and Meat Products | |||||||
| Guideline 2: Choose lean meat and poultry, fish, eggs and/or plant-based alternatives Fresh, frozen and canned varieties of meats, poultry or fish are all suitable, but choose varieties that are low in salt and saturated fat. Processed meats such as salami, mettwurst, bacon and ham are not part of this food group. They are classified as discretionary choices because they are high in saturated fat and/or salt. | |||||||
| Pate and meat spreads | 51 | 49 | 17 | 0 | 51 | 0 | Review ABS table |
| Raw flavoured meats | 41 | 38 | 20 | 2 | 41 | 0 | Review ABS table. Further meat categories needed |
| Sausages and hot dogs | 37 | 0 | 37 | 1 | 37 | 0 | Review ABS table. Consider salt cut-off |
| Meat not otherwise specified | 15 | 10 | 12 | 0 | 15 | 0 | Review ABS table. Further meat categories needed |
| Raw flavoured meats | 8 | 3 | 6 | 0 | 8 | 0 | |
| Uncoated frozen/chilled processed meat | 6 | 2 | 5 | 0 | 6 | 0 | |
| Kebabs | 3 | 2 | 2 | 0 | 3 | 0 | |
| Burgers | 3 | 0 | 3 | 0 | 3 | 0 | |
| Non-alcoholic beverages | |||||||
| Guideline 2: Tea and coffee provide water, although they are not suitable for young children and large quantities can have unwanted stimulant effects in some people. Guideline 3: Limit intake of foods containing saturated fats, added salt, added sugars and alcohol. | |||||||
| Teas (not plain) | 42 | 2 | 0 | 9 | 10 | 32 | Review ABS table. HSR failures suggest review added sugars |
| Fruit juices | 4 | 0 | 0 | 3 | 3 | 1 | |
| Sauces, dressings, dips and spreads | |||||||
| Guideline 3: Limit intake of foods high in saturated fats, added salt, added sugars and alcohol. | |||||||
| Vinegars | 11 | 0 | 4 | 8 | 11 | 0 | Review ABS table |
| Special foods | |||||||
| Not specifically covered | |||||||
| Meal replacements | 75 | 21 | 46 | 70 | 75 | 0 | Review ABS table and eligibility for HSR. HSR impacted by ‘as prepared’ |
| Sugars, honey and syrups | |||||||
| Guideline 3: Limit intake of foods high in saturated fats, added salt, added sugars and alcohol. Foods and drinks that are artificially sweetened can provide a useful alternative to those high in added sugars. | |||||||
| Sweeteners | 20 | 0 | 0 | 20 | 20 | 0 | Review ABS table and ADG text on artificial sweeteners |
| TOTAL | 2219 | 1136 | 1159 | 538 | 2116 | 103 | |
| Major Food Categories (Extracts of Relevant ADG text *) | n | Saturated Fat Traffic Light Red | Sodium Traffic Light Red | Total Sugar Traffic Light Red | n ADG Failure | n HSR Failure | Policy Recommendation (Where n ≥ 10) |
| Breads and bakery | |||||||
| Guideline 2: Go for wholegrains. Wholemeal or wholegrain varieties are preferable because they provide more dietary fibre, vitamins and minerals than refined grain (cereal) foods... Grain (cereal) foods which have high amounts of added saturated fats, added sugars, and/or salt such as most cakes, muffins, pies, pastries and biscuits are not included in this group but are classified ‘discretionary’ choices. | |||||||
| Bread | |||||||
| Savoury breads | 36 | 1 | 2 | 0 | 33 | 3 | Mostly healthier options of discretionary foods |
| Sweet breads | 17 | 0 | 1 | 4 | 12 | 5 | Mostly healthier options of discretionary foods |
| Others (garlic bread, ice cream cone, taco shell) | 25 | 0 | 0 | 0 | 25 | 0 | None. Healthier options of discretionary foods |
| Biscuits | |||||||
| Savoury biscuits (crackers and crispbreads) | 20 | 0 | 2 | 1 | 17 | 3 | Mostly healthier options of discretionary foods Review ABS table and kJ cut-off savoury biscuits |
| Sweet unfilled biscuits (plain, fruit and nut) | 17 | 0 | 0 | 5 | 12 | 5 | Mostly healthier versions of discretionary foods |
| Plain dry biscuits | 12 | 0 | 0 | 0 | 12 | 0 | None. Healthier options of discretionary foods |
| Cakes, Muffins and Pastries | |||||||
| Pastries (filo sheets, quiches) | 24 | 6 | 1 | 0 | 17 | 7 | Mostly healthier versions of discretionary foods |
| Cake mixes | 8 | 0 | 1 | 0 | 7 | 1 | |
| Cakes | 8 | 0 | 0 | 1 | 7 | 1 | |
| Cereal and Grain Products | |||||||
| Guideline 2: Go for wholegrains. Wholemeal or wholegrain varieties are preferable because they provide more dietary fibre, vitamins and minerals than refined grain (cereal) foods... Grain (cereal) foods which have high amounts of added saturated fats, added sugars, and/or salt such as most cakes, muffins, pies, pastries and biscuits are not included in this group but are classified ‘discretionary’ choices. | |||||||
| Cereal and nut-based bars | |||||||
| Cereal bars | 158 | 1 | 1 | 22 | 134 | 24 | Mostly healthier versions of discretionary foods HSR failures suggest review sugar, added sugars |
| Nut-based bars | 46 | 3 | 0 | 12 | 32 | 14 | Mostly healthier versions of discretionary foods HSR failures suggest review sugar, added sugars |
| Puff-based bars | 9 | 0 | 0 | 1 | 8 | 1 | |
| Ready-to-eat breakfast cereals | |||||||
| Sweet, cocoa-based and puff cereals | 38 | 0 | 0 | 25 | 13 | 25 | HSR failures suggest review sugar, added sugars Review ABS table. Sugar cut-off for breakfast cereals (30/100 g, 35/100 g with fruit) already high. |
| Breakfast cookie/rusk | 9 | 0 | 0 | 1 | 8 | 1 | |
| Other cereal products | |||||||
| Stuffing mixes | 2 | 0 | 0 | 0 | 2 | 0 | Healthier versions of discretionary foods |
| Confectionery | |||||||
| Guideline 3: Limit intake of foods high in saturated fats, added salt, added sugars and alcohol. Limit intake of foods and drinks containing added sugars such as confectionary (sic) | |||||||
| Chewing gums | 75 | 0 | 0 | 0 | 75 | 0 | Review application of HSR |
| Jelly | 63 | 0 | 0 | 7 | 57 | 7 | Mostly healthier versions of discretionary foods HSR failures suggest review sugar, added sugars |
| Chocolate and sweets | 36 | 4 | 0 | 1 | 31 | 5 | Mostly healthier versions of discretionary foods HSR failures suggest review saturated fat |
| Convenience foods | |||||||
| Guideline 2: Eat a wide variety of nutritious foods from the five food groups… Guideline 3: Limit intake of foods containing saturated fats, added salt, added sugars and alcohol. | |||||||
| Ready meals | |||||||
| Frozen ready meals | 180 | 22 | 24 | 7 | 136 | 44 | Many healthier versions of discretionary foods Review ABS table: complexity of classification highlights diversity of products. HSR failures suggest review salt and saturated fat |
| Ambient ready meals | 127 | 10 | 22 | 4 | 98 | 29 | As above |
| Chilled ready meals | 97 | 50 | 21 | 6 | 40 | 57 | As above |
| Others (meal kits) | 8 | 2 | 3 | 1 | 4 | 4 | |
| Soup | |||||||
| Dry Soup mixes (as prepared with water) | 96 | 0 | 0 | 2 | 94 | 2 | ABS table review HSR impacted by ‘as prepared’ |
| Dairy | |||||||
| Guideline 2: Include milk, yoghurt and cheese and/or alternatives—mostly reduced fat Some other milk products, such as ice-cream, can be relatively high in saturated fat and added sugars, so are classified under discretionary choices, together with cream and butter. | |||||||
| Ice creams and edible ices | |||||||
| Edible ices | 28 | 0 | 0 | 2 | 26 | 2 | None. Healthier options of discretionary foods |
| Ice creams | 16 | 0 | 0 | 1 | 15 | 1 | None. Healthier options of discretionary foods |
| Frozen yoghurt | 4 | 0 | 0 | 2 | 2 | 2 | |
| Soy-based ice cream | 2 | 0 | 0 | 0 | 2 | 0 | |
| Desserts | |||||||
| Rice puddings | 31 | 0 | 0 | 27 | 4 | 27 | HSR failures suggest review sugar, added sugars |
| Other prepared desserts, mousses | 18 | 0 | 0 | 0 | 18 | 0 | None. Healthier options of discretionary foods |
| Dessert mixes | 9 | 1 | 0 | 1 | 7 | 2 | |
| Milks | |||||||
| Probiotic drinks | 9 | 0 | 0 | 5 | 4 | 5 | |
| Edible oils and oil emulsions | |||||||
| Guideline 3: Limit intake of foods containing saturated fats, added salt, added sugars and alcohol. Replace high fat foods which contain predominately saturated fats such as butter, cream, cooking margarine, coconut and palm oil with foods which contain predominately polyunsaturated and monounsaturated fats such as oils, spreads, nut butters/pastes and avocado. | |||||||
| Edible oils | 2 | 1 | 0 | 1 | 0 | 2 | |
| Eggs | - | - | - | - | - | - | |
| Fish and fish products | |||||||
| Guideline 2: Choose lean meat and poultry, fish, eggs and/or plant-based alternatives Fresh, frozen and canned varieties of meats, poultry or fish are all suitable, but choose varieties that are low in salt and saturated fat. Processed meats such as salami, mettwurst, bacon and ham are not part of this food group. They are classified as discretionary choices because they are high in saturated fat and/or salt. | |||||||
| Processed fish | |||||||
| Frozen fish | 219 | 0 | 13 | 0 | 131 | 13 | Review ABS table Most are healthier versions of discretionary foodsHSR failures suggest review salt |
| Fruit and vegetables | |||||||
| Guideline 2: Tuck into vegetables and fruit. Fresh, frozen, canned or dried varieties of vegetables and fruit are all suitable foods. Check the ingredients list and choose varieties of canned vegetables without added salt and canned fruit in natural juice, not syrup. Vegetables and fruit to limit: …dried fruit can also stick to the teeth and increase the risk of tooth decay. For this reason…dried fruit should be consumed only occasionally and in small amounts. The intake of some salted, dried, fermented or pickled vegetables has been associated with increased risk of some cancers, so intake of these foods should be limited. Also limit intake of fried vegetables such as potato and vegetable chips and crisps, which add extra kilojoules and salt. Chips and crisps are included in ‘discretionary choices’. | |||||||
| Vegetables | |||||||
| Pickled vegetables | 155 | 1 | 35 | 3 | 117 | 38 | Many healthier options of discretionary foods HSR failures suggest review salt |
| Frozen potato products | 125 | 1 | 0 | 0 | 124 | 1 | Review ABS table ‘Potato Products’ Healthier options of discretionary foods |
| Fruit | |||||||
| Fruit bars and bites | 52 | 4 | 0 | 46 | 5 | 47 | HSR failures suggest review sugar, added sugars |
| Jams and marmalades | 4 | 0 | 0 | 0 | 4 | 0 | |
| Seasonings | 11 | 0 | 0 | 0 | 11 | 0 | Review ABS table |
| Meat and meat products | |||||||
| Guideline 2: Choose lean meat and poultry, fish, eggs and/or plant-based alternatives. Fresh, frozen and canned varieties of meats, poultry or fish are all suitable, but choose varieties that are low in salt and saturated fat. Processed meats such as salami, mettwurst, bacon and ham are not part of this food group. They are classified as discretionary choices because they are high in saturated fat and/or salt. | |||||||
| Frozen and chilled meats | |||||||
| Coated/breaded/frozen meats | 152 | 8 | 17 | 0 | 128 | 24 | Mostly healthier options of discretionary foods HSR failures suggest review salt, saturated fat |
| Meat with pastry | 57 | 36 | 6 | 0 | 20 | 37 | Some healthier options of discretionary foods HSR failures suggest review saturated fat, salt |
| Sliced meats | 104 | 0 | 84 | 0 | 20 | 84 | Some healthier options of discretionary foods HSR failures suggest review salt |
| Canned meats | 46 | 1 | 11 | 0 | 34 | 12 | Many healthier options of discretionary foods HSR failures suggest review salt |
| Salami and cured meats | 8 | 2 | 1 | 0 | 5 | 3 | |
| Burgers | 7 | 7 | 0 | 0 | 0 | 7 | |
| Dried meats | 6 | 0 | 0 | 0 | 6 | 0 | |
| Bacon | 4 | 0 | 3 | 0 | 1 | 3 | |
| Non-alcoholic beverages | |||||||
| Water is essential for life. Choose water instead of drinks with added sugars or alcohol…Consumption of drinks with added sugars, such as soft drinks and cordials, fruit drinks, vitamin waters, energy and sports drinks can increase risk of excessive weight gain in both children and adults. Water has an advantage over these drinks, and also over fruit juice and artificially sweetened soft drinks… | |||||||
| Hot chocolate, milk flavourings | 22 | 0 | 0 | 15 | 15 | 7 | HSR impacted by as prepared HSR failures suggest review sugar, added sugars |
| Beverage mixes | 6 | 0 | 0 | 1 | 5 | 1 | |
| Electrolyte drinks | 2 | 0 | 0 | 0 | 2 | 0 | |
| Sauces, dressings, spreads and dips | |||||||
| Guideline 3: Limit intake of foods containing saturated fats, added salt, added sugars and alcohol. Tips to eat less saturated fat: … cut down on dishes with cream, buttery or creamy sauces or fatty gravy, instead choose tomato-based dishes. Limit foods high in added sugars including… sweetened sauces and dressings… | |||||||
| Sauces | |||||||
| Pasta sauces | |||||||
| Tomato-based pasta sauces | 389 | 2 | 15 | 1 | 371 | 18 | Mostly healthier options of discretionary foods Review ABS table, tomato sauces home vs commercial HSR failures suggest review salt |
| Cream-based pasta sauces | 37 | 4 | 4 | 0 | 29 | 8 | Many healthier options of discretionary foods HSR failures suggest review saturated fat, salt |
| Meat-based pasta sauces | 15 | 0 | 1 | 0 | 14 | 1 | None. Mostly healthier options of discretionary foods |
| Meal-based sauces | |||||||
| Ambient meal-based sauces | 84 | 4 | 1 | 5 | 75 | 9 | Mostly healthier options of discretionary foods HSR impacted by as prepared |
| Powdered meal-based sauces | 44 | 4 | 7 | 1 | 33 | 11 | Many healthier options of discretionary foods HSR impacted by as prepared |
| Liquid recipe bases | 41 | 1 | 14 | 0 | 26 | 15 | Many healthier options of discretionary foods HSR impacted by as prepared HSR failures suggest review salt |
| Curry pastes | 11 | 0 | 1 | 1 | 9 | 2 | Mostly healthier options of discretionary foods |
| Gravies and stocks | 16 | 0 | 0 | 0 | 16 | 0 | Mostly healthier options of discretionary foods HSR impacted by as prepared |
| Table sauces | 54 | 0 | 11 | 15 | 28 | 26 | Some healthier options of discretionary foods HSR failures suggest review salt, sugar, added sugars |
| Meat accompaniments | 24 | 0 | 1 | 3 | 20 | 4 | Mostly healthier options of discretionary foods HSR failures suggest review sugar, added sugars |
| Spreads and dips | |||||||
| Dips | |||||||
| Vegetable- based chilled dips (hummus, tzatziki, guacamole) | 292 | 9 | 22 | 1 | 262 | 30 | Mostly healthier options of discretionary foods HSR failures suggest review salt, saturated fat |
| Salsa | 68 | 0 | 16 | 0 | 52 | 16 | Mostly healthier options of discretionary foods HSR failures suggest review salt |
| Savoury spreads | |||||||
| Relishes, pickles and chutneys | 124 | 0 | 19 | 57 | 48 | 76 | Some healthier options of discretionary foods HSR failures suggest review salt, sugar, added sugars |
| Other savoury spreads | 7 | 0 | 2 | 0 | 5 | 2 | |
| Other spreads | 15 | 3 | 0 | 8 | 4 | 11 | HSR failures suggest review sugar, saturated fat |
| Salad dressings and vinegars | 10 | 0 | 0 | 0 | 10 | 0 | None. Healthier options of discretionary foods |
| Snack foods | |||||||
| Guideline 2: Vegetables and fruit to limit…Limit intake of fried vegetables such as potato and vegetable chips and crisps, which add extra kilojoules and salt. Chips and crisps are included in ‘discretionary choices’ Guideline 3: Limit intake of foods containing saturated fats, added salt, added sugars and alcohol. | |||||||
| Potato chips | 246 | 2 | 46 | 0 | 198 | 49 | Many healthier options of discretionary foods HSR failures suggest review salt, FVNL points |
| Other snackfoods | 127 | 21 | 30 | 5 | 80 | 47 | Many healthier options of discretionary foods HSR failures suggest review salt, sat fat, FVNL points |
| Corn chips | 91 | 17 | 17 | 0 | 57 | 34 | Many healthier options of discretionary foods HSR failures suggest review salt, sat fat, FVNL points |
| Snack packs | 23 | 0 | 0 | 0 | 23 | 0 | Review ABS table definitions |
| Vege-based snacks | 62 | 5 | 32 | 5 | 24 | 38 | Some healthier options of discretionary foods HSR failures suggest review salt, saturated fat, sugar, FVNL points |
| Popcorn | 55 | 2 | 2 | 1 | 50 | 5 | Mostly healthier options of discretionary foods |
| Special foods | |||||||
| Not specifically covered in ADG text. | |||||||
| Special foods | 2 | 0 | 0 | 0 | 2 | 0 | |
| Sugars, honey and related products | |||||||
| Guideline 3: Limit intake of foods high in saturated fats, added salt, added sugars and alcohol. Limit foods high in added sugars including…syrups… | |||||||
| Syrups | 14 | 0 | 0 | 5 | 5 | 9 | HSR failures suggest review sugar |
| Sugars | 1 | 0 | 0 | 0 | 0 | 1 | |
| TOTAL | 4105 | 235 | 510 | 296 | 3130 | 975 | |
References
- Lim, S.S.; Vos, T.; Flaxman, A.D.; Danaei, G.; Shibuya, K.; Adair-Rohani, H.; Amann, M.; Anderson, H.R.; Andrews, K.G.; Aryee, M.; et al. A comparative risk assessment of burden of disease and injury attributable to 67 risk factors and risk factor clusters in 21 regions, 1990–2010: A systematic analysis for the global burden of disease study 2010. Lancet (Lond. Engl.) 2012, 380, 2224–2260. [Google Scholar] [CrossRef]
- Stuckler, D.; McKee, M.; Ebrahim, S.; Basu, S. Manufacturing epidemics: The role of global producers in increased consumption of unhealthy commodities including processed foods, alcohol, and tobacco. PLoS Med. 2012, 9, e1001235. [Google Scholar] [CrossRef] [PubMed]
- PricewaterhouseCoopers. Weighing the Cost of Obesity: A Case for Action; PricewaterhouseCoopers: Sydney, Australia, 2015. [Google Scholar]
- World Health Organization. ‘Best Buys’ and Other Recommended Interventions for the Prevention and Control of Noncommunicable Diseases, Updated (2017) Appendix 3 of the Global Action Plan for the Prevention and Control of Non-Communicable Diseases 2013–2020; World Health Organization: Geneva, Switzerland, 2017. [Google Scholar]
- Sacks, G.; for the Food-EPI Australia Team. Policies for Tackling Obesity and Creating Healthier Food Environments: Scorecard and Priority Recommendations for Australian Governments; Deakin University: Melbourne, Australia, 2017. [Google Scholar]
- National Health and Medical Research Council. Australian Dietary Guidelines; National Health and Medical Research Council (NHMRC): Canberra, Australia, 2013.
- Senator the Hon Fiona Nash Assistant Minister for Health. Media Release: Health Star Rating System on Track; Senator the Hon Fiona Nash Assistant Minister for Health: Canberra, Australia, 2014.
- Department of Health. The health Star Rating System (Website). Available online: http://healthstarrating.gov.au/internet/healthstarrating/publishing.nsf/content/home (accessed on 27 July 2017).
- Australia and New Zealand Food Regulation Ministerial Council. Front of Pack Labelling Policy Statement. Available online: http://foodregulation.gov.au/internet/fr/publishing.nsf/Content/7F1E2F73C65A6463CA25801B0010D7FB/$File/2009-10-Forum-Policy%20Statement-Front%20of%20Pack%20Labelling.pdf (accessed on 18 April 2018).
- Lawrence, M.; Dickie, S.; Woods, J. Do nutrient-based front-of-pack labelling schemes support or undermine food-based dietary guideline recommendations? Lessons from the Australian health star rating system. Nutrients 2018, 10, 32. [Google Scholar] [CrossRef] [PubMed]
- Lawrence, M.; Pollard, C. A year on, Australia’s health star food-rating system is showing cracks [online]. J. Home Econ. Inst. Aust. 2015, 22, 34–35. [Google Scholar]
- Dunford, E.; Trevena, H.; Goodsell, C.; Ng, K.H.; Webster, J.; Millis, A.; Goldstein, S.; Hugueniot, O.; Neal, B. Foodswitch: A mobile phone app to enable consumers to make healthier food choices and crowdsourcing of national food composition data. JMIR mHealth uHealth 2014, 2, e37. [Google Scholar] [CrossRef] [PubMed]
- Dunford, E.; Webster, J.; Metzler, A.B.; Czernichow, S.; Mhurchu, C.N.; Wolmarans, P.; Snowdon, W.; L’Abbe, M.; Li, N.; Maulik, P.K. International collaborative project to compare and monitor the nutritional composition of processed foods. Eur. J. Prev. Cardiol. 2012, 19, 1326–1332. [Google Scholar] [CrossRef] [PubMed]
- Health Star Rating Advisory Committee (HSRAC). Health Star Rating System Style Guide V4, 4th ed.; Health Star Rating Advisory Committee (HSRAC): Canberra, Australia, 2016.
- Australia New Zealand Food Standards Code—Standard 1.2.8—Nutrition Information Requirements. Available online: https://www.legislation.gov.au/Details/F2011C00537 (accessed on 18 April 2018).
- Health Star Rating Advisory Committee (HSRAC). Guide for Industry to the Health Star Rating Calculator (HSRC); version 5; Department of Health, Ed.; Health Star Rating Advisory Committee (HSRAC): Canberra, Australia, 2016.
- Australian Bureau of Statistics. Australian Health Survey: Users’ Guide, 2011–13—Discretionary Food List; Australian Bureau of Statistics: Canberra, Australia, 2014.
- National Health and Medical Research Council. A Modelling System to Inform the Revision of the Australian Guide to Healthy Eating; National Health and Medical Research Council (NHMRC): Canberra, Australia, 2011.
- United Kingdom Department of Health. Guide to Creating a Front of Pack (Fop) Nutrition Label for Pre-Packed Products Sold Through Retail Outlets; Department of Health, Ed.; United Kingdom Department of Health: London, UK, 2016.
- Emrich, T.E.; Qi, Y.; Lou, W.Y.; L’Abbe, M.R. Traffic-light labels could reduce population intakes of calories, total fat, saturated fat, and sodium. PLoS ONE 2017, 12, e0171188. [Google Scholar] [CrossRef] [PubMed]
- Julia, C.; Ducrot, P.; Lassale, C.; Fézeu, L.; Méjean, C.; Péneau, S.; Touvier, M.; Hercberg, S.; Kesse-Guyot, E. Prospective associations between a dietary index based on the british food standard agency nutrient profiling system and 13-year weight gain in the su. Vi. Max cohort. Prev. Med. 2015, 81, 189–194. [Google Scholar] [CrossRef] [PubMed]
- Tapsell, L.C.; Neale, E.P.; Satija, A.; Hu, F.B. Foods, nutrients, and dietary patterns: Interconnections and implications for dietary guidelines. Adv. Nutr. 2016, 7, 445–454. [Google Scholar] [CrossRef] [PubMed]
- Dunford, E.; Cobcroft, M.; Thomas, M.; Wu, J. Technical Report: Alignment of the NSW Healthy Food Provision Policy with the Health Star Rating System; NSW Ministry of Health: Sydney, Australia, 2015.
- Wellard, L.; Hughes, C.; Watson, W.L. Investigating nutrient profiling and health star ratings on core dairy products in australia. Public Health Nutr. 2016, 19, 2860–2865. [Google Scholar] [CrossRef] [PubMed]
- Carrad, A.M.; Louie, J.C.Y.; Yeatman, H.R.; Dunford, E.K.; Neal, B.C.; Flood, V.M. A nutrient profiling assessment of packaged foods using two star-based front-of-pack labels. Public Health Nutr. 2016, 19, 2165–2174. [Google Scholar] [CrossRef] [PubMed]
- Peters, S.A.; Dunford, E.; Jones, A.; Ni Mhurchu, C.; Crino, M.; Taylor, F.; Woodward, M.; Neal, B. Incorporating added sugar improves the performance of the health star rating front-of-pack labelling system in australia. Nutrients 2017, 9, 701. [Google Scholar] [CrossRef] [PubMed]
- Codex Alimentarius Commission Committee on Food Labelling. Report of the Forty Fourth Session of the Codex Commitee on Food Labelling; Codex Alimentarius Commission Committee on Food Labelling: Ascunsion, Paraguay, 2017. [Google Scholar]
- MP Consulting. Report on Submissions to the Five Year Review of the Health Star Rating System: Prepared for the commonwealth Department of Health; MP consulting: Melbourne, Australia, 2017. [Google Scholar]
- Menday, H.; Neal, B.; Wu, J.H.Y.; Crino, M.; Baines, S.; Petersen, K.S. Use of added sugars instead of total sugars may improve the capacity of the health star rating system to discriminate between core and discretionary foods. J. Acad. Nutr. Diet. 2017, 117, 1921–1930.e1911. [Google Scholar] [CrossRef] [PubMed]
- Louie, J.C.Y.; Moshtaghian, H.; Boylan, S.; Flood, V.M.; Rangan, A.; Barclay, A.; Brand-Miller, J.; Gill, T. A systematic methodology to estimate added sugar content of foods. Eur. J. Clin. Nutr. 2015, 69, 154. [Google Scholar] [CrossRef] [PubMed]
- MP Consulting. Five Year Review of the Health Star Rating System—Navigation Paper; MP Consulting: Melbourne, Australia, 2018. [Google Scholar]
- World Health Organization. Nutrient Profiling. Available online: http://www.who.int/nutrition/topics/profiling/en/ (accessed on 1 February 2017).
- National Health and Medical Research Council. Eat for Health Educators Guide; National Health and Medical Research Council (NHMRC): Camberra, Australia, 2013.


| Objective | Mechanism | Target Audience | Classification of Foods | Developed by | Governed by | |
|---|---|---|---|---|---|---|
| Australian Dietary Guidelines | Provide information on food groups, amounts and dietary patterns that support health. | Guideline Documents, Summary and Educator Guide. Australian Guide to Healthy Eating graphic | Health professionals, policy makers, educators, food manufacturers, food retailers and researchers. | Classification of foods into Five Food Groups that form the basis of a healthy diet, and ‘discretionary’ foods defined by the presence of saturated fat, added sugars, salt and/or alcohol, whose intake is to be limited. | National Health and Medical Research Council (NHMRC) via standardised guideline process. Working Committee incl. public health and industry representation. | NHMRC NHMRC considers whether to update after 5 years. Maximum interval prior to update is 10 years. |
| Health Star Rating | Simplify nutrition information available on back-of-pack to differentiate between individual foods more likely to be part of a healthy diet from those that are less healthy. | Front-of-pack label to be applied voluntarily by food retailers and manufacturers using relevant policy documents. | Consumers at point of purchase. Food retailers and manufacturers. | A nutrient profile model is used to score individual products from 0.5 to 5.0 stars. The algorithm considers energy, negative nutrients the ADGs recommend eating less of (saturated fat, sugars and sodium), and foods the ADGs recommend eating more of (fruits, vegetables, nuts and legumes) as well as in some instances, allowing points for protein and dietary fibre content. | Australian Fed., State and territory governments in partnership with food industry, consumer and public health groups. | Health Star Rating Advisory Committee. Representation from Australian Federal, State and Territory governments as well as food industry, consumer and public health groups. 2 year monitoring report and 5 year review process set down at adoption. |
| Apparent Outliers | ADG Failure | HSR Failure | |
|---|---|---|---|
| HSR ≤ 2.0 | 2219 | 2116 | 103 |
| HSR ≥ 3.5 | 4105 | 3130 | 795 |
| Major Food Category | Number of Apparent Outliers | Number of Products with Any Red TLL | Outliers Remaining | Illustrative Examples of Outliers Remaining | Characteristics of Remaining Outliers |
|---|---|---|---|---|---|
| 1 Bread and bakery products | 193 | 187 | 6 | Pancake mixes, tortillas |
|
| 2 Cereal and grain products | 174 | 172 | 2 | Rice puff cereal, noodles |
|
| 3 Confectionery | 0 | - | - | - | |
| 4 Convenience foods | 57 | 56 | 1 | Antipasto product |
|
| 5 Dairy | 1056 | 997 | 58 | Fruit and flavoured yoghurts, natural yoghurt |
|
| 6 Edible oils and oil emulsions | 73 | 73 | 0 | - | |
| 7 Eggs | 0 | - | - | - | |
| 8 Fish and fish products | 163 | 160 | 3 | Salmon pate, garlic prawns |
|
| 9 Fruit and vegetables | 181 | 181 | 0 | - | |
| 10 Meat and meat products | 168 | 168 | 0 | - | |
| 11 Non-alcoholic beverages | 46 | 13 | 33 | Fruit flavoured teas and iced teas, matcha |
|
| 12 Sauces, dressings, spreads and dips | 11 | 11 | 0 | - | |
| 13 Snack foods | 0 | - | - | - | |
| 14 Special foods | 75 | 75 | 0 | - | |
| 15 Sugars, honey and related products | 23 | 23 | 0 | - | |
| All | 2219 | 2116 | 103 |
| Major Food Category | Number of Apparent Outliers | Number of Products No Red TLL | Outliers Remaining | Illustrative Examples of Outliers Remaining | Characteristics of Remaining Outliers |
|---|---|---|---|---|---|
| 1 Bread and bakery products | 166 | 141 | 25 | Sweet biscuits, savoury breads and pastries |
|
| 2 Cereal and grain products | 254 | 190 | 64 | Breakfast cereals, cereal and nut-based bars |
|
| 3 Confectionery | 173 | 161 | 12 | Jellies, cocoa powder, chocolate strawberries |
|
| 4 Convenience foods | 508 | 372 | 136 | Ready meals, meal kits |
|
| 5 Dairy | 108 | 76 | 32 | Rice puddings |
|
| 6 Edible oils and oil emulsions | 2 | 0 | 2 | Almond oil, lemon butter |
|
| 7 Eggs | 0 | - | - | - | |
| 8 Fish and fish products | 219 | 206 | 13 | Salt and pepper products, fish cakes |
|
| 9 Fruit and vegetables | 347 | 261 | 86 | Fruit bars and bites, pickled vegetables |
|
| 10 Meat and meat products | 384 | 213 | 171 | Sliced meats, frozen and chilled meats |
|
| 11 Non-alcoholic beverages | 30 | 22 | 8 | Milk flavourings, beverages mixes |
|
| 12 Sauces, dressings, spreads and dips | 1245 | 1015 | 230 | Salty dips, relishes and chutneys |
|
| 13 Snack foods | 652 | 461 | 191 | Potato chips, vegetable and legume-based snacks, corn chips |
|
| 14 Special foods | 2 | 2 | - | - | |
| 15 Sugars, honey and related products | 15 | 10 | 5 | Syrups |
|
| All | 4105 | 3130 | 975 |
|
|
|
|
|
|
© 2018 by the authors. Licensee MDPI, Basel, Switzerland. This article is an open access article distributed under the terms and conditions of the Creative Commons Attribution (CC BY) license (http://creativecommons.org/licenses/by/4.0/).
Share and Cite
Jones, A.; Rådholm, K.; Neal, B. Defining ‘Unhealthy’: A Systematic Analysis of Alignment between the Australian Dietary Guidelines and the Health Star Rating System. Nutrients 2018, 10, 501. https://0-doi-org.brum.beds.ac.uk/10.3390/nu10040501
Jones A, Rådholm K, Neal B. Defining ‘Unhealthy’: A Systematic Analysis of Alignment between the Australian Dietary Guidelines and the Health Star Rating System. Nutrients. 2018; 10(4):501. https://0-doi-org.brum.beds.ac.uk/10.3390/nu10040501
Chicago/Turabian StyleJones, Alexandra, Karin Rådholm, and Bruce Neal. 2018. "Defining ‘Unhealthy’: A Systematic Analysis of Alignment between the Australian Dietary Guidelines and the Health Star Rating System" Nutrients 10, no. 4: 501. https://0-doi-org.brum.beds.ac.uk/10.3390/nu10040501