Assessing the Intergenerational Linkage between Short Maternal Stature and Under-Five Stunting and Wasting in Bangladesh


Abstract
:1. Introduction
2. Materials and Methods
2.1. Data Sources and Sampling Design
2.2. Ethics
2.3. Conceptual Framework
2.4. Primary Outcomes
2.5. Main Exposure
2.6. Covariates
2.7. Statistical Analysis
3. Results
3.1. Prevelance of Stunting and Wasting among the Study Participants and Their Characteristics
3.2. Average Maternal Stature
3.3. Association of Maternal Stature with Offspring Stunting and Severe Stunting
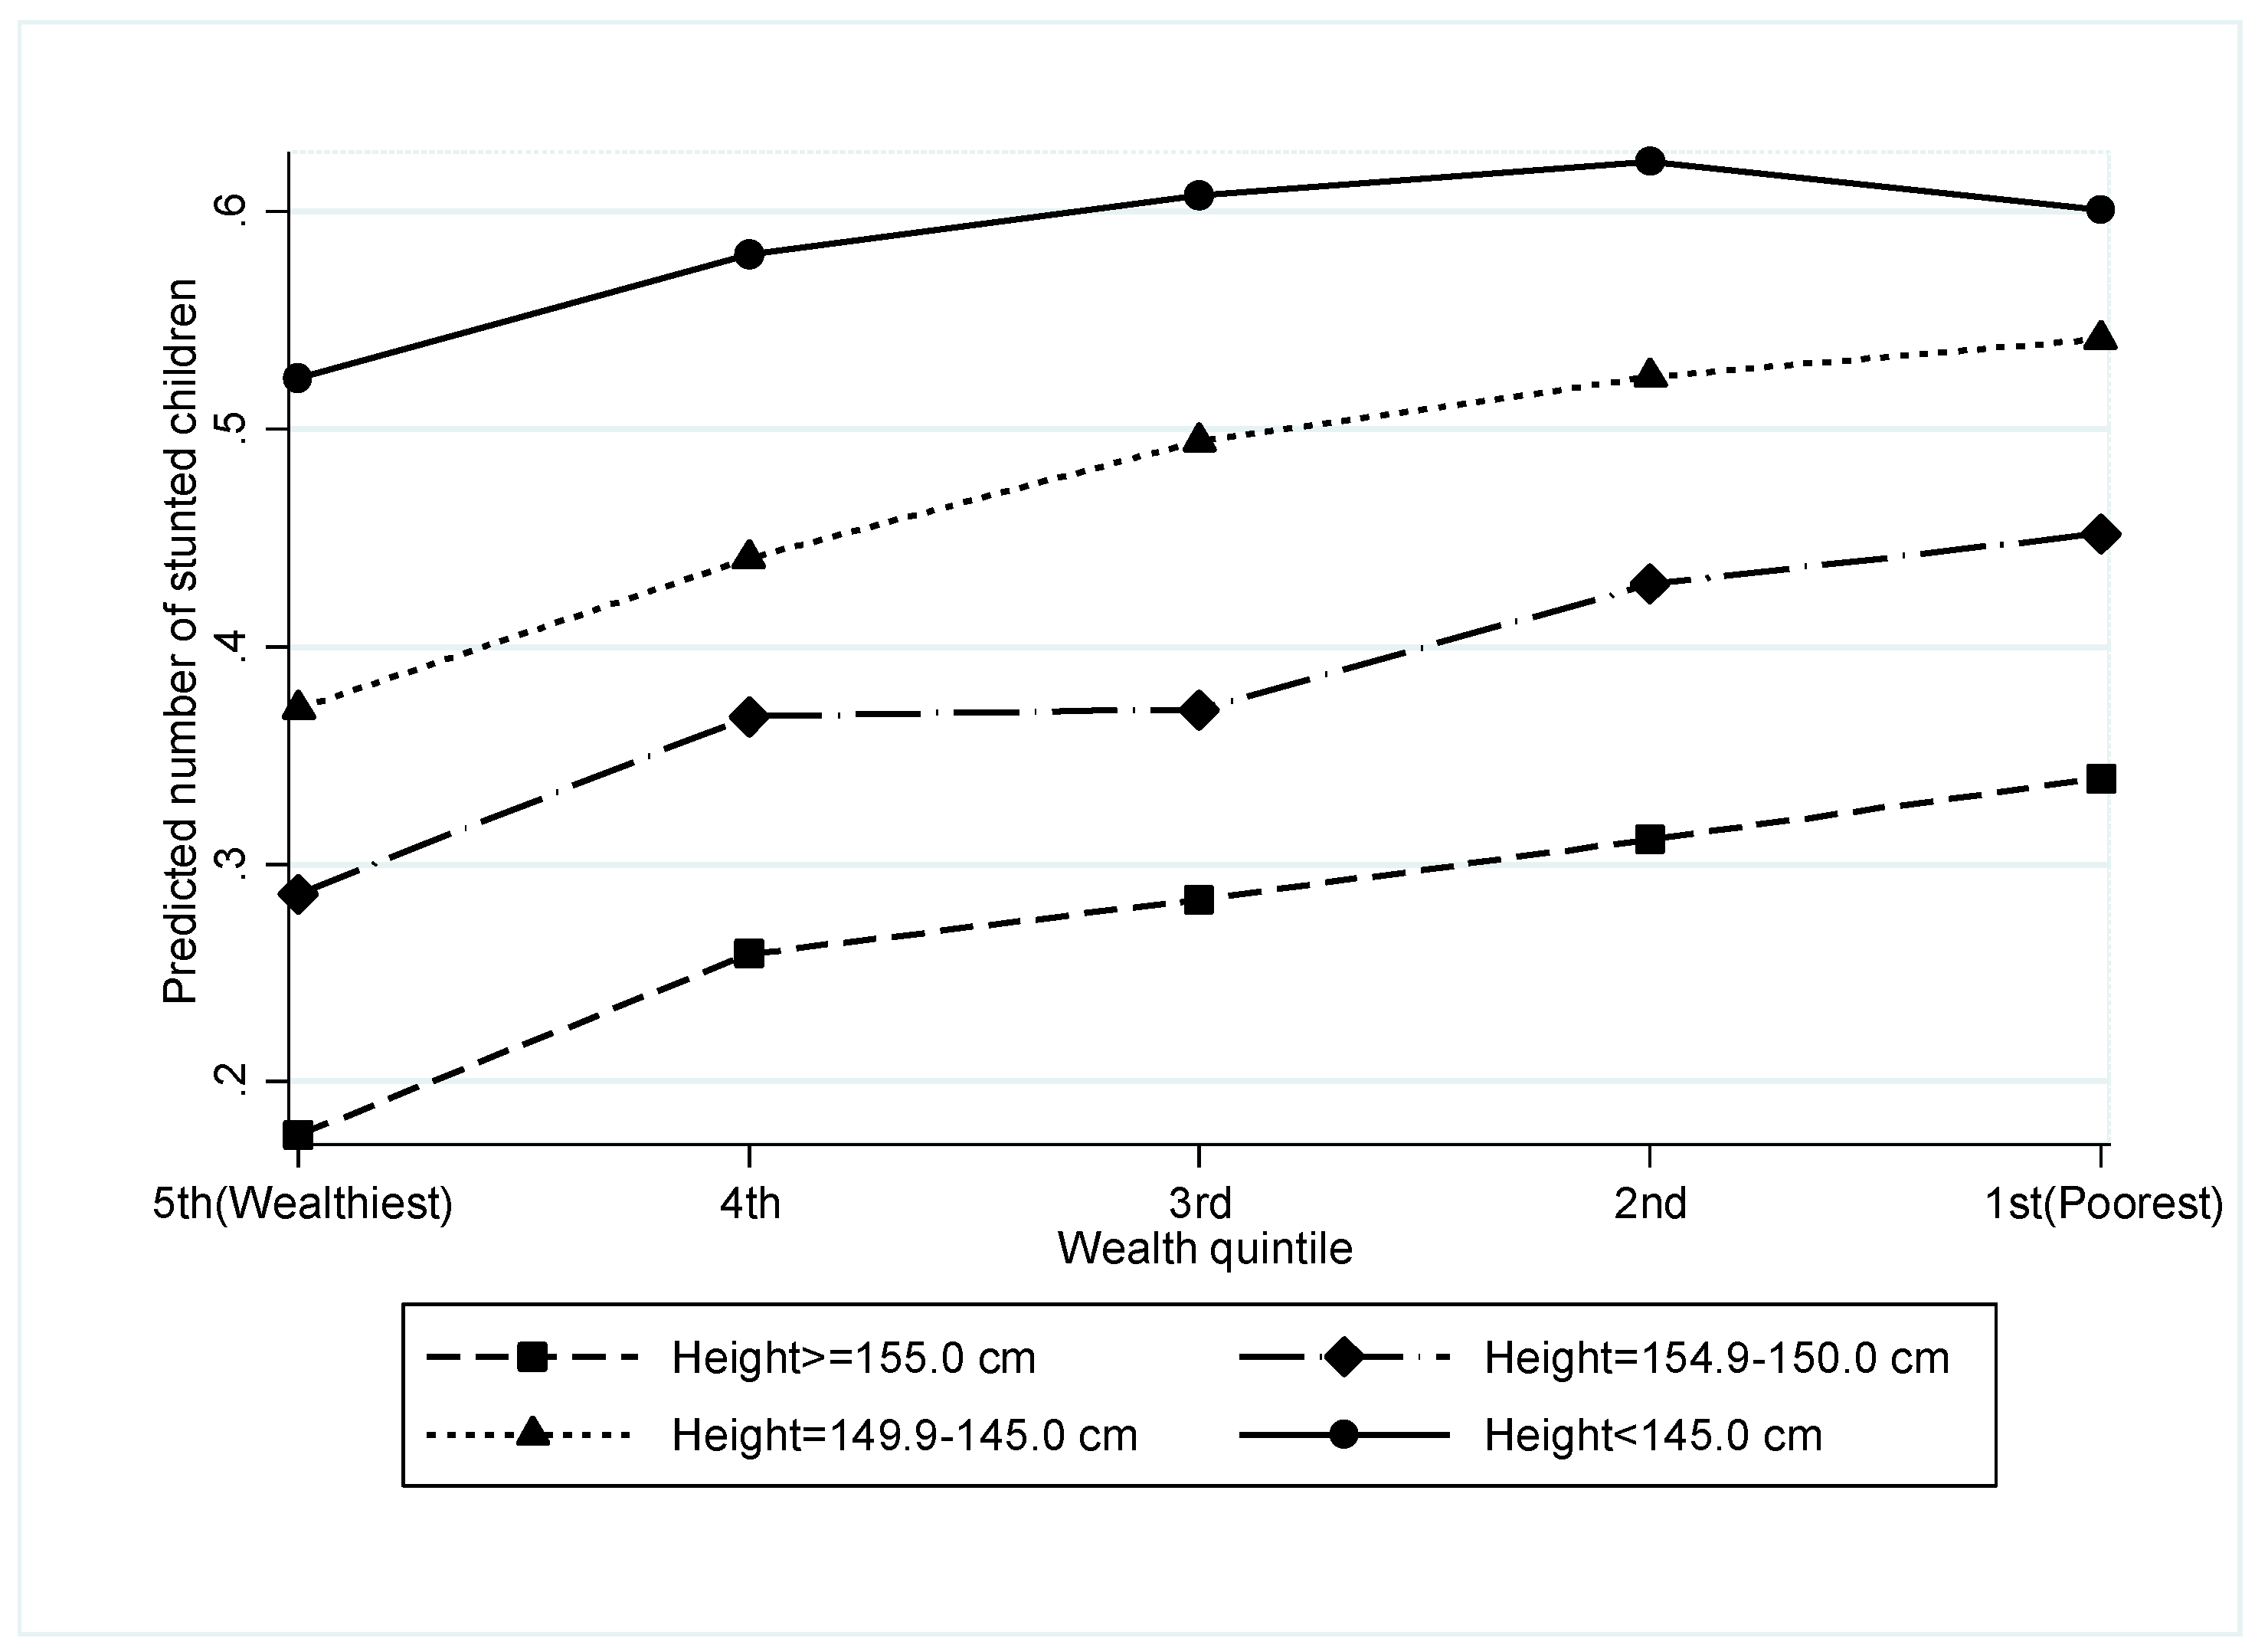
3.4. Interaction between Maternal Stature and Household Wealth and Its Effect on Stunting
3.5. Association of Maternal Stature with Offspring Wasting and Severe Wasting
4. Discussion
4.1. Main Findings
4.2. Strength and Limitations
4.3. Association of Maternal Stature with Offspring Stunting and Wasting
4.4. Maternal Short Stature and the Risk of Offspring Stunting and Wasting
4.5. Interactions between Household Wealth and Maternal Short Stature on Child Stunting
4.6. Policy Implications
5. Conclusions
Supplementary Materials
Author Contributions
Funding
Acknowledgments
Conflicts of Interest
References
- WHO. Global Health Observatory Visualizations. Joint Child Malnutrition Estimates 2017 (UNICEF-WHO-WB). Available online: http://apps.who.int/gho/data/node.wrapper.nutrition-2016?lang=en (accessed on 10 August 2018).
- National Institute of Population Research and Training (NIPORT); Mitra and Associates; ICF International. Bangladesh Demographic and Health Survey 2014; NIPORT, Mitra and Associates: Dhaka, Bangladesh; ICF International: Rockville, MD, USA, 2016. [Google Scholar]
- Black, R.E.; Victora, C.G.; Walker, S.P.; Bhutta, Z.A.; Christian, P.; De Onis, M.; Ezzati, M.; Grantham-McGregor, S.; Katz, J.; Martorell, R. Maternal and child undernutrition and overweight in low-income and middle-income countries. Lancet 2013, 382, 427–451. [Google Scholar] [CrossRef]
- Danaei, G.; Andrews, K.G.; Sudfeld, C.R.; Fink, G.; McCoy, D.C.; Peet, E.; Sania, A.; Smith Fawzi, M.C.; Ezzati, M.; Fawzi, W.W. Risk factors for childhood stunting in 137 developing countries: A comparative risk assessment analysis at global, regional, and country levels. PLoS Med. 2016, 13, e1002164. [Google Scholar] [CrossRef]
- Lunde, A.; Melve, K.K.; Gjessing, H.K.; Skjaerven, R.; Irgens, L.M. Genetic and environmental influences on birth weight, birth length, head circumference, and gestational age by use of population-based parent-offspring data. Am. J. Epidemiol. 2007, 165, 734–741. [Google Scholar] [CrossRef]
- Zhang, G.; Bacelis, J.; Lengyel, C.; Teramo, K.; Hallman, M.; Helgeland, O.; Johansson, S.; Myhre, R.; Sengpiel, V.; Njolstad, P.R.; et al. Assessing the causal relationship of maternal height on birth size and gestational age at birth: A Mendelian randomization analysis. PLoS Med. 2015, 12, e1001865. [Google Scholar] [CrossRef] [PubMed]
- Martorell, R.; Zongrone, A. Intergenerational influences on child growth and undernutrition. Paediatr. Perinat. Epidemiol. 2012, 26 (Suppl. 1), 302–314. [Google Scholar] [CrossRef]
- Jelenkovic, A.; Hur, Y.M.; Sund, R.; Yokoyama, Y.; Siribaddana, S.H.; Hotopf, M.; Sumathipala, A.; Rijsdijk, F.; Tan, Q.; Zhang, D.; et al. Genetic and environmental influences on adult human height across birth cohorts from 1886 to 1994. eLife 2016, 5, e20320. [Google Scholar] [CrossRef]
- Kozuki, N.; Katz, J.; Lee, A.C.; Vogel, J.P.; Silveira, M.F.; Sania, A.; Stevens, G.A.; Cousens, S.; Caulfield, L.E.; Christian, P.; et al. Short maternal stature increases risk of small-for-gestational-age and preterm births in low- and middle-income countries: Individual participant data meta-analysis and population attributable fraction. J. Nutr. 2015, 145, 2542–2550. [Google Scholar] [CrossRef] [PubMed]
- Farina, A.; Dini, B.; Mattioli, M.; Rosa, S.; Rizzo, N. Offspring birth weight in second-generation ‘small for gestational age’ infants. Prenat. Diagn. 2010, 30, 551–554. [Google Scholar] [CrossRef]
- Christian, P.; Lee, S.E.; Donahue Angel, M.; Adair, L.S.; Arifeen, S.E.; Ashorn, P.; Barros, F.C.; Fall, C.H.; Fawzi, W.W.; Hao, W. Risk of childhood undernutrition related to small-for-gestational age and preterm birth in low-and middle-income countries. Int. J. Epidemiol. 2013, 42, 1340–1355. [Google Scholar] [CrossRef]
- Ozaltin, E.; Hill, K.; Subramanian, S.V. Association of maternal stature with offspring mortality, underweight, and stunting in low- to middle-income countries. JAMA 2010, 303, 1507–1516. [Google Scholar] [CrossRef]
- Subramanian, S.V.; Ackerson, L.K.; Davey Smith, G.; John, N.A. Association of maternal height with child mortality, anthropometric failure, and anemia in India. JAMA 2009, 301, 1691–1701. [Google Scholar] [CrossRef]
- Kim, R.; Mejia-Guevara, I.; Corsi, D.J.; Aguayo, V.M.; Subramanian, S.V. Relative importance of 13 correlates of child stunting in South Asia: Insights from nationally representative data from Afghanistan, Bangladesh, India, Nepal, and Pakistan. Soc. Sci. Med. 2017, 187, 144–154. [Google Scholar] [CrossRef]
- Svefors, P.; Rahman, A.; Ekstrom, E.C.; Khan, A.I.; Lindstrom, E.; Persson, L.A.; Ekholm Selling, K. Stunted at 10 years. Linear growth trajectories and stunting from birth to pre-adolescence in a rural Bangladeshi cohort. PLoS ONE 2016, 11, e0149700. [Google Scholar] [CrossRef]
- Demographic and Health Surveys. Available online: http://dhsprogram.com/data/available-datasets.cfm (accessed on 8 August 2018).
- The DHS Programme. Demographic and Health Surveys. DHS Overview. Available online: http://dhsprogram.com/What-We-Do/Survey-Types/DHS.cfm (accessed on 8 August 2018).
- ICF International. Demographic and Health Survey Sampling and Household Listing Manual; ICF International: Calverton, MD, USA, 2012. [Google Scholar]
- ICF. Demographic and Health Survey Interviewer’s Manual; ICF: Rockville, MD, USA, 2017. [Google Scholar]
- Shireen, A.; Kothari, M.T.; Pullum, T. An Assessment of the Quality of DHS Anthropometric Data, 2005–2014; DHS Methodological Reports No. 16; ICF International: Rockville, MD, USA, 2015. [Google Scholar]
- UNICEF. Improving Child Nutrition: The Achievable Imperative for Global Progress. Available online: https://www.unicef.org/publications/index_68661.html (accessed on 10 July 2018).
- World Health Organization. WHO Child Growth Standards: Methods and Development. Length/Height-for-Age, Weight-for-Age, Weight-for-Length, Weight-for-Height and Body Mass Index-for-Age. Available online: http://www.who.int/childgrowth/standards/technical_report/en/ (accessed on 28 August 2018).
- Khatun, W.; Alam, A.; Rasheed, S.; Huda, T.M.; Dibley, M.J. Exploring the intergenerational effects of undernutrition: Association of maternal height with neonatal, infant and under-five mortality in Bangladesh. BMJ Glob. Health 2018, 3, e000881. [Google Scholar] [CrossRef]
- Mostafa, K.S. Socio-economic determinants of severe and moderate stunting among under-five children of rural Bangladesh. Malays. J. Nutr. 2011, 17, 105–118. [Google Scholar]
- Rutstein, S.O.; Johnson, K. The DHS Wealth Index: DHS Comparative Reports No.6; ORC Macro: Calverton, MD, USA, 2004. [Google Scholar]
- Yelland, L.N.; Salter, A.B.; Ryan, P. Performance of the modified Poisson regression approach for estimating relative risks from clustered prospective data. Am. J. Epidemiol. 2011, 174, 984–992. [Google Scholar] [CrossRef]
- Rahman, M. Association between order of birth and chronic malnutrition of children: A study of nationally representative Bangladeshi sample. Cad. Saude Publ. 2016, 32, e00011215. [Google Scholar] [CrossRef]
- Duong, H.T.; Volding, D.C. Modelling continuous risk variables: Introduction to fractional polynomial regression. Vietnam J. Sci. 2015, 2, 19–26. [Google Scholar]
- STATA. Poisson Postestimation—Postestimation Tools for Poisson. Available online: https://www.stata.com/manuals/rpoissonpostestimation.pdf (accessed on 13 December 2018).
- Johnson, K.; Grant, M.; Khan, S.; Moore, Z.; Avril Armstrong, A.; Sa, Z. Fieldwork-Related Factors and Data Quality in the Demographic and Health Surveys Program; DHS Analytical Studies No. 19; ICF Macro: Calverton, MD, USA, 2009. [Google Scholar]
- Chen, W.; Shi, J.; Qian, L.; Azen, S.P. Comparison of robustness to outliers between robust Poisson models and log-binomial models when estimating relative risks for common binary outcomes: A simulation study. BMC Med Res. Methodol. 2014, 14, 82. [Google Scholar] [CrossRef]
- WHO. WHA Global Nutrition Target 2025: Wasting Policy Brief. Available online: http://www.who.int/nutrition/topics/globaltargets_wasting_policybrief.pdf (accessed on 25 August 2018).
- Wells, J.C. The new “obstetrical dilemma”: Stunting, obesity and the risk of obstructed labour. Anat. Rec. (Hoboken) 2017, 300, 716–731. [Google Scholar] [CrossRef]
- Perkins, J.M.; Subramanian, S.V.; Davey Smith, G.; Özaltin, E. Adult height, nutrition, and population health. Nutr. Rev. 2016, 74, 149–165. [Google Scholar] [CrossRef] [Green Version]
- Wu, G.; Imhoff-Kunsch, B.; Girard, A.W. Biological mechanisms for nutritional regulation of maternal health and fetal development. Paediatr. Perinat. Epidemiol. 2012, 26 (Suppl. 1), 4–26. [Google Scholar] [CrossRef]
- Krawinkel, M.B. Interaction of nutrition and infections globally: An overview. Ann. Nutr. Metab. 2012, 61 (Suppl. 1), 39–45. [Google Scholar] [CrossRef]
- Black, R.E. Patterns of Growth in Early Childhood and Infectious Disease and Nutritional Determinants; Nestlé Nutr Inst Workshop Ser. Nestec Ltd.: Basel, Switzerland, 2017; Volume 87, pp. 63–72. [Google Scholar] [CrossRef]
- Arsenault, J.E.; Yakes, E.A.; Islam, M.M.; Hossain, M.B.; Ahmed, T.; Hotz, C.; Lewis, B.; Rahman, A.S.; Jamil, K.M.; Brown, K.H. Very low adequacy of micronutrient intakes by young children and women in rural Bangladesh is primarily explained by low food intake and limited diversity. J. Nutr. 2013, 143, 197–203. [Google Scholar] [CrossRef]
- Panter-Brick, C.; Lunn, P.G.; Langford, R.M.; Maharjan, M.; Manandhar, D.S. Pathways leading to early growth faltering: An investigation into the importance of mucosal damage and immunostimulation in different socio-economic groups in Nepal. Br. J. Nutr. 2009, 101, 558–567. [Google Scholar] [CrossRef]
- Prentice, A.M.; Moore, S.E.; Fulford, A.J. Growth faltering in low-income countries. World Rev. Nutr. Diet. 2013, 106, 90–99. [Google Scholar] [CrossRef]
- Ali, D.; Saha, K.K.; Nguyen, P.H.; Diressie, M.T.; Ruel, M.T.; Menon, P.; Rawat, R. Household food insecurity is associated with higher child undernutrition in Bangladesh, Ethiopia, and Vietnam, but the effect is not mediated by child dietary diversity. J. Nutr. 2013, 143, 2015–2021. [Google Scholar] [CrossRef]
- Psaki, S.; Bhutta, Z.A.; Ahmed, T.; Ahmed, S.; Bessong, P.; Islam, M.; John, S.; Kosek, M.; Lima, A.; Nesamvuni, C.; et al. Household food access and child malnutrition: Results from the eight-country MAL-ED study. Popul. Health Metr. 2012, 10, 24. [Google Scholar] [CrossRef]
- Richard, S.A.; Black, R.E.; Gilman, R.H.; Guerrant, R.L.; Kang, G.; Lanata, C.F.; Molbak, K.; Rasmussen, Z.A.; Sack, R.B.; Valentiner-Branth, P.; et al. Wasting is associated with stunting in early childhood. J. Nutr. 2012, 142, 1291–1296. [Google Scholar] [CrossRef]
- Rabbani, A.; Khan, A.; Yusuf, S.; Adams, A. Trends and determinants of inequities in childhood stunting in Bangladesh from 1996/7 to 2014. Int. J. Equity Health 2016, 15, 186. [Google Scholar] [CrossRef]
- Huda, T.M.; Hayes, A.; El Arifeen, S.; Dibley, M.J. Social determinants of inequalities in child undernutrition in Bangladesh: A decomposition analysis. Matern. Child Nutr. 2018, 14, e12440. [Google Scholar] [CrossRef]
- Prendergast, A.J.; Humphrey, J.H. The stunting syndrome in developing countries. Paediatr. Int. Child Health 2014, 34, 250–265. [Google Scholar] [CrossRef] [Green Version]
- International Food Policy Research Institute (IFPRI). Global Nutrition Report. 2015 Nutrition Country Profile: Bangladesh. Available online: http://ebrary.ifpri.org/cdm/ref/collection/p15738coll2/id/129814 (accessed on 25 August 2017).
- Persson, L.A.; Arifeen, S.; Ekstrom, E.C.; Rasmussen, K.M.; Frongillo, E.A.; Yunus, M. Effects of prenatal micronutrient and early food supplementation on maternal hemoglobin, birth weight, and infant mortality among children in Bangladesh: The MINIMat randomized trial. JAMA 2012, 307, 2050–2059. [Google Scholar] [CrossRef]
- Rahman, M.S.; Howlader, T.; Masud, M.S.; Rahman, M.L. Association of low-birth weight with malnutrition in children under five years in Bangladesh: Do mother’s education, socio-economic status, and birth interval matter? PLoS ONE 2016, 11, e0157814. [Google Scholar] [CrossRef]
- Leroy, J.L.; Ruel, M.; Habicht, J.P.; Frongillo, E.A. Linear growth deficit continues to accumulate beyond the first 1000 days in low- and middle-income countries: Global evidence from 51 national surveys. J. Nutr. 2014, 144, 1460–1466. [Google Scholar] [CrossRef]
- Prentice, A.M.; Ward, K.A.; Goldberg, G.R.; Jarjou, L.M.; Moore, S.E.; Fulford, A.J.; Prentice, A. Critical windows for nutritional interventions against stunting. Am. J. Clin. Nutr. 2013, 97, 911–918. [Google Scholar] [CrossRef] [Green Version]
- Bhutta, Z.A.; Das, J.K.; Rizvi, A.; Gaffey, M.F.; Walker, N.; Horton, S.; Webb, P.; Lartey, A.; Black, R.E. Evidence-based interventions for improvement of maternal and child nutrition: What can be done and at what cost? Lancet 2013, 382, 452–477. [Google Scholar] [CrossRef]
- UNSCN. 6th Report on the World Nutrition Situation. Progress in Nutrition. Available online: http://www.fao.org/3/a-as211e.pdf (accessed on 25 August 2018).


| Covariates | All Livebirths, N = 25,635 | |||||||||
|---|---|---|---|---|---|---|---|---|---|---|
| Stunted * | Wasted + | Severely Stunted ** | Severely Wasted ++ | Total | ||||||
| n | % | n | % | n | % | n | % | n | % | |
| Maternal covariates | ||||||||||
| Maternal Height (cm)categories | ||||||||||
| ≥155.0 cm (tall) | 1444 | 13.5 | 770 | 19.1 | 438 | 10.8 | 161 | 18.0 | 5634 | 21.6 |
| 154.9–150.0 cm | 3294 | 30.6 | 1300 | 33.1 | 1087 | 26.5 | 292 | 33.9 | 8746 | 33.9 |
| 149.9–145.0 cm | 3807 | 35.6 | 1203 | 31.3 | 1536 | 37.3 | 261 | 31.4 | 7778 | 30.7 |
| <145.0 cm (short) | 2156 | 20.4 | 629 | 16.5 | 1030 | 25.5 | 152 | 16.6 | 3477 | 13.8 |
| Age at birth, y | ||||||||||
| <20 | 3111 | 29.4 | 1092 | 29.4 | 1175 | 29.1 | 233 | 28.1 | 7085 | 28.3 |
| 20–24 | 3539 | 33.3 | 1300 | 32.5 | 1297 | 31.9 | 264 | 29.4 | 8619 | 33.5 |
| 25–29 | 2192 | 20.5 | 844 | 22.0 | 834 | 20.3 | 204 | 24.7 | 5690 | 22.1 |
| ≥30 | 1859 | 16.9 | 666 | 16.1 | 785 | 18.8 | 165 | 17.8 | 4241 | 16.0 |
| Educational level | ||||||||||
| No education | 3241 | 30.4 | 1049 | 27.3 | 1477 | 36.2 | 232 | 26.9 | 6027 | 24.4 |
| Primary | 3690 | 34.5 | 1292 | 32.8 | 1480 | 35.9 | 295 | 32.6 | 7740 | 30.3 |
| Secondary | 3368 | 31.7 | 1326 | 34.5 | 1037 | 25.6 | 285 | 35.0 | 9782 | 38.2 |
| Higher | 402 | 3.4 | 235 | 5.4 | 97 | 2.3 | 54 | 5.4 | 2086 | 7.0 |
| Occupation | ||||||||||
| Not working | 8607 | 79.2 | 3121 | 78.7 | 3310 | 79.6 | 717 | 82.3 | 20,914 | 80.7 |
| Working | 2094 | 20.8 | 781 | 21.3 | 781 | 20.4 | 149 | 17.7 | 4721 | 19.3 |
| Child Covariates | ||||||||||
| child age category, mo | ||||||||||
| 0–11 | 1044 | 9.7 | 800 | 21.3 | 333 | 8.2 | 237 | 28.6 | 5001 | 19.7 |
| 12–23 | 2310 | 21.9 | 913 | 23.3 | 893 | 22.1 | 214 | 24.9 | 5121 | 20.1 |
| 24–35 | 2489 | 22.9 | 737 | 18.5 | 998 | 23.6 | 171 | 17.2 | 5108 | 19.6 |
| 36–47 | 2616 | 24.4 | 701 | 17.9 | 1047 | 25.9 | 129 | 15.6 | 5261 | 20.5 |
| 48–59 | 2242 | 21.2 | 751 | 19.1 | 820 | 20.3 | 115 | 13.8 | 5144 | 20.2 |
| Birth Order | ||||||||||
| First | 3376 | 31.4 | 1325 | 33.6 | 1169 | 28.4 | 286 | 32.5 | 9009 | 34.9 |
| Second | 2708 | 25.9 | 1005 | 26.4 | 967 | 24.4 | 203 | 24.2 | 6923 | 27.1 |
| Third | 1845 | 17.4 | 681 | 17.5 | 717 | 17.3 | 153 | 17.7 | 4364 | 17.4 |
| Fourth | 1180 | 11.0 | 419 | 10.8 | 496 | 12.4 | 105 | 12.2 | 2453 | 9.7 |
| ≥Fifth | 1592 | 14.4 | 472 | 11.8 | 742 | 17.6 | 119 | 13.5 | 2886 | 11.0 |
| Birth Interval | ||||||||||
| First child | 3376 | 31.4 | 1325 | 33.6 | 1169 | 28.4 | 286 | 32.5 | 9009 | 34.9 |
| ≤23 months | 1123 | 10.0 | 329 | 8.3 | 520 | 11.6 | 72 | 8.3 | 2155 | 8.1 |
| 24–47 months | 3228 | 30.4 | 1047 | 27.8 | 1377 | 34.3 | 243 | 29.3 | 6546 | 26.0 |
| ≥48 months | 2974 | 28.2 | 1201 | 30.3 | 1025 | 25.7 | 265 | 30.0 | 7925 | 31.0 |
| Sex of the child | ||||||||||
| Male | 5487 | 50.9 | 2085 | 53.1 | 2127 | 51.7 | 488 | 56.6 | 13,060 | 50.9 |
| Female | 5214 | 49.1 | 1818 | 46.9 | 1964 | 48.3 | 378 | 43.4 | 12,575 | 49.1 |
| Household covariates | ||||||||||
| Wealth Quintile | ||||||||||
| First, poorest | 2965 | 25.0 | 961 | 22.1 | 1288 | 29.2 | 225 | 24.1 | 5653 | 19.8 |
| Second | 2414 | 24.1 | 814 | 22.3 | 1023 | 26.3 | 166 | 20.3 | 4722 | 20.0 |
| Third | 2152 | 20.8 | 782 | 20.7 | 823 | 20.9 | 177 | 20.5 | 4900 | 19.9 |
| Fourth | 1833 | 17.9 | 727 | 18.7 | 588 | 15.1 | 160 | 18.3 | 5011 | 20.0 |
| Fifth, richest | 1337 | 12.3 | 618 | 16.2 | 369 | 8.5 | 138 | 16.8 | 5349 | 20.2 |
| Father’s Education | ||||||||||
| No education | 4136 | 39.4 | 1322 | 34.4 | 1798 | 44.6 | 303 | 35.5 | 7865 | 32.2 |
| Primary | 3372 | 31.1 | 1170 | 29.6 | 1308 | 31.1 | 264 | 31.1 | 7363 | 28.7 |
| Secondary | 2465 | 23.1 | 1034 | 26.5 | 800 | 20.1 | 217 | 25.3 | 7100 | 27.4 |
| Higher | 728 | 6.5 | 376 | 9.5 | 185 | 4.2 | 82 | 8.2 | 3307 | 11.7 |
| Location of Residence | ||||||||||
| Urban | 2924 | 19.0 | 1083 | 19.3 | 1051 | 17.9 | 251 | 21.1 | 8068 | 22.1 |
| Rural | 7777 | 81.0 | 2819 | 80.7 | 3040 | 82.1 | 615 | 78.9 | 17,567 | 77.9 |
| Region | ||||||||||
| Barisal | 1322 | 6.4 | 446 | 5.8 | 522 | 6.9 | 89 | 5.3 | 2979 | 5.8 |
| Chittagong | 2253 | 22.7 | 802 | 23.0 | 934 | 24.5 | 185 | 24.8 | 5181 | 21.9 |
| Dhaka | 2061 | 32.5 | 668 | 29.1 | 770 | 32.0 | 150 | 28.3 | 4855 | 32.3 |
| Khulna | 1023 | 7.6 | 467 | 9.6 | 297 | 5.9 | 107 | 10.0 | 3052 | 9.3 |
| Rajshahi | 1396 | 15.1 | 626 | 17.9 | 462 | 13.8 | 135 | 16.3 | 3739 | 16.1 |
| Sylhet | 1526 | 9.8 | 539 | 9.8 | 628 | 10.3 | 121 | 10.7 | 3513 | 9.6 |
| Rangpur | 1120 | 5.8 | 354 | 4.8 | 478 | 6.6 | 79 | 4.7 | 2316 | 5.0 |
| Year of survey | ||||||||||
| 2004 | 2903 | 27.3 | 847 | 22.1 | 1232 | 31.3 | 286 | 32.5 | 9009 | 34.9 |
| 2007 | 2229 | 20.7 | 876 | 22.4 | 871 | 21.0 | 72 | 8.3 | 2155 | 8.1 |
| 2011 | 3041 | 28.3 | 1175 | 29.7 | 1159 | 27.9 | 243 | 29.3 | 6546 | 26.0 |
| 2014 | 2528 | 23.6 | 1004 | 25.9 | 829 | 19.8 | 265 | 30.0 | 7925 | 31.0 |
| Total | 10,701 | 42.1 | 3902 | 15.4 | 4091 | 15.8 | 866 | 3.4 | 25,635 | 100 |
| Anthropometric Category | N | Mean in cm (95% CI) | Mean Difference (95% CI) | p Value | |
|---|---|---|---|---|---|
| Stunted * | No | 14,934 | 151.9 (151.8, 152.0) | 2.6 (2.5, 2.8) | <0.001 |
| Yes | 10,701 | 149.3 (149.2, 149.4) | |||
| Severely stunted ** | No | 21,544 | 151.3 (151.2, 151.3) | 2.8 (2.6, 3.0) | <0.001 |
| Yes | 4091 | 148.4 (148.3, 148.6) | |||
| Wasted + | No | 21,734 | 150.9 (150.8, 151.0) | 0.6 (0.4, 0.8) | <0.001 |
| Yes | 3901 | 150.3 (150.2, 150.5) | |||
| Severely wasted ++ | No | 24,769 | 150.8 (150.8, 150.9) | 0.6 (0.2, 0.9) | 0.003 |
| Yes | 866 | 150.3 (149.9, 150.7) |
| Covariates | Stunted * Under-Five Children | |||||
|---|---|---|---|---|---|---|
| Unadjusted | Adjusted Model 1 a | Adjusted Model 2 b | ||||
| Maternal Covariates | RR (95% CI) | p Value | RR (95% CI) | p Value | RR (95% CI) | p Value |
| Maternal height per 1-cm increase | 0.954 (0.951, 0.958) | <0.001 | 0.960 (0.957, 0.963) | 0.001 | ||
| Maternal height (cm) categories | ||||||
| ≥155.0 cm (tall) | 1 (Reference) | 1 (Reference) | ||||
| 154.9–150.0 cm | 1.45 (1.36, 1.54) | 1.40 (1.32, 1.48) | ||||
| 149.9–145.0 cm | 1.86 (1.75, 1.98) | 1.74 (1.64, 1.84) | ||||
| <145.0 cm (short) | 2.36 (1.22, 2.54) | <0.001 | 2.10 (1.97, 2.23) | <0.001 | ||
| Maternal Age at birth, y | ||||||
| <20 | 1 (Reference) | 1 (Reference) | 1 (Reference) | |||
| 20–24 | 0.96 (0.92, 1.00) | 0.93 (0.89, 0.98) | 0.93 (0.89, 0.98) | |||
| 25–29 | 0.89 (0.85, 0.94) | 0.82 (0.77, 0.87) | 0.82 (0.77, 0.87) | |||
| ≥30 | 1.02 (0.97, 1.07) | <0.001 | 0.81 (0.75, 0.87) | <0.001 | 0.81 (0.76, 0.88) | <0.001 |
| Maternal Educational level | ||||||
| No education | 1 (Reference) | 1 (Reference) | 1 (Reference) | |||
| Primary | 0.91 (0.88, 0.95) | 1.02 (0.98, 1.06) | 1.02 (0.98, 1.06) | |||
| Secondary | 0.67 (0.64, 0.70) | 0.94 (0.89, 0.99) | 0.94 (0.89, 0.99) | |||
| Higher | 0.39 (0.35, 0.44) | <0.001 | 0.81 (0.72, 0.92) | <0.001 | 0.81 (0.72, 0.92) | <0.001 |
| Mother’s Occupation | ||||||
| Not working | 1 (Reference) | |||||
| Working | 1.09 (1.05, 1.14) | <0.001 | ||||
| Child Covariates | ||||||
| Child age category, mo | ||||||
| 0–11 | 1 (Reference) | 1 (Reference) | 1 (Reference) | |||
| 12–23 | 2.21 (2.05, 2.38) | 2.21 (2.05, 2.37) | 2.20 (2.05, 2.37) | |||
| 24–35 | 2.37 (2.20, 2.55) | 2.34 (2.18, 2.52) | 2.34 (2.18, 2.51) | |||
| 36–47 | 2.42 (2.25, 2.60) | 2.36 (2.20, 2.54) | 2.36 (2.20, 2.53) | |||
| 48–59 | 2.12 (1.97, 2.29) | <0.001 | 2.03 (1.89, 2.18) | <0.001 | 2.04 (1.89, 2.19) | <0.001 |
| Birth Order | ||||||
| First | 1 (Reference) | 1 (Reference) | 1 (Reference) | |||
| Second | 1.06 (1.01, 1.11) | 1.06 (1.01, 1.11) | 1.05 (1.00, 1.11) | |||
| Third | 1.12 (1.06, 1.18) | 1.08 (1.01, 1.15) | 1.08 (1.01, 1.15) | |||
| Fourth | 1.27 (1.20, 1.34) | 1.20 (1.11, 1.29) | 1.19 (1.11, 1.28) | |||
| ≥Fifth | 1.46 (1.39, 1.54) | <0.001 | 1.30 (1.20, 1.40) | <0.001 | 1.29 (1.19, 1.39) | <0.001 |
| Birth Interval | ||||||
| First child | 1 (Reference) | |||||
| ≤23 months | 1.37 (1.29, 1.45) | |||||
| 24–47 months | 1.30 (1.25, 1.36) | |||||
| ≥48 months | 1.10 (0.97, 1.06) | <0.001 | ||||
| Sex of the child | ||||||
| Male | 1 (Reference) | |||||
| Female | 1.00 (9.67, 1.04) | 0.999 | ||||
| Household covariates | ||||||
| Wealth Quintile | ||||||
| Fifth (wealthiest) | 1 (Reference) | 1 (Reference) | 1 (Reference) | |||
| Fourth | 1.47 (1.37, 1.58) | 1.26 (1.18, 1.35) | 1.25 (1.17, 1.34) | |||
| Third | 1.72 (1.62, 1.84) | 1.34 (1.26, 1.44) | 1.34 (1.25, 1.43) | |||
| Second | 1.99 (1.87, 2.11) | 1.46 (1.37, 1.56) | 1.45 (1.36, 1.55) | |||
| First (poorest) | 2.09 (1.97, 2.22) | <0.001 | 1.51 (1.41, 1.61) | <0.001 | 1.50 (1.40, 1.60) | <0.001 |
| Father’s Education | ||||||
| No education | 1 (Reference) | 1 (Reference) | 1 (Reference) | |||
| Primary | 0.88 (0.85, 0.92) | 0.98 (0.94, 1.02) | 0.98 (0.94, 1.02) | |||
| Secondary | 0.69 (0.66, 0.72) | 0.90 (0.86, 0.95) | 0.90 (0.85, 0.94) | |||
| Higher | 0.45 (0.42, 0.49) | <0.001 | 0.76 (0.69, 0.83) | <0.001 | 0.75 (0.69, 0.82) | <0.001 |
| Location of Residence | ||||||
| Urban | 1 (Reference) | 1 (Reference) | 1 (Reference) | |||
| Rural | 1.22 (1.17, 1.27) | <0.001 | 1.08 (1.04, 1.13) | <0.001 | 1.08 (1.04, 1.12) | <0.001 |
| Region | ||||||
| Barisal | 1 (Reference) | 1 (Reference) | 1 (Reference) | |||
| Chittagong | 0.95 (0.89, 1.00) | 1.01 (0.96, 1.06) | 1.02 (0.97, 1.07) | |||
| Dhaka | 0.92 (0.87, 0.97) | 0.95 (0.90, 1.01) | 0.96 (0.91, 1.01) | |||
| Khulna | 0.75 (0.70, 0.80) | 0.84 (0.79, 0.89) | 0.84 (0.79, 0.90) | |||
| Rajshahi | 0.86 (0.80, 0.91) | 0.83 (0.78, 0.88) | 0.83 (0.78, 0.88) | |||
| Sylhet | 0.93 (0.88, 0.99) | 0.93 (0.88, 0.99) | 0.94 (0.88, 0.99) | |||
| Rangpur | 1.07 (1.00, 1.14) | <0.001 | 1.15 (1.07, 1.22) | <0.001 | 1.15 (1.08, 1.23) | <0.001 |
| Year of survey | ||||||
| 2004 | 1 (Reference) | 1 (Reference) | 1 (Reference) | |||
| 2007 | 0.89 (0.85, 0.93) | 0.93 (0.90, 0.98) | 0.94 (0.90, 0.98) | |||
| 2011 | 0.81 (0.78, 0.85) | 0.88 (0.84, 0.92) | 0.88 (0.85, 0.92) | |||
| 2014 | 0.72 (0.69, 0.76) | 0.82 (0.78, 0.89) | <0.001 | 0.83 (0.78, 0.87) | <0.001 | |
| Recall | 1.003 (1.002, 1.003) | |||||
| Covariates | Wasted + Under-Five Children | |||||
|---|---|---|---|---|---|---|
| Unadjusted | Adjusted Model 1 a | Adjusted Model 2 b | ||||
| RR (95% CI) | p Value | RR (95% CI) | p Value | RR (95% CI) | p Value | |
| Maternal Covariates | ||||||
| Maternal height per 1-cm increase | 0.983 (0.977, 0.989) | <0.001 | 0.986(0.980, 0.992) | <0.001 | ||
| Maternal height (cm) categories | ||||||
| ≥155.0 cm (tall) | 1 (Reference) | 1 (Reference) | ||||
| 154.9–150.0 cm | 1.11 (1.01, 1.22) | 1.09 (0.99, 1.21) | ||||
| 149.9–145.0 cm | 1.16 (1.05, 1.28) | 1.13 (1.02, 1.25) | ||||
| <145.0 cm (short) | 1.35 (1.21, 1.51) | <0.001 | 1.28 (1.14, 1.43) | <0.001 | ||
| Maternal Age at birth, y | ||||||
| <20 | 1 (Reference) | |||||
| 20–24 | 0.94 (0.86, 1.02) | |||||
| 25–29 | 0.96 (0.87, 1.06) | |||||
| ≥30 | 0.97 (0.88, 1.08) | 0.487 | ||||
| Maternal Educational level | ||||||
| No education | 1 (Reference) | 1 (Reference) | 1 (Reference) | |||
| Primary | 0.97 (0.89, 1.06) | 0.98 (0.90, 1.07) | 0.98 (0.90, 1.07) | |||
| Secondary | 0.81 (0.74, 0.88) | 0.85 (0.77, 0.94) | 0.85 (0.77, 0.94) | |||
| Higher | 0.69 (0.59, 0.81) | <0.001 | 0.80 (0.67, 0.95) | 0.002 | 0.80 (0.67, 0.95) | 0.002 |
| Mother’s Occupation | ||||||
| Not working | 1 (Reference) | 1 (Reference) | 1 (Reference) | |||
| Working | 1.13 (1.04, 1.23) | 0.005 | 1.13 (1.04, 1.24) | 0.006 | 1.13 (1.04, 1.24) | 0.007 |
| Child Covariates | ||||||
| Child age category, mo | ||||||
| 0–11 | 1 (Reference) | 1 (Reference) | 1 (Reference) | |||
| 12–23 | 1.07 (0.97, 1.19) | 1.07 (0.97, 1.18) | 1.07 (0.97, 1.18) | |||
| 24–35 | 0.87 (0.78, 0.97) | 0.86 (0.77, 0.96) | 0.86 (0.77, 0.96) | |||
| 36–47 | 0.81 (0.73, 0.90) | 0.79 (0.71, 0.88) | 0.79 (0.71, 0.88) | |||
| 48–59 | 0.87 (0.79, 0.97) | <0.001 | 0.84 (0.76, 0.94) | <0.001 | 0.85 (0.76, 0.94) | <0.001 |
| Birth Order | ||||||
| First | 1 (Reference) | |||||
| Second | 1.01 (0.92, 1.11) | |||||
| Third | 1.05 (0.95, 1.15) | |||||
| Fourth | 1.16 (1.03, 1.30) | |||||
| ≥Fifth | 1.12 (1.00, 1.25) | 0.059 | ||||
| Birth Interval | ||||||
| First child | 1 (Reference) | |||||
| ≤23 months | 1.06 (0.93, 1.20) | |||||
| 24–47 months | 1.11 (1.02, 1.22) | |||||
| ≥48 months | 1.02 (0.94, 1.11) | 0.094 | ||||
| Sex of the child | ||||||
| Male | ||||||
| Female | 0.92 (0.86, 0.98) | 0.012 | 0.91 (0.85, 0.98) | 0.009 | 0.91 (0.85, 0.98) | 0.009 |
| Household covariates | ||||||
| Wealth Quintile | ||||||
| First, poorest | 1 (Reference) | 1 (Reference) | 1 (Reference) | |||
| Second | 0.99 (0.90, 1.10) | 0.97 (0.87, 1.08) | 0.97 (0.87, 1.08) | |||
| Third | 0.93 (0.84, 1.02) | 0.92 (0.83, 1.02) | 0.92 (0.83, 1.02) | |||
| Fourth | 0.84 (0.75, 0.93) | 0.87 (0.78, 0.98) | 0.87 (0.78, 0.98) | |||
| Fifth, richest | 0.72 (0.64, 0.80) | <0.001 | 0.82 (0.72, 0.93) | 0.016 | 0.82 (0.72, 0.93) | 0.017 |
| Father’s Education | ||||||
| No education | 1 (Reference) | |||||
| Primary | 0.96 (0.89, 1.05) | |||||
| Secondary | 0.91 (0.83, 0.99) | |||||
| Higher | 0.76 (0.67, 0.87) | 0.001 | ||||
| Location of Residence | ||||||
| Urban | 1 (Reference) | 1 (Reference) | 1 (Reference) | |||
| Rural | 1.19 (1.10, 1.28) | <0.001 | 1.12 (1.03, 1.22) | 0.009 | 1.12 (1.03, 1.22) | 0.010 |
| Region | ||||||
| Barisal | 1 (Reference) | 1 (Reference) | 1 (Reference) | |||
| Chittagong | 1.06 (0.95, 1.19) | 1.10 (0.98, 1.23) | 1.10 (0.98, 1.24) | |||
| Dhaka | 0.91 (0.81, 1.03) | 0.92 (0.82, 1.04) | 0.93 (0.82, 1.04) | |||
| Khulna | 1.04 (0.91, 1.18) | 1.10 (0.96, 1.25) | 1.10 (0.96, 1.25) | |||
| Rajshahi | 1.13 (0.99, 1.28) | 1.09 (0.97, 1.24) | 1.09 (0.97, 1.24) | |||
| Sylhet | 1.04 (0.91, 1.19) | 1.03 (0.90, 1.17) | 1.03 (0.90, 1.18) | |||
| Rangpur | 0.99 (0.85, 1.14) | 0.010 | 0.99 (0.85, 1.15) | 0.009 | 0.99 (0.85, 1.15) | 0.009 |
| Year of survey | ||||||
| 2004 | 1 (Reference) | 1 (Reference) | 1 (Reference) | |||
| 2007 | 1.18 (1.07, 1.30) | 1.21 (1.10, 1.33) | 1.21 (1.10, 1.34) | |||
| 2011 | 1.05 (0.96, 1.15) | 1.15 (1.05, 1.27) | 1.16 (1.05, 1.27) | |||
| 2014 | 0.98 (0.88, 1.08) | 0.001 | 1.08 (0.97, 1.20) | 0.001 | 1.08 (0.97, 1.20) | 0.001 |
| Recall | 0.999 (0.998, 1.000) | 0.163 | ||||
© 2019 by the authors. Licensee MDPI, Basel, Switzerland. This article is an open access article distributed under the terms and conditions of the Creative Commons Attribution (CC BY) license (http://creativecommons.org/licenses/by/4.0/).
Share and Cite
Khatun, W.; Rasheed, S.; Alam, A.; Huda, T.M.; Dibley, M.J. Assessing the Intergenerational Linkage between Short Maternal Stature and Under-Five Stunting and Wasting in Bangladesh. Nutrients 2019, 11, 1818. https://0-doi-org.brum.beds.ac.uk/10.3390/nu11081818
Khatun W, Rasheed S, Alam A, Huda TM, Dibley MJ. Assessing the Intergenerational Linkage between Short Maternal Stature and Under-Five Stunting and Wasting in Bangladesh. Nutrients. 2019; 11(8):1818. https://0-doi-org.brum.beds.ac.uk/10.3390/nu11081818
Chicago/Turabian StyleKhatun, Wajiha, Sabrina Rasheed, Ashraful Alam, Tanvir M. Huda, and Michael J. Dibley. 2019. "Assessing the Intergenerational Linkage between Short Maternal Stature and Under-Five Stunting and Wasting in Bangladesh" Nutrients 11, no. 8: 1818. https://0-doi-org.brum.beds.ac.uk/10.3390/nu11081818