Article

Physical Activity and/or High Protein Intake Maintains Fat-Free Mass in Older People with Mild Disability; the Fukuoka Island City Study: A Cross-Sectional Study

1
Graduate School of Sports and Health Science, Fukuoka University, 8-19-1 Nanakuma, Jonan-ku, Fukuoka 814-0180, Japan
2
Institute for Physical Activity, Fukuoka University, 8-19-1 Nanakuma, Jonan-ku, Fukuoka 814-0180, Japan
3
Department of Nutrition and Metabolism, National Institute of Health and Nutrition, National Institutes of Biomedical Innovation, Health, and Nutrition, 1-23-1 Toyama, Shinjuku-ku, Tokyo 162-8636, Japan
4
Faculty of Sports and Health Science, Fukuoka University, Fukuoka, 8-19-1 Nanakuma Jonan-ku, Fukuoka-shi, Fukuoka 814-0180, Japan
5
Center for Education in Liberal Arts and Sciences, Osaka University, 1-17 Machikaneyamachou, Toyonaka, Osaka 560-0043, Japan
6
Department of Food and Health Sciences, Prefectural University of Kumamoto Faculty of Environmental and Symbiotic Sciences, 3-1-100 Tsukide, Higashi-ku, Kumamoto 862-8502, Japan
7
Faculty of Health and Sports Science, Doshisha University, 1-3 Miyakodani Tatara, Kyotanabe-shi, Kyoto 610-0394, Japan
*
Author to whom correspondence should be addressed.
Deceased on 23 April 2018.
Submission received: 27 September 2019 / Revised: 21 October 2019 / Accepted: 22 October 2019 / Published: 29 October 2019
(This article belongs to the Special Issue Dietary Intake and Physical Activity for Human Health)

Abstract

:
Body composition changes with age, with fat mass (FM) increasing and fat-free mass (FFM) decreasing. Higher physical activity and high or adequate protein intake are thought to be beneficial in preventing the loss of skeletal muscle mass in the elderly. We aimed to investigate the relationships between physical activity, protein intake, and FFM in older people with mild disability. Total energy expenditure (TEE) under free-living conditions was assessed using the doubly-labelled water (DLW) method, and physical activity was measured using a triaxial accelerometer. Dietary intake was assessed using a self-recorded food intake diary during the DLW period. Percent FFM was significantly positively correlated with protein intake and physical activity level (PAL) after adjustment for age and sex (protein intake r = 0.652, p < 0.001, PAL r = 0.345, p = 0.011). In multiple linear regression analysis, when PAL, moderate-to-vigorous physical activity (MVPA), or protein intake were included, 31%, 32%, and 55%, respectively, of the variation in %FFM was explained. Moreover, the addition of both PAL/MVPA and protein intake explained 61%/60%, respectively, of the variation in %FFM. Either protein intake above the currently recommended level or higher levels of physical activity would be beneficial for the maintenance of high %FFM.

1. Introduction

Body composition changes with age, with fat mass (FM) increasing and fat-free mass (FFM) decreasing [1]. This age-related loss of muscle mass, strength, and quality, referred to as sarcopenia is associated with a higher risk of disability [2] and all-cause mortality [3]. Consequently, a reduction in the age-related loss of muscle mass may ameliorate the symptoms of sarcopenia, frailty, and other age-related disease processes. Chronic diseases are one of the common precursors for inducing disability [4]. Also, high body mass index (BMI) increase levels of frailty, suggesting body composition would be taken account for disability [5].
The encouragement of high levels of physical activity may be a useful strategy for the prevention of muscle loss during aging. Indeed, a systematic review has shown that it has the potential to prevent or reduce the progression of sarcopenia in the elderly [6], and high physical activity levels partially prevent the age-associated decrease in fiber cross-sectional area [7]. A decline in physical activity with aging may be the factor responsible for the reductions in skeletal muscle mass, strength, and quality observed. In which case, higher physical activity in the elderly would likely be beneficial for the prevention of muscle loss.
Another potential strategy for the prevention of muscle loss is the maintenance of adequate protein intake, because the anabolic response of skeletal muscle to dietary protein ingestion is lower in older people [8,9]. The recommended dietary allowance (RDA) for protein is 0.8 g/kg/day in the USA [10] and 0.85 g/kg/day in Japan [11], and this has been thought to be sufficient to maintain muscle mass and prevent muscle loss. However, in a recent study, a higher intake was shown to be beneficial and free of side effects [12]. In addition, another previous study has shown that lower protein intake may be a modifiable risk factor for mobility limitation [13]. Therefore, it is not clear whether older people consuming adequate or larger amounts of protein have higher muscle mass than those consuming less.
Taking the results of these previous studies together, either adequate protein intake or a high level of physical activity are likely to be effective in maintaining muscle mass in older people [14]. Previous review reported that additional protein supplementation did not seem to have a significantly greater effect on the exercise-induced increase in fiber cross-sectional area in the older group, despite the fact that the older protein-supplemented group showed a greater increase in muscle strength [15]. Recent intervention studies have shown that higher protein intake in combination with greater physical activity increases fat-free mass (FFM) in the elderly [16]. We therefore need to know older people who undertake a high level of physical activity and consume adequate dietary protein may be able to maintain higher muscle mass than those who do not. However, few studies have evaluated the relationship of both protein intake and physical activity with muscle mass in an older population under free-living conditions [17].
The purpose of this cross-sectional study was to investigate the relationships between physical activity level (PAL), protein intake, and FFM, and to determine whether high PAL and protein intake might result in higher FFM in community-dwelling older people with mild disability. We hypothesized that individuals who both undertake higher levels of physical activity and consume larger amounts of protein would have higher FFM than those who undertake low levels of physical activity and/or consume less protein, under free-living conditions.

2. Materials and Methods
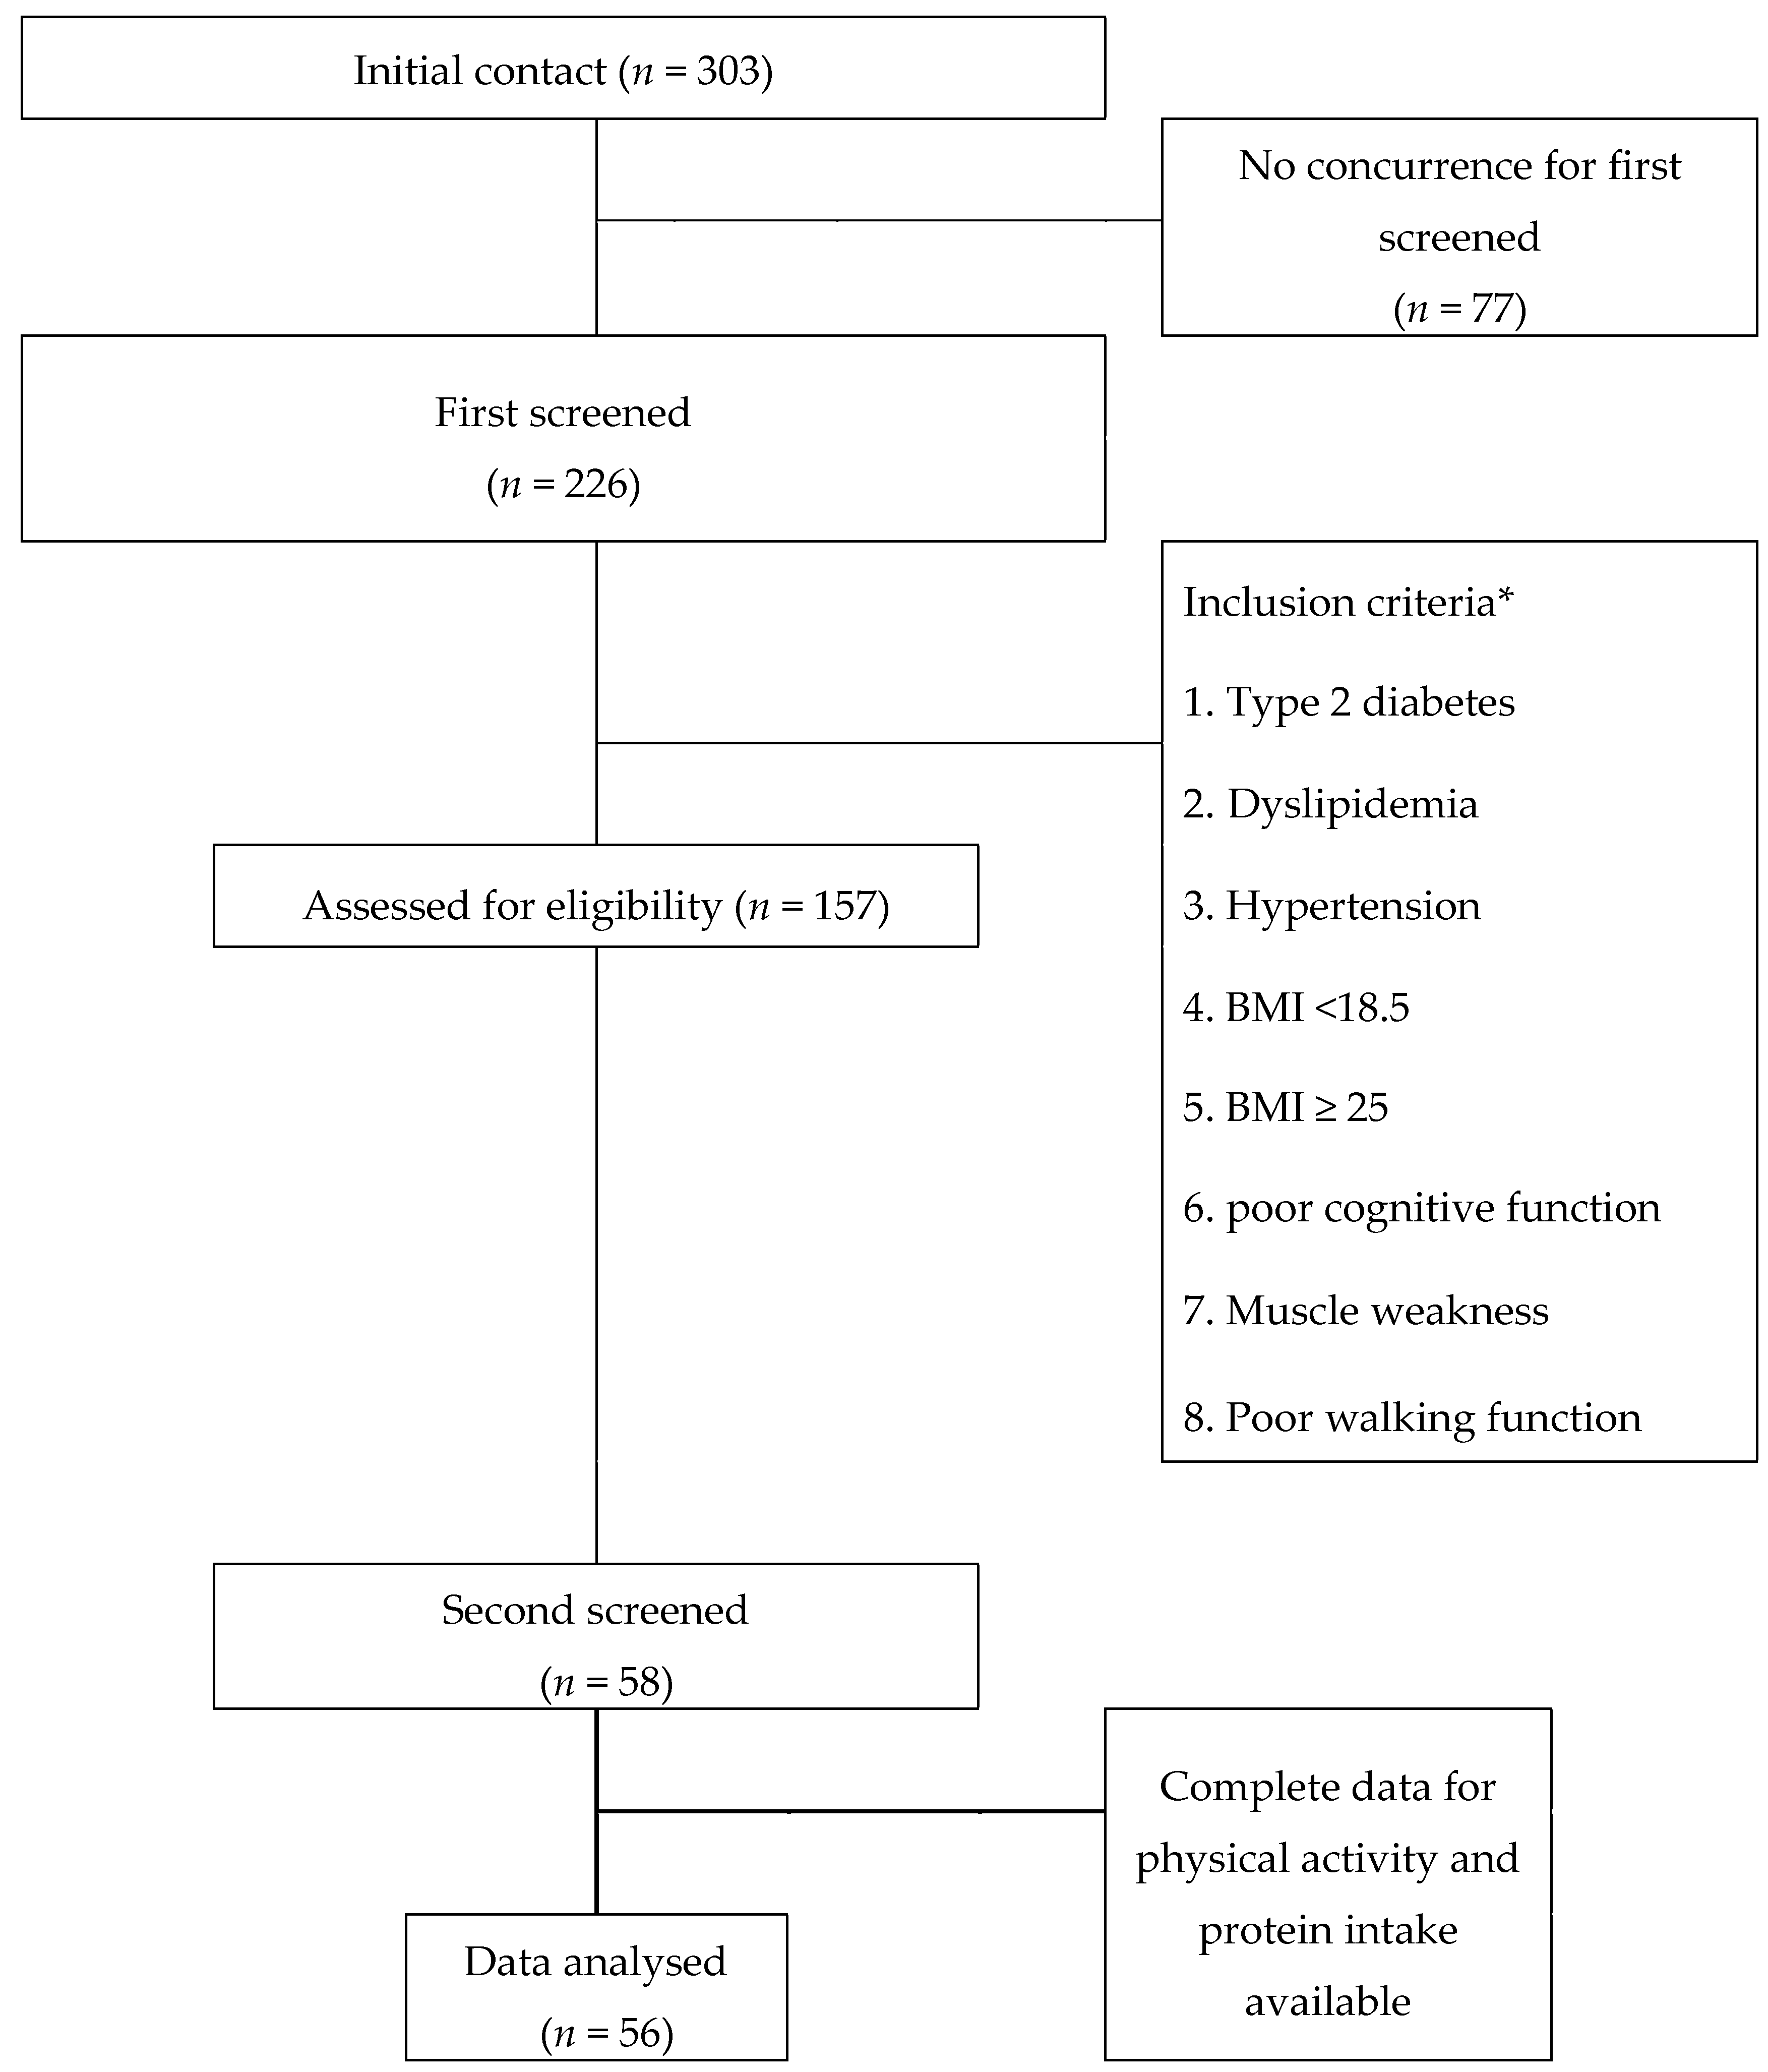
2.1. Participants

The definition of mild disability was either (1) Type 2 diabetes, (2) Dyslipidemia, (3) Hypertension, (4) BMI < 18.5, (5) BMI ≥ 25, (6) poor cognitive function, (7) Muscle weakness, (8) Poor walking function. Participants were recruited through 18,000 flyers distributed in Higashi-ku. Three-hundred-and-three people (55–89 years of age) responded to the flyers, and participated in the first screening. For the first screening, 226 participants were evaluated for cognitive function, physical function, height, and weight. They also answered about the presence of the lifestyle-related disease in the questionnaire, such as type 2 diabetes, dyslipidemia (fasting serum triglycerides over 150 mg/dL, serum LDL-cholesterol over 120 mg/dL or HDL-cholesterol under 40 mg/dL), or hypertension (resting blood pressure [BP] over 150 mmHg systolic and/or 90 mmHg diastolic). Cognitive function was evaluated using a simple screening test that was developed with reference to the Hasegawa Dementia Scale [18], consisting of four test tasks involving an immediate memory test, temporal orientation test, three-dimensional visual-spatial perception test, and delayed recall test [19]. The total score was 15 points with a cut-off point of 12. Poor cognitive function is under 12 points [20]. Physical function was evaluated using a grasping power and walking speed that muscle weakness and/or poor walking function defined walking speed under 1 m/seconds and/or grasping power man: Under 25 kg, woman: Under 20 kg [21]. Secondly, one-hundred-and-fifty-seven participants were selected according to the above eligibility criteria. After receiving informed consent, 56 older people resided for analyses (Figure 1). Participants’ characteristics are described in Table 1.
This study was conducted according to guidelines laid down in the Declaration of Helsinki, and all procedures involving human participants were approved by the Ethics Committee of Fukuoka University in Japan (approval no. 15-04-02). Written informed consent was obtained from all participants. This study was registered under the title ‘Longitudinal Study of the Prevention of Dementia and Sarcopenia by Physical Assessment and Intervention in the Community-dwelling older adults: the Fukuoka Island City Study’ (registration no. UNIM-CTR UMIN 000036659; URL: https://upload.umin.ac.jp/cgi-open-bin/ctr_e/ctr_view.cgi?recptno=R000041766).

2.2. Anthropometric and Body Composition Measurements

All anthropometric measurements were performed with the participants in bare feet and wearing light clothes. BMI (body weight (kg)/height (m)2 was calculated from height and body weight measurements made using a wall-mounted stadiometer (3× million 50 m, YAMAYO MEASURING TOOLS Co., Ltd., Tokyo, Japan) and electronic scales (Innerscan BC-509, TANITA Co., Tokyo, Japan), which were recorded to the nearest 0.1 cm and 0.1 kg, respectively.
Body composition was calculated from the body water content, obtained using the stable isotope dilution method. This method involves loading the body with water labelled with stable isotopes of hydrogen (2H) and oxygen (18O), and it permits the measurement of total body water (TBW) using the dilution principle. FM and FFM were then calculated from the TBW: FFM was obtained by dividing the calculated TBW by the hydration coefficient of 0.732 for adults [22]; FM was then calculated by subtracting the derived FFM from the body weight.

2.3. Energy Expenditure and PA

We assessed physical activity using a triaxial accelerometer and calculated PAL from total energy expenditure (TEE), estimated using the doubly-labelled water (DLW) method. Triaxial accelerometer provides an accurate and detailed assessment of physical activity using the three axes of the inclinometer output and vector magnitude data [23], and TEE measured using the DLW method is acknowledged to be the “gold standard” method for the measurement of energy expenditure under free-living conditions [24,25]. The methods of assessment of physical activity are capable of indicating which physical activity parameter under free-living conditions is most important for the maintenance of FFM in community-dwelling older people with mild disability.
TEE was measured for 16 days using the DLW method. A urine sample was acquired for the measurement of baseline 2H and 18O enrichment. Each participant was given a drink containing a premixed dose of approximately 0.12 g/kg estimated TBW of 2H2O (99.8 at.%, Taiyo Nippon Sanso, Tokyo, Japan) and 2.5 g/kg estimated TBW of H218O (10.0 at.%, Taiyo Nippon Sanso) [26]. The isotopically-labelled water equilibrates with the body water over several hours, after which urine samples are collected and analyzed to determine the elimination rate. A standard procedure was adopted that included the collection of four urine samples: On day 1 following the DLW administration, then on days 2, 15, and 16. Each urine sample was analyzed by isotope ratio mass spectrometry using automated analyzers of 2H and 18O (Hydra 20-20, Sercon Ltd., Crewe, UK). The difference between the elimination rates of the two isotopes is proportional to carbon dioxide production, which is used to calculate TEE.
The intensity of PA was quantitatively assessed using a triaxial accelerometer (Actimarker EW4800, Panasonic Electric Works Co., Ltd., Osaka, Japan) that was attached to an elastic belt and worn at the back of the waist for the entire 2-week period [23]. Participants were instructed to maintain their normal PA during the study. All participants were asked to wear their accelerometers 24 h a day for 16 days, exclusive of any time spent bathing or in water. The first and last days and any days on which ≤300 steps were counted or there were ≤10 min of over 2 × metabolic equivalents (METs) per day were excluded from analyses [27,28]. Activity was defined as one of five intensity levels. Using these data, the time spent in sedentary activities (1.1 to <1.5 METs), light (1.5 to <3.0 METs), and MVPA (≥3.0 METs) intensity PA was determined and expressed as the total daily duration of each (e.g., min/week or h/day) [23,29,30]. For inclusion in the analysis, the participants needed a minimum of 4 days with a minimum of 10 hr/day wearing time [31]. Participants excluded, if less than above criteria.
PAL was obtained by dividing the calculated TEE by the rest metabolic rate (RMR). RMR was estimated using the Ganpule equations for adult men and women. Ganpule equations use body size and body composition and are useful for estimating metabolic rates in the Japanese population [32].

2.4. Dietary Assessment

The dietary intake of nutrients was estimated using both self-reporting methods and visual records using a digital camera or mobile phone over 3 days (2 weekdays and 1 day at the weekend) during the DLW [33,34]. The participants were then interviewed by well-trained registered dietitians, who calculated their nutrient intake from the dietary records and photographs. The dietary records were analyzed using nutrient analysis software (Excel Eiyokun Ver. 7.0; Kenpakusha, Tokyo, Japan). To avoid the participants based on energy intake (EI) misreporting, we used arbitrary cut-off points set at <500 kcal/day for under-reporting and >3500 kcal/day for over-reporting [35,36]. However, participants who reported implausibly high or low EI levels were not included in the study.

2.5. Inclusion and Exclusion from the Participants

We included 14 participants from the participants who had muscle weakness, 4 who had poor walking function, 9 who had poor cognitive function, 9 who had underweight, 22 who had overweight, 18 who had type 2 diabetes, 19 who had dyslipidemia, and 31 who had hypertension. Thirty-six of the included individuals overlapped. The total participants were 58. As described above, the detailed criteria are shown in the Methods section. For 58 participants, we excluded 2 participants from the analyses who missing data for triaxial accelerometer or dietary record.

2.6. Statistical Analysis

Data are expressed as means ± standard deviations (SDs), unless otherwise stated. Protein intake is reported as crude protein intake per kg body weight (g/kg BW). Initially, partial correlation controlling analyses were then used to ascertain if there were associations between %FFM and these variables, independent of age and sex. Subsequently, multiple linear regression analysis was used to explain the variation in %FFM according to the nutritional and physical activity parameters, after adjustment for age and sex. The residuals in the dependent variable were approximately normally distributed. Multicollinearity assumptions were also tested using tolerance and the variance inflation factor (VIF). In the present study, a tolerance of <0.10 or a VIF of >10 was considered to be indicative of multicollinearity. P < 0.05 was considered to represent statistical significance. Statistical analyses were performed using SPSS for Windows (version 23.0; IBM Inc., Armonk, NY, USA).

3. Results

Table 2 shows the relationships between %FFM and nutritional and physical activity parameters. %FFM was significantly negatively correlated with BW and BMI (BW, r = −0.321, p < 0.05; BMI, r = −0.604, p < 0.001). These negative correlations remained after adjustment for age and sex (BW, r = −0.719, p < 0.001; BMI, r = −0.753, p < 0.001). There was a significant positive correlation between %FFM and protein intake (r = 0.541, p < 0.001), which strengthened after adjustment for age and sex (r = 0.652, p < 0.001). There was also a significant positive correlation between %FFM and MVPA (r = 0.389, p < 0.01), which remained after adjustment for age and sex (r = 0.350, p < 0.01). There was no correlation between PAL and %FFM (r = 0.122, p = 0.372), but a significant correlation emerged after adjustment for age and sex (r = 0.345, p < 0.05). According to the multiple linear regression analysis (Table 3), age and sex together explained 22% of the variation in %FFM (Model 1). In multiple linear regression analysis, when PAL/MVPA or protein intake were included, 31%/32% and 55%, respectively, of the variation in %FFM was explained after adjustment for age and sex. Moreover, the addition of both PAL/MVPA and protein intake explained 61%/60%, respectively, of the variation in %FFM after adjustment for age and sex.

4. Discussion

The purpose of this cross-sectional study was to investigate the relationships between indices of physical activity, protein intake, and FFM, and to determine whether high PAL and protein intake might be associated with higher FFM in community-dwelling, older people with mild disability. This showed that %FFM, measured using the isotope dilution method, independently correlates with protein intake (g/kg), PAL, and MVPA. This is the first study, of which we are aware, to identify potential contributing factors to %FFM from physical activity indexes using PAL (doubly labelled water method) and a tri-axial accelerometer. The study found that a combination of physical activities (PAL or MVPA) and protein intake was positively related to fat-free mass among older adults with mild disability.

4.1. Levels of Physical Activity and Protein Intake by Participants

Several studies of geriatric populations in Western countries have been published that used DLW, but only a few have been conducted in older Asian or Japanese populations [26,37]. One recent study found that the mean ± SD daily step count was 8334 ± 3591 and PAL was 1.90 ± 0.29 in people with a mean age of 73 years who were not highly active [26]. The PAL for the older people in the present study was 1.77 ± 0.24 and the step count was 6199 ± 2747. The main reason for the lower step count in the present study compared with the previous study, also conducted in older Japanese participants, is that the participants in the present study have disease conditions that predisposed towards sarcopenia and frailty. The lower step count is likely to be at least partially responsible for the lower PAL in the present study [26].
Participants in the present study had a mean protein intake of 1.28 ± 0.32 g/kg/day, which is similar to that recorded for older Japanese people in one previous study [38], but higher than that measured in other studies [13,39,40,41,42]. Hernandez-Alonso et al. reported that higher animal protein consumption, particularly red meat, was associated with an increased risk of cardiovascular event and cardiovascular, cancer, and total death, compared with moderate consumption [40]. Our findings suggest that a high total protein intake is helpful in achieving high %FFM. However, we suggest that although total protein intake is clearly important, older people must also be careful about the source and type of protein consumed.

4.2. The Relationship between FFM and Physical Activity

The high PAL in the participants in the present study was associated with high FFM, likely because it promotes net muscle protein anabolism and leads to specific metabolic and morphological adaptations in skeletal muscle tissue [43]. Previous studies have evaluated the relationship between physical activity and FFM [44,45,46,47,48] and shown that LPA, MVPA, and the amount of leisure time are associated with FFM in older people [46,47,48]. Furthermore, Park et al. have reported that the skeletal muscle mass of older people shows a weak, but statistically significant, positive association with the duration of daily exercise conducted at an intensity of >3 METs [47]. Consistent with this, the present study identified a positive relationship between %FFM and MVPA after adjustment for age and sex.
The present study provides evidence that a high PAL protects against the loss of FFM, because PAL also correlated with %FFM. However, in contrast, Speakman and Westerterp found no relationship between PAL and FFM (kg) in a large cross-sectional study [45], as did another smaller study [49] of an older population. One of the reasons for this inconsistency may be differences in lifestyle between the countries in which the studies were conducted. The older Japanese population has a relatively high PAL [26,37] compared with the older population of other countries [45,50], and indeed the PAL measured in our older participants (1.77 ± 0.24) was similar to that of participants of ~50 years elsewhere [45]. This difference in PAL between countries is likely to be reflected in the %FFM. We have also shown that PAL and MVPA significantly correlate (p < 0.001, r = 0.508) (data not shown). Thus, an increase in MVPA in daily life in the elderly will lead to an increase in PAL. The results of the previous studies suggest that the intensity of daily activity, rather than its duration, may be important for the protection of FFM. There are various reasons why muscle mass is lost with age, but these results suggest that increasing the intensity of physical activity and overall PAL is effective at maintaining %FFM in older people with mild disability.

4.3. The Relationship between FFM and Protein Intake

Anabolic resistance, characterized by a reduction in anabolic signaling for protein synthesis, may be ameliorated by an increase in protein intake, which has been shown to stimulate muscle protein synthesis in older people [14,51]. Furthermore, previous studies have shown that a protein intake higher than the RDA is effective at maintaining FFM in older people [13,17,52]. For example, Houston et al. reported that for older adults who lost weight over the 3-y period, lower protein intake was associated with greater loss of lean mass [52], and Morris et al. [17] reported that higher protein intake is associated with higher appendicular skeletal muscle mass. The outcomes of both of these longitudinal studies suggest that benefits are accrued by participants who consume more than the RDA for protein of 0·8 g/kg/day. The findings of the present study are consistent with these previous findings, because higher protein intake was associated with higher %FFM. Thus, high protein intake may contribute to the maintenance of %FFM in older people with mild disability.

4.4. The Relationship between FFM and a Combination of Protein Intake and Physical Activity

A combination of exercise and higher protein intake seems to be the most effective strategy for the maintenance of FFM [16,17,53]. The present study (Table 3) has shown that a combination of both protein intake and PAL contribute substantially to %FFM after adjustment for age and sex than each variable alone. Indeed, Martone et al. stated in a review article that “the combination of exercise with increased protein intake seems to be the most plausible strategy to overcome such an issue” [53]. Morris et al. have also shown that muscle-strengthening combined with high protein intake is more efficient at increasing skeletal muscle mass than high protein intake alone [17], and Verreijen et al. found that a combination of a high-protein diet and a resistance exercise program increased FFM more effectively than diet or exercise alone during weight loss in older adults [54]. Thus, in summary, intervention studies have shown that FFM can be most effectively increased using a combination of exercise and protein intake. This conclusion is consistent with the results of the present cross-sectional study of community-based older people. Previous studies have also shown that exercise and/or an increase in general physical activity should be considered an important method of improving the anabolic response, which prevents a reduction in FFM and supports healthy aging [17,54,55]. Breen et al. have reported that short periods of relative muscle disuse lead to modest increases in markers of inflammation, a gradual reduction in insulin sensitivity, and blunting of feeding-induced muscle protein synthesis, all of which may transiently accelerate sarcopenia [55]. Therefore, a high %FFM in community-dwelling older people with mild disability may be maintained by encouraging a combination of high protein intake and high PAL.

4.5. Limitations

The present study had several limitations. First, it was cross-sectional, and therefore cause-and-effect and age-related effects cannot be inferred. A longitudinal study should be able to evaluate this possibility. Second, FFM hydration was assumed to be equal in all the participants (0·732) [56]; therefore, there may have been errors in the estimation of FM using FFM, associated with differences in adiposity and sex [57]. Third, PAL was estimated without directly measuring RMR. Miyake et al. have reported that the RMR equation used in this study is accurate for Japanese people [58]. Finally, the self-reported dietary records used to estimate protein intake may be susceptible to inaccurate reporting. We attempted to minimize this potential error by asking the participants to take photographs of the meals they ate.

5. Conclusions

In summary, our findings of the present cross-sectional, population-based study show that consumption of at least the current RDA for protein and high PAL are beneficial for the maintenance of FFM in older people with mild disability, especially when used in combination.

Author Contributions

R.T., Y.H. (Yoichi Hatamoto), Y.Y., E.Y., N.E., H.T., and Y.K. designed the study; R.T., Y.H. (Yoichi Hatamoto), Y.K., T.K. J.Y., and Y.Y. conducted the study; R.T., Y.H. (Yoichi Hatamoto), Y.K., and J.Y. analyzed the data; Y.H. (Yoichi Hatamoto), Y.Y., E.Y., N.E., and Y.H. (Yasuki Higaki) interpreted the results; R.T., Y.H. (Yoichi Hatamoto), and Y.H. (Yasuki Higaki) wrote the manuscript; H.T. and Y.H. (Yasuki Higaki) were responsible for the design and final content of the article; Y.H. (Yasuki Higaki) revised the manuscript; and all authors read and approved the final manuscript.

Funding

This research was funded by JSPS KAKENHI, grant number 25242065 from the Ministry of Education, Culture, Sports, Science, and Technology to the Fukuoka University Institute for Physical Activity; and by AMED, Grant Number JP19ek0210112.

Acknowledgments

The authors thank the participants, the Fukuoka City mayor, and the Port & Airport Bureau staff. The authors also gratefully acknowledge the staff and graduate students who assisted with data collection. We express our sincere gratitude to Professor Hiroaki Tanaka, Emeritus Professor at Fukuoka University (deceased), Faculty of Sports and Health Science, who made great efforts to promote research, encouraged us, and passed away without seeing the completion of this paper.

Conflicts of Interest

The authors declare no conflict of interest.

References

  1. Janssen, I.; Heymsfield, S.B.; Wang, Z.M.; Ross, R. Skeletal muscle mass and distribution in 468 men and women aged 18–88 yr. J. Appl. Physiol. (1985) 2000, 89, 81–88. [Google Scholar] [CrossRef]
  2. Hirani, V.; Blyth, F.; Naganathan, V.; Le Couteur, D.G.; Seibel, M.J.; Waite, L.M.; Handelsman, D.J.; Cumming, R.G. Sarcopenia is associated with incident disability, institutionalization, and mortality in community-dwelling older men: The concord health and ageing in men project. J. Am. Med. Dir. Assoc. 2015, 16, 607–613. [Google Scholar] [CrossRef] [PubMed]
  3. Landi, F.; Cruz-Jentoft, A.J.; Liperoti, R.; Russo, A.; Giovannini, S.; Tosato, M.; Capoluongo, E.; Bernabei, R.; Onder, G. Sarcopenia and mortality risk in frail older persons aged 80 years and older: Results from ilSIRENTE study. Age Ageing 2013, 42, 203–209. [Google Scholar] [CrossRef] [PubMed]
  4. Verbrugge, L.M.; Lepkowski, J.M.; Imanaka, Y. Comorbidity and its impact on disability. Milbank Q. 1989, 67, 450–484. [Google Scholar] [CrossRef] [PubMed]
  5. Hubbard, R.E.; Lang, I.A.; Llewellyn, D.J.; Rockwood, K. Frailty, body mass index, and abdominal obesity in older people. J. Gerontol. A Biol. Sci. Med. Sci. 2009, 65, 377–381. [Google Scholar] [CrossRef] [PubMed]
  6. Steffl, M.; Bohannon, R.W.; Sontakova, L.; Tufano, J.J.; Shiells, K.; Holmerova, I. Relationship between sarcopenia and physical activity in older people: A systematic review and meta-analysis. Clin. Interv. Aging 2017, 12, 835–845. [Google Scholar] [CrossRef] [PubMed]
  7. St-Jean-Pelletier, F.; Pion, C.H.; Leduc-Gaudet, J.P.; Sgarioto, N.; Zovile, I.; Barbat-Artigas, S.; Reynaud, O.; Alkaterji, F.; Lemieux, F.C.; Grenon, A.; et al. The impact of ageing, physical activity, and pre-frailty on skeletal muscle phenotype, mitochondrial content, and intramyocellular lipids in men. J. Cachexia Sarcopenia Muscle 2017, 8, 213–228. [Google Scholar] [CrossRef] [PubMed]
  8. Rennie, M.J. Anabolic resistance: The effects of aging, sexual dimorphism, and immobilization on human muscle protein turnover. Appl. Physiol. Nutr. Metab. 2009, 34, 377–381. [Google Scholar] [CrossRef]
  9. Cuthbertson, D.; Smith, K.; Babraj, J.; Leese, G.; Waddell, T.; Atherton, P.; Wackerhage, H.; Taylor, P.M.; Rennie, M.J. Anabolic signaling deficits underlie amino acid resistance of wasting, aging muscle. FASEB J. 2005, 19, 422–424. [Google Scholar] [CrossRef]
  10. Trumbo, P.; Schlicker, S.; Yates, A.A.; Poos, M. Dietary reference intakes for energy, carbohydrate, fiber, fat, fatty acids, cholesterol, protein and amino acids. J. Am. Diet. Assoc. 2002, 102, 1621–1630. [Google Scholar] [CrossRef]
  11. Ministry of Health Labour Welfare. Dietary Reference Intakes for Japanese; Ministry of Health Labour Welfare: Tokyo, Japan, 2015. [Google Scholar]
  12. Phillips, S.M.; Chevalier, S.; Leidy, H.J. Protein “requirements” beyond the RDA: Implications for optimizing health. Appl. Physiol. Nutr. Metab. 2016, 41, 565–572. [Google Scholar] [CrossRef] [PubMed]
  13. Houston, D.K.; Tooze, J.A.; Garcia, K.; Visser, M.; Rubin, S.; Harris, T.B.; Newman, A.B.; Kritchevsky, S.B.; Health, A.B.C.S. Protein intake and mobility limitation in community-dwelling older adults: The health ABC study. J. Am. Geriatr. Soc. 2017, 65, 1705–1711. [Google Scholar] [CrossRef] [PubMed]
  14. Deutz, N.E.; Bauer, J.M.; Barazzoni, R.; Biolo, G.; Boirie, Y.; Bosy-Westphal, A.; Cederholm, T.; Cruz-Jentoft, A.; Krznaric, Z.; Nair, K.S.; et al. Protein intake and exercise for optimal muscle function with aging: Recommendations from the ESPEN Expert Group. Clin. Nutr. 2014, 33, 929–936. [Google Scholar] [CrossRef] [PubMed] [Green Version]
  15. Cermak, N.M.; Res, P.T.; de Groot, L.C.; Saris, W.H.; van Loon, L.J. Protein supplementation augments the adaptive response of skeletal muscle to resistance-type exercise training: A meta-analysis. Am. J. Clin. Nutr. 2012, 96, 1454–1464. [Google Scholar] [CrossRef]
  16. Yamada, M.; Kimura, Y.; Ishiyama, D.; Nishio, N.; Otobe, Y.; Tanaka, T.; Ohji, S.; Koyama, S.; Sato, A.; Suzuki, M.; et al. Synergistic effect of bodyweight resistance exercise and protein supplementation on skeletal muscle in sarcopenic or dynapenic older adults. Geriatr. Gerontol. Int. 2019, 19, 429–437. [Google Scholar] [CrossRef]
  17. Morris, M.S.; Jacques, P.F. Total protein, animal protein and physical activity in relation to muscle mass in middle-aged and older Americans. Br. J. Nutr. 2013, 109, 1294–1303. [Google Scholar] [CrossRef]
  18. Kato, S. Development of the revised version of Hasegawa’s Dementia Scale (HDS-R). Jpn. Geriatr. Psychiatr. Med. 1991, 2, 1339–1347. [Google Scholar]
  19. Inoue, M.; Jinbo, D.; Nakamura, Y.; Taniguchi, M.; Urakami, K. Development and evaluation of a computerized test battery for Alzheimer’s disease screening in community-based settings. Am. J. Alzheimers Dis. Other Demen. 2009, 24, 129–135. [Google Scholar] [CrossRef]
  20. Urakami, K. Diagnostic biomarker for early stage of Alzheimer’s disease: Current state and view in the future. Psychogeriatrics 2010, 10, 49–52. [Google Scholar] [CrossRef]
  21. Shimokata, H.; Ando, F. Association of daily physical performance with muscle volume and strength. Geriatr. Gerontol. Int. 2012, 49, 195–198. (In Japanese) [Google Scholar] [Green Version]
  22. Hewitt, M.J.; Going, S.B.; Williams, D.P.; Lohman, T.G. Hydration of the fat-free body mass in children and adults: Implications for body composition assessment. Am. J. Physiol. 1993, 265, E88–E95. [Google Scholar] [CrossRef]
  23. Yamada, Y.; Yokoyama, K.; Noriyasu, R.; Osaki, T.; Adachi, T.; Itoi, A.; Naito, Y.; Morimoto, T.; Kimura, M.; Oda, S. Light-intensity activities are important for estimating physical activity energy expenditure using uniaxial and triaxial accelerometers. Eur. J. Appl. Physiol. 2009, 105, 141–152. [Google Scholar] [CrossRef] [PubMed]
  24. Bonnefoy, M.; Normand, S.; Pachiaudi, C.; Lacour, J.R.; Laville, M.; Kostka, T. Simultaneous validation of ten physical activity questionnaires in older men: A doubly labeled water study. J. Am. Geriatr. Soc. 2001, 49, 28–35. [Google Scholar] [CrossRef] [PubMed]
  25. DeLany, J.P.; Schoeller, D.A.; Hoyt, R.W.; Askew, E.W.; Sharp, M.A. Field use of D2 18O to measure energy expenditure of soldiers at different energy intakes. J. Appl. Physiol. (1985) 1989, 67, 1922–1929. [Google Scholar] [CrossRef] [PubMed]
  26. Yamada, Y.; Hashii-Arishima, Y.; Yokoyama, K.; Itoi, A.; Adachi, T.; Kimura, M. Validity of a triaxial accelerometer and simplified physical activity record in older adults aged 64–96 years: A doubly labeled water study. Eur. J. Appl. Physiol. 2018, 118, 2133–2146. [Google Scholar] [CrossRef]
  27. Ikenaga, M.; Yamada, Y.; Takeda, N.; Kimura, M.; Higaki, Y.; Tanaka, H.; Kiyonaga, A.; Nakagawa Study, G. Dynapenia, gait speed and daily physical activity measured using triaxial accelerometer in older Japanese men. J. Phys. Fit. Sports Med. 2014, 3, 147–154. [Google Scholar] [CrossRef] [Green Version]
  28. Michishita, R.; Fukae, C.; Mihara, R.; Ikenaga, M.; Morimura, K.; Takeda, N.; Yamada, Y.; Higaki, Y.; Tanaka, H.; Kiyonaga, A.; et al. Association between the physical activity and heart rate corrected-QT interval in older adults. Geriatr. Gerontol. Int. 2015, 15, 895–901. [Google Scholar] [CrossRef]
  29. Haskell, W.L.; Lee, I.M.; Pate, R.R.; Powell, K.E.; Blair, S.N.; Franklin, B.A.; Macera, C.A.; Heath, G.W.; Thompson, P.D.; Bauman, A. Physical activity and public health: Updated recommendation for adults from the American College of Sports Medicine and the American Heart Association. Med. Sci. Sports Exerc. 2007, 39, 1423–1434. [Google Scholar] [CrossRef]
  30. Maeda, K.; Higashimoto, Y.; Honda, N.; Shiraishi, M.; Hirohata, T.; Minami, K.; Iwasaki, T.; Chiba, Y.; Yamagata, T.; Terada, K. Effect of a postoperative outpatient pulmonary rehabilitation program on physical activity in patients who underwent pulmonary resection for lung cancer. Geriatr. Gerontol. Int. 2016, 16, 550–555. [Google Scholar] [CrossRef]
  31. Migueles, J.H.; Cadenas-Sanchez, C.; Ekelund, U.; Nyström, C.D.; Mora-Gonzalez, J.; Löf, M.; Labayen, I.; Ruiz, J.R.; Ortega, F.B. Accelerometer data collection and processing criteria to assess physical activity and other outcomes: A systematic review and practical considerations. Sports Med. 2017, 47, 1821–1845. [Google Scholar] [CrossRef]
  32. Ganpule, A.A.; Tanaka, S.; Ishikawa-Takata, K.; Tabata, I. Interindividual variability in sleeping metabolic rate in Japanese subjects. Eur. J. Clin. Nutr. 2007, 61, 1256–1261. [Google Scholar] [CrossRef] [PubMed] [Green Version]
  33. Murakami, Y.; Oshikata, R.; Miyamoto, N.; Kishida, R.; Nagata, A.; Terazawa, Y.; Hirakawa, F.; Yoshimura, Y.; Imamura, H. Validity of 1-, 2-, 3-, and 4-day dietary records in comparison with 7-day weighed dietary records. Health Eval. Promot. 2010, 37, 405–413. [Google Scholar]
  34. Sasaki, S.; Yanagibori, R.; Amano, K. Self-administered diet history questionnaire developed for health education: A relative validation of the test-version by comparison with 3-day diet record in women. J. Epidemiol. 1998, 8, 203–215. [Google Scholar] [CrossRef] [PubMed]
  35. Rhee, J.J.; Sampson, L.; Cho, E.; Hughes, M.D.; Hu, F.B.; Willett, W.C. Comparison of methods to account for implausible reporting of energy intake in epidemiologic studies. Am. J. Epidemiol. 2015, 181, 225–233. [Google Scholar] [CrossRef]
  36. Gibson, R.; Eriksen, R.; Lamb, K.; McMeel, Y.; Vergnaud, A.-C.; Spear, J.; Aresu, M.; Chan, Q.; Elliott, P.; Frost, G. Dietary assessment of British police force employees: A description of diet record coding procedures and cross-sectional evaluation of dietary energy intake reporting (the airwave health monitoring study). BMJ Open 2017, 7, e012927. [Google Scholar] [CrossRef]
  37. Ishikawa-Takata, K.; Naito, Y.; Tanaka, S.; Ebine, N.; Tabata, I. Use of doubly labeled water to validate a physical activity questionnaire developed for the Japanese population. J. Epidemiol. 2011, 21, 114–121. [Google Scholar] [CrossRef]
  38. Kobayashi, S.; Asakura, K.; Suga, H.; Sasaki, S. High protein intake is associated with low prevalence of frailty among old Japanese women: A multicenter cross-sectional study. Nutr. J. 2013, 12, 164. [Google Scholar] [CrossRef]
  39. Landi, F.; Calvani, R.; Tosato, M.; Martone, A.M.; Ortolani, E.; Savera, G.; D’Angelo, E.; Sisto, A.; Marzetti, E. Protein intake and muscle health in old age: From biological plausibility to clinical evidence. Nutrients 2016, 8, 295. [Google Scholar] [CrossRef]
  40. Hernandez-Alonso, P.; Salas-Salvado, J.; Ruiz-Canela, M.; Corella, D.; Estruch, R.; Fito, M.; Aros, F.; Gomez-Gracia, E.; Fiol, M.; Lapetra, J.; et al. High dietary protein intake is associated with an increased body weight and total death risk. Clin. Nutr. 2016, 35, 496–506. [Google Scholar] [CrossRef]
  41. Nilsson, A.; Montiel Rojas, D.; Kadi, F. Impact of meeting different guidelines for protein intake on muscle mass and physical function in physically active older women. Nutrients 2018, 10, 1156. [Google Scholar] [CrossRef]
  42. Isanejad, M.; Mursu, J.; Sirola, J.; Kroger, H.; Rikkonen, T.; Tuppurainen, M.; Erkkila, A.T. Dietary protein intake is associated with better physical function and muscle strength among elderly women. Br. J. Nutr. 2016, 115, 1281–1291. [Google Scholar] [CrossRef] [PubMed] [Green Version]
  43. Timmerman, K.L.; Dhanani, S.; Glynn, E.L.; Fry, C.S.; Drummond, M.J.; Jennings, K.; Rasmussen, B.B.; Volpi, E. A moderate acute increase in physical activity enhances nutritive flow and the muscle protein anabolic response to mixed nutrient intake in older adults. Am. J. Clin. Nutr. 2012, 95, 1403–1412. [Google Scholar] [CrossRef] [PubMed]
  44. Landi, F.; Russo, A.; Cesari, M.; Pahor, M.; Liperoti, R.; Danese, P.; Bernabei, R.; Onder, G. Walking one hour or more per day prevented mortality among older persons: Results from ilSIRENTE study. Prev. Med. 2008, 47, 422–426. [Google Scholar] [CrossRef]
  45. Speakman, J.R.; Westerterp, K.R. Associations between energy demands, physical activity, and body composition in adult humans between 18 and 96 y of age. Am. J. Clin. Nutr. 2010, 92, 826–834. [Google Scholar] [CrossRef] [Green Version]
  46. Foong, Y.C.; Chherawala, N.; Aitken, D.; Scott, D.; Winzenberg, T.; Jones, G. Accelerometer-determined physical activity, muscle mass, and leg strength in community-dwelling older adults. J. Cachexia Sarcopenia Muscle 2016, 7, 275–283. [Google Scholar] [CrossRef] [PubMed]
  47. Park, H.; Park, S.; Shephard, R.J.; Aoyagi, Y. Yearlong physical activity and sarcopenia in older adults: The Nakanojo Study. Eur. J. Appl. Physiol. 2010, 109, 953–961. [Google Scholar] [CrossRef]
  48. Raguso, C.A.; Kyle, U.; Kossovsky, M.P.; Roynette, C.; Paoloni-Giacobino, A.; Hans, D.; Genton, L.; Pichard, C. A 3-year longitudinal study on body composition changes in the elderly: Role of physical exercise. Clin. Nutr. 2006, 25, 573–580. [Google Scholar] [CrossRef]
  49. Pannemans, D.L.; Westerterp, K.R. Energy expenditure, physical activity and basal metabolic rate of elderly subjects. Br. J. Nutr. 1995, 73, 571–581. [Google Scholar] [CrossRef]
  50. Roberts, S.B.; Dallal, G.E. Energy requirements and aging. Public Health Nutr. 2005, 8, 1028–1036. [Google Scholar] [CrossRef] [Green Version]
  51. Rondanelli, M.; Klersy, C.; Terracol, G.; Talluri, J.; Maugeri, R.; Guido, D.; Faliva, M.A.; Solerte, B.S.; Fioravanti, M.; Lukaski, H.; et al. Whey protein, amino acids, and vitamin D supplementation with physical activity increases fat-free mass and strength, functionality, and quality of life and decreases inflammation in sarcopenic elderly. Am. J. Clin. Nutr. 2016, 103, 830–840. [Google Scholar] [CrossRef]
  52. Houston, D.K.; Nicklas, B.J.; Ding, J.; Harris, T.B.; Tylavsky, F.A.; Newman, A.B.; Lee, J.S.; Sahyoun, N.R.; Visser, M.; Kritchevsky, S.B. Dietary protein intake is associated with lean mass change in older, community-dwelling adults: The Health, Aging, and Body Composition (Health ABC) Study. Am. J. Clin. Nutr. 2008, 87, 150–155. [Google Scholar] [CrossRef] [PubMed]
  53. Martone, A.M.; Marzetti, E.; Calvani, R.; Picca, A.; Tosato, M.; Santoro, L.; Di Giorgio, A.; Nesci, A.; Sisto, A.; Santoliquido, A.; et al. Exercise and protein intake: A synergistic approach against sarcopenia. Biomed. Res. Int. 2017, 2017. [Google Scholar] [CrossRef] [PubMed]
  54. Verreijen, A.M.; Engberink, M.F.; Memelink, R.G.; van der Plas, S.E.; Visser, M.; Weijs, P.J. Effect of a high protein diet and/or resistance exercise on the preservation of fat free mass during weight loss in overweight and obese older adults: A randomized controlled trial. Nutr. J. 2017, 16, 10. [Google Scholar] [CrossRef] [PubMed]
  55. Breen, L.; Stokes, K.A.; Churchward-Venne, T.A.; Moore, D.R.; Baker, S.K.; Smith, K.; Atherton, P.J.; Phillips, S.M. Two weeks of reduced activity decreases leg lean mass and induces “anabolic resistance” of myofibrillar protein synthesis in healthy elderly. J. Clin. Endocrinol. Metab. 2013, 98, 2604–2612. [Google Scholar] [CrossRef] [PubMed]
  56. Pace, N.; Rathbun, E.N. Studies on body composition. 3. The body water and chemically combined nitrogen content in relation to fat content. J. Biol. Chem. 1945, 158, 685–691. [Google Scholar]
  57. Park, J.; Ishikawa-Takata, K.; Tanaka, S.; Hikihara, Y.; Ohkawara, K.; Watanabe, S.; Miyachi, M.; Morita, A.; Aiba, N.; Tabata, I. The relationship of body composition to daily physical activity in free-living Japanese adult men. Br. J. Nutr. 2014, 111, 182–188. [Google Scholar] [CrossRef]
  58. Miyake, M.; Kirisako, T.; Kokubo, T.; Miura, Y.; Morishita, K.; Okamura, H.; Tsuda, A. Randomised controlled trial of the effects of L-ornithine on stress markers and sleep quality in healthy workers. Nutr. J. 2014, 13, 53. [Google Scholar] [CrossRef]
Figure 1. Flow diagram for the identification, screening, eligibility and statistical analysis conducted in this study. *: The detailed criteria are shown in the Methods section. BMI: body mass index.
Nutrients 11 02595 g001
Table 1. Participants’ characteristics.
ParameterAll
n = 56
Men
n = 17
Women
n = 39
MeanSDMeanSDMeanSD
Age, years71.86.971.16.672.16.9
Height, cm1549162.96.3149.45.6
Body weight, kg54.512.263.812.350.59.4
Body mass index, kg/m223.03.823.93.322.63.9
Fat-free mass, kg36.98.246.27.732.83.8
Fat-free mass, %68.17.573.07.365.96.4
Energy intake, kcal/day181432720663491704240
Energy expenditure, kcal/day185337521264401734260
Energy expenditure, kcal/kg/day34.55.333.54.534.95.5
Nutritional parameter
Protein intake, g/day71.514.079.913.467.912.3
Protein intake, g/kg BW/day1.280.321.250.281.290.33
Protein intake, g/kg FFM/day1.990.401.750.292.090.40
Fat intake, g/day57.415.662.613.155.115.8
Carbohydrate intake, g/day239412714022532
Protein source
Soy protein, g/day9.47.99.66.19.38.5
Fish and shellfish protein, g/day12.46.914.05.311.76.4
Meat protein, g/day12.26.914.47.311.26.4
Egg protein, g/day4.83.05.52.94.52.9
Milk protein, g/day19.514.521.117.818.812.5
Other protein, g/day13.212.315.311.712.412.3
Distribution of protein intake across eating occasions
Breakfast protein, g/meal16.56.217.56.716.05.8
Lunch protein, g/meal21.36.622.27.221.06.2
Supper protein, g/meal30.07.734.56.928.07.1
Snack protein, g/meal3.85.55.86.72.94.5
Physical activity parameter
PAL1.770.241.620.201.840.22
Steps, counts/day619927476535290360532626
Sedentary, min/day200461673921440
LPA, min/day332872595336478
MVPA, min/day302032222819
BW: body weight, FFM: fat-free mass, PAL: physical activity level, LPA: light physical activity, MVPA: moderate-to-vigorous-physical activity
Table 2. Associations between the percentage of FFM and other parameters.
Crude ValuesValues Adjusted for Age and Sex
Parameterrprp
Physical parameter
Age, years−0.1980.144
Height, cm0.2360.080−0.1910.167
Body weight, kg−0.3210.016−0.719<0.001
BMI, kg/m2−0.604<0.001−0.753<0.001
Nutritional parameter
Energy intake, kcal/day0.2070.126-0.0540.700
Protein intake, g/day0.2950.0270.1420.305
Protein intake, g/kg/day0.541<0.0010.652<0.001
Fat intake, g/day−0.0260.853−0.1920.163
Carbohydrate intake, g/day0.2150.111−0.0420.765
Physical activity parameter
PAL0.1220.3720.3450.011
Steps, counts/day0.2340.0830.1610.246
Sedentary, min/day−0.1630.2310.0760.586
LPA, min/day−0.1170.4030.1370.321
MVPA, min/day0.3890.0030.3500.009
BMI: body mass index, PAL: physical activity level, LPA: light physical activity, MVPA: moderate-to-vigorous-physical activity.
Table 3. Multiple linear regression analysis of the relationship of %FFM with PAL and protein intake.
R2p ValueIncluded Independent VariablesStandardized Coefficient (β)p Value
Model 10.221<0.001Age−0.1670.176
Sex−0.4280.001
Model 20.314<0.001Age−0.0590.632
Sex−0.588<0.001
PAL0.3570.011
Model 30.317<0.001Age−0.0200.879
Sex−0.407<0.001
MVPA0.3440.009
Model 40.552<0.001Age−0.1750.066
Sex−0.467<0.001
Protein intake0.576<0.001
Model 50.611<0.001Age−0.0880.348
Sex−0.593<0.001
PAL0.2870.008
Protein intake0.550<0.001
Model 60.599<0.001Age−0.0700.485
Sex−0.450< 0.001
MVPA0.2450.018
Protein intake0.540< 0.001
R2: total variance explained by the model. PAL: physical activity level, MVPA: moderate-to-vigorous physical activity.

