Covid-19 Confinement and Changes of Adolescent’s Dietary Trends in Italy, Spain, Chile, Colombia and Brazil

 , ,
, ,  ,
,  , ,
, ,  , and
, and
Abstract
:1. Introduction
2. Materials and Methods
2.1. Participants
2.2. Study Design
2.3. Data Collection
2.4. Data Analysis
2.5. Ethical Approval
3. Results and Discussion
3.1. Socio-Demographic Characteristics
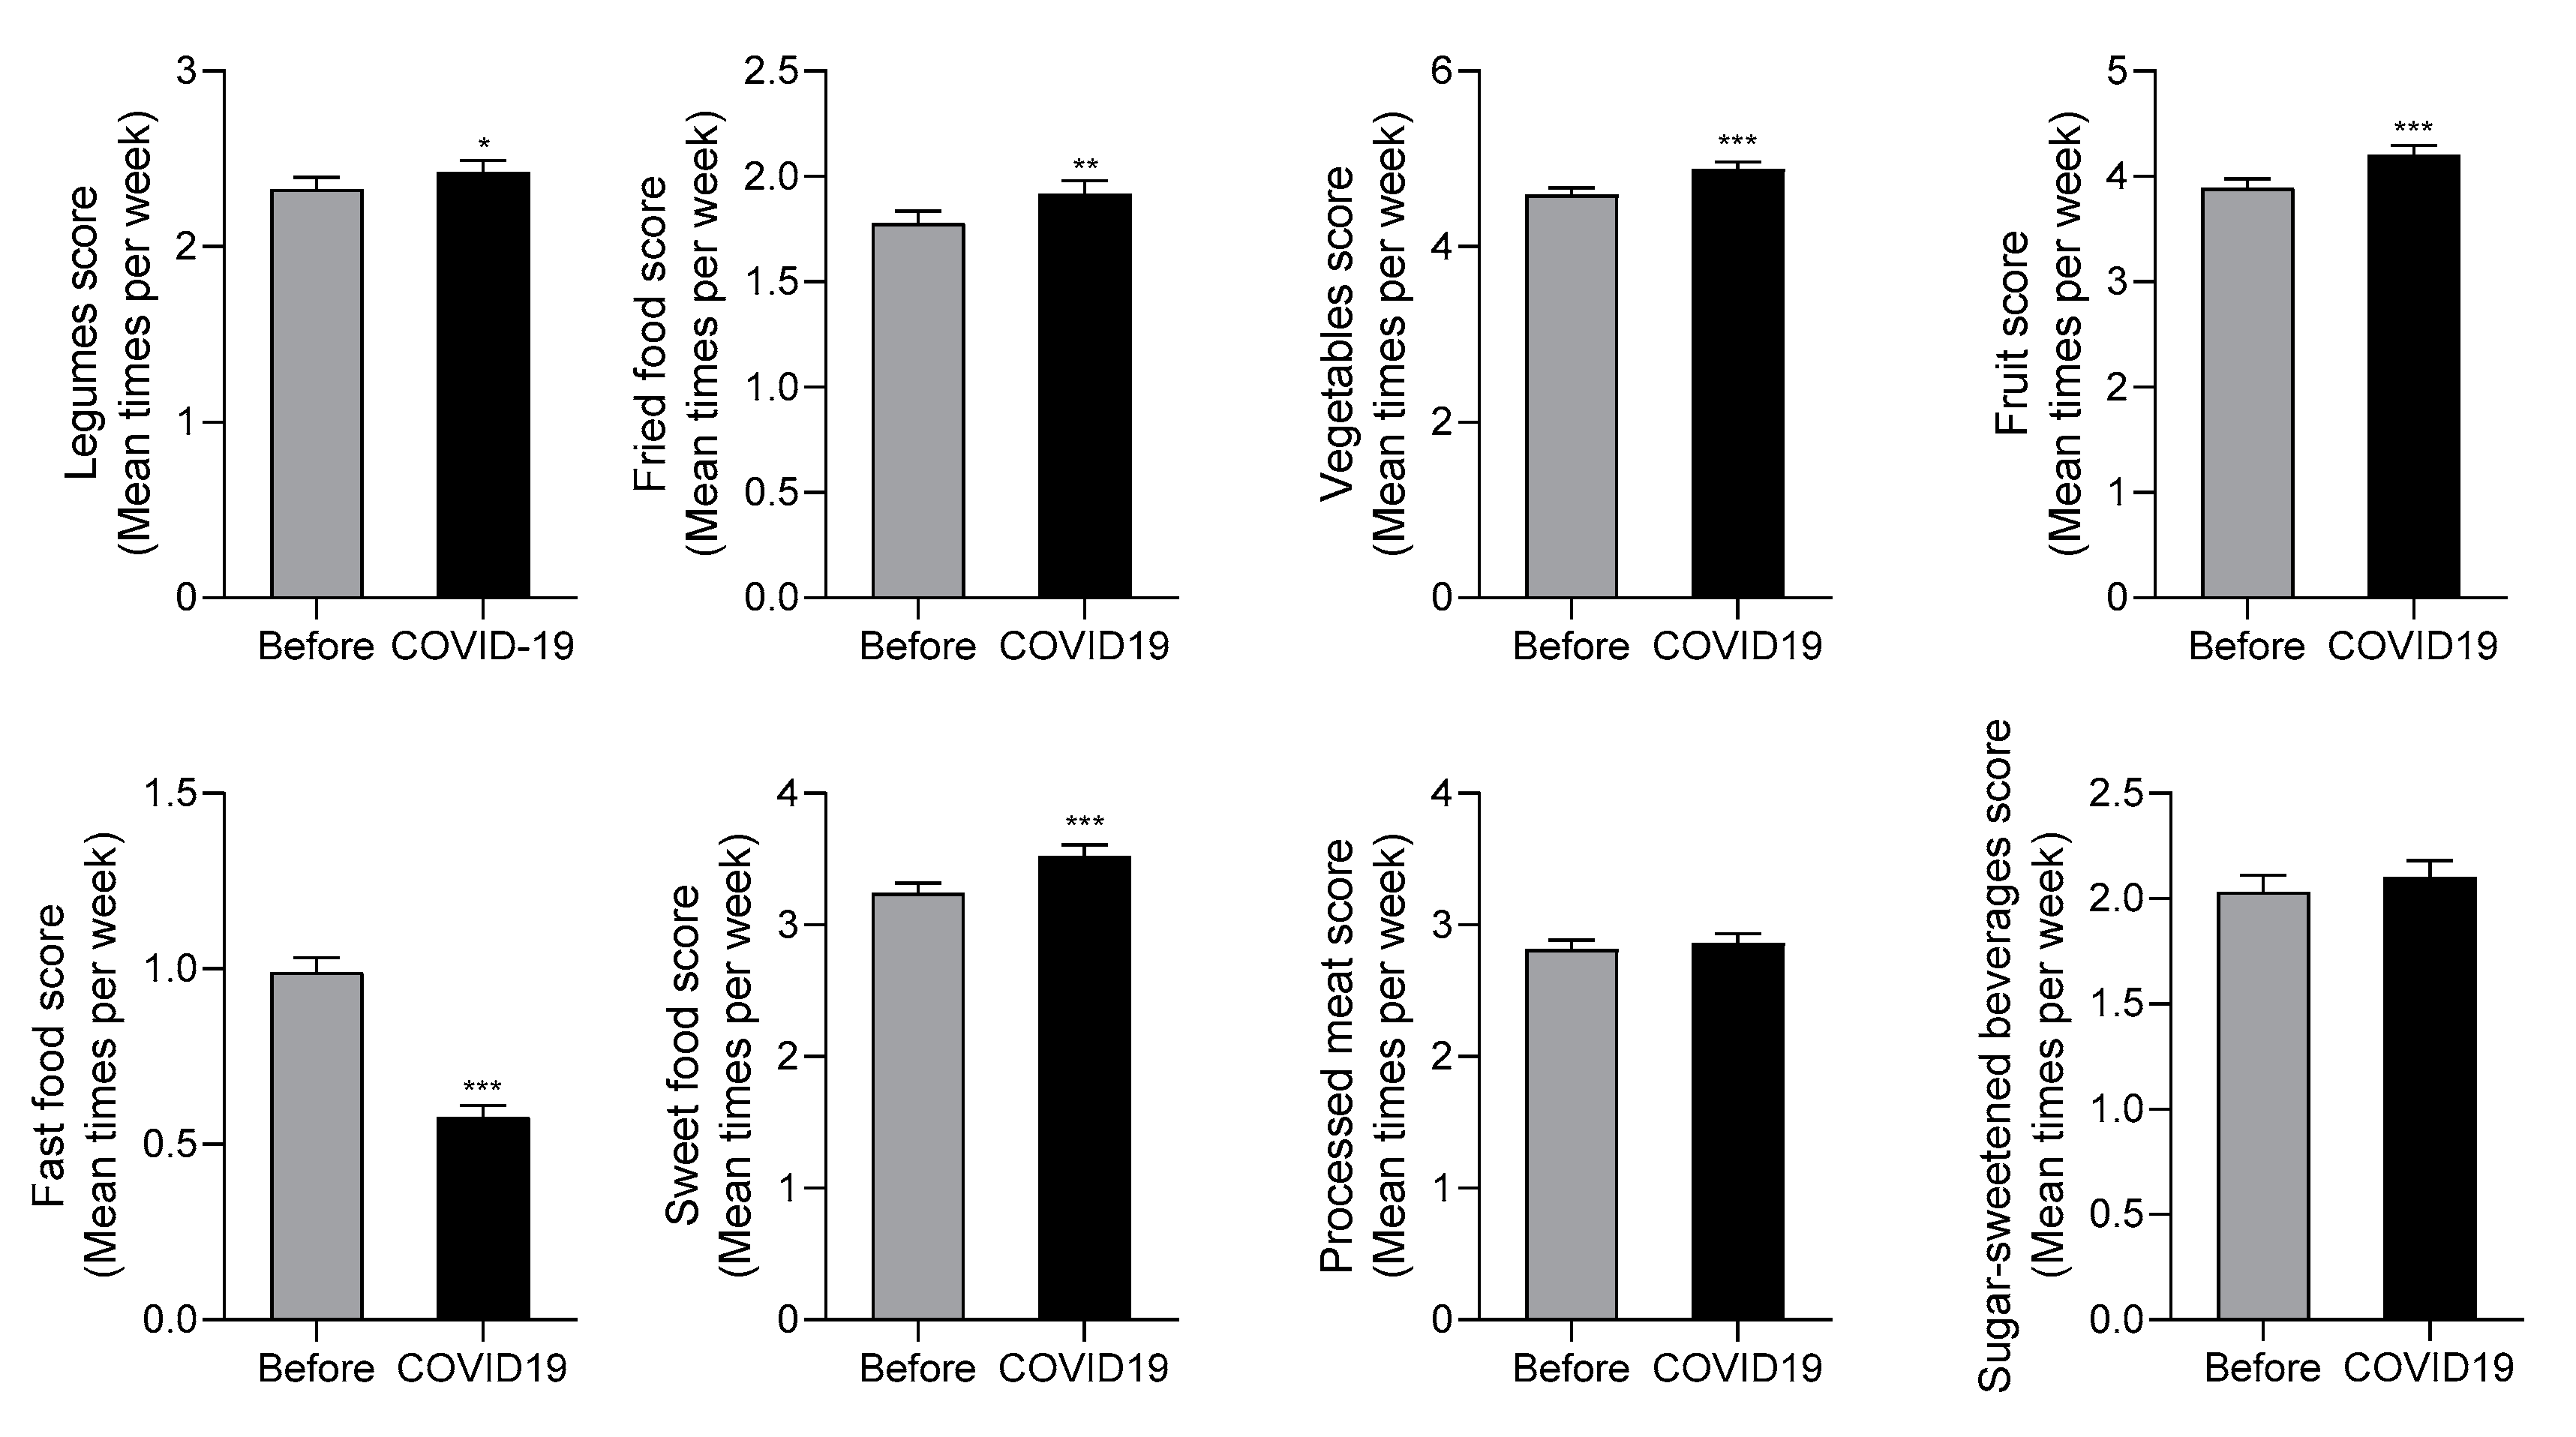
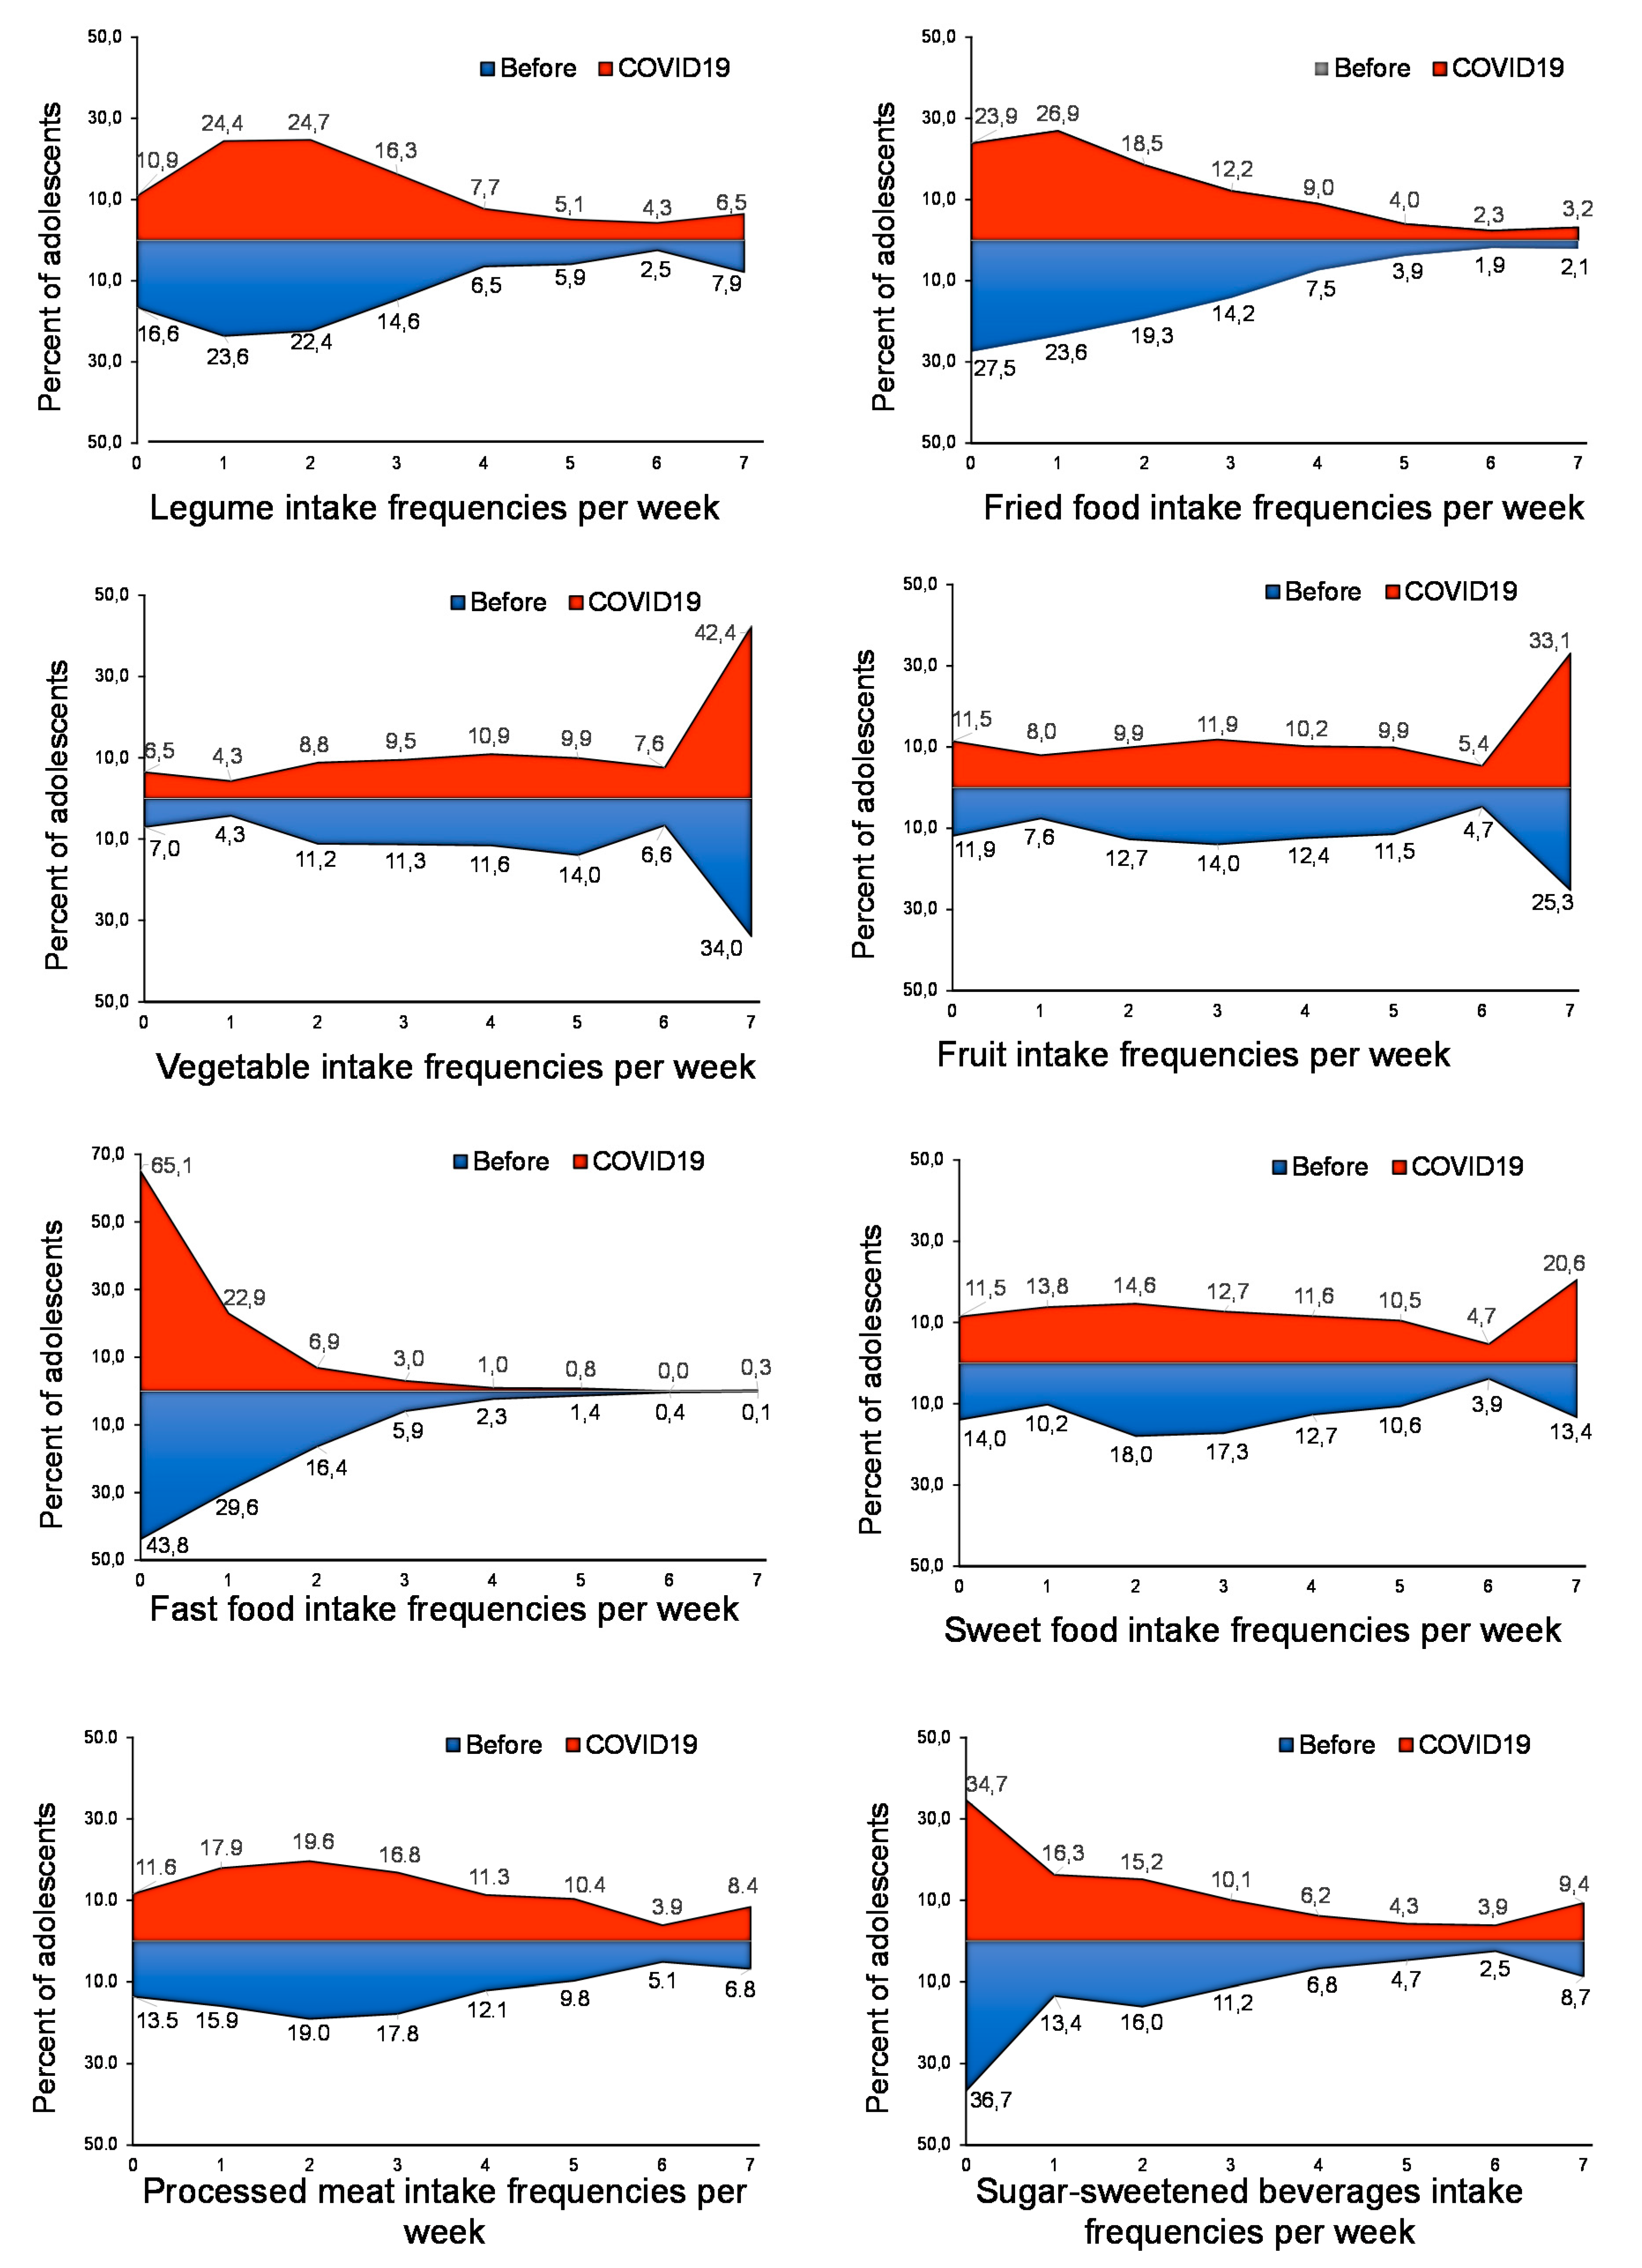
3.2. Confinement Due to COVID-19 Changed Dietary Trends among Adolescents
3.3. Adolescents’ Dietary Habits during COVID-19 Confinement According to Sociodemographic and Family Characteristics and the Modifications Versus the Previous Period
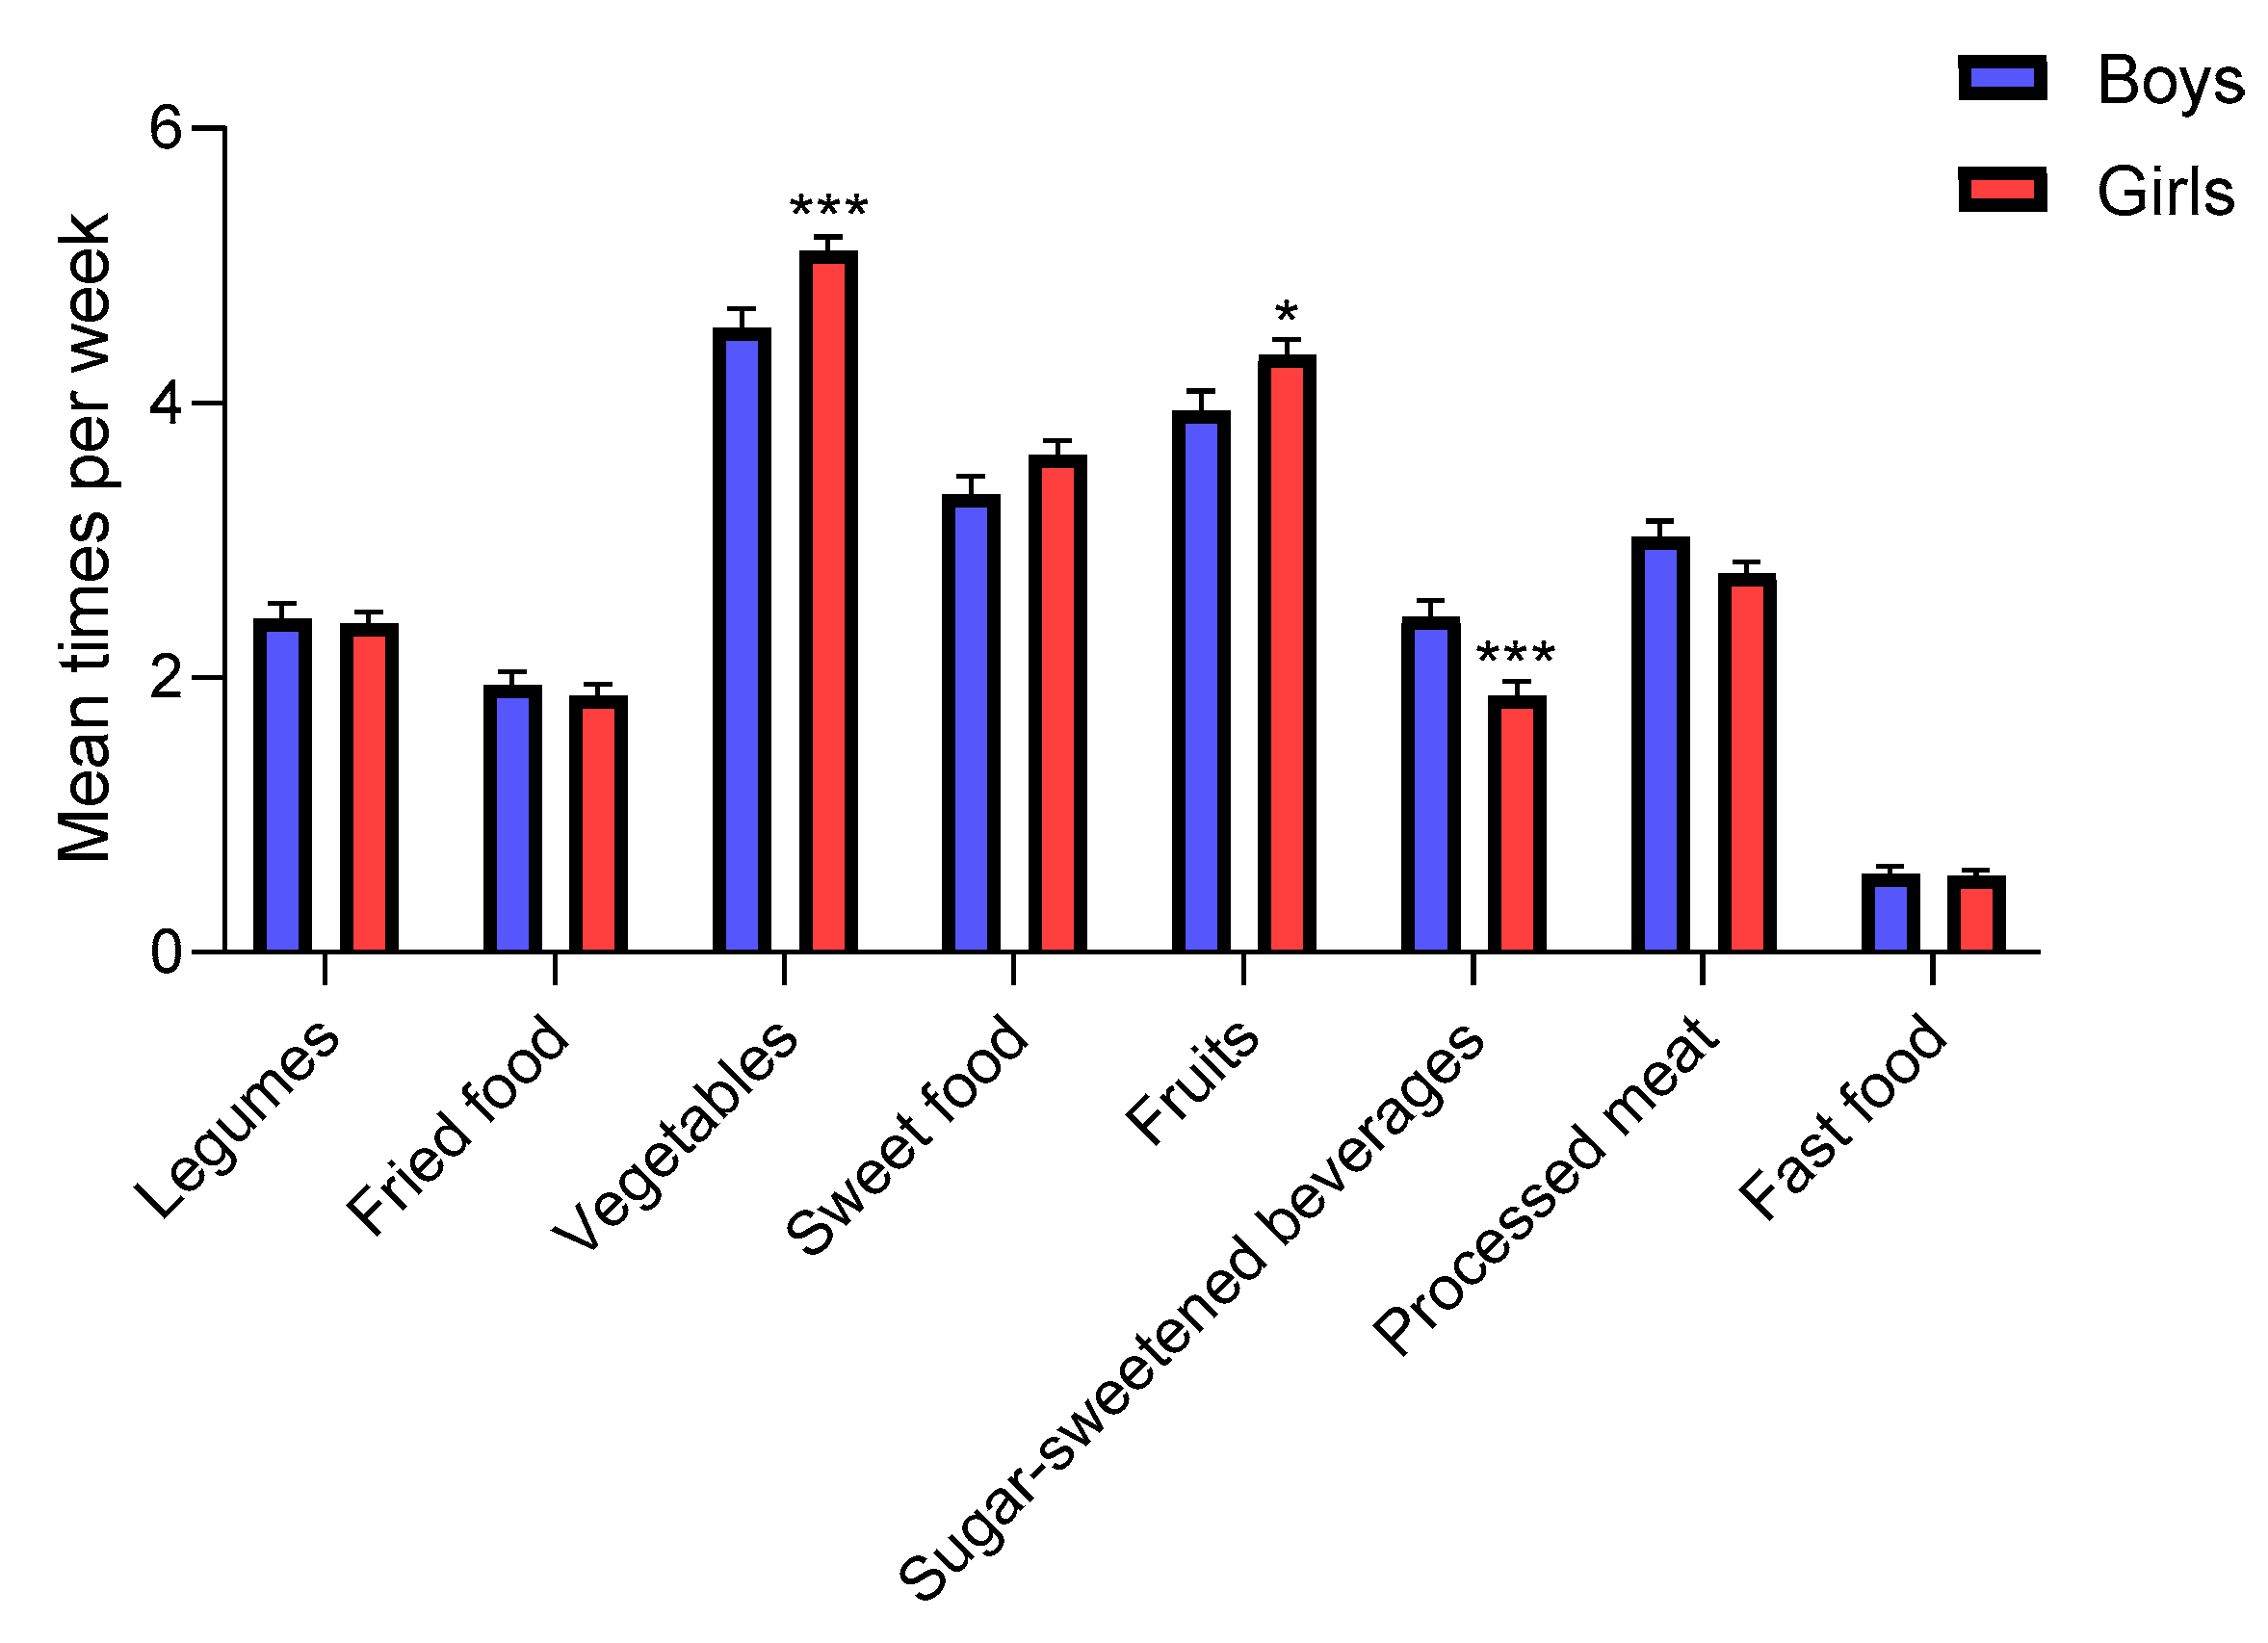
3.3.1. Gender
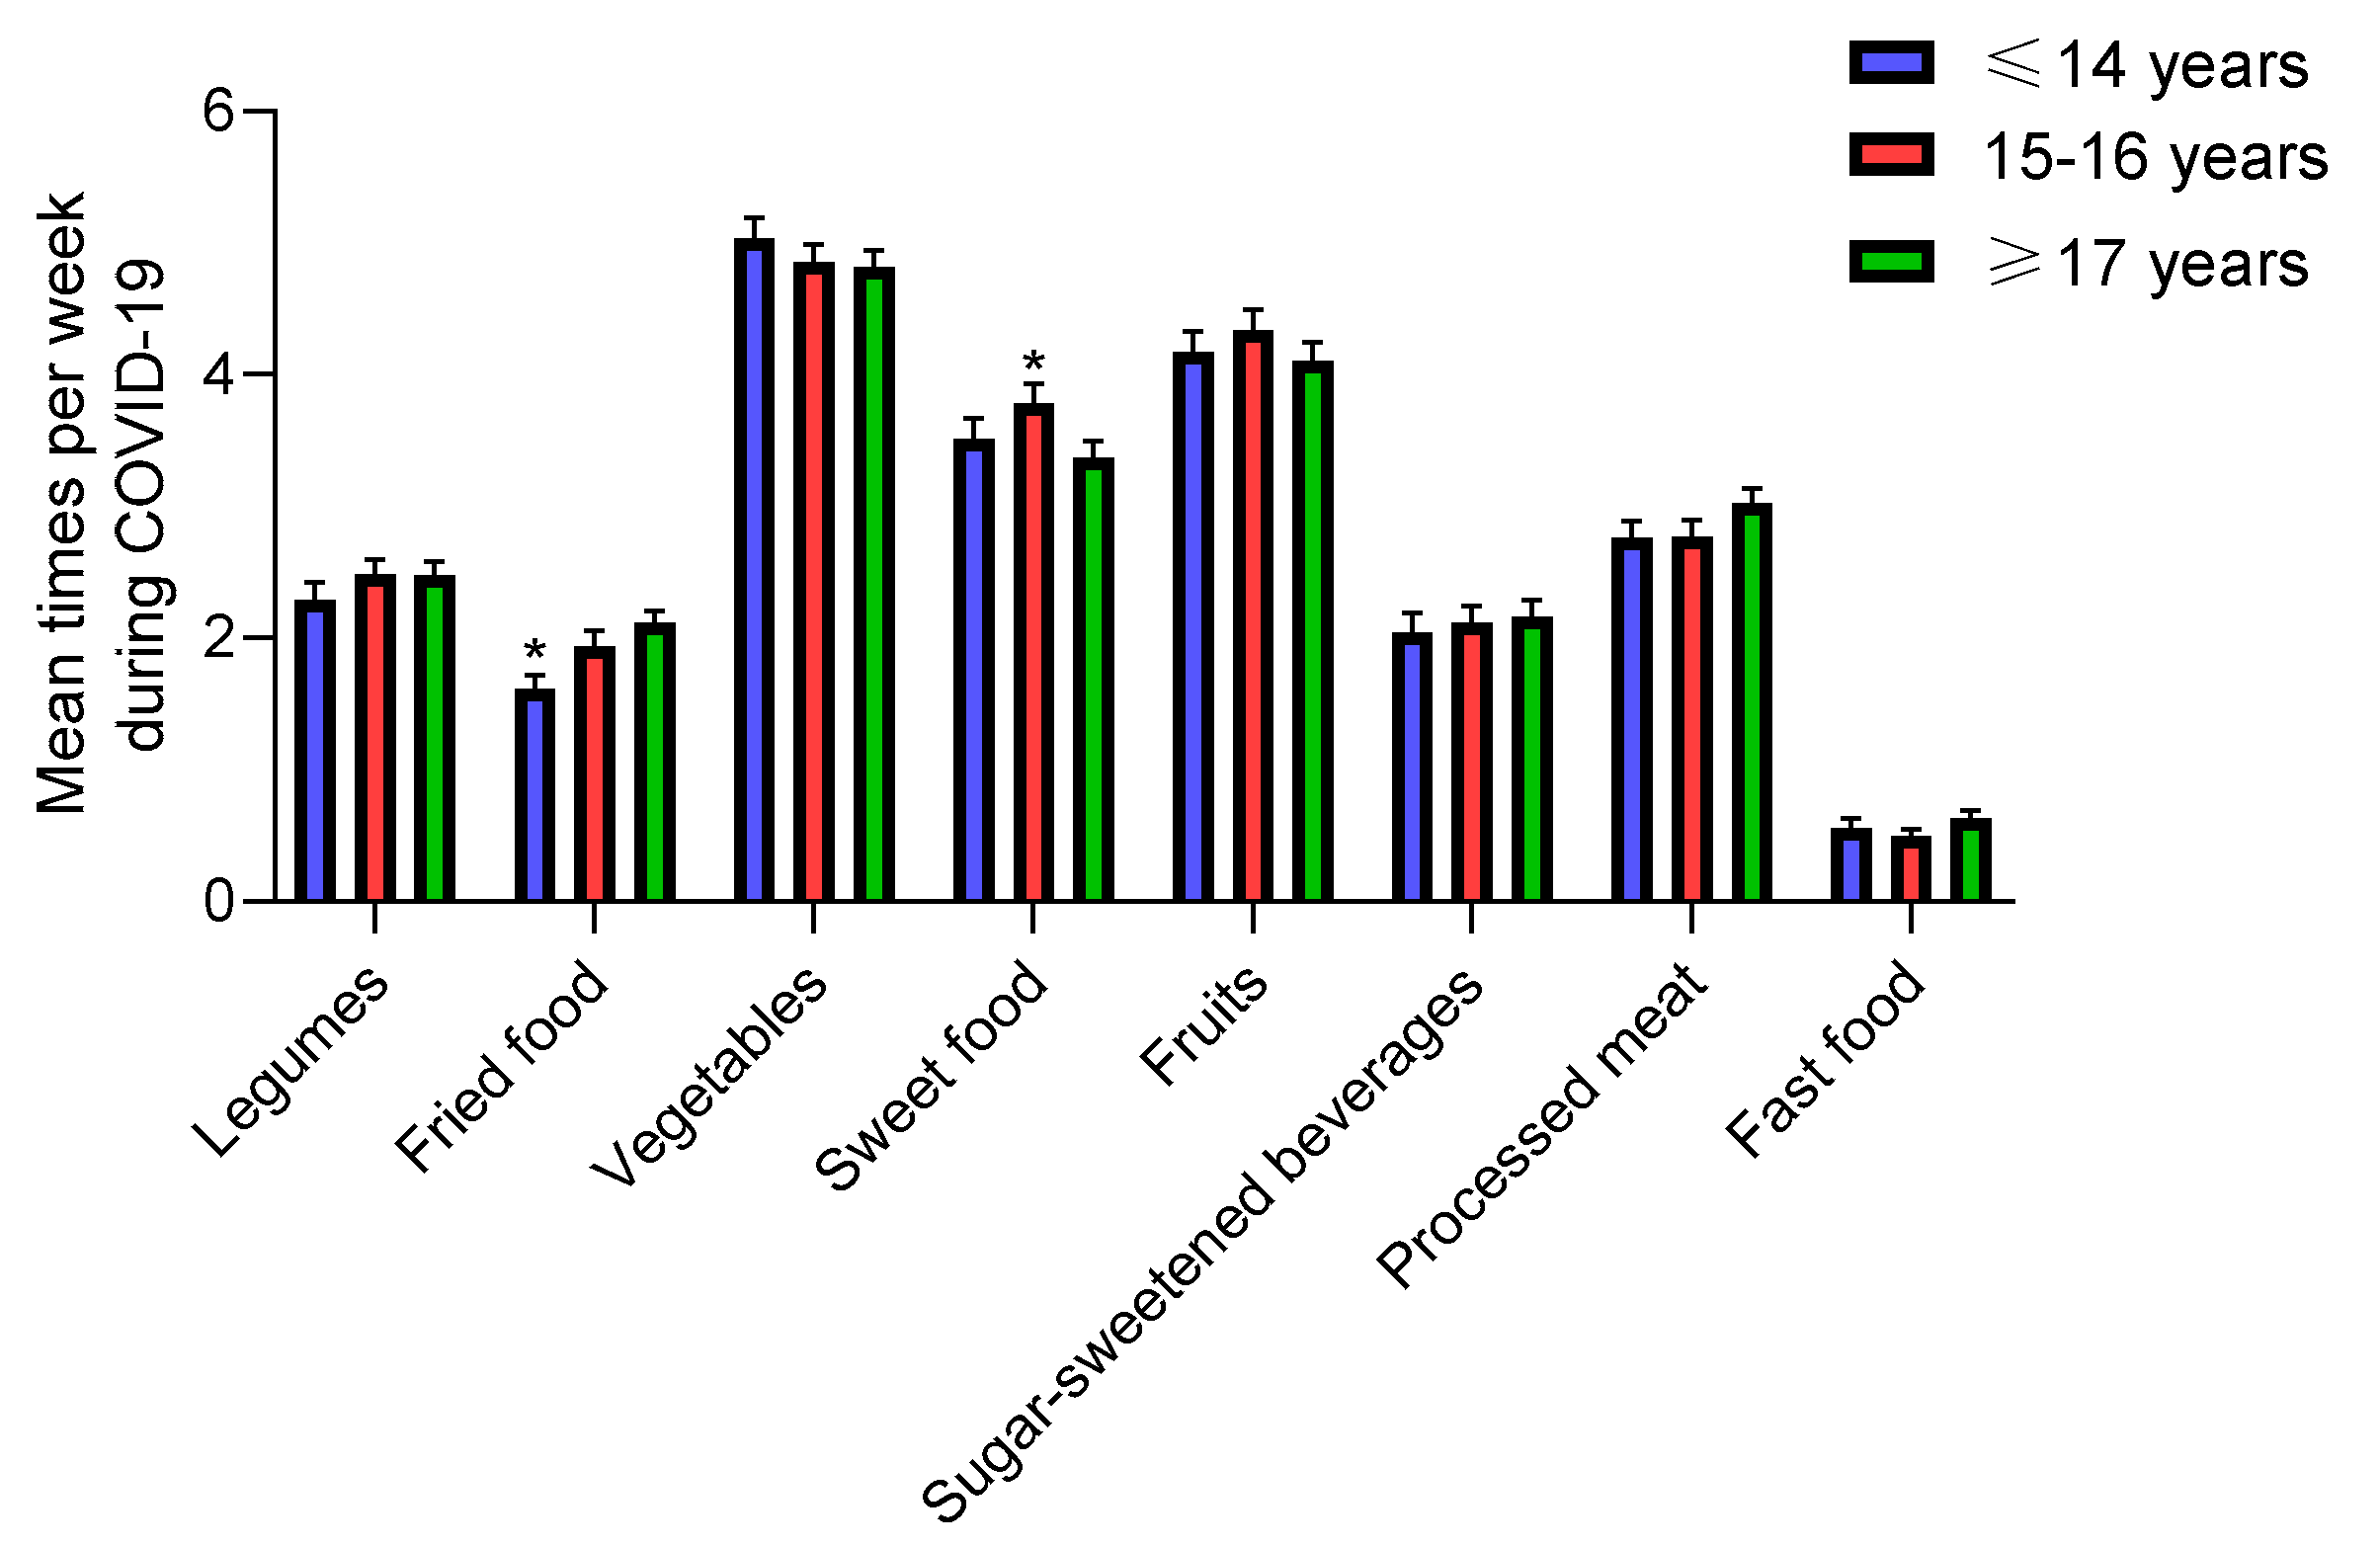
3.3.2. Age
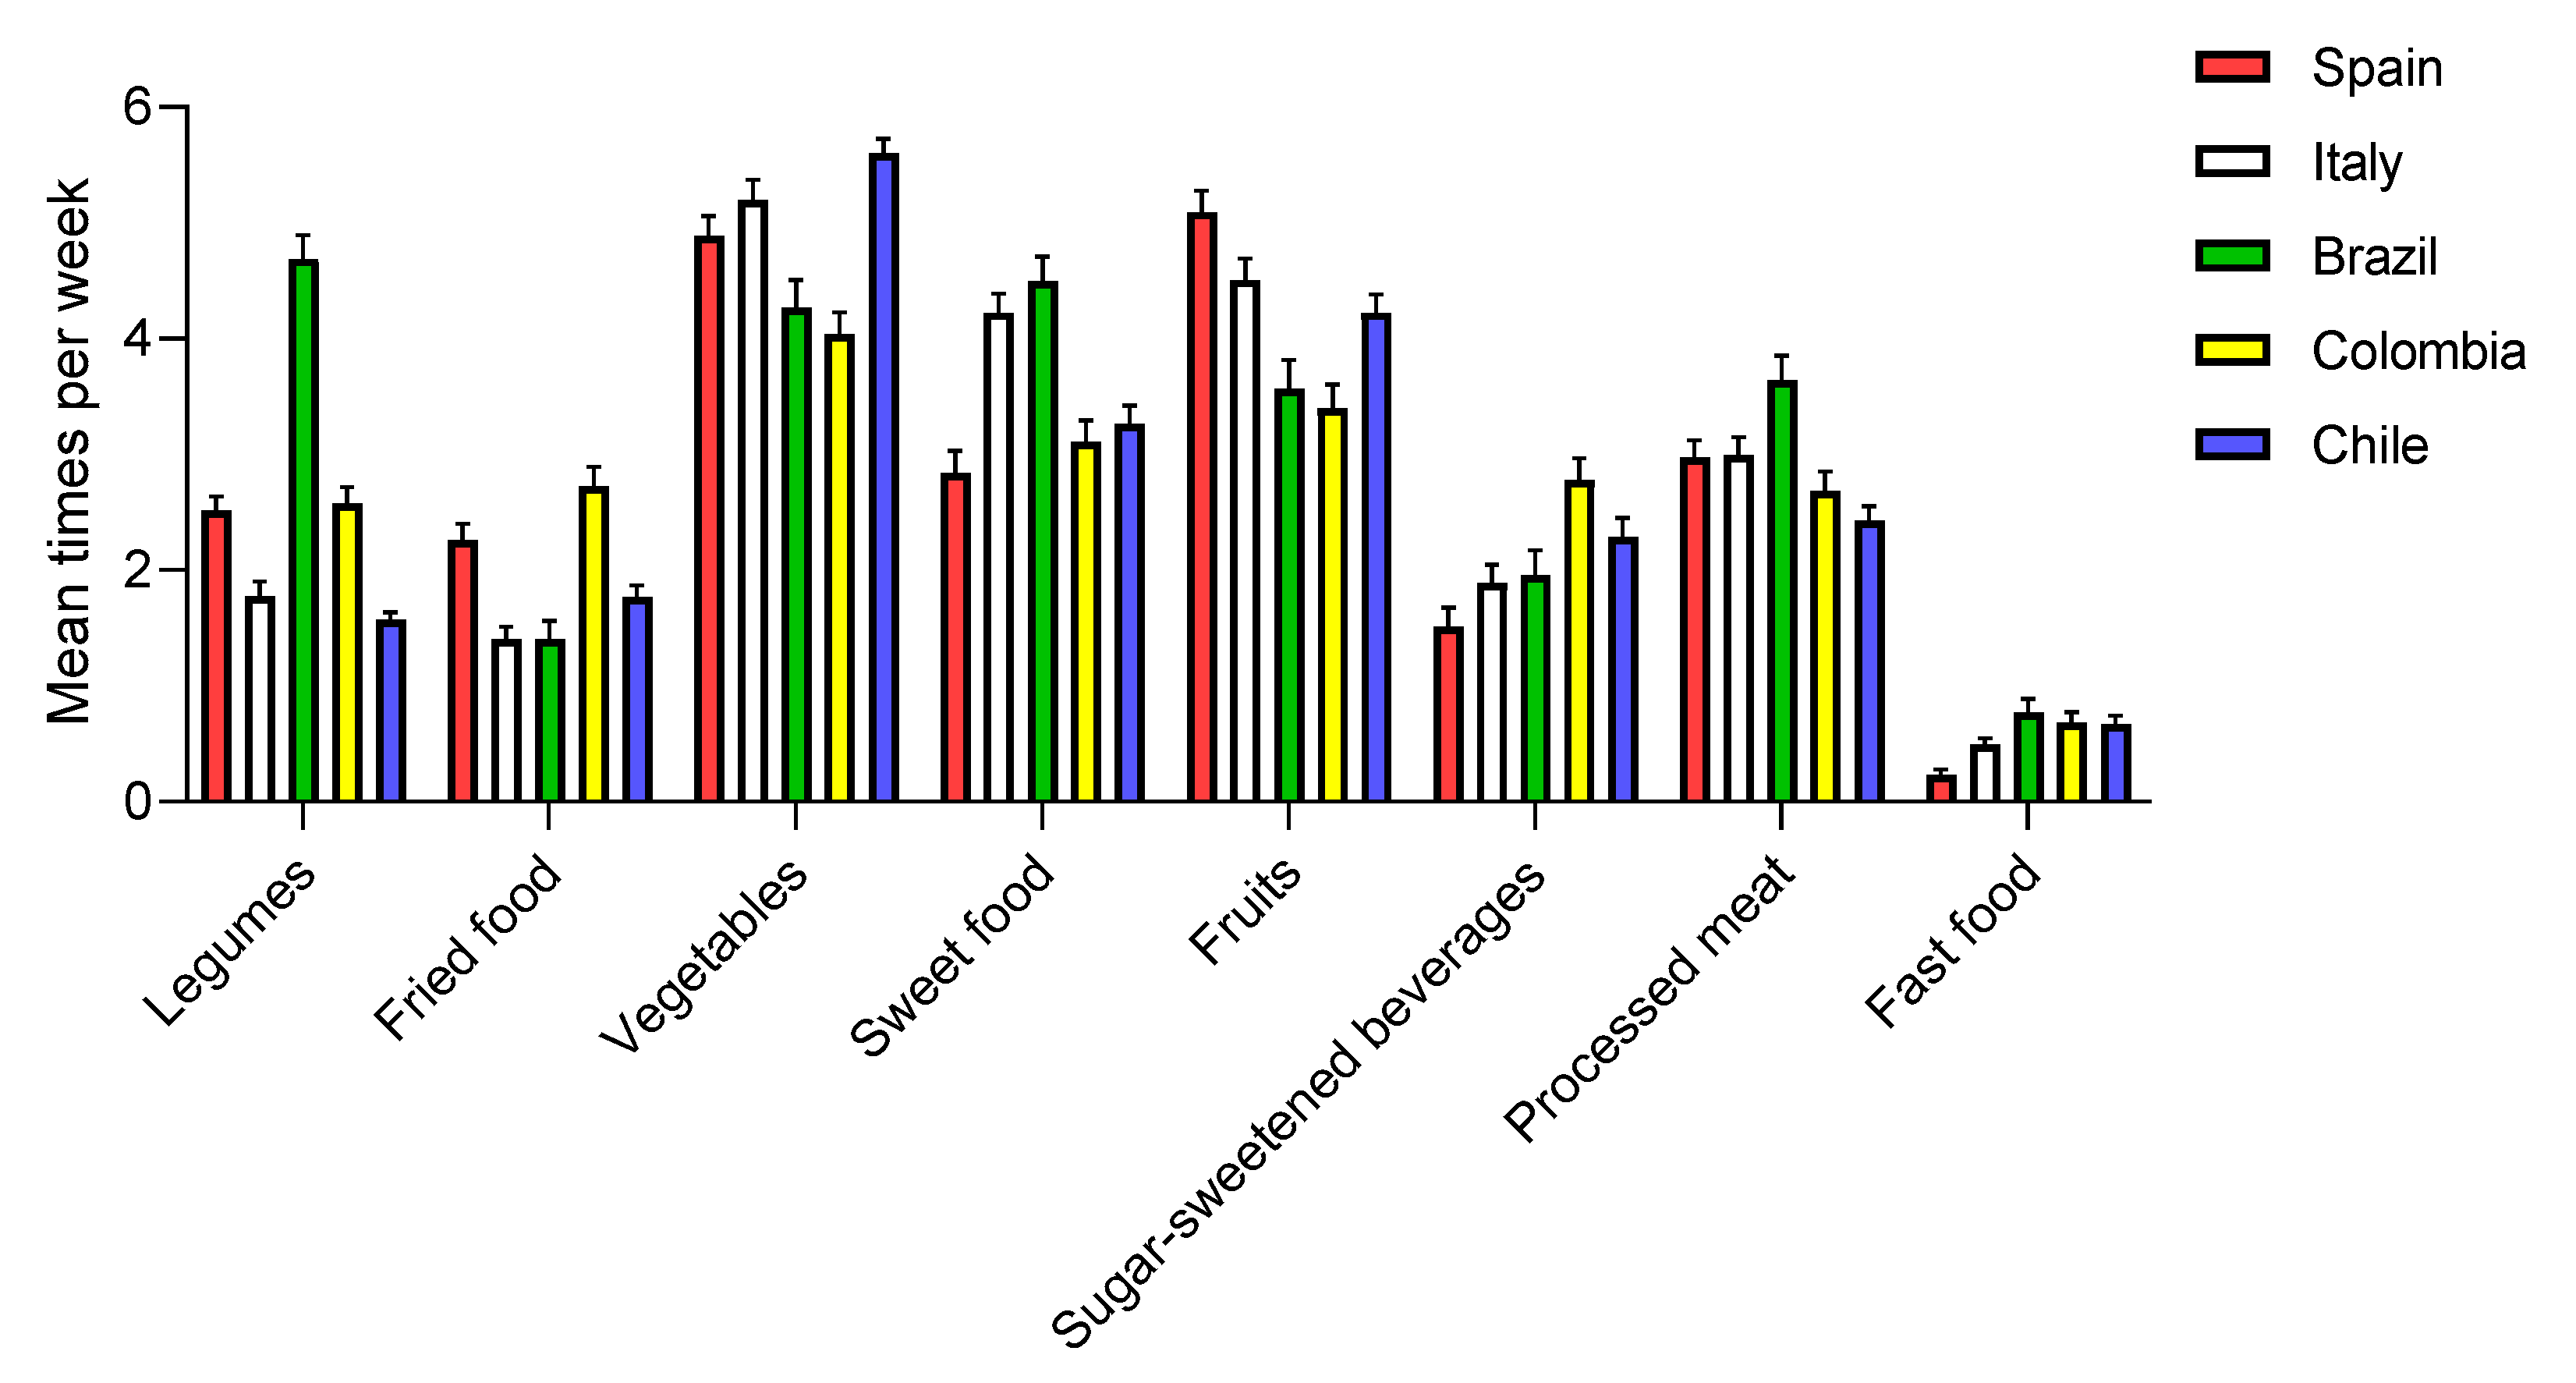
3.3.3. Country
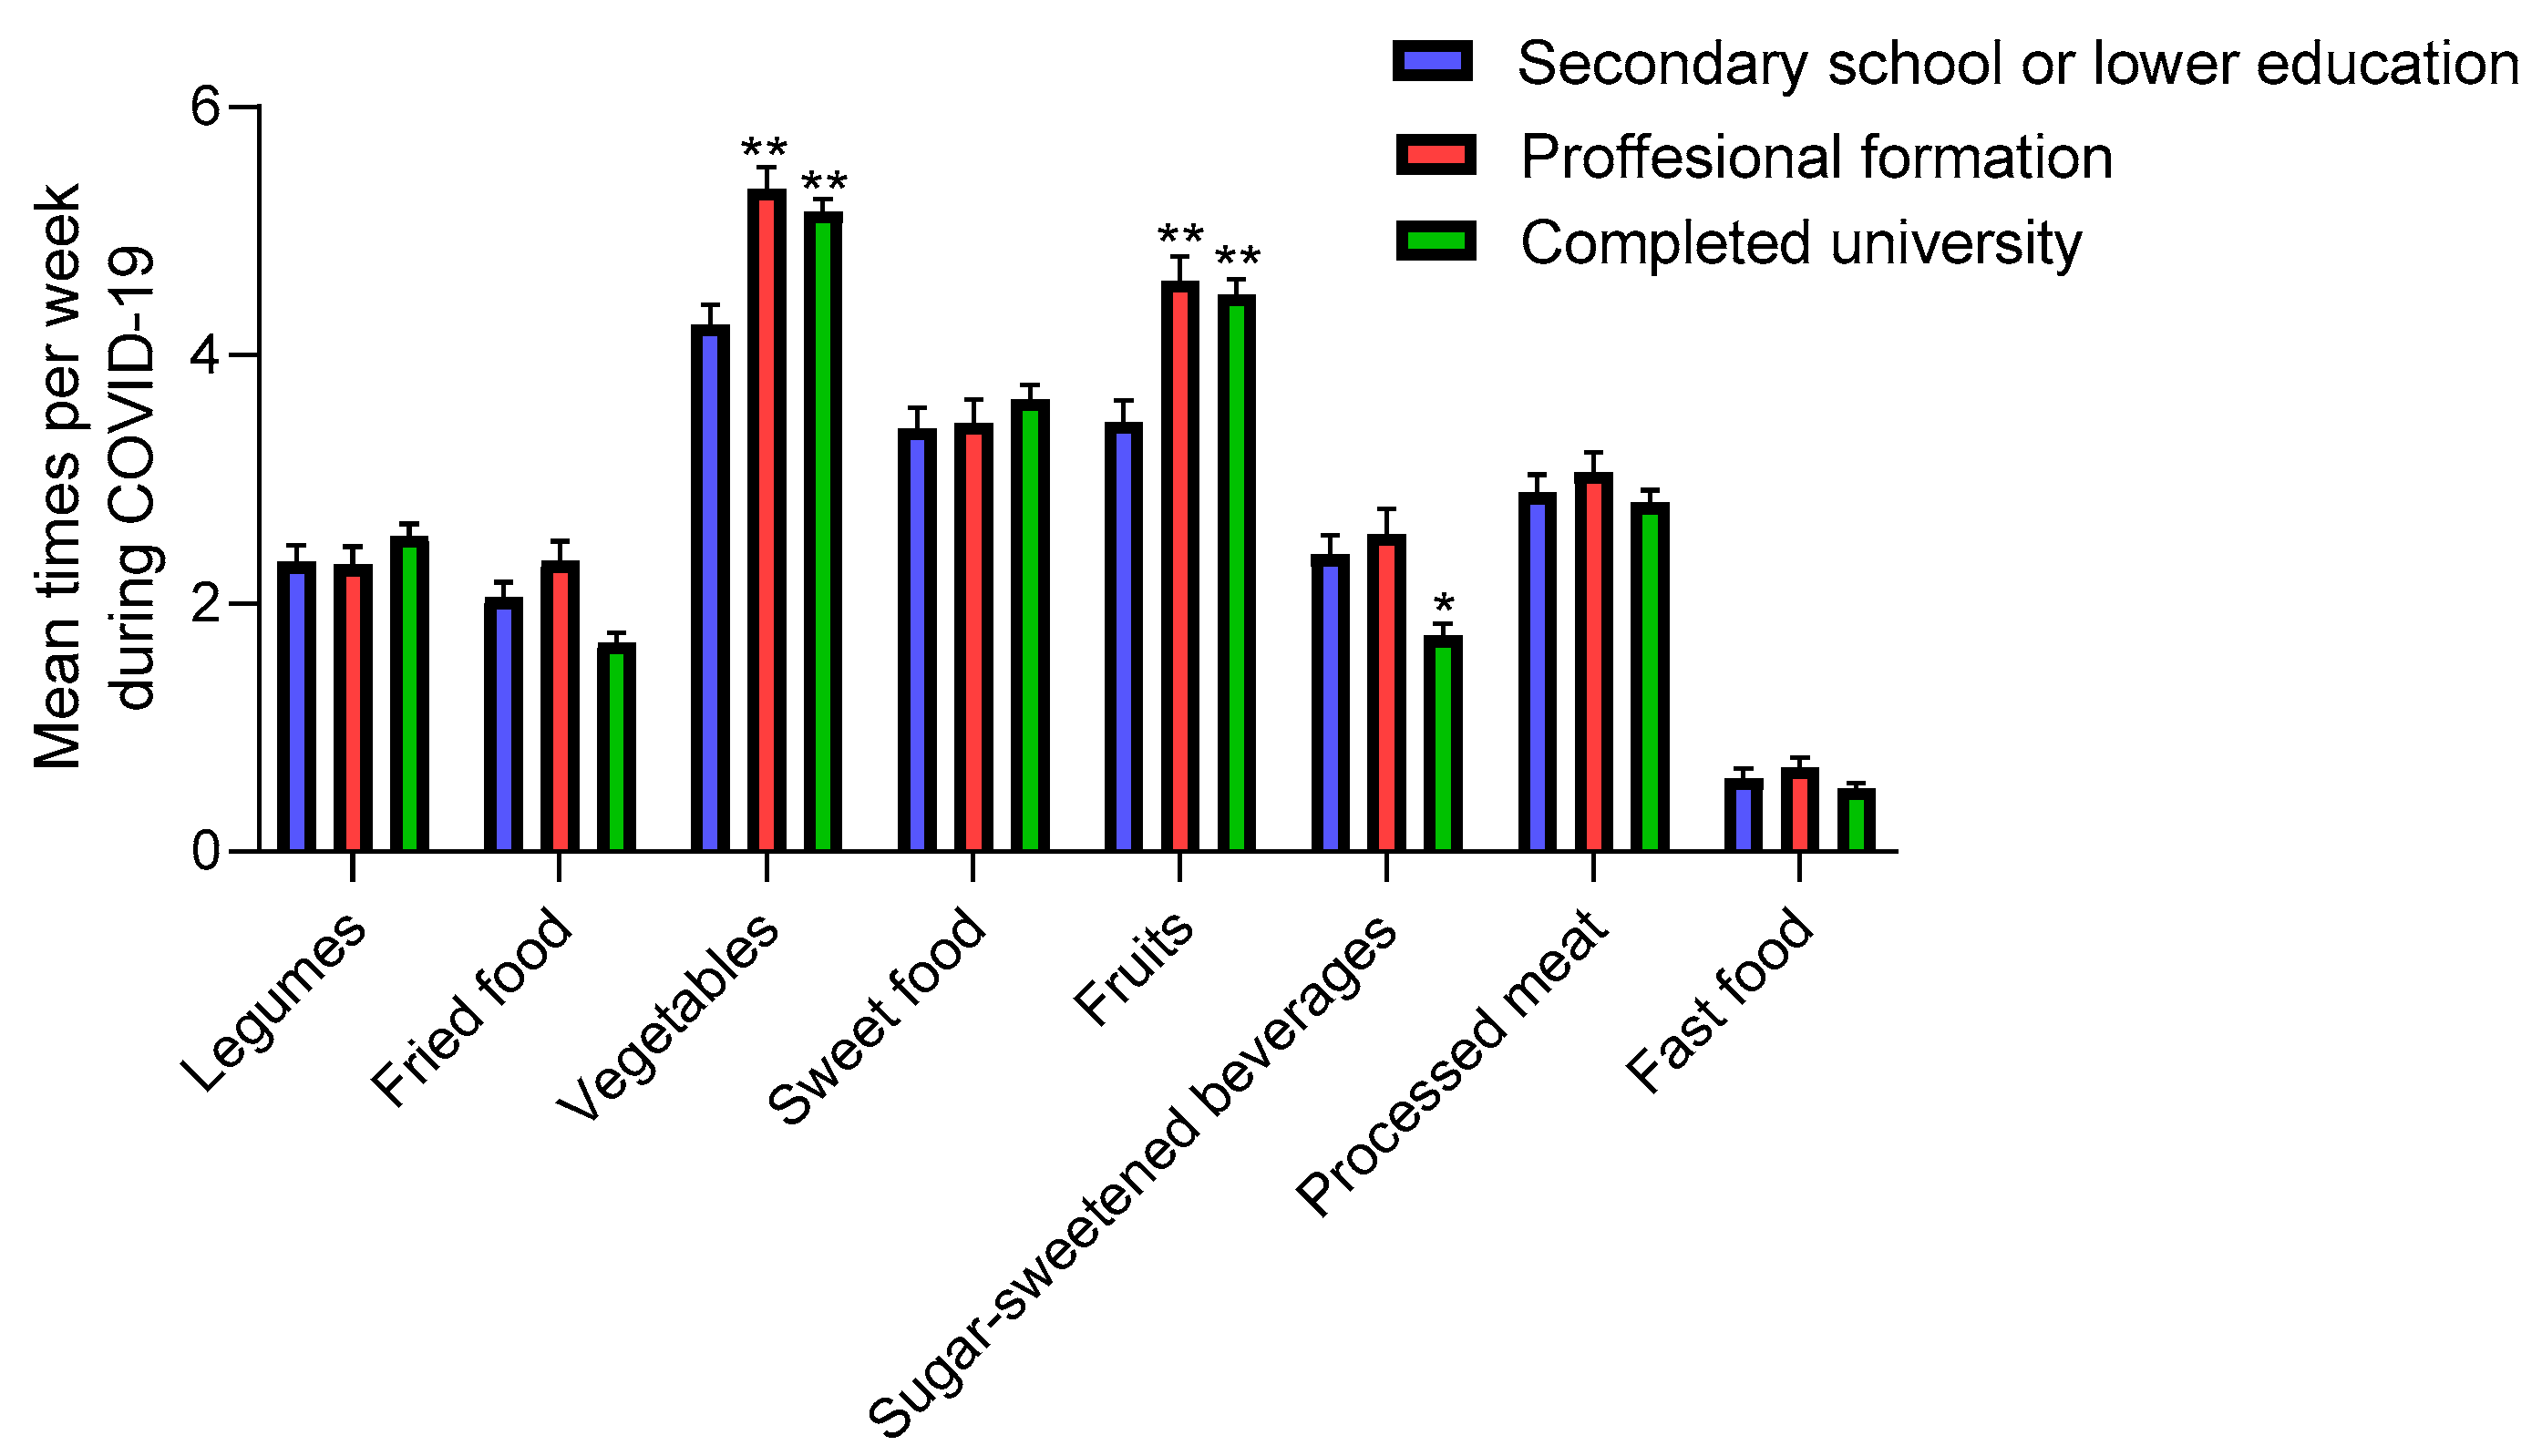
3.3.4. Maternal Education
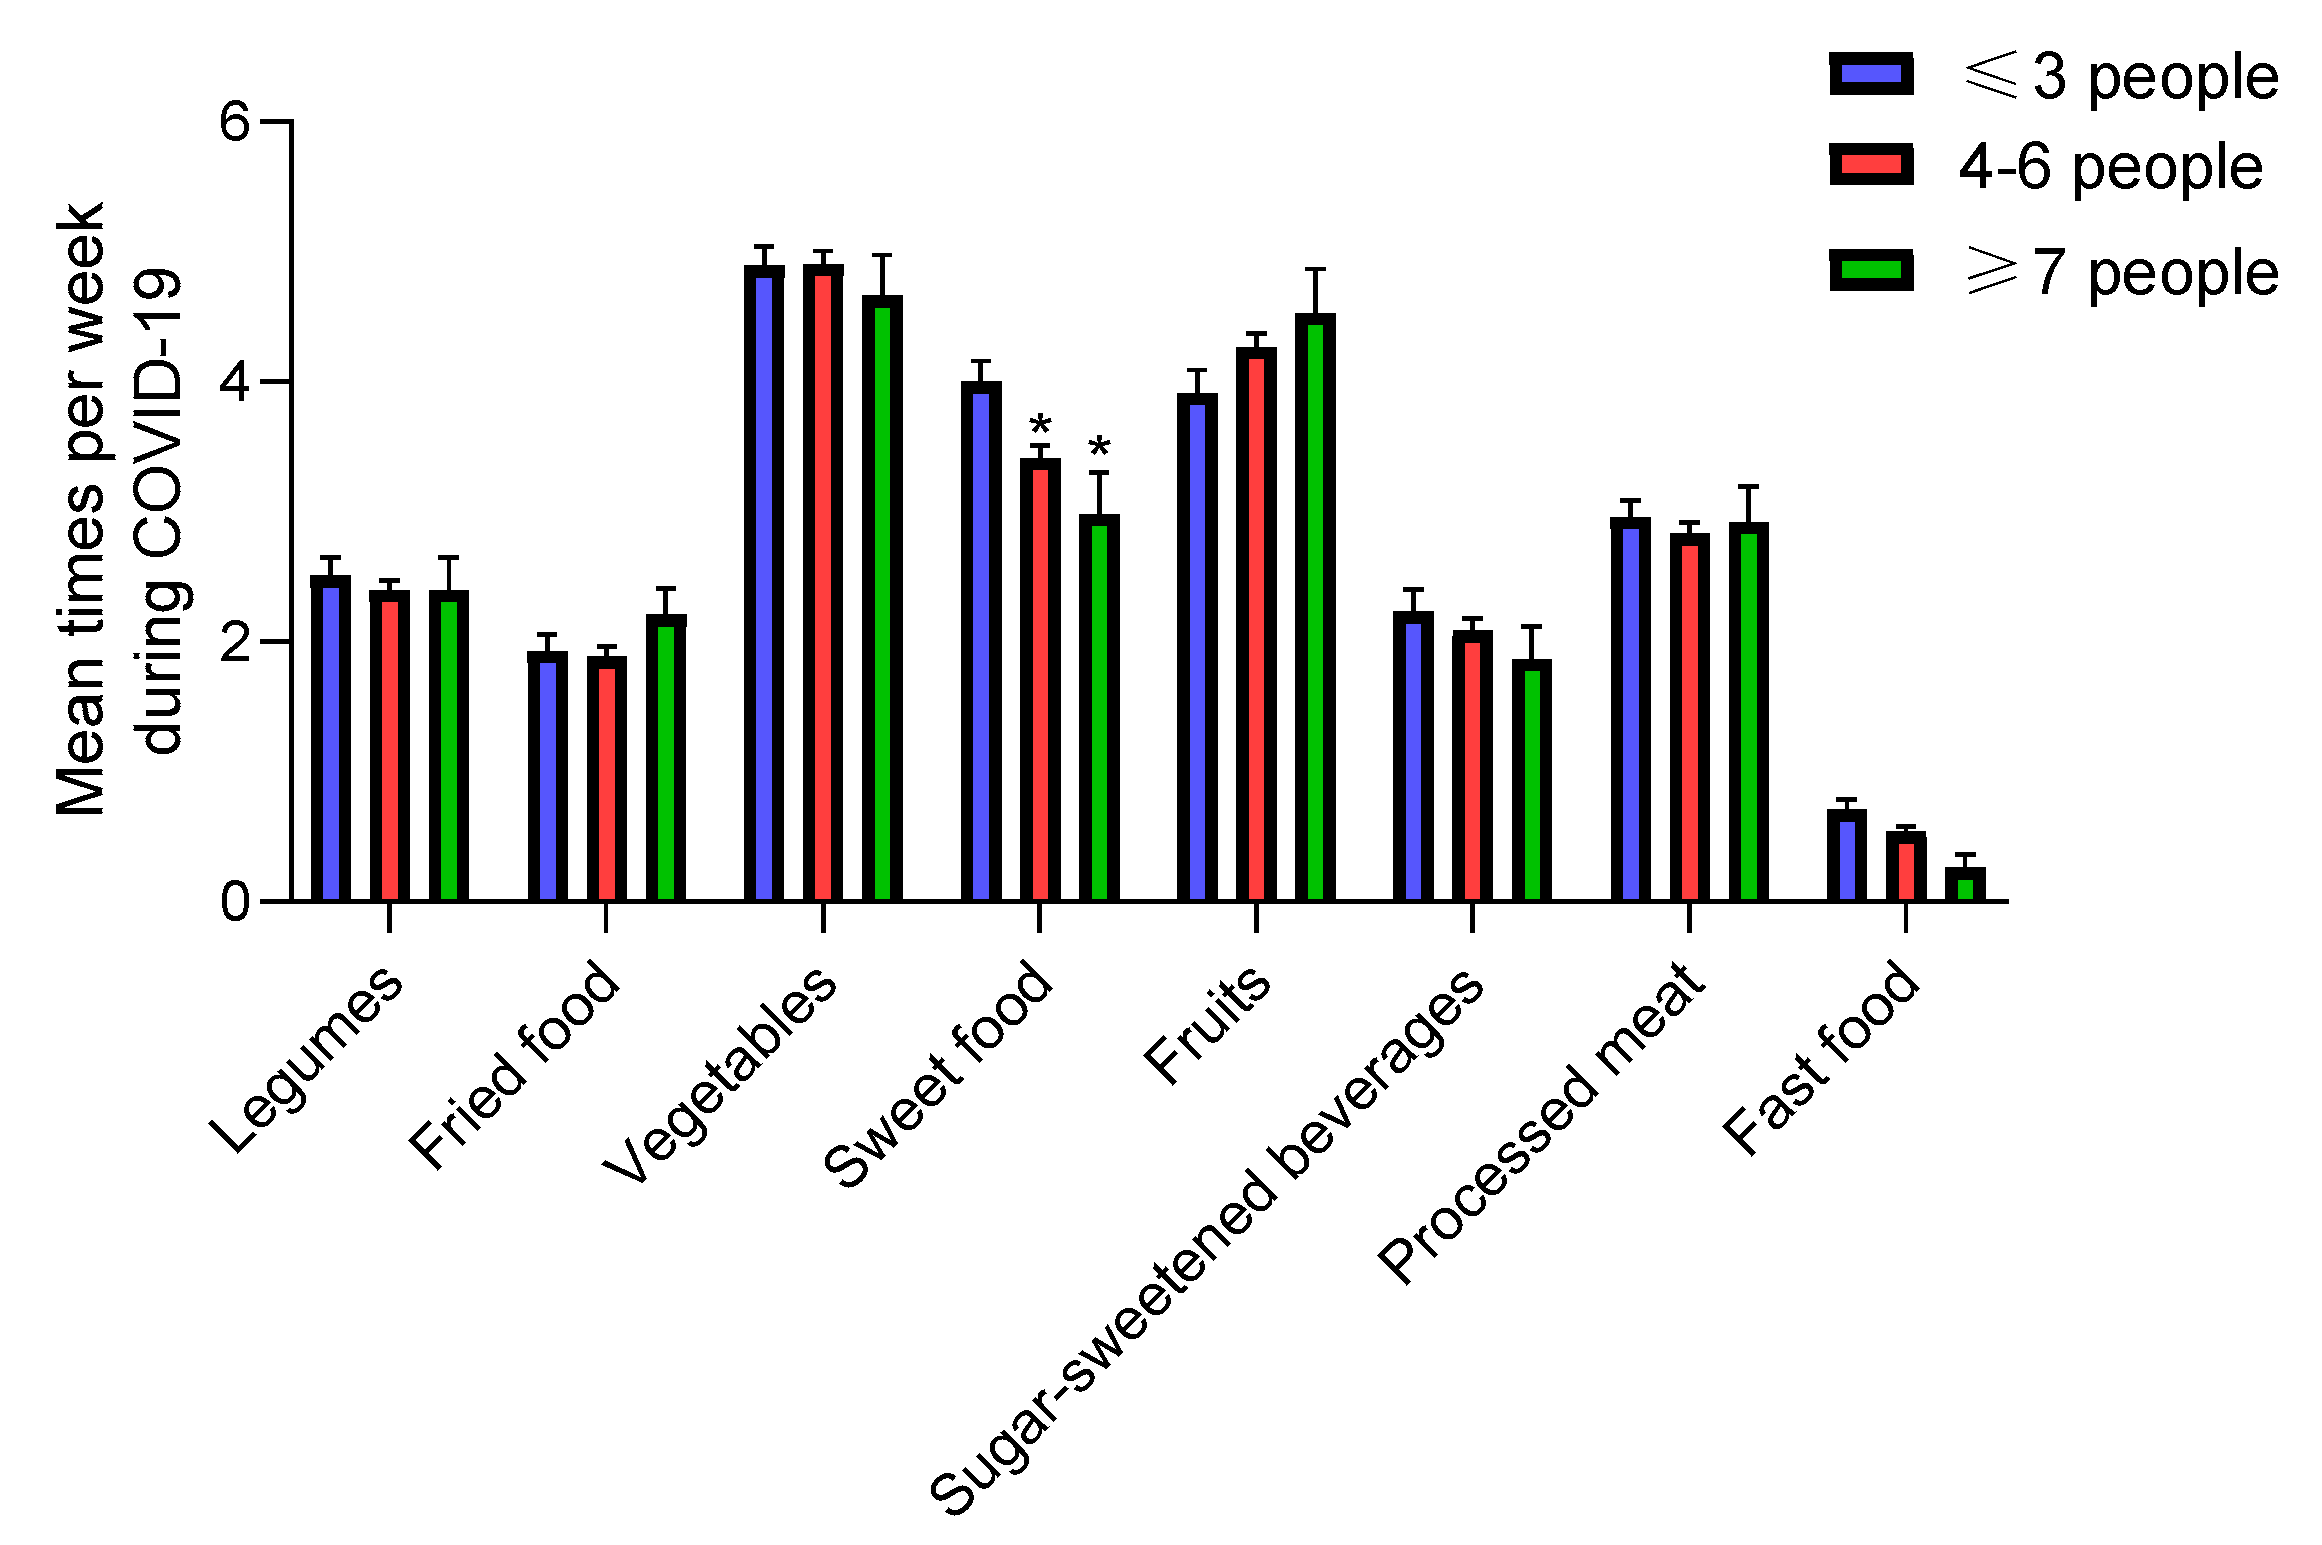
3.3.5. Number of Family Members at Home
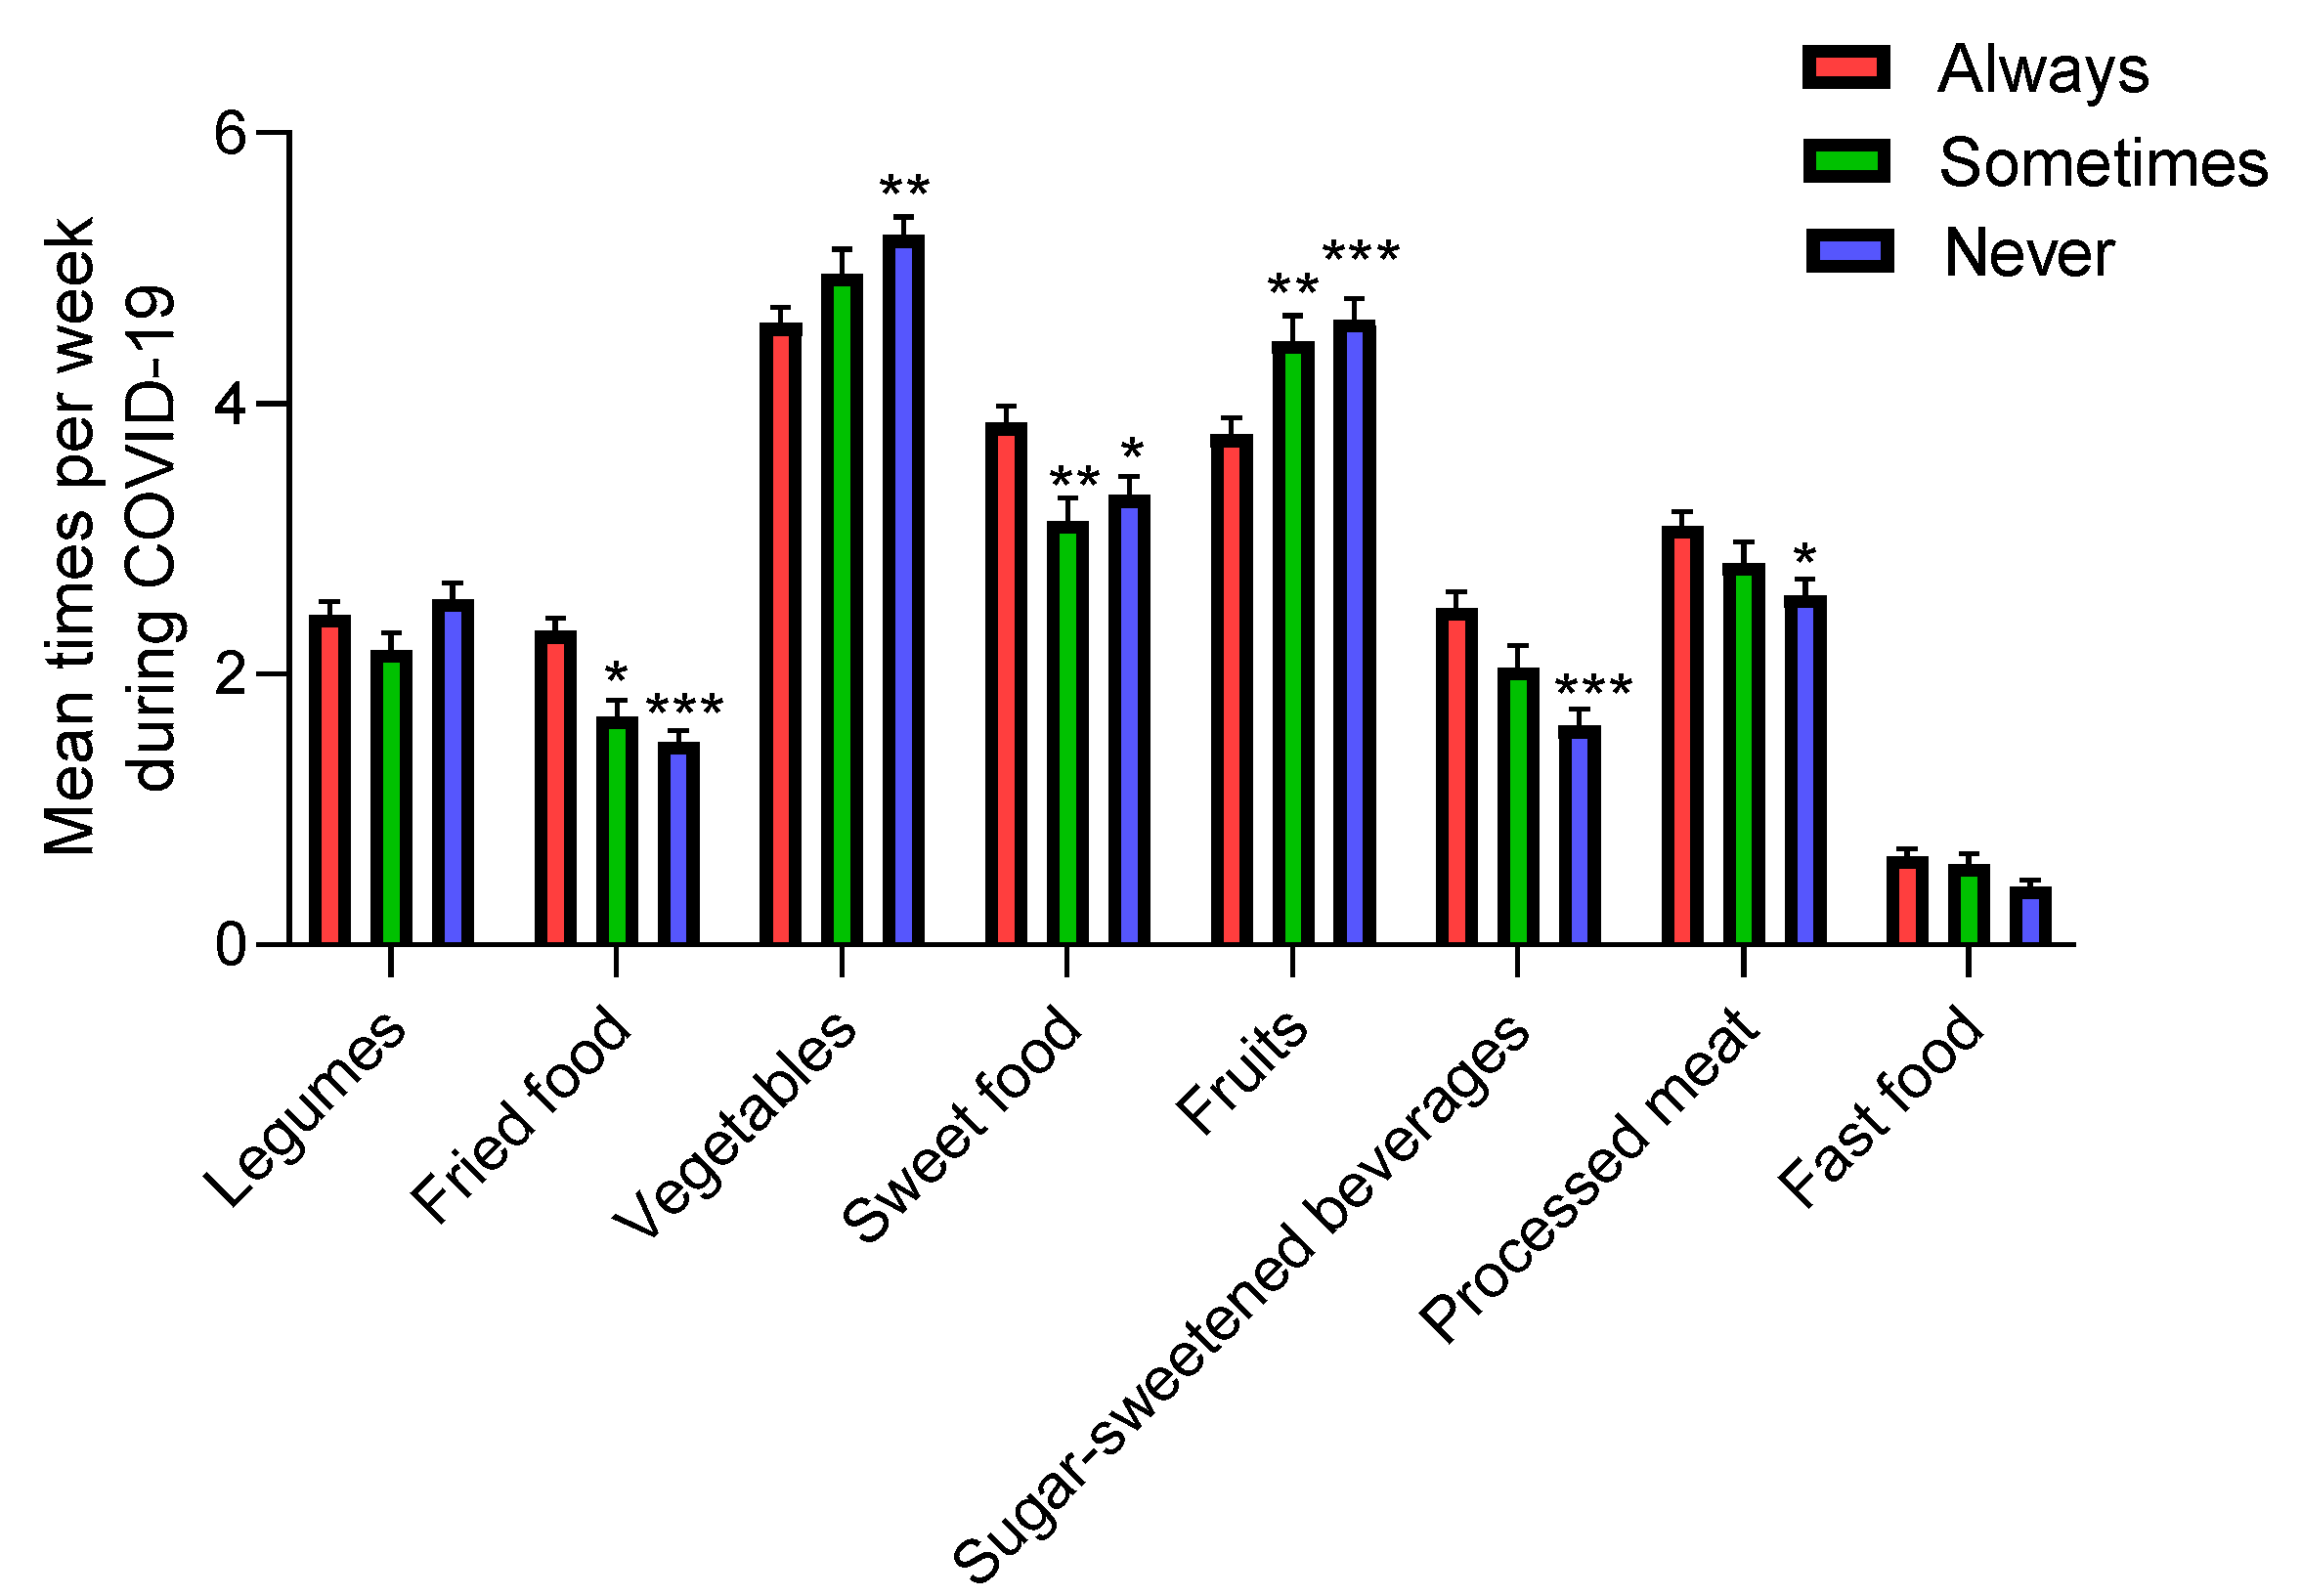
3.3.6. Watching TV during Mealtimes
4. Conclusions
Supplementary Materials
Author Contributions
Funding
Acknowledgments
Conflicts of Interest
References
- Rabi, F.A.; Al Zoubi, M.S.; Kasasbeh, G.A.; Salameh, D.M.; Al-Nasser, A.D. SARS-CoV-2 and coronavirus disease 2019: What we know so far. Pathogens 2020, 9, 231. [Google Scholar] [CrossRef] [PubMed]
- W.H.O. Coronavirus Disease (COVID-19) Pandemic. Available online: https://www.who.int/emergencies/diseases/novel-coronavirus-2019 (accessed on 24 May 2020).
- Lana, R.M.; Coelho, F.C.; Gomes, M.; Cruz, O.G.; Bastos, L.S.; Villela, D.A.M.; Codeco, C.T. The novel coronavirus (SARS-CoV-2) emergency and the role of timely and effective national health surveillance. Cad. Saude Publica 2020, 36, e00019620. [Google Scholar] [CrossRef] [PubMed] [Green Version]
- Muscogiuri, G.; Barrea, L.; Savastano, S.; Colao, A. Nutritional recommendations for CoVID-19 quarantine. Eur. J. Clin. Nutr. 2020, 74, 850–851. [Google Scholar] [CrossRef] [PubMed]
- Glabska, D.; Guzek, D.; Groele, B.; Gutkowska, K. Fruit and vegetables intake in adolescents and mental health: A systematic review. Rocz. Państwowego Zakładu Hig. 2020, 71, 15–25. [Google Scholar]
- W.H.O. Global Accelerated Action for the Health of Adolescents (AA-HA!): Guidance to Support Country Implementation. Available online: https://www.who.int/maternal_child_adolescent/topics/adolescence/framework-accelerated-action/en/2017 (accessed on 24 May 2020).
- F.A.O. COVID-19 and the Risk to Food Supply Chains: How to Respond? Available online: http://www.fao.org/3/ca8388en/CA8388EN.pdf (accessed on 7 June 2020).
- Fulkerson, J.A.; Friend, S.; Horning, M.; Flattum, C.; Draxten, M.; Neumark-Sztainer, D.; Gurvich, O.; Garwick, A.; Story, M.; Kubik, M.Y. Family home food environment and nutrition-related parent and child personal and behavioral outcomes of the healthy home offerings via the mealtime environment (home) plus program: a randomized controlled trial. J. Acad. Nutr. Diet. 2017, 118, 240–251. [Google Scholar] [CrossRef]
- Simmons, D.; Chapman, G.E. The significance of home cooking within families. Br. Food J. 2012, 114, 1184–1195. [Google Scholar] [CrossRef]
- Galli, F.; Reglero, G.; Bartolini, D.; Visioli, F. Better prepare for the next one. Lifestyle lessons from the COVID-19 pandemic. PharmaNutrition 2020, 12, 100193. [Google Scholar] [CrossRef]
- Oliveira, M.M.; Campos, M.O.; Andreazzi, M.A.R.; Malta, D.C. Characteristics of the National Adolescent School-based Health Survey—PeNSE, Brazil. Epidemiol. Serviços Saúde 2017, 26, 605–616. [Google Scholar] [CrossRef]
- W.H.O. Global School-Based Student Health Survey (GSHS). Available online: https://www.who.int/ncds/surveillance/gshs/en/ (accessed on 24 May 2020).
- The Centre for the Promotion of Imports from Developing Countries. All Hands on Deck for the Fresh Sector (COVID-19). Available online: https://www.cbi.eu/news/all-hands-deck-fresh-sector-covid-19/2020 (accessed on 24 May 2020).
- W.H.O. Food and Nutrition Tips during Self-Quarantine. Available online: http://www.euro.who.int/en/health-topics/health-emergencies/coronavirus-covid-19/technical-guidance/food-and-nutrition-tips-during-self-quarantine (accessed on 24 May 2020).
- Liu, J.; Rehm, C.D.; Micha, R.; Mozaffarian, D. Quality of meals consumed by us adults at full-service and fast-food restaurants, 2003–2016: Persistent low quality and widening disparities. J. Nutr. 2020, 150, 873–883. [Google Scholar] [CrossRef] [PubMed]
- Rajkumar, R.P. COVID-19 and mental health: A review of the existing literature. Asian J. Psychiatry 2020, 52, 102066. [Google Scholar] [CrossRef] [PubMed]
- Wang, G.; Zhang, Y.; Zhao, J.; Zhang, J.; Jiang, F. Mitigate the effects of home confinement on children during the COVID-19 outbreak. Lancet 2020, 395, 945–947. [Google Scholar] [CrossRef]
- Moynihan, A.B.; van Tilburg, W.A.; Igou, E.R.; Wisman, A.; Donnelly, A.E.; Mulcaire, J.B. Eaten up by boredom: Consuming food to escape awareness of the bored self. Front. Psychol. 2015, 6, 369. [Google Scholar] [CrossRef] [PubMed]
- Scully, M.; Dixon, H.; Wakefield, M. Association between commercial television exposure and fast-food consumption among adults. Public Health Nutr. 2009, 12, 105–110. [Google Scholar] [CrossRef] [PubMed] [Green Version]
- Scarmozzino, F.; Visioli, F. Covid-19 and the subsequent lockdown modified dietary habits of almost half the population in an Italian sample. Foods 2020, 9, 675. [Google Scholar] [CrossRef]
- Grzymisławska, M.; Puch, E.A.; Zawada, A.; Grzymisławski, M. Do nutritional behaviors depend on biological sex and cultural gender? Adv. Clin. Exp. Med. 2020, 29, 165–172. [Google Scholar] [CrossRef] [Green Version]
- Mis, N.F.; Braegger, C.; Bronsky, J.; Campoy, C.; Domellöf, M.; Embleton, N.; Hojsak, I.; Hulst, J.; Indrio, F.; Lapillonne, A.; et al. Sugar in infants, children and adolescents: A position paper of the european society for paediatric gastroenterology, hepatology and nutrition committee on nutrition. J. Pediatr. Gastroenterol. Nutr. 2017, 65, 681–696. [Google Scholar]
- Choquet, H.; Meyre, D. Genomic insights into early-onset obesity. Genome Med. 2010, 2, 36. [Google Scholar] [CrossRef] [Green Version]
- National Heart, Lung, and Blood Institute. DASH Eating Plan. Available online: https://www.nhlbi.nih.gov/health-topics/dash-eating-plan (accessed on 24 May 2020).
- Rosi, A.; Paolella, G.; Biasini, B.; Scazzina, F. Dietary habits of adolescents living in North America, Europe or Oceania: A review on fruit, vegetable and legume consumption, sodium intake, and adherence to the Mediterranean Diet. Nutr. Metab. Cardiovasc. Dis. 2019, 29, 544–560. [Google Scholar] [CrossRef]
- Costa, C.S.; Del-Ponte, B.; Assuncao, M.C.F.; Santos, I.S. Consumption of ultra-processed foods and body fat during childhood and adolescence: A systematic review. Public Health Nutr. 2017, 21, 148–159. [Google Scholar] [CrossRef] [Green Version]
- Poti, J.M.; Braga, B.; Qin, B. Ultra-processed food intake and obesity: What really matters for health-processing or nutrient content? Curr. Obes. Rep. 2017, 6, 420–431. [Google Scholar] [CrossRef]
- Mohammadbeigi, A.; Asgarian, A.; Moshir, E.; Heidari, H.; Afrashteh, S.; Khazaei, S.; Ansari, H. Fast food consumption and overweight/obesity prevalence in students and its association with general and abdominal obesity. J. Prev. Med. Hyg. 2018, 59, E236–E240. [Google Scholar]
- Zarnowiecki, D.M.; Dollman, J.; Parletta, N. Associations between predictors of children’s dietary intake and socioeconomic position: A systematic review of the literature. Obes. Rev. 2014, 15, 375–391. [Google Scholar] [CrossRef]
- Richter, M.; Vereecken, C.A.; Boyce, W.; Maes, L.; Gabhainn, S.N.; Currie, C.E. Parental occupation, family affluence and adolescent health behaviour in 28 countries. Int. J. Public Health 2009, 54, 203–212. [Google Scholar] [CrossRef]
- Herran, O.F.; Patino, G.A.; Gamboa, E.M. Socioeconomic inequalities in the consumption of fruits and vegetables: Colombian National Nutrition Survey, 2010. Cad. Saúde Pública 2019, 35, e00031418. [Google Scholar] [CrossRef]
- Naja, F.; Hamadeh, R. Nutrition amid the COVID-19 pandemic: A multi-level framework for action. Eur. J. Clin. Nutr. 2020. [Google Scholar] [CrossRef] [Green Version]
- Kucera, B.; McIntosh, W.A. Family size as a determinant of children’s dietary intake: A dilution model approach. Ecol. Food Nutr. 1991, 26, 127–138. [Google Scholar] [CrossRef]
Sample Availablity: Samples of the compounds are not available from the authors. |


| Variables | Sample% | Variables | Sample% |
|---|---|---|---|
| Gender (N = 810) | Maternal education (N = 779) | ||
| Boys | 38.89 | None | 1.54 |
| Girls | 61.11 | Primary | 10.14 |
| Age (years) (N = 820) | Secondary | 15.92 | |
| ≤14 | 27.68 | Professional formation | 17.97 |
| 15–16 | 30.98 | Complete university | 54.43 |
| ≥17 | 41.34 | Family members (N = 820) | |
| Country (N = 820) | ≤3 | 25.73 | |
| Spain | 18.54 | 4–6 | 67.80 |
| Brazil | 14.02 | ≥7 | 6.46 |
| Colombia | 19.63 | Viewing TV during mealtimes (N = 820) | |
| Chile | 26.22 | Always | 46.71 |
| Italy | 21.59 | Sometimes | 19.88 |
| Never | 33.41 |
| Variables | Legumes | Fried Food | Vegetables | Sweet Food | Fruits | Sugar-Sweetened Beverages | Processed Meat | Fast Food | ||||||||||||||||
|---|---|---|---|---|---|---|---|---|---|---|---|---|---|---|---|---|---|---|---|---|---|---|---|---|
| Mean | 95% IC | p-Value | Mean | 95% IC | p-Value | Mean | 95% IC | p-Value | Mean | 95% IC | p-Value | Mean | 95% IC | p-Value | Mean | 95% IC | p-Value | Mean | 95% IC | p-Value | Mean | 95% IC | p-Value | |
| Gender (N = 810) | ||||||||||||||||||||||||
| Male | 2.3–2.4 | (2.1–2.6)–(2.2–2.6) | 0.1223 | 1.8–1.9 | (1.6–2.0)–(1.8–2.1) | 0.0803 | 4.3–4.6 | (4.1–4.6)–(4.3–4.8) | 0.0028 ** | 3.1–3.3 | (2.8–3.3)–(3.0–3.6) | 0.0174 * | 3.7–3.9 | (3.5–4.0)–(3.7–4.2) | 0.0556 | 2.3–2.4 | (2.1–2.7)–(2.0–2.6) | 0.193 | 2.9–3.0 | (2.6–3.1)–(2.8–3.3) | 0.0182 * | 0.9–0.6 | (0.8–1.0)–(0.5–0.7) | <0.0001 *** |
| Female | 2.3–2.4 | (2.1–2.5)–(2.3–2.6) | 0.0768 | 1.7–1.9 | (1.6–1.8)–(1.7–2.0) | 0.0224 * | 4.8–5.1 | (4.6–5.0)–(4.9–5.3) | <0.0001 *** | 3.3–3.6 | (3.2–3.5)–(3.4–3.8) | 0.0067 ** | 4.0–4.4 | (3.7–4.2)–(4.1–4.6) | <0.0001 *** | 1.9–1.9 | (1.7–2.1)–(1.7–2.1) | 0.9232 | 2.8–2.8 | (2.6–3.0)–(2.6–2.9) | 0.3263 | 1.0–0.6 | (0.9–1.1)–(0.5–0.6) | <0.0001 *** |
| Age (years) (N = 820) | ||||||||||||||||||||||||
| ≤14 | 2.3–2.3 | (2.0–2.6) – (2.0–2.6) | >0.9999 | 1.3–1.6 | (1.1–1.5)–(1.4–1.8) | 0.0025 ** | 4.9–5.0 | (4.5–5.2)–(4.7–5.3) | 0.0707 | 3.2–3.5 | (2.9–3.3)–(3.1–3.8) | 0.0386 * | 4.1–4.2 | (3.8–4.4)–(3.9–4.5) | 0.4900 | 1.8–2.0 | (1.5–2.1)–(1.7–2.3) | 0.0518 | 2.6–2.8 | (2.4–2.9)–(2.5–3.0) | 0.2457 | 0.8–0.6 | (0.6–0.9)–(0.4–0.7) | 0.0056 ** |
| 15–16 | 2.4–2.5 | (2.1–2.6) – (2.3–2.7) | 0.0954 | 1.9–1.9 | (1.7–2.2)–(1.7–2.2) | 0.9258 | 4.4–4.9 | (4.1–4.7)–(4.6–5.1) | <0.0001 *** | 3.6–3.8 | (3.4–3.9)–(3.5–4.1) | 0.2576 | 4.1–4.3 | (3.8–4.4)–(4.0–4.7) | 0.0139 * | 2.2–2.1 | (1.9–2.5)–(1.8–2.4) | 0.469 | 2.7–2.8 | (2.5–3.0)–(2.5–3.0) | 0.8028 | 1.0–0.5 | (0.9–1.2)–(0.4–0.6) | <0.0001 *** |
| ≥17 | 2.4–2.5 | (2.1–2.6) – (2.3–2.7) | 0.0237 * | 2.0–2.1 | (1.8–2.1)–(1.9–2.3) | 0.0448 * | 4.6–4.8 | (4.3–4.8)–(4.6–5.1) | 0.002 ** | 3.0–3.4 | (2.8–3.2)–(3.2–3.6) | 0.001 ** | 3.6–4.1 | (3.8–3.9)–(3.8–4.4) | <0.0001 *** | 2.1–2.2 | (1.9–2.3)–(1.9–2.4) | 0.5048 | 3.0–3.0 | (2.8–3.2)–(2.8–3.3) | 0.9426 | 1.1–0.6 | (0.9–1.2)–(0.6–0.7) | <0.0001 *** |
| Country (N = 820) | ||||||||||||||||||||||||
| Spain | 2.5–2.5 | (2.3–2.7) – (2.3–2.8) | 0.9375 | 2.2–2.3 | (2.0–2.5)–(2.0–2.5) | 0.7728 | 4.5–4.9 | (4.1–4.8)–(4.6–5.2) | <0.0001 *** | 2.7–3.1 | (2.4–3.0)–(2.8–3.5) | 0.0075 ** | 4.5–5.1 | (4.1–4.9)–(4.7–5.5) | 0.0008 *** | 1.4–1.5 | (1.1–1.6)–(1.2–1.8) | 0.2383 | 2.7–3.0 | (2.4–3.0)–(2.7–3.3) | 0.0534 | 0.8–0.2 | (0.7–1.0)–(0.1–0.3) | <0.0001 *** |
| Italy | 1.6–1.8 | (1.4–1.8) – (1.5–2.0) | 0.0308 * | 1.2–1.4 | (1.0–1.4)–(1.2–1.6) | 0.0375 * | 4.5–4.7 | (4.2–4.9)–(4.4–5.1) | 0.0723 | 3.7–4.2 | (3.4–4.0)–(3.9–4.5) | <0.0001 *** | 4.2–4.5 | (3.9–4.6)–(4.2–4.9) | 0.0172 * | 1.8–1.9 | (1.4–2.0)–(1.6–2.2) | 0.1321 | 3.0–3.0 | (2.7–3.3)–(2.7–3.3) | 0.6935 | 0.7–0.5 | (0.6–0.9)–(0.4–0.6) | 0.0114 * |
| Brazil | 5.1–4.7 | (4.7–5.5) – (4.3–5.1) | 0.0031 ** | 1.6–1.7 | (1.4–1.7)–(1.5–1.9) | 0.1613 | 4.4–4.6 | (4.1–4.6)–(4.3–4.9) | 0.0039 ** | 3.1–4.0 | (2.9–3.4)–(3.7–4.3) | <0.0001 *** | 3.6–3.9 | (3.3–3.9)–(3.6–4.2) | 0.0097 ** | 1.6–2.0 | (1.2–1.9)–(1.5–2.4) | 0.03 * | 3.2–3.3 | (3.0–3.4)–(3.0–3.5) | 0.3427 | 1.4–0.8 | (1.2–1.6)–(0.5–1.0) | <0.0001 *** |
| Colombia | 2.2–2.6 | (2.0–2.5)–(2.3–2.9) | 0.0026 ** | 2.7–2.7 | (2.4–3.0)–(2.4–3.1) | 0.7284 | 3.9–4.0 | (3.6–4.3)–(3.7–4.4) | 0.4793 | 3.4–3.4 | (3.1–3.6)–(3.2–3.7) | 0.7301 | 3.5–3.8 | (3.2–3.7)–(3.5–4.1) | 0.0195 * | 3.0–2.5 | (2.6–3.3)–(2.2–2.8) | 0.0008 *** | 3.0–3.0 | (2.7–3.2)–(2.7–3.1) | 0.4084 | 1.3–0.7 | (1.1–1.4)–(0.5–0.8) | <0.0001 *** |
| Chile | 1.4–1.6 | (1.3–1.5)–(1.4–1.7) | 0.0021 | 1.4–1.8 | (1.2–1.6)–(1.6–2.0) | <0.0001 *** | 4.9–5.2 | (4.6–5.1)–(4.9–5.4) | 0.0019 ** | 3.0–3.3 | (2.7–3.2)–(3.0–3.6) | 0.0381 * | 4.1–4.2 | (3.7–4.4)–(3.9–4.5) | 0.2454 | 2.0–2.3 | (1.7–2.3)–(1.9–2.6) | 0.0598 | 2.6–2.6 | (2.4–2.9)–(2.4–2.9) | 0.5145 | 0.8–0.7 | (0.6–1.0)–(0.5–0.8) | 0.0392 * |
| Maternal education (N = 779) | ||||||||||||||||||||||||
| None | 3.0–3.3 | (1.7–4.9)–(1.5–4.5) | 0.3388 | 1.8–2.2 | (1.2–3.1)–(0.5–3.2) | 0.6326 | 2.9–3.3 | (2.1–4.6)–(1.6–4.3) | 0.2098 | 3.4–4.2 | (2.8–3.9)–(3.6–4.8) | 0.0143 * | 3.3–3.6 | (1.7–4.9)–(2.1–5.1) | 0.6332 | 3.1–3.8 | (2.0–5.6)–(1.2–5.0) | 0.3625 | 2.9–3.3 | (1.6–4.3)–(1.8–4.9) | 0.4699 | 1.6–1.8 | (0.8–2.4)–(0.2–3.3) | 0.7126 |
| Primary | 2.0–2.2 | (1.6–2.4)–(1.8–2.6) | 0.3204 | 2.0–2.0 | (1.7–2.3)–(1.7–2.4) | 0.754 | 4.5–4.9 | (4.1–5.0)–(4.4–5.4) | 0.0883 | 3.2–3.2 | (2.7–3.7)–(2.7–3.7) | 0.8764 | 3.6–3.9 | (3.0–4.1)–(3.4–4.5) | 0.0575 | 1.9–2.0 | (1.5–2.4)–(1.5–2.5) | 0.8761 | 2.8–2.7 | (2.4–3.2)–(2.3–3.1) | 0.6177 | 1.0–0.5 | (0.7–1.2)–(0.3–0.8) | 0.0007 *** |
| Secondary | 2.1–2.2 | (1.–2.4)–(1.8–2.6) | 0.3204 | 1.9–2.1 | (1.6–2.2)–(1.7–2.4) | 0.2244 | 3.8–4.0 | (3.4–4.3)–(3.5–4.4) | 0.2896 | 3.5–3.5 | (3.1–3.9)–(3.0–3.9) | 0.9364 | 2.9–3.1 | (2.5–3.3)–(2.7–3.5) | 0.352 | 2.5–2.6 | (2.1–2.9)–(2.2–3.0) | 0.7131 | 2.9–3.1 | (2.8–3.5)–(2.6–3.4) | 0.226 | 1.0–0.5 | (0.8–1.2)–(0.4–0.7) | <0.0001 *** |
| Professional formation | 2.0–2.3 | (1.7–2.3)–(2.0–2.6) | 0.004** | 1.9–2.3 | (1.7–2.3)–(2.1–2.7) | 0.0025** | 4.8–5.3 | (4.4–5.2)–(5.0–5.7) | 0.0006*** | 3.1–3.5 | (2.7–3.4)–(3.1–3.8) | 0.0321 * | 4.0–4.6 | (3.6–4.4)–(4.2–5.0) | 0.0002 *** | 2.4–2.6 | (2.0–2.8)–(2.2–3.0) | 0.4696 | 2.8–3.1 | (2.5–3.2)–(2.7–3.4) | 0.1009 | 1.0–0.7 | (0.8–1.2)–(0.5–0.8) | 0.0006 *** |
| Complete univesity | 2.5–2.5 | (2.3–2.7)–(2.3–2.7) | 0.7896 | 1.6–1.7 | (1.5–1.8)–(1.5–1.8) | 0.3039 | 4.8–5.2 | (4.6–5.1)–(5.0–5.4) | <0.0001*** | 3.2–3.6 | (3.0–3.4)–(3.4–3.9) | <0.0001 *** | 4.2–4.5 | (4.0–4.5)–(4.3–4.8) | 0.0054 ** | 1.6–1.7 | (1.4–1.8)–(1.5–1.9) | 0.1633 | 2.8–2.8 | (2.6–3.0)–(2.6–3.0) | 0.7943 | 0.9–0.5 | (0.8–1.0)–(0.4–0.6) | <0.0001 *** |
| Family members (N = 820) | ||||||||||||||||||||||||
| ≤3 | 2.3–2.5 | (2.1–2.7)–(2.2–2.8) | 0.0826 | 1.7–1.9 | (1.5–2.0)–(1.7–2.2) | 0.0326 * | 4.6–4.9 | (4.3–4.9)–(4.6–5.2) | 0.0042 ** | 3.3–4.0 | (3.0–3.6)–(3.7–4.3) | <0.0001 *** | 3.7–4.0 | (3.4–4.1)–(3.6–4.3) | 0.0808 | 2.1–2.2 | (1.8–2.4)–(1.9–2.6) | 0.2819 | 2.9–3.0 | (2.6–3.1)–(2.7–3.2) | 0.356 | 1.2–0.7 | (1.0–1.3)–(0.5–0.9) | <0.0001 *** |
| 4–6 | 2.3–2.4 | (2.2–2.5)–(2.3–2.6) | 0.1148 | 1.8–1.9 | (1.6–1.9)–(1.7–2.0) | 0.0354* | 4.6–4.9 | (4.5–4.8)–(4.7–5.1) | <0.0001 *** | 3.3–3.4 | (3.0–3.4)–(3.2–3.6) | 0.0926 | 4.0–4.3 | (3.8–4.2)–(4.0–4.5) | 0.0018 ** | 2.1–2.1 | (1.9–2.2)–(1.9–2.3) | 0.6841 | 2.8–2.8 | (2.6–3.0)–(2.6–3.0) | 0.7992 | 0.9–0.5 | (0.8–1.1)–(0.5–0.6) | <0.0001 *** |
| ≥7 | 2.3–2.4 | (1.8–2.8)–(1.9–3.0) | 0.308 | 2.2–2.2 | (1.7–2.6)–(1.8–2.6) | 0.9168 | 4.1–4.5 | (3.6–4.6)–(4.0–5.0) | 0.0045 ** | 3.0–3.0 | (2.3–3.6)–(2.3–3.7) | 0.9234 | 3.4–4.5 | (2.8–4.0)–(3.9–5.2) | 0.0017 ** | 1.7–1.9 | (1.2–2.2)–(1.4–2.4) | 0.499 | 2.8–2.9 | (2.3–3.3)–(2.4–3.5) | 0.6483 | 0.1–0.3 | (0.6–1.2)–(0.1–0.5) | <0.0001 *** |
| TV during mealtimes (N = 820) | ||||||||||||||||||||||||
| Always | 2.4–2.4 | (2.2–2.6)–(2.3–2.6) | 0.3225 | 2.0–2.3 | (1.9–2.2)–(2.1–2.5) | 0.0003 *** | 4.4–4.6 | (4.2–4.6)–(4.4–4.8) | 0.0208 * | 3.4–3.9 | (3.1–3.6)–(3.6–4.1) | <0.0001 *** | 3.5–3.8 | (3.3–3.8)–(3.5–4.0) | 0.025 * | 2.5–2.5 | (2.2–2.7)–(2.2–2.7) | 0.7866 | 3.0–3.1 | (2.8–3.2)–(2.9–3.3) | 0.2836 | 1.0–0.7 | (0.9–1.1)–(0.6–0.8) | <0.0001 *** |
| Sometimes | 2.0–2.2 | (1.7–2.3)–(2.0–2.4) | 0.067 | 1.6–1.7 | (1.3–1.8)–(1.4–1.9) | 0.2683 | 4.7–5.0 | (4.3–5.0)–(4.6–5.3) | 0.0488 * | 3.3–3.1 | (2.9–3.6)–(2.8–3.5) | 0.3887 | 3.8–4.3 | (3.8–4.6)–(4.1–4.8) | 0.0631 | 2.0–2.0 | (1.6–2.3)–(1.7–2.4) | 0.43 | 2.7–2.8 | (2.4–3.0)–(2.5–3.1) | 0.3175 | 1.0–0.6 | (0.8–1.2)–(0.4–0.8) | 0.0004 *** |
| Never | 2.4–2.5 | (2.2–2.7)–(2.3–2.8) | 0.1096 | 1.5–1.5 | (1.4–1.7)–(1.3–1.7) | 0.5086 | 4.8–5.2 | (4.5–5.0)–(5.0–5.5) | <0.0001 *** | 3.1–3.3 | (2.8–3.3)–(3.0–3.6) | 0.0459 * | 4.2–4.6 | (3.9–4.5)–(4.3–4.9) | 0.0005 *** | 1.5–1.6 | (1.2–1.7)–(1.3–1.9) | 0.3032 | 2.6–2.6 | (2.4–2.9)–(2.3–3.8) | 0.4801 | 0.9–0.4 | (0.7–1.1)–(0.3–0.5) | <0.0001 *** |
| Variables | Legumes | Fried Food | Vegetables | Sweet Food | Fruits | Sugar-Sweetened Beverages | Processed Meat | Fast Food | ||||||||||||||||
|---|---|---|---|---|---|---|---|---|---|---|---|---|---|---|---|---|---|---|---|---|---|---|---|---|
| % | 95% IC | p-Value | % | 95% IC | p-Value | % | 95% IC | p-Value | % | 95% IC | p-Value | % | 95% IC | p-Value | % | 95% IC | p-Value | % | 95% IC | p-Value | % | 95% IC | p-Value | |
| Gender (N = 810) | 0.241 | 0.4004 | 0.0109* | 0.0277 * | 0.4586 | <0.0001 *** | 0.4586 * | 0.2628 | ||||||||||||||||
| Boys | 21.3 | 18.5–24.0 | 48.9 | 45.5–52.3 | 37.8 | 34.5–41.1 | 29.5 | 26.4–32.0 | 31.4 | 28.3–34.6 | 42.9 | 39.5–46.2 | 25.1 | 22.4–28.6 | 86.0 | 83.7–88.4 | ||||||||
| Girls | 24.8 | 21.9–27.8 | 51.9 | 48.5–55.3 | 46.9 | 43.5–50.3 | 22.6 | 19.8–25.5 | 33.9 | 30.8–37.1 | 57.2 | 53.8–60.6 | 32.3 | 29.1–36.0 | 88.7 | 86.5–90.9 | ||||||||
| Age (years) (N = 820) | 0.0063 ** | 0.0006 *** | 0.0585 | 0.3118 | 0.3931 | 0.4846 | 0.523 | 0.013 * | ||||||||||||||||
| ≤14 | 15.86 | 1.3.4–18.3 | 58.59 | 55.2–62.2 | 49.78 | 46.4–53.2 | 27.31 | 24.3–30.4 | 29.96 | 36.8–33.1 | 54.63 | 51.2–58.0 | 28.19 | 25.1–31.0 | 88.55 | 86.4–91.7 | ||||||||
| 15–16 | 25.59 | 22.6–28.6 | 53.15 | 49.7–56.7 | 41.34 | 38.0–44.7 | 21.65 | 18.8–24.5 | 35.83 | 32.5–39.1 | 49.21 | 45.8–52.6 | 31.89 | 28.7–35.0 | 90.94 | 89.0–92.9 | ||||||||
| ≥17 | 26.84 | 23.8–29.9 | 42.77 | 39.4–46.1 | 40.12 | 36.8–43.5 | 25.96 | 23.0–29.0 | 33.04 | 29.8–36.2 | 51.03 | 47.6–54.4 | 28.61 | 25.5–32.0 | 84.37 | 81.9–86.9 | ||||||||
| Country (N = 820) | <0.0001 *** | <0.0001 *** | <0.0001 *** | 0.0006 ** | <0.0001 *** | 0.0002 ** | 0.0219 * | 0.0012 * | ||||||||||||||||
| Spain | 34.87 | 31.6–38.1 | 42.11 | 38.7–45.5 | 33.55 | 30.1–36.8 | 38.82 | 35.5–42.2 | 49.34 | 45.9–52.8 | 64.47 | 61.2–67.8 | 25.66 | 22.7–29.0 | 98.03 | 97.1–99.0 | ||||||||
| Brazil | 24.35 | 21.4–27.3 | 63.48 | 60.2–67.8 | 35.65 | 32.4–38.9 | 13.04 | 10.7–15.3 | 23.48 | 20.6–26.4 | 53.04 | 49.6–56.5 | 20.00 | 17.3–23.0 | 81.74 | 79.1–84.4 | ||||||||
| Colombia | 30.43 | 27.3–33.6 | 34.78 | 31.5–38.0 | 29.81 | 26.7–32.9 | 31.06 | 27.9–34.2 | 22.98 | 20.1–25.9 | 36.02 | 32.7–39.3 | 37.27 | 34.0–41.6 | 81.99 | 79.4–846.6 | ||||||||
| Chile | 10.70 | 8.6–12.8 | 52.09 | 48.7–55.5 | 55.814 | 52.4–59.2 | 26.51 | 23.5–29.5 | 28.37 | 25.3–31.5 | 51.16 | 47.7–54.6 | 33.49 | 30.3–37.6 | 85.58 | 83.2–88.0 | ||||||||
| Italy | 22.03 | 19.2–24.9 | 61.02 | 57.7–64.4 | 53.11 | 49.7–56.5 | 13.56 | 11.2–15.9 | 40.11 | 36.8–42.5 | 53.67 | 50.3–57.1 | 27.12 | 24.1–30.2 | 89.83 | 87.8–91.9 | ||||||||
| Maternal education (N = 779) | 0.6915 | 0.0103* | <0.0001 *** | 0.9074 | 0.0015 ** | 0.0007 *** | 0.8702 | 0.0427 * | ||||||||||||||||
| None | 25.00 | 22.0–28.0 | 66.67 | 63.4–70.0 | 8.33 | 6.4–10.3 | 25.00 | 22.0–28.0 | 16.67 | 14.0–19.3 | 41.67 | 38.2–45.1 | 25.00 | 22.0–28.0 | 66.67 | 63.4–70.0 | ||||||||
| Primary | 25.32 | 22.3–28.4 | 45.57 | 42.1–49.1 | 40.51 | 37.1–44.0 | 27.85 | 24.7–31.0 | 26.58 | 23.5–29.7 | 51.90 | 48.4–55.4 | 29.11 | 25.9–32.3 | 92.41 | 90.5–94.3 | ||||||||
| Secondary | 18.548 | 15.8–21.3 | 54.03 | 50.5–57.5 | 33.06 | 29.8–36.4 | 26.61 | 23.5–29.7 | 20.97 | 18.1–23.8 | 38.71 | 35.3–42.1 | 30.65 | 27.4–33.9 | 89.52 | 87.4–91.7 | ||||||||
| Professional formation | 25.71 | 22.6–28.8 | 39.29 | 35.9–42.7 | 47.86 | 44.3–51.4 | 22.86 | 19.9–25.8 | 35.00 | 31.7–38.3 | 45.00 | 41.5–48.5 | 25.71 | 22.6–28.8 | 83.57 | 81.0–86.2 | ||||||||
| Complete university | 22.88 | 19.9–25.8 | 55.19 | 51.7–58.7 | 47.64 | 44.1–51.1 | 24.06 | 21.1–27.1 | 38.92 | 35.5–42.3 | 58.49 | 55.0–62.0 | 30.19 | 27.0–33.4 | 88.92 | 86.7–91.1 | ||||||||
| Family members (N = 820) | 0.7388 | 0.164 | 0.0003 *** | <0.0001 *** | 0.6579 | 0.859 | 0.3438 | 0.0163 * | ||||||||||||||||
| ≤3 | 5.61 | 4.1–7.5 | 13.17 | 10.9–15.5 | 10.37 | 8.3–12.5 | 3.41 | 2.2–4.7 | 8.05 | 6.2–9.9 | 12.93 | 10.6–15.2 | 6.71 | 5.0–8.4 | 21.34 | 18.5–24.1 | ||||||||
| 4–6 | 16.10 | 13.6–19.0 | 34.76 | 31.5–38.0 | 30.61 | 27.5–33.8 | 19.02 | 16.3–21.7 | 22.56 | 19.7–25.4 | 35.24 | 32.0–38.5 | 21.10 | 18.3–23.9 | 21.10 | 56.6–63.4 | ||||||||
| ≥7 | 1.71 | 0.9–2.9 | 2.44 | 1.4–3.5 | 2.20 | 1.2–3.2 | 2.56 | 1.5–3.6 | 2.44 | 1.4–3.5 | 3.29 | 2.1–4.5 | 1.71 | 0.8–2.6 | 6.22 | 4.6–7.9 | ||||||||
| Viewing TV during mealtimes (N = 820) | 0.4672 | <0.0001 *** | 0.0003 *** | 0.1811 | 0.0001 *** | <0.0001 *** | 0.2881 | 0.4256 | ||||||||||||||||
| Always | 25.07 | 22.1–28.0 | 41.51 | 38.1–44.9 | 36.29 | 33.0–39.6 | 22.19 | 19.3–25.0 | 25.85 | 22.9–28.8 | 43.86 | 40.5–47.3 | 27.15 | 24.1–30.2 | 84.07 | 81.6–86.6 | ||||||||
| Sometimes | 20.25 | 17.5–23.0 | 57.06 | 53.7–60.4 | 44.79 | 41.4–48.2 | 25.77 | 22.8–28.8 | 36.20 | 32.9–39.5 | 53.37 | 50.0–56.8 | 29.45 | 26.3–32.6 | 29.45 | 86.1–90.5 | ||||||||
| Never | 22.99 | 21.0–25.9 | 58.76 | 55.4–62.1 | 51.82 | 48.4–55.2 | 28.47 | 25.4–31.6 | 41.24 | 37.9–44.6 | 60.95 | 57.6–64.3 | 32.85 | 29.6–36.1 | 91.97 | 90.1–93.8 | ||||||||
| Legumes | Fried food | Vegetables | Sweet Food | Fruits | Sugar-Sweetened Beverages | Processed Meat | Fast Food | |||||||||
|---|---|---|---|---|---|---|---|---|---|---|---|---|---|---|---|---|
| p Value | p Value | p Value | p Value | p Value | p Value | p Value | p Value | |||||||||
| Spain vs. Italy | 0.0065 | ** | 0.001 | *** | 0.6246 | ns | <0.0001 | *** | 0.0621 | ns | 0.4204 | ns | >0.9999 | ns | 0.745 | ns |
| Spain vs. Brazil | <0.0001 | *** | 0.0048 | ** | 0.0882 | ns | <0.0001 | *** | <0.0001 | *** | 0.3736 | ns | 0.0513 | ns | 0.177 | ns |
| Spain vs. Colombia | 0.999 | ns | 0.2521 | ns | 0.0015 | ** | 0.7525 | ns | <0.0001 | *** | <0.0001 | *** | 0.6983 | ns | 0.2613 | ns |
| Spain vs. Chile | <0.0001 | *** | 0.1303 | ns | 0.0073 | ** | 0.2396 | ns | 0.0004 | *** | 0.0023 | ** | 0.0734 | ns | 0.2284 | ns |
| Italy vs. Brazil | <0.0001 | *** | >0.9999 | ns | 0.001 | *** | 0.7779 | ns | 0.0007 | *** | 0.9989 | ns | 0.0513 | ns | 0.7745 | ns |
| Italy vs. Colombia | 0.002 | ** | <0.0001 | *** | <0.0001 | *** | <0.0001 | *** | <0.0001 | *** | 0.0004 | *** | 0.606 | ns | 0.9124 | ns |
| Italy vs. Chile | 0.8563 | ns | 0.3835 | ns | 0.283 | ns | <0.0001 | *** | 0.6211 | ns | 0.2878 | ns | 0.0409 | * | 0.9137 | ns |
| Brazil vs. Colombia | <0.0001 | *** | <0.0001 | *** | 0.8752 | ns | <0.0001 | *** | 0.9641 | ns | 0.0062 | ** | 0.0008 | *** | 0.9959 | ns |
| Brazil vs. Chile | <0.0001 | *** | 0.5245 | ns | <0.0001 | *** | <0.0001 | *** | 0.0347 | * | 0.6008 | ns | <0.0001 | *** | 0.9914 | ns |
| Colombia vs. Chile | <0.0001 | *** | <0.0001 | *** | <0.0001 | *** | 0.9335 | ns | 0.0008 | *** | 0.121 | ns | 0.7343 | ns | >0.9999 | ns |
© 2020 by the authors. Licensee MDPI, Basel, Switzerland. This article is an open access article distributed under the terms and conditions of the Creative Commons Attribution (CC BY) license (http://creativecommons.org/licenses/by/4.0/).
Share and Cite
Ruiz-Roso, M.B.; de Carvalho Padilha, P.; Mantilla-Escalante, D.C.; Ulloa, N.; Brun, P.; Acevedo-Correa, D.; Arantes Ferreira Peres, W.; Martorell, M.; Aires, M.T.; de Oliveira Cardoso, L.; et al. Covid-19 Confinement and Changes of Adolescent’s Dietary Trends in Italy, Spain, Chile, Colombia and Brazil. Nutrients 2020, 12, 1807. https://0-doi-org.brum.beds.ac.uk/10.3390/nu12061807
Ruiz-Roso MB, de Carvalho Padilha P, Mantilla-Escalante DC, Ulloa N, Brun P, Acevedo-Correa D, Arantes Ferreira Peres W, Martorell M, Aires MT, de Oliveira Cardoso L, et al. Covid-19 Confinement and Changes of Adolescent’s Dietary Trends in Italy, Spain, Chile, Colombia and Brazil. Nutrients. 2020; 12(6):1807. https://0-doi-org.brum.beds.ac.uk/10.3390/nu12061807
Chicago/Turabian StyleRuiz-Roso, María Belén, Patricia de Carvalho Padilha, Diana C. Mantilla-Escalante, Natalia Ulloa, Paola Brun, Diofanor Acevedo-Correa, Wilza Arantes Ferreira Peres, Miquel Martorell, Mariana Tschoepke Aires, Letícia de Oliveira Cardoso, and et al. 2020. "Covid-19 Confinement and Changes of Adolescent’s Dietary Trends in Italy, Spain, Chile, Colombia and Brazil" Nutrients 12, no. 6: 1807. https://0-doi-org.brum.beds.ac.uk/10.3390/nu12061807