Assessing Eating Disorder Risk: The Pivotal Role of Achievement Anxiety, Depression and Female Gender in Non-Clinical Samples


Abstract
:
1. Introduction
2. Methodology
2.1. Participants

| Variable | Frequency | % |
|---|---|---|
| Age | ||
| 16 ≤ age < 18 | 265 | 14.2 |
| 18 ≤ age < 22 | 1007 | 54.0 |
| 22 ≤ age < 26 | 389 | 20.9 |
| 26 ≤ age | 110 | 10.7 |
| NA | 4 | 0.2 |
| Family status | ||
| Do your parents live together? | ||
| Yes | 1469 | 78.8 |
| No | 360 | 19.3 |
| NA | 36 | 1.9 |
| Are your parents divorced? | ||
| Yes | 343 | 18.4 |
| No | 1270 | 68.1 |
| NA | 252 | 13.5 |
| Whom do you live with? | ||
| My parents | 1114 | 59.7 |
| Alone, because I work and I am financially independent. | 231 | 12.4 |
| Alone, because I study in a different town from my parents. | 407 | 21.8 |
| Alone, because I study and I want to be independent of control. | 108 | 5.8 |
| NA | 5 | 0.3 |
| Personal family status | ||
| Single | 1325 | 71.0 |
| Married | 79 | 4.2 |
| Divorced | 24 | 1.3 |
| Permanent relation, but unmarried | 227 | 12.2 |
| Engaged | 48 | 2.6 |
| Seeking romantic relationship | 153 | 8.2 |
| NA | 9 | 0.5 |
| Academic status | ||
| Current educational institutional level | ||
| Post-secondary vocational institute/college (private-public) | 304 | 16.3 |
| Higher educational institution-TEI | 793 | 42.5 |
| Higher educational institution-AEI | 509 | 27.3 |
| Postgraduate studies | 106 | 5.7 |
| NA | 153 | 8.2 |
| Highest educational degree attained till today | ||
| GCSE/A-levels | 1477 | 79.2 |
| Graduation certificate from post-secondaryvocational institute/college (private-public) | 56 | 3.0 |
| Bachelors | 212 | 11.4 |
| Postgraduate degree | 46 | 2.5 |
| ΝΑ | 74 | 4.0 |
| If you are a freshman, what was your mark average during your last year of high-school | ||
| or during A-levels? (Marks range from 0 = fail to 20 = distinction) | ||
| mark ≤ 10 | 56 | 3.0 |
| 10.1 ≤ mark ≤ 14 | 380 | 20.4 |
| 14.1 ≤ mark ≤ 18 | 688 | 36.9 |
| 18.1 ≤ mark ≤ 20 | 114 | 6.1 |
| ΝΑ | 627 | 33.6 |
| Mark average during previous term | ||
| Fail | 83 | 4.5 |
| Pass | 364 | 19.5 |
| Merit | 544 | 29.2 |
| Distinction | 170 | 9.1 |
| ΝΑ | 704 | 37.7 |
| Employment status | ||
| Do you work? | ||
| Yes | 856 | 45.9 |
| No | 954 | 51.2 |
| NA | 55 | 2.9 |
| If yes, are you full-time or part-time? | ||
| Full time | 385 | 20.6 |
| Part time | 529 | 28.4 |
| NA | 951 | 51.0 |
2.2. Measures
2.3. Statistical Analysis
3. Results
3.1. Eating Disorders Risk
| Variables | Eating disorder risk (SCOFF ≥ 2) | Test result | |
|---|---|---|---|
| No | Yes | ||
| Categorical variables | n (%) | n (%) | Chi-square tests |
| Demographic characteristics | |||
| Gender | |||
| Male | 561 (50.0%) | 288 (38.9%) | χ2 = 22.134, df = 1, p < 0.0001 or = 1.57 (95% CI 1.30–1.90) |
| Female | 562 (50.0%) | 453 (61.1%) | |
| Age | |||
| 16 ≤ age < 18 | 143 (12.8%) | 122 (16.5%) | χ2 = 9.185, df = 6, p = 0.163 |
| 18 ≤ age < 22 | 631 (56.3%) | 376 (50.9%) | |
| 22 ≤ age < 26 | 230 (20.5%) | 158 (21.4%) | |
| 26 ≤ age | 117 (10.4%) | 8343 (11.2%) | |
| Family factors | |||
| Do your parents live together? | |||
| No | 204 (18.5%) | 156 (21.5%) | χ2 = 2.376, df = 1, p = 0.123, OR = 0.83 (95% CI 0.66–1.05) |
| Yes | 897 (81.5%) | 571 (78.5%) | |
| Are your parents divorced? | |||
| No | 767 (80.1%) | 502 (76.6%) | χ2 = 2.852, df = 1, p = 0.09, OR = 1.23 (95% CI 0.97–1.57) |
| Yes | 190 (19.9%) | 153 (23.4%) | |
| Whom do you live with? | |||
| My parents | 694 (61.9%) | 419 (56.7%) | χ2 = 11.262, df = 3, p = 0.0104 |
| Alone, because I work and I am financially independent | 135 (12.0%) | 96 (13.0%) | |
| Alone, because I study in a different town from my parents | 242 (21.6%) | 165 (22.4%) | |
| Alone, because I study and I want to be independent of control | 50 (4.5%) | 58 (7.9%) | |
| Personal Family Status | |||
| Single | 828 (74.1%) | 496 (67.2%) | χ2 = 30.728, df = 5, p < 0.0001 |
| Married | 28 (2.5%) | 51 (6.9%) | |
| Divorced | 17 (1.5%) | 7 (0.9%) | |
| Permanent relation, but unmarried | 140 (12.5%) | 87 (11.8%) | |
| Engaged | 26 (2.4%) | 22 (3.0%) | |
| Seeking romantic relationship | 78 (7.0%) | 75 (10.2%) | |
| Academic factors | |||
| Current educational institutional level | |||
| Post secondary vocational institute/college (private-public) | 157 (15.2%) | 147 (21.6%) | χ2 = 14.541, df = 3, p = 0.002 |
| Higher education institution-TEI | 508 (49.3%) | 285 (41.9%) | |
| Higher education institution-AEI | 305 (29.6%) | 203 (29.9%) | |
| Postgraduate studies | 61 (5.9%) | 45 (6.6%) | |
| Highest educational degree attained till today | |||
| GCSE/A-levels | 902 (83.6%) | 574 (80.5%) | χ2 = 3.432, df = 3, p = 0.330 |
| Graduation certificate from post secondary vocational institute/college (Private-Public) | 32 (3.0%) | 24 (3.3%) | |
| Bachelors | 116 (10.8%) | 96 (13.5%) | |
| Postgraduate degree | 27 (2.6%) | 19 (2.7%) | |
| If you are a freshman, what was your average mark during your last year at high-school or during A-levels? | |||
| mark ≤ 10 | 35 (4.8%) | 21 (4.0%) | χ2 = 4.388, df = 5, p = 0.495 |
| 10.1 ≤ mark ≤ 14 | 217 (30.0%) | 163 (31.6%) | |
| 14.1 ≤ mark ≤ 18 | 412 (57.1%) | 276 (53.5%) | |
| 18.1 ≤ mark ≤ 20 | 58 (8.1%) | 56 (10.9%) | |
| Average mark during previous term | |||
| Fail | 40 (6.0%) | 43 (8.8%) | χ2 = 6.553, df = 3, p = 0.088 |
| Pass | 199 (29.8%) | 165 (33.5%) | |
| Merit | 330 (49.4%) | 213 (43.3%) | |
| Distinction | 99 (14.8%) | 71 (14.4%) | |
| Employment status | |||
| Do you work? | |||
| No | 557 (51.5%) | 397 (54.6%) | χ2 = 1.708, df = 1, p = 0.191, OR = 0.88 (95% CI 0.73–1.07) |
| Yes | 525 (48.5%) | 330 (45.4%) | |
| If yes, are you full time or part time? | |||
| Full-time | 228 (41.6%) | 157 (43.0%) | χ2 = 0.178, df = 1, p = 0.673, OR = 0.94 (95% CI 0.72–1.23) |
| Part-time | 320 (58.4%) | 208 (57.0%) | |
| Continuous variables | Mean ± SE | Mean ± SE | t-Tests |
| Depression | −0.275 ± 0.026 | 0.404 ± 0.040 | t = 14.868, df = 1796, p < 0.0001, Mean difference (Yes–No) = 0.679 |
| Anxiety | −0.176 ± 0.031 | 0.265 ± 0.035 | t = 9.336, df = 1796, p < 0.0001, Mean difference (Yes–No) = 0.441 |
| Stress | −0.211 ± 0.028 | 0.313 ± 0.039 | t = 11.250, df = 1796, p < 0.0001, Mean difference (Yes–No) = 0.524 |
| Debilitating achievement anxiety | 32.22 ± 0.20 | 30.29 ± 0.21 | t = −6.509, df = 1860, p < 0.0001, Mean difference (Yes–No) = −1.93 |
| Facilitating achievement anxiety | 27.55 ± 0.15 | 27.12 ± 0.19 | t = −1.750, df = 1861, p = 0.08, Mean difference (Yes–No) = −0.43 |
3.2. Stepwise Logistic Regression
| Odds Ratio | Odds ratio 95% CI | p-Value | |
|---|---|---|---|
| Depression | 1.82 | 1.60–2.08 | <0.0001 |
| Stress | 1.18 | 1.03–1.34 | 0.014 |
| Gender | |||
| Female | 1.60 | 1.30–1.96 | <0.0001 |
| Male [Reference group] | |||
| Personal Family Status | |||
| Married | 2.53 | 1.51–4.25 | <0.0001 |
| Divorced | 0.29 | 0.09–0.92 | 0.036 |
| Permanent relation, but unmarried | 1.03 | 0.75–1.41 | 0.874 |
| Engaged | 1.44 | 0.77–2.71 | 0.253 |
| Seeking romantic relationship | 1.64 | 1.14–2.35 | 0.008 |
| Single [Reference group] | |||
| Constant | 0.45 | <0.0001 |

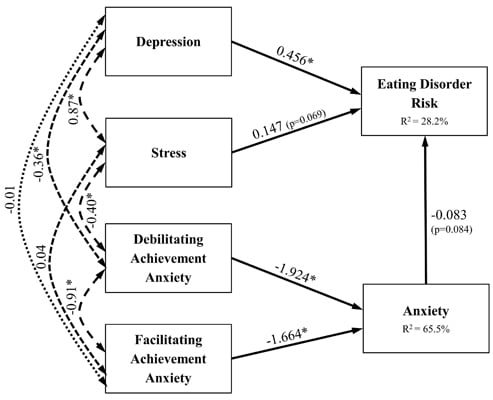
3.3. Suggested Psychological Model

| Dependent variable | Pathprecursor | Unstandardised estimate | Standardised estimate | p-Value | R2 |
|---|---|---|---|---|---|
| Eating Disorder Risk (SCOFF ≥ 2) | Depression | 0.212 | 0.456 | <0.001 | 0.282 |
| Stress | 0.072 | 0.147 | 0.069 | ||
| Anxiety | −0.046 | −0.083 | 0.084 | ||
| Debilitating Achievement Anxiety | 0.087 | 0.160 | |||
| Facilitating Achievement Anxiety | 0.131 | 0.138 | |||
| Anxiety | Debilitating Achievement Anxiety | −1.877 | −1.924 | <0.001 | 0.655 |
| Facilitating Achievement Anxiety | −2.828 | −1.664 | <0.001 |
4. Discussion
5. Conclusions
Conflict of Interest
Appendix: Exploratory Factor Analysis of DASS
| Factor | Item | Pattern Coefficients | Structure Coefficients | Communalities | |||||
|---|---|---|---|---|---|---|---|---|---|
| Components | Components | ||||||||
| 1 | 2 | 3 | 1 | 2 | 3 | ||||
| Depression | 38 | I felt that life was meaningless | 0.802 | −0.145 | 0.078 | 0.782 | 0.273 | 0.503 | 0.627 |
| 17 | I felt I wasn’t worth much as a person | 0.792 | 0.00002 | −0.024 | 0.778 | 0.362 | 0.469 | 0.605 | |
| 34 | I felt I was pretty worthless | 0.754 | −0.060 | 0.087 | 0.78 | 0.340 | 0.525 | 0.613 | |
| 21 | I felt that life wasn’t worthwhile | 0.745 | −0.102 | 0.108 | 0.764 | 0.304 | 0.519 | 0.594 | |
| 37 | I could see nothing in the future to be hopeful about | 0.743 | −0.015 | 0.002 | 0.738 | 0.337 | 0.457 | 0.544 | |
| 10 | I felt that I had nothing to look forward to. | 0.726 | 0.018 | −0.018 | 0.723 | 0.351 | 0.442 | 0.523 | |
| 16 | I felt that I had lost interest in just about everything | 0.690 | 0.030 | 0.029 | 0.722 | 0.370 | 0.473 | 0.523 | |
| 26 | I felt downhearted and blue | 0.655 | −0.033 | 0.135 | 0.723 | 0.344 | 0.526 | 0.533 | |
| 31 | I was unable to become enthusiastic about anything | 0.637 | 0.168 | −0.049 | 0.686 | 0.443 | 0.432 | 0.49 | |
| 30 | I feared that I would be “thrown” by some trivial, but unfamiliar task | 0.546 | 0.138 | 0.074 | 0.657 | 0.433 | 0.484 | 0.455 | |
| 24 | I couldn’t seem to get any enjoyment out of the things I did | 0.504 | 0.212 | 0.098 | 0.665 | 0.499 | 0.519 | 0.491 | |
| 42 | I found it difficult to work up the initiative to do things | 0.467 | 0.114 | 0.149 | 0.614 | 0.410 | 0.498 | 0.408 | |
| 11 | I found myself getting upset rather easily | 0.461 | 0.389 | −0.106 | 0.578 | 0.553 | 0.378 | 0.442 | |
| 5 | I just couldn’t seem to get going | 0.423 | 0.057 | 0.256 | 0.609 | 0.386 | 0.548 | 0.420 | |
| 36 | I felt terrified | 0.421 | 0.100 | 0.262 | 0.631 | 0.431 | 0.574 | 0.459 | |
| 18 | I felt that I was rather touchy | 0.398 | 0.294 | 0.024 | 0.552 | 0.494 | 0.420 | 0.375 | |
| 40 | I was worried about situations in, which I might panic and make a fool of myself | 0.373 | 0.220 | 0.187 | 0.593 | 0.491 | 0.531 | 0.429 | |
| 35 | I was intolerant of anything that kept me from getting on with what I was doing | 0.316 | 0.238 | 0.157 | 0.527 | 0.467 | 0.475 | 0.353 | |
| 39 | I found myself getting agitated | 0.310 | 0.229 | 0.299 | 0.604 | 0.526 | 0.607 | 0.489 | |
| Anxiety | 29 | I found it hard to calm down after something upset me | 0.012 | 0.721 | −0.013 | 0.344 | 0.720 | 0.359 | 0.519 |
| 22 | I found it hard to wind down | 0.051 | 0.680 | −0.010 | 0.365 | 0.699 | 0.365 | 0.490 | |
| 33 | I was in a state of nervous tension | −0.016 | 0.636 | 0.153 | 0.379 | 0.706 | 0.465 | 0.514 | |
| 8 | I found it difficult to relax | −0.124 | 0.635 | 0.198 | 0.299 | 0.677 | 0.443 | 0.480 | |
| 6 | I tended to overreact to situations | 0.084 | 0.630 | −0.047 | 0.352 | 0.646 | 0.324 | 0.421 | |
| 12 | I felt that I was using a lot of nervous energy | 0.034 | 0.627 | 0.028 | 0.347 | 0.657 | 0.366 | 0.434 | |
| 14 | I found myself getting impatient when I was delayed in any way (e.g., elevators, traffic lights, being kept waiting) | −0.154 | 0.598 | 0.129 | 0.208 | 0.591 | 0.335 | 0.364 | |
| 9 | I found myself in situations that made me so anxious, I was most relieved when they ended | −0.062 | 0.578 | 0.070 | 0.254 | 0.584 | 0.324 | 0.344 | |
| 1 | I found myself getting upset by quite trivial things | 0.027 | 0.563 | −0.036 | 0.270 | 0.557 | 0.266 | 0.311 | |
| 27 | I found that I was very irritable | 0.234 | 0.474 | −0.013 | 0.450 | 0.578 | 0.372 | 0.375 | |
| 13 | I felt sad and depressed | 0.307 | 0.460 | 0.018 | 0.535 | 0.614 | 0.442 | 0.455 | |
| 32 | I found it difficult to tolerate interruptions to what I was doing | 0.257 | 0.438 | −0.016 | 0.453 | 0.551 | 0.365 | 0.352 | |
| Stress | 41 | I experienced trembling (e.g., in the hands) | 0.041 | 0.003 | 0.739 | 0.502 | 0.396 | 0.766 | 0.588 |
| 7 | I had a feeling of shakiness (e.g. legs going to give away) | −0.001 | 0.018 | 0.711 | 0.450 | 0.378 | 0.719 | 0.518 | |
| 25 | I was aware of the action of my heart in the absence of physical exertion (e.g., sense of heart rate increase, heart missing a beat) | 0.028 | 0.081 | 0.668 | 0.482 | 0.433 | 0.727 | 0.534 | |
| 4 | I experienced breathing difficulty (e.g., excessively rapid breathing, breathlessness in the absence of physical exertion) | 0.037 | 0.041 | 0.660 | 0.467 | 0.392 | 0.704 | 0.498 | |
| 19 | I perspired noticeably (e.g., hands sweaty) in the absence of high temperatures or physical exertion | −0.101 | 0.117 | 0.586 | 0.319 | 0.366 | 0.583 | 0.352 | |
| 2 | I was aware of dryness of my mouth | 0.097 | 0.052 | 0.577 | 0.481 | 0.390 | 0.664 | 0.450 | |
| 23 | I had difficulty in swallowing | 0.303 | −0.126 | 0.528 | 0.572 | 0.285 | 0.653 | 0.483 | |
| 15 | I had feeling of faintness | 0.336 | −0.133 | 0.490 | 0.578 | 0.274 | 0.632 | 0.468 | |
| 20 | I felt scared without any good reason | 0.208 | 0.199 | 0.393 | 0.546 | 0.496 | 0.624 | 0.458 | |
| (dropped) | 3 | I couldn’t seem to experience any positive feeling at all | 0.297 | 0.150 | 0.297 | 0.553 | 0.440 | 0.558 | 0.396 |
| (dropped) | 28 | I felt I was close to panic | 0.261 | 0.230 | 0.294 | 0.553 | 0.502 | 0.573 | 0.428 |
References and Notes
- Eisenberg, D.; Nicklett, E.J.; Roeder, K.; Kirz, N.E. Eating disorder symptoms among college students: Prevalence, persistence, correlates, and treatment-seeking. J. Am. Coll. Health 2011, 59, 700–707. [Google Scholar] [CrossRef]
- Fairburn, C.G. Eating Disorders. In Encyclopedia of Life Sciences; John Wiley & Sons, Ltd.: Chichester, UK, 2001. [Google Scholar]
- Memon, A.; Adil, S.; Siddiqui, E.; Naeem, S.; Ali, S.; Mehmood, K. Eating disorders in medical students of Karachi, Pakistan—A cross-sectional study. BMC Res. Notes 2012, 5, 84. [Google Scholar] [CrossRef]
- LaCaille, L.J.; Dauner, K.N.; Krambeer, R.J.; Pedersen, J. Psychosocial and environmental determinants of eating behaviors, physical activity, and weight change among college students: A qualitative analysis. J. Am. Coll. Health 2011, 59, 531–538. [Google Scholar] [CrossRef]
- Piran, N.; Robinson, S.R. Associations between disordered eating behaviors and licit and illicit substance use and abuse in a university sample. Addict. Behav. 2006, 31, 1761–1775. [Google Scholar] [CrossRef]
- Reyes-Rodríguez, M.L.; Sala, M.; von Holle, A.; Unikel, C.; Bulik, C.M.; Cámara-Fuentes, L.; Suárez-Torres, A. A description of disordered eating behaviors in Latino males. J. Am. Coll. Health 2011, 59, 266–272. [Google Scholar] [CrossRef]
- Fairburn, C.G.; Cooper, Z.; Shafran, R. Cognitive behaviour therapy for eating disorders: A “transdiagnostic” theory and treatment. Behav. Res. Ther. 2003, 41, 509–528. [Google Scholar] [CrossRef]
- Kostopoulou, M.; Varsou, E.; Stalikas, A. Thought-Shape Fusion in bulimia nervosa: An experimental investigation. Eat. Weight Disord. 2011, 16, e86–e92. [Google Scholar]
- Jacobi, C.; Hayward, C.; de Zwaan, M.; Kraemer, H.C.; Agras, W.S. Coming to terms with risk factors for eating disorders: Application of risk terminology and suggestions for a general taxonomy. Psychol. Bull. 2004, 130, 19–65. [Google Scholar] [CrossRef]
- Heatherton, T.F.; Nichols, P.; Mahamedi, F.; Keel, P. Body weight, dieting, and eating disorder symptoms among college students, 1982 to 1992. Am. J. Psychiatry 1995, 152, 1623–1629. [Google Scholar]
- Delinsky, S.S.; Wilson, G.T. Weight gain, dietary restraint, and disordered eating in the freshman year of college. Eat. Behav. 2008, 9, 82–90. [Google Scholar] [CrossRef]
- Striegel-Moore, R.H.; Silberstein, L.R.; Rodin, J. Toward an understanding of risk factors for bulimia. Am. Psychol. 1986, 41, 246–263. [Google Scholar] [CrossRef]
- Vohs, K.D.; Heatherton, T.F.; Herrin, M. Disordered eating and the transition to college: A prospective study. Int. J. Eat. Disord. 2001, 29, 280–288. [Google Scholar] [CrossRef]
- Misra, R.; Castillo, L.G. Academic stress among college students: Comparison of American and international students. Int. J. Stress Manag. 2004, 11, 132–148. [Google Scholar] [CrossRef]
- Franko, D.L.; Jenkins, A.; Roehrig, J.P.; Luce, K.H.; Crowther, J.H.; Rodgers, R.F. Psychometric properties of measures of eating disorder risk in latina college women. Int. J. Eat. Disord. 2012, 45, 592–596. [Google Scholar] [CrossRef]
- Hoerr, S.L.; Bokram, R.; Lugo, B.; Bivins, T.; Keast, D.R. Risk for disordered eating relates to both gender and ethnicity for college students. J. Am. Coll. Nutr. 2002, 21, 307–314. [Google Scholar]
- Steiger, H.; Liquornik, K.; Chapman, J.; Hussain, N. Personality and family disturbances in eating-disorder patients: Comparison of “restricters” and “bingers” to normal controls. Int. J. Eat. Disord. 1991, 10, 501–512. [Google Scholar] [CrossRef]
- Polivy, J.; Herman, C.P. Causes of eating disorders. Annu. Rev. Psychol. 2002, 53, 187–213. [Google Scholar] [CrossRef]
- Arcelus, J.; Yates, A.; Whiteley, R. Romantic relationships, clinical and sub-clinical eating disorders: A review of the literature. Sex. Relation. Ther. 2012, 27, 147–161. [Google Scholar] [CrossRef]
- Fergusson, D.M.; Horwood, L.J.; Lynskey, M.T. The effects of unemployment on psychiatric illness during young adulthood. Psychol. Med. 1997, 27, 371–381. [Google Scholar] [CrossRef]
- Weich, S.; Lewis, G. Poverty, unemployment, and common mental disorders: Population based cohort study. BMJ 1998, 317, 115–119. [Google Scholar] [CrossRef]
- Cain, A.S.; Epler, A.J.; Steinley, D.; Sher, K.J. Concerns related to eating, weight, and shape: Typologies and transitions in men during the college years. Int. J. Eat. Disord. 2012, 45, 768–775. [Google Scholar] [CrossRef]
- Fichter, M.M.; Elton, M.; Sourdi, L.; Weyerer, S.; Koptagel-Ilal, G. Anorexia nervosa in Greek and Turkish adolescents. Eur. Arch. Psychiatry Neurol. Sci. 1988, 237, 200–208. [Google Scholar] [CrossRef]
- Mildred, H.; Paxton, S.J.; Wertheim, E.H. Risk factors for eating disorders in Greek- and Anglo-Australian adolescent girls. Int. J. Eat. Disord. 1995, 17, 91–96. [Google Scholar] [CrossRef]
- Yannakoulia, M.; Sitara, M.; Matalas, A.L. Reported eating behavior and attitudes improvement after a nutrition intervention program in a group of young female dancers. Int. J. Sport Nutr. Exerc. Metab. 2002, 12, 24–32. [Google Scholar]
- Yannakoulia, M.; Matalas, A.L.; Yiannakouris, N.; Papoutsakis, C.; Passos, M.; Klimis-Zacas, D. Disordered eating attitudes: An emerging health problem among Mediterranean adolescents. Eat. Weight Disord. 2004, 9, 126–133. [Google Scholar]
- Fichter, M.M.; Quadflieg, N.; Georgopoulou, E.; Xepapadakos, F.; Fthenakis, E.W. Time trends in eating disturbances in young Greek migrants. Int. J. Eat. Disord. 2005, 38, 310–322. [Google Scholar] [CrossRef]
- Yannakoulia, M.; Panagiotakos, D.B.; Pitsavos, C.; Tsetsekou, E.; Fappa, E.; Papageorgiou, C.; Stefanadis, C. Eating habits in relations to anxiety symptoms among apparently healthy adults. A pattern analysis from the ATTICA Study. Appetite 2008, 51, 519–525. [Google Scholar] [CrossRef]
- Costarelli, V.; Demerzi, M.; Stamou, D. Disordered eating attitudes in relation to body image and emotional intelligence in young women. J. Hum. Nutr. Diet. 2009, 22, 239–245. [Google Scholar] [CrossRef]
- Gonidakis, F.; Sigala, A.; Varsou, E.; Papadimitriou, G. A study of eating attitudes and related factors in a sample of first-year female Nutrition and Dietetics students of Harokopion University in Athens, Greece. Eat. Weight Disord. 2009, 14, e121–e127. [Google Scholar]
- Bilali, A.; Galanis, P.; Velonakis, E.; Katostaras, T. Factors associated with abnormal eating attitudes among Greek adolescents. J. Nutr. Educ. Behav. 2010, 42, 292–298. [Google Scholar] [CrossRef]
- Koskina, N.; Giovazolias, T. The effect of attachment insecurity in the development of eating disturbances across gender: The role of body dissatisfaction. J. Psychol. 2010, 144, 449–471. [Google Scholar] [CrossRef]
- Michala, L.; Antsaklis, A. Anorexia nervosa: A psychiatric illness with gynecological manifestations. A survey of knowledge and practice among Greek gynecologists. Eur. J. Obstet. Gynecol. Reprod. Biol. 2010, 153, 170–172. [Google Scholar] [CrossRef]
- Costarelli, V.; Antonopoulou, K.; Mavrovounioti, C. Psychosocial characteristics in relation to disordered eating attitudes in greek adolescents. Eur. Eat. Disord. Rev. 2011, 19, 322–330. [Google Scholar] [CrossRef]
- Peroutsi, A.; Gonidakis, F. Eating disorders and mass media. Psychiatrike 2011, 22, 231–239. [Google Scholar]
- Konstantakopoulos, G.; Varsou, E.; Dikeos, D.; Ioannidi, N.; Gonidakis, F.; Papadimitriou, G.; Oulis, P. Delusionality of body image beliefs in eating disorders. Psychiatry Res. 2012, 200, 482–488. [Google Scholar] [CrossRef]
- Bartlett, J.E., II; Kotrlik, J.W.; Higgins, C.C. Organizational research: Determining appropriate sample size in survey research appropriate sample size in survey research. Inf. Technol. Learn. Perform. J. 2001, 19, 43–50. [Google Scholar]
- The SCOFF questions are: (1) Do you make yourself Sick because you feel uncomfortably full? (2) Do you worry that you have lost Control over how much you eat? (3) Have you recently lost more than One stone (14 lb) in a 3-month period? (4) Do you believe yourself to be Fat when others say you are too thin? (5) Would you say that Food dominates your life?
- Morgan, J.F.; Reid, F.; Lacey, J.H. The SCOFF questionnaire: Assessment of a new screening tool for eating disorders. BMJ 1999, 319, 1467–1468. [Google Scholar] [CrossRef]
- Perry, L.; Morgan, J.; Reid, F.; Brunton, J.; O’Brien, A.; Luck, A.; Lacey, H. Screening for symptoms of eating disorders: Reliability of the SCOFF screening tool with written compared to oral delivery. Int. J. Eat. Disord. 2002, 32, 466–472. [Google Scholar] [CrossRef]
- Fragkos, K.C. Female gender and depression as predictive factors of eating disorders in a sample of Greek university students. Clin. Nutr. Suppl. 2010, 5, 203. [Google Scholar] [CrossRef]
- Fragkos, K.C.; Frangos, C.C.; Sotiropoulos, I.; Giovanis, A.N.; Tilikidou, I.; Manolopoulos, I. Prevalence and risk factors of eating disorders in Greek undergraduate students. Eur. Psychiatry 2011, 26, 717. [Google Scholar]
- Pannocchia, L.; di Fiorino, M.; Giannini, M.; Vanderlinden, J. A psychometric exploration of an italian translation of the SCOFF questionnaire. Eur. Eat. Disord. Rev. 2011, 19, 371–373. [Google Scholar]
- Muro-Sans, P.; Amador-Campos, J.A.; Morgan, J.F. The SCOFF-c: Psychometric properties of the Catalan version in a Spanish adolescent sample. J. Psychosom. Res. 2008, 64, 81–86. [Google Scholar] [CrossRef]
- Lovibond, P.F.; Lovibond, S.H. The structure of negative emotional states: Comparison of the Depression Anxiety Stress Scales (DASS) with the Beck Depression and Anxiety Inventories. Behav. Res. Ther. 1995, 33, 335–343. [Google Scholar] [CrossRef]
- Edmed, S.; Sullivan, K. Depression, anxiety, and stress as predictors of postconcussion-like symptoms in a non-clinical sample. Psychiatry Res. 2012, 200, 41–45. [Google Scholar] [CrossRef]
- Lyrakos, G.N.; Arvaniti, C.; Smyrnioti, M.; Kostopanagiotou, G. Translation and validation study of the depression anxiety stress scale in the greek general population and in a psychiatric patient’s sample. Eur. Psychiatry 2011, 26, 1731. [Google Scholar]
- Alpert, R.; Haber, R.N. Anxiety in academic achievement situations. J. Abnorm. Soc. Psychol. 1960, 61, 207–215. [Google Scholar] [CrossRef]
- Kazelskis, R.; Reeves, C.; Kersh, M.E.; Bailey, G.; Cole, K.; Larmon, M.; Hall, L.; Holliday, D.C. Mathematics anxiety and test anxiety: Separate constructs? J. Exp. Educ. 2000, 68, 137–146. [Google Scholar] [CrossRef]
- Kline, R.B. Principles and Practice of Structural Equation Modeling, 3rd ed; Guilford Press: New York, NY, USA, 2010. [Google Scholar]
- Stepwise logistic regression is designed to find the most parsimonious set of predictors that are most effective in predicting the dependent variable. The process of adding more variables stops when all of the available variables have been included or when it is not possible to make a statistically significant reduction in −2∙log likelihood using any of the variables not yet included
- Menard, S.W. Applied Logistic Regression Analysis; Sage: Thousand Oaks, CA, USA, 2002. [Google Scholar]
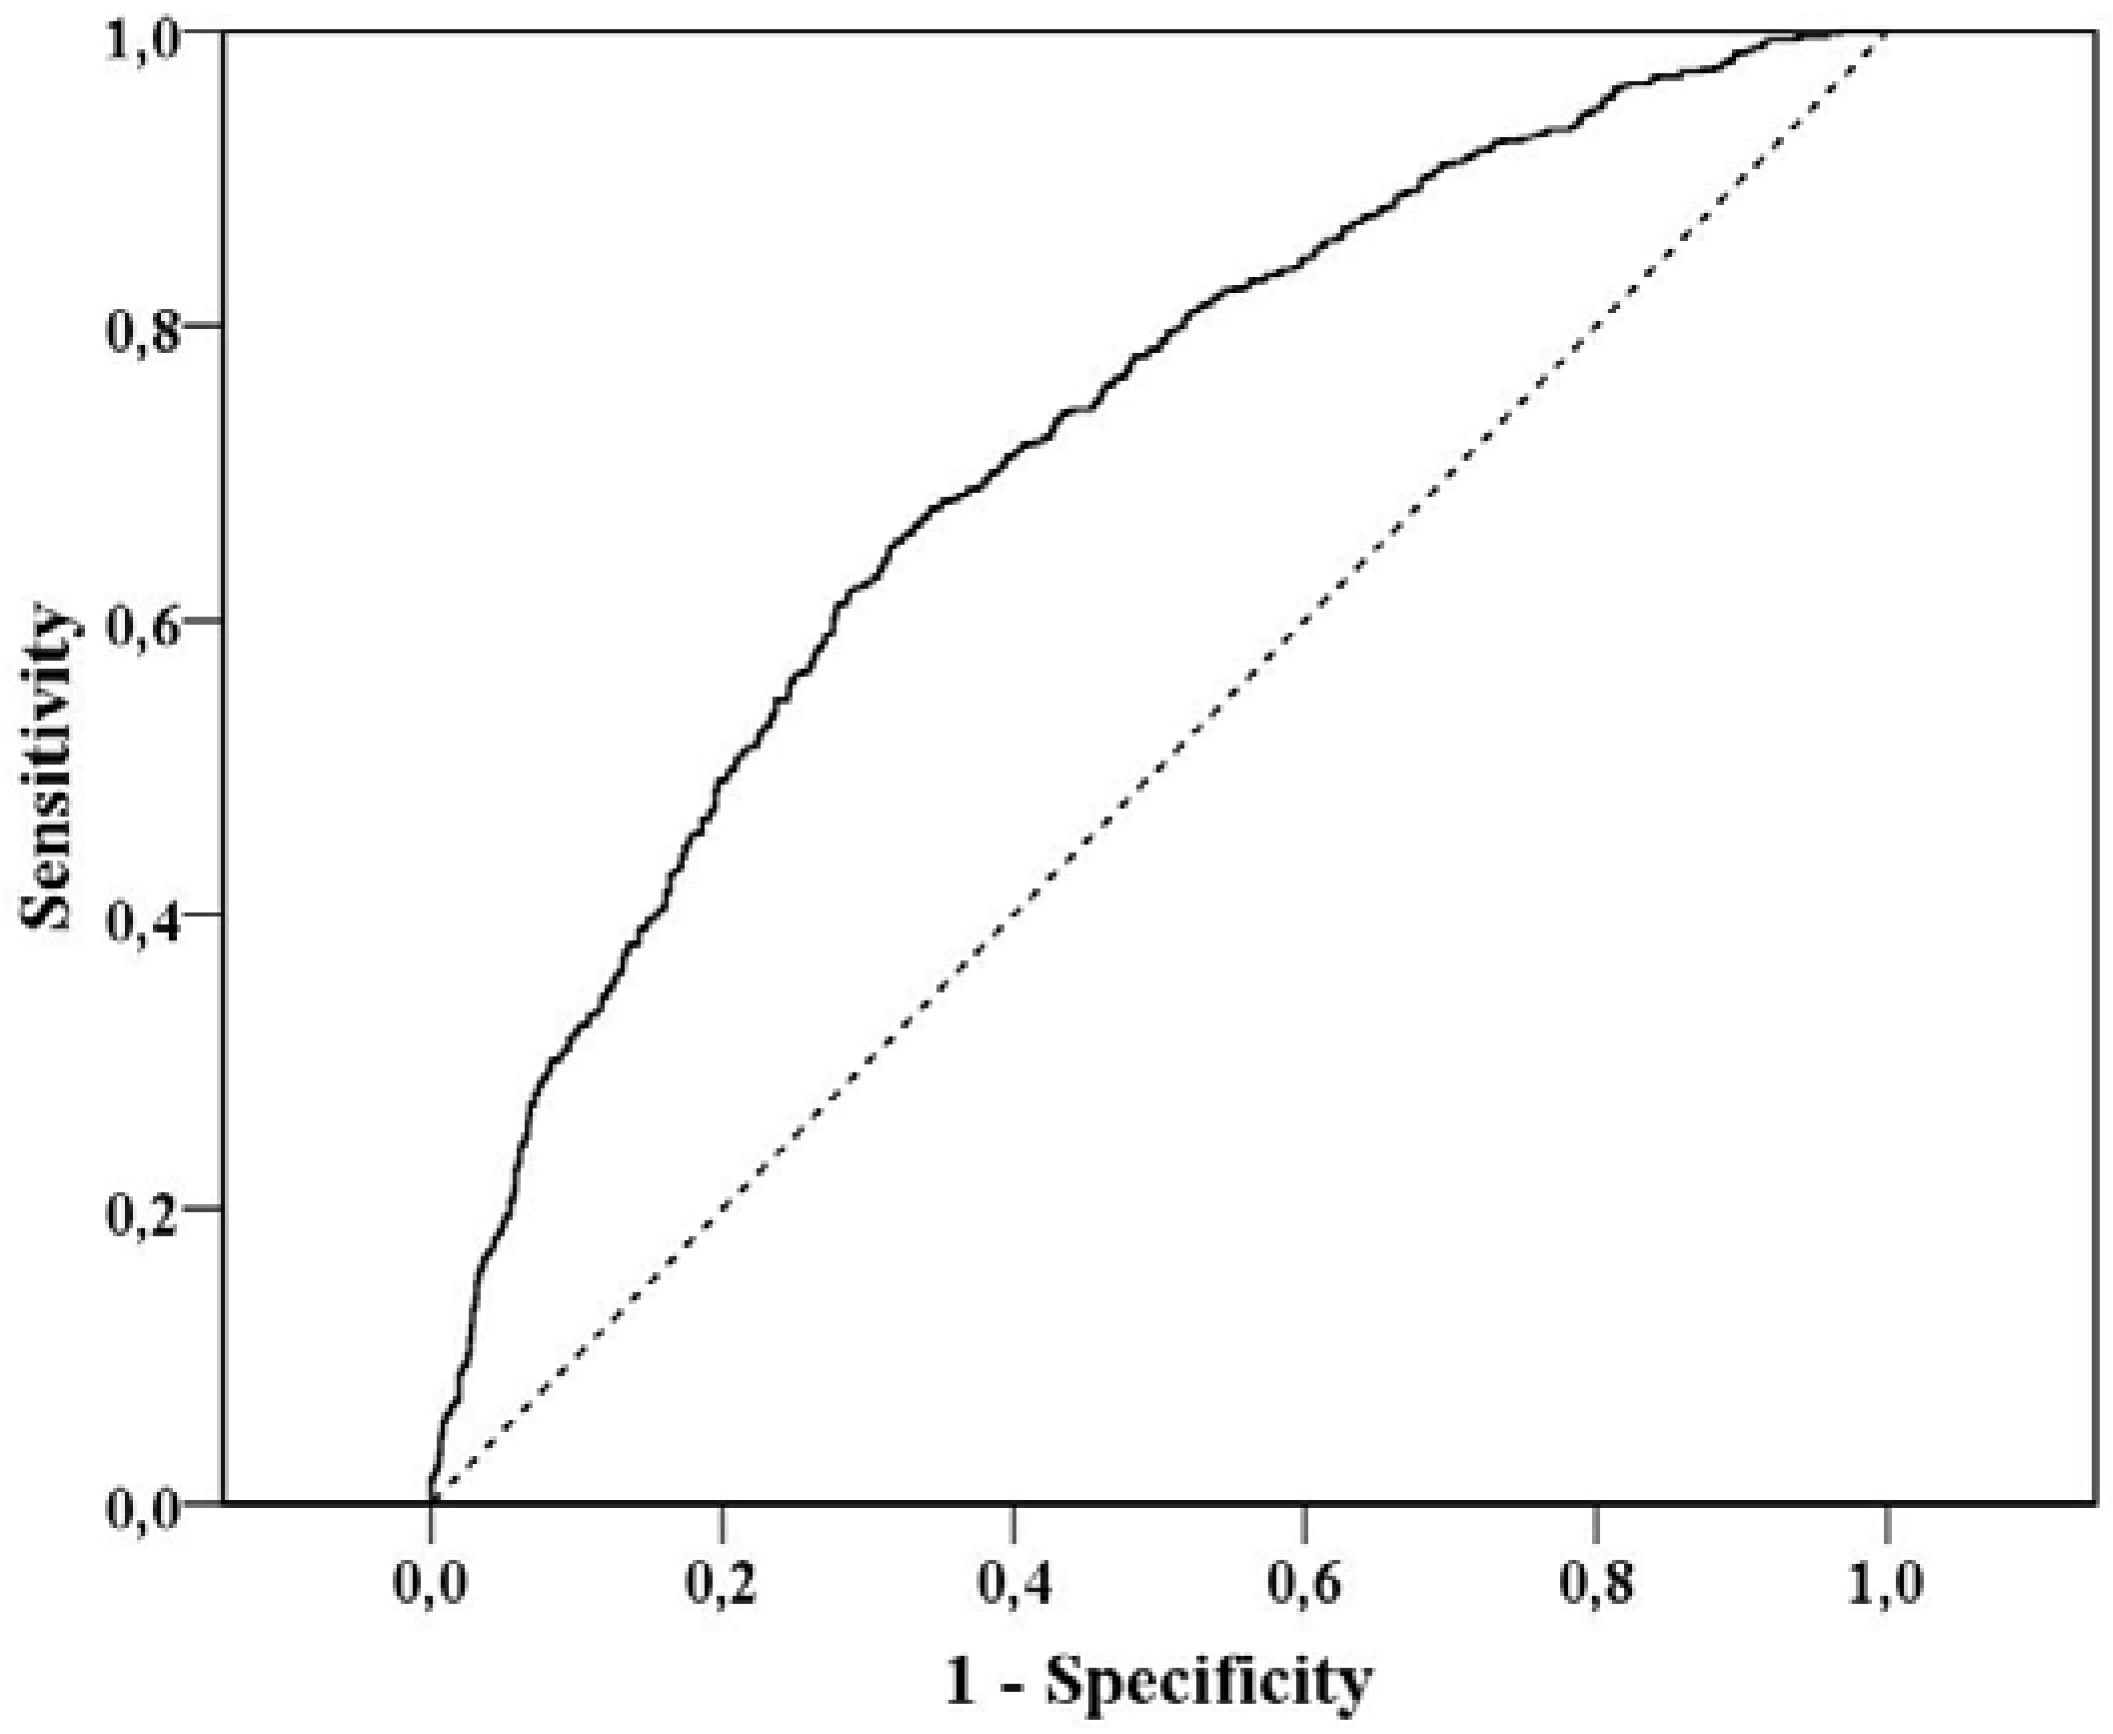
- The AUC, sometimes referred to as the c-statistic (or concordance index), is a value that varies from 0.5 (discriminating power not better than chance) to 1.0 (perfect discriminating power)
- Woodside, D.B.; Lackstrom, J.B.; Shekter-Wolfson, L. Marriage in eating disorders Comparisons between patients and spouses and changes over the course of treatment. J. Psychosom. Res. 2000, 49, 165–168. [Google Scholar] [CrossRef]
- Kiriike, N.; Nagata, T.; Matsunaga, H.; Tobitani, W.; Nishiura, T. Married patients with eating disorders in Japan. Acta Psychiatr. Scand. 1996, 94, 428–432. [Google Scholar] [CrossRef]
- The odds ratio for this interaction term can be computed with the covariance matrix of the coefficients, as estimated from logistic regression. This can be provided upon request
- Madianos, M.G.; Madianou, D.; Vlachonikolis, J.; Stefanis, C.N. Attitudes towards mental illness in the Athens area: Implications for community mental health intervention. Acta Psychiatr. Scand. 1987, 75, 158–165. [Google Scholar] [CrossRef]
- Papadopoulos, C.; Leavey, G.; Vincent, C. Factors influencing stigma: A comparison of Greek-Cypriot and English attitudes towards mental illness in north London. Soc. Psychiatry Psychiatr. Epidemiol. 2002, 37, 430–434. [Google Scholar] [CrossRef]
- Kaiser, H. A second generation little jiffy. Psychometrika 1970, 35, 401–415. [Google Scholar] [CrossRef]
- Kaiser, H. An index of factorial simplicity. Psychometrika 1974, 39, 31–36. [Google Scholar]
- Bartlett, M.S. A Note on the Multiplying Factors for Various χ2 Approximations. J. R. Stat. Soc. Series B Stat. Methodol. 1954, 16, 296–298. [Google Scholar]
- Cattell, R.B. The scree test for the number of factors. Multivariate Behav. Res. 1966, 1, 245–276. [Google Scholar] [CrossRef]
© 2013 by the authors; licensee MDPI, Basel, Switzerland. This article is an open access article distributed under the terms and conditions of the Creative Commons Attribution license (http://creativecommons.org/licenses/by/3.0/).
Share and Cite
Fragkos, K.C.; Frangos, C.C. Assessing Eating Disorder Risk: The Pivotal Role of Achievement Anxiety, Depression and Female Gender in Non-Clinical Samples. Nutrients 2013, 5, 811-828. https://0-doi-org.brum.beds.ac.uk/10.3390/nu5030811
Fragkos KC, Frangos CC. Assessing Eating Disorder Risk: The Pivotal Role of Achievement Anxiety, Depression and Female Gender in Non-Clinical Samples. Nutrients. 2013; 5(3):811-828. https://0-doi-org.brum.beds.ac.uk/10.3390/nu5030811
Chicago/Turabian StyleFragkos, Konstantinos C., and Christos C. Frangos. 2013. "Assessing Eating Disorder Risk: The Pivotal Role of Achievement Anxiety, Depression and Female Gender in Non-Clinical Samples" Nutrients 5, no. 3: 811-828. https://0-doi-org.brum.beds.ac.uk/10.3390/nu5030811