Influence of Maternal Obesity and Gestational Weight Gain on Maternal and Foetal Lipid Profile

 ,
,
Abstract
:
1. Introduction
2. Materials and Methods
2.1. Subjects and Study Design
2.2. Anthropometrics and Clinical Evaluation
2.3. Samples Collection
2.4. Fatty Acid Analysis
2.4.1. Lipid Extraction from Erythrocyte Membranes
2.4.2. Gas Chromatography Analysis of Fatty Acid Methyl Esters
2.5. Statistical Analysis
3. Result
3.1. Subjects
3.2. Fatty Acid Profile in Maternal and Foetal Erythrocyte Membranes
3.2.1. Saturated Fatty Acids
3.2.2. Unsaturated Fatty Acids
3.2.3. Essential Fatty Acids (EFAs) and Long-Chain Unsaturated Fatty Acids (LC-PUFAs)
3.3. Association between Maternal Characteristics and Maternal and Foetal Lipid Profile
Pre-Pregnancy Body Mass Index (BMI) and Gestational Weight Gain (GWG)
4. Discussion
Supplementary Materials
Acknowledgments
Author Contributions
Conflicts of Interest
Abbreviations
| AA | Arachidonic Acid |
| ADA | American Diabetes Association |
| ALA | α-Linolenic Acid |
| BL | Body Length |
| BMI | Body Mass Index |
| BW | Body Weight |
| DGLA | Dihomogamma Linoleic Acid |
| DHA | Docosaexahenoic Acid |
| DPA | Docosapentaenoic Acid |
| EDTA | Ethylenediaminetetraacetic Acid |
| EFAs | Essential Fatty Acids |
| EPA | Ecosapentaenoic acid |
| FAME | Fatty Acid Methyl Esters |
| FAs | Fatty Acids |
| GDM | Gestational Diabetes Mellitus |
| GWG | Gestational Weight Gain |
| HC | Head Circumference |
| INeS | Italian Neonatal Study |
| IQR | Inter Quartile Range |
| LA | linoleic acid |
| LC-PUFAs | Long Chain Unsaturated Fatty Acids |
| MUFAs | Monounsaturated Fatty Acids |
| OPBG | Ospedale Pediatrico Bambino Gesù |
| PUFAs | Polyunsaturated Fatty Acids |
| SCH | San Camillo Forlanini Hospital |
| SD | Standard Deviation |
| SDS | Standard Deviation Score |
| SES | Socioeconomic Status |
| SFAs | Saturated Fatty Acids |
| T1D | Type 1 Diabetes |
| T2D | Type 2 Diabetes |
| UFAs | Unsaturated Fatty Acids |
| WHO | World Health Organization |
References
- Cetin, I.; Alvino, G.; Cardellicchio, M. Long chain fatty acids and dietary fats in fetal nutrition. J. Physiol. 2009, 587, 3441–3451. [Google Scholar] [CrossRef] [PubMed]
- Haggarty, P. Fatty acid supply to the human foetus. Ann. Rev. Nutr. 2010, 30, 237–255. [Google Scholar] [CrossRef] [PubMed]
- Janssen, C.I.; Kiliaan, A.J. Long-chain polyunsaturated fatty acids (LCPUFA) from genesis to senescence: The influence of LCPUFA on neural development, aging, and neurodegeneration. Prog. Lipid Res. 2014, 53, 1–17. [Google Scholar] [CrossRef] [PubMed]
- Duttaroy, A.K. Transport of fatty acids across the human placenta: A review. Prog. Lipid Res. 2009, 48, 52–61. [Google Scholar] [CrossRef] [PubMed]
- Campbell, F.M.; Gordon, M.J.; Duttaroy, A.K. Placental membrane fatty acid-binding protein preferentially binds arachidonic and docosahexaenoic acids. Life Sci. 1998, 63, 235–240. [Google Scholar] [CrossRef]
- Cunningham, P.; McDermott, L. Long chain PUFA transport in human term placenta. J. Nutr. 2009, 139, 636–639. [Google Scholar] [CrossRef] [PubMed]
- Crawford, M.A.; Hassam, A.G.; Williams, G.; Whitehouse, W.L. Essential fatty-acids and fetal brain growth. Lancet 1976, 1, 452–453. [Google Scholar] [CrossRef]
- Luxwolda, M.F.; Kuipers, R.S.; Sango, W.S.; Kwesigabo, G.; Dijck-Brouwer, D.A.; Muskiet, F.A. A maternal erythrocyte DHA content of approximately 6 g% is the DHA status at which intrauterine DHA biomagnifications turns into bioattenuation and postnatal infant DHA equilibrium is reached. Eur. J. Nutr. 2012, 51, 665–675. [Google Scholar] [CrossRef] [PubMed]
- Larqué, E.; Ruiz-Palacios, M.; Koletzko, B. Placental regulation of fetal nutrient supply. Curr. Opin. Clin. Nutr. Metab. Care 2013, 16, 292–297. [Google Scholar] [CrossRef] [PubMed]
- Vidakovic, A.J.; Jaddoe, V.W.; Gishti, O.; Felix, J.F.; Williams, M.A.; Hofman, A.; Demmelmair, H.; Koletzko, B.; Tiemeier, H.; Gaillard, R. Body mass index, gestational weight gain and fatty acid concentrations during pregnancy: The Generation R Study. Eur. J. Epidemiol. 2015, 30, 1175–1185. [Google Scholar] [CrossRef] [PubMed] [Green Version]
- SIGO: Società Italiana di Ginecologia ed Ostetricia. Available online: www.sigo.it (accessed on 17 January 2016).
- Lohman, T.G.; Roche, A.F.; Martorell, R. Anthropometric Standardization Reference Manual, 1st ed.; Human Kinetics Books: Champaign, IL, USA, 1988. [Google Scholar]
- World Health Organization. Obesity: Preventing and Managing the Global Epidemic Report of a WHO Consultation; World Health Organization: Geneva, Switzerland, 2000. [Google Scholar]
- American Diabetes Association. Standards of medical care in diabetes—2014. Diabetes Care 2014, 37, S14–S40. [Google Scholar] [CrossRef] [PubMed]
- Bertino, E.; Spada, E.; Occhi, L.; Coscia, A.; Giuliani, F.; Gagliardi, L.; Gilli, G.; Bona, G.; Fabris, C.; De Curtis, M.; et al. Neonatal anthropometric charts: The Italian neonatal study compared with other European studies. J. Pediatr. Gastroenterol. Nutr. 2010, 51, 353–361. [Google Scholar] [CrossRef] [PubMed]
- Destaillats, F.; Cruz-Hernandez, C. Fast analysis by gas-liquid chromatography. Perspective on the resolution of complex fatty acid compositions. J. Chromatogr. A 2007, 1169, 175–178. [Google Scholar] [CrossRef] [PubMed]
- Brett, K.; Ferraro, Z.M.; Yockell-Lelievre, J.; Gruslin, A.; Adamo, K.B. Maternal-fetal nutrient transport in pregnancy pathologies: The role of the placenta. Int. J. Mol. Sci. 2014, 15, 16153–16185. [Google Scholar] [CrossRef] [PubMed]
- Larqué, E.; Pagán, A.; Prieto, M.T.; Blanco, J.E.; Gil-Sánchez, A.; Zornoza-Moreno, M.; Ruiz-Palacios, M.; Gázquez, A.; Demmelmair, H.; Parrilla, J.J.; et al. Placental fatty acid transfer: A key factor in fetal growth. Ann. Nutr. Metab. 2014, 64, 247–253. [Google Scholar] [CrossRef] [PubMed]
- Pankiewicz, E.; Cretti, A.; Ronin-Walknowska, E.; Czeszyńska, M.B.; Konefał, H.; Hnatyszyn, G. Maternal adipose tissue, maternal and cord blood essential fatty acids and their long-chain polyunsaturatedderivatives composition after elective caesarean section. Early Hum. Dev. 2007, 83, 459–464. [Google Scholar] [CrossRef] [PubMed]
- Kuipers, R.S.; Luxwolda, M.F.; Sango, W.S.; Kwesigabo, G.; Dijck-Brouwer, D.A.; Muskiet, F.A. Maternal DHA equilibrium during pregnancy and lactation is reached at an erythrocyte DHA content of 8 g/100 g fatty acids. J. Nutr. 2011, 141, 418–427. [Google Scholar] [CrossRef] [PubMed]
- Enke, U.; Jaudszus, A.; Schleussner, E.; Seyfarth, L.; Jahreis, G.; Kuhnt, K. Fatty acid distribution of cord and maternal blood in human pregnancy: Special focus on individual trans fatty acids and conjugated linoleic acids. Lipids Health Dis. 2011, 10. [Google Scholar] [CrossRef] [PubMed]
- Schlörmann, W.; Kramer, R.; Lochner, A.; Rohrer, C.; Schleussner, E.; Jahreis, G.; Kuhnt, K. Foetal cord blood contains higher portions of n-3 and n-6 long-chain PUFA but lower portions of trans C18:1isomers than maternal blood. Food. Nutr. Res. 2015, 59. [Google Scholar] [CrossRef] [PubMed]
- Haggarty, P.; Page, K.; Abramovich, D.R.; Ashton, J.; Brown, D. Long-chain polyunsaturated fatty acid transport across the perfused human placenta. Placenta 1997, 18, 635–642. [Google Scholar] [CrossRef]
- Salem, N.; Wegher, B.; Mena, P.; Uauy, R. Arachidonic and docosahexaenoic acids are biosynthesized from their 18-carbon precursors in human infants. Proc. Natl. Acad. Sci. USA 1996, 93, 49–54. [Google Scholar] [CrossRef] [PubMed]
- Parra-Cabrera, S.; Stein, A.D.; Wang, M.; Martorell, R.; Rivera, J.; Ramakrishnan, U. Dietary intakes of polyunsaturated fatty acids among pregnant Mexican women. Matern. Child. Nutr. 2011, 7, 140–147. [Google Scholar] [CrossRef] [PubMed]
- Bascuñán, K.A.; Valenzuela, R.; Chamorro, R.; Valencia, A.; Barrera, C.; Puigrredon, C.; Sandoval, J.; Valenzuela, A. Polyunsaturated fatty acid composition of maternal diet and erythrocyte phospholipid status in Chilean pregnant women. Nutrients 2014, 6, 4918–4934. [Google Scholar] [CrossRef] [PubMed]
- Katan, M.B.; Deslypere, J.P.; van Birgelen, A.P.; Penders, M.; Zegwaard, M. Kinetics of the incorporation of dietary fatty acids into serum cholesteryl esters, erythrocyte membranes, and adipose tissue: An 18-month controlled study. J. Lipid Res. 1997, 38, 2012–2022. [Google Scholar] [PubMed]


| Variable | n = 435 | |
|---|---|---|
| Mothers | Age (years) | 33.0 (29.0–37.0) 1 |
| Pre–pregnancy BMI (kg/m2) | 21.9 (20.0–24.6) 1 | |
| Underweight | 28 (6.4) 2 | |
| Normal weight | 309 (71.0) 2 | |
| Overweight | 65 (15.0) 2 | |
| Obese | 33 (7.6) 2 | |
| GWG | 13.0 (10.0–16.0) 1 | |
| Inadequate GWG | 124 (28.5) 2 | |
| Adequate GWG | 167 (38.4) 2 | |
| Excessive GWG | 144 (33.1) 2 | |
| Maternal smoking in pregnancy | 73 (16.8) 2 | |
| Parity | ||
| 0 | 242 (55.6) 2 | |
| 1 | 154 (35.4) 2 | |
| ≥2 | 39 (9.0) 2 | |
| Gestational age (wk) | 39.4 (38.6–40.6) 1 | |
| Delivery method | ||
| Vaginal | 271 (62.3) 2 | |
| Caesarean | 164 (37.7) 2 | |
| Education level | ||
| Primary school | 2 (0.5) 2 | |
| Secondary school | 60 (13.8) 2 | |
| High school | 209 (48.0) 2 | |
| Bachelor degree | 164 (37.7) 2 | |
| Infant | Infant sex: male | 229 (52.6) 2 |
| Birth weight (g) | 3330 (3060–3630) 1 | |
| Birth length (cm) | 50.0 (49.0–52.0) 1 | |
| Cranial circumference (cm) | 35.0 (34.0–36.0) 1 | |
| SDS weight infant | 0.2 (1.2) 2 | |
| SDS height infant | 0.4 (1.1) 2 | |
| Fatty Acids a | Mean | Median | 25° Perc. | 75° Perc. | Mean | Median | 25° Perc. | 75° Perc. | Correlation Maternal vs. Fetal2 | ||
|---|---|---|---|---|---|---|---|---|---|---|---|
| Maternal | Foetal | p a | r b | p b | |||||||
| 12:0 | 1.21 | 0.87 | 0.00 | 2.16 | 1.23 | 0.89 | 0.00 | 2.27 | 0.932 | 0.6 | 0.000 |
| 13:0 | 0.34 | 0.00 | 0.00 | 0.43 | 0.36 | 0.00 | 0.00 | 0.50 | 0.930 | 0.6 | 0.000 |
| 14:0 | 1.05 | 0.94 | 0.60 | 1.43 | 1.02 | 0.88 | 0.57 | 1.37 | 0.247 | 0.6 | 0.000 |
| 15:0 | 0.50 | 0.46 | 0.25 | 0.71 | 0.49 | 0.40 | 0.18 | 0.65 | 0.001 | 0.4 | 0.000 |
| 16:0 | 20.06 | 19.75 | 17.29 | 22.67 | 19.41 | 19.40 | 16.53 | 22.23 | 0.000 | 0.6 | 0.000 |
| 17:0 | 0.47 | 0.47 | 0.23 | 0.65 | 0.46 | 0.42 | 0.24 | 0.56 | 0.005 | 0.6 | 0.000 |
| 18:0 | 13.77 | 13.41 | 11.70 | 15.51 | 14.15 | 14.29 | 12.00 | 16.15 | 0.000 | 0.6 | 0.000 |
| 19:0 | 0.04 | 0.00 | 0.00 | 0.00 | 0.02 | 0.00 | 0.00 | 0.00 | 0.417 | 0.4 | 0.000 |
| 20:0 | 0.36 | 0.42 | 0.29 | 0.50 | 0.40 | 0.47 | 0.27 | 0.57 | 0.000 | 0.5 | 0.000 |
| 22:0 | 1.27 | 1.42 | 1.21 | 1.62 | 1.06 | 1.20 | 0.95 | 1.38 | 0.000 | 0.6 | 0.000 |
| 24:0 | 3.88 | 4.20 | 3.56 | 4.75 | 3.79 | 4.10 | 3.41 | 4.74 | 0.370 | 0.5 | 0.000 |
| cis 12:1, n-1 | 0.87 | 0.44 | 0.00 | 1.61 | 0.87 | 0.35 | 0.00 | 1.67 | 0.441 | 0.8 | 0.000 |
| cis 14:1, n-5 | 0.72 | 0.44 | 0.00 | 1.23 | 0.69 | 0.40 | 0.00 | 1.25 | 0.160 | 0.8 | 0.000 |
| cis 15:1, n-1 | 0.35 | 0.00 | 0.00 | 0.28 | 0.15 | 0.00 | 0.00 | 0.23 | 0.008 | 0.7 | 0.000 |
| trans 16:1, n-7 | 0.22 | 0.08 | 0.00 | 0.30 | 0.28 | 0.00 | 0.00 | 0.46 | 0.739 | 0.2 | 0.000 |
| cis 16:1, n-7 | 0.58 | 0.49 | 0.00 | 0.87 | 0.41 | 0.41 | 0.00 | 0.71 | 0.000 | 0.3 | 0.000 |
| cis 17:1, n-7 | 0.38 | 0.00 | 0.00 | 0.79 | 0.26 | 0.00 | 0.00 | 0.55 | 0.000 | 0.7 | 0.000 |
| trans 18:1, n-9 | 0.24 | 0.00 | 0.00 | 0.00 | 0.24 | 0.00 | 0.00 | 0.00 | 0.515 | 0.4 | 0.000 |
| cis 18:1, n-9 | 8.51 | 9.88 | 1.53 | 13.01 | 5.74 | 6.79 | 1.09 | 8.92 | 0.000 | 0.7 | 0.000 |
| trans 18:1, n-7 | 3.27 | 0.00 | 0.00 | 7.99 | 2.66 | 0.00 | 0.00 | 6.94 | 0.000 | 0.7 | 0.000 |
| cis 18:1, n-7 | 1.00 | 1.01 | 0.78 | 1.22 | 1.33 | 1.38 | 1.09 | 1.65 | 0.000 | 0.3 | 0.000 |
| cis 19:1, n-9 | 0.17 | 0.00 | 0.00 | 0.30 | 0.15 | 0.00 | 0.00 | 0.22 | 0.002 | 0.6 | 0.000 |
| cis 20:1, n-15 | 0.04 | 0.00 | 0.00 | 0.00 | 0.04 | 0.00 | 0.00 | 0.00 | 0.681 | 0.6 | 0.000 |
| cis 20:1, n-12 | 0.18 | 0.00 | 0.00 | 0.35 | 0.11 | 0.08 | 0.00 | 0.18 | 0.000 | 0.6 | 0.000 |
| cis 20:1, n-9 | 0.15 | 0.00 | 0.00 | 0.30 | 0.10 | 0.00 | 0.00 | 0.17 | 0.000 | 0.6 | 0.000 |
| cis 22:1, n-9 | 0.08 | 0.00 | 0.00 | 0.14 | 0.10 | 0.00 | 0.00 | 0.14 | 0.825 | 0.5 | 0.000 |
| cis 24:1, n-9 | 4.69 | 5.31 | 3.67 | 6.27 | 3.20 | 3.70 | 1.31 | 4.43 | 0.000 | 0.6 | 0.000 |
| 18:2, n-6 (LA) | 5.19 | 5.58 | 4.49 | 6.47 | 2.43 | 2.32 | 1.92 | 2.78 | 0.000 | 0.2 | 0.000 |
| 18:3, n-6 | 0.18 | 0.14 | 0.00 | 0.24 | 0.13 | 0.10 | 0.00 | 0.20 | 0.000 | 0.5 | 0.000 |
| 18:3, n3 (ALA) | 0.08 | 0.00 | 0.00 | 0.14 | 0.06 | 0.00 | 0.00 | 0.00 | 0.000 | 0.2 | 0.000 |
| 20:2, n-6 | 0.21 | 0.23 | 0.00 | 0.35 | 0.50 | 0.54 | 0.29 | 0.69 | 0.000 | −0.1 | 0.021 |
| 20:3, n-6 (DGLA) | 1.09 | 1.17 | 0.82 | 1.46 | 1.42 | 1.51 | 1.15 | 1.87 | 0.000 | 0.5 | 0.000 |
| 20:4, n-6 (AA) | 6.39 | 7.23 | 4.28 | 9.19 | 7.35 | 8.54 | 5.67 | 10.17 | 0.000 | 0.5 | 0.000 |
| 20:3, n-3 | 0.65 | 0.00 | 0.00 | 0.07 | 0.88 | 0.00 | 0.00 | 0.07 | 0.510 | 0.6 | 0.000 |
| 20:5, n-3 (EPA) | 0.23 | 0.22 | 0.00 | 0.33 | 0.18 | 0.15 | 0.00 | 0.25 | 0.000 | 0.4 | 0.000 |
| trans 22:2, n-7 | 0.54 | 0.49 | 0.36 | 0.74 | 0.33 | 0.29 | 0.00 | 0.50 | 0.000 | 0.2 | 0.000 |
| 22:5, n-3 (DPA) | 0.70 | 0.41 | 0.00 | 1.05 | 0.44 | 0.00 | 0.00 | 0.58 | 0.000 | 0.7 | 0.000 |
| 22:6, n-3 (DHA) | 3.30 | 3.08 | 1.97 | 4.48 | 3.37 | 3.19 | 2.21 | 4.16 | 0.280 | 0.6 | 0.000 |
| Total FAs | 99.77 | 100.00 | 100.00 | 100.00 | 100.00 | 100.00 | 100.00 | 100.00 | 0.339 | 0.0 | 0.849 |
| Total SFAs | 42.99 | 42.46 | 38.46 | 47.02 | 42.37 | 42.22 | 37.79 | 47.50 | 0.000 | −0.3 | 0.000 |
| Total MUFAs | 21.73 | 21.59 | 18.74 | 24.18 | 16.64 | 16.24 | 14.45 | 18.30 | 0.000 | 0.4 | 0.000 |
| Total PUFAs | 19.93 | 20.75 | 15.71 | 24.27 | 18.75 | 19.37 | 15.49 | 22.31 | 0.000 | 1.0 | 0.000 |
| Total n-3 | 4.95 | 4.48 | 2.77 | 6.06 | 4.94 | 4.22 | 3.04 | 5.75 | 0.000 | 0.3 | 0.000 |
| Total n-6 | 12.83 | 13.84 | 9.81 | 15.99 | 11.36 | 12.66 | 9.16 | 14.61 | 0.000 | 0.4 | 0.000 |
| SFA/UFA ratio | 1.06 | 1.01 | 0.88 | 1.18 | 1.24 | 1.19 | 1.01 | 1.37 | 0.000 | 0.4 | 0.000 |
| n-6/n-3 ratio | 3.81 | 3.23 | 2.20 | 4.72 | 3.12 | 3.21 | 2.01 | 4.08 | 0.000 | 0.6 | 0.000 |
| Dependent Variable | Independent Variable | Coeff. | 95% CI | p | |
|---|---|---|---|---|---|
| Lower Bound | Upper Bound | ||||
| 14:0 | Smoking (Ref.: no) | 0.375 | 0.203 | 0.547 | 0.000 |
| Maternal age | 0.018 | 0.006 | 0.030 | 0.003 | |
| Education level (Ref.: low) | −0.317 | −0.503 | −0.132 | 0.001 | |
| 16:0 | Gestational age | −0.435 | −0.798 | −0.072 | 0.019 |
| trans 16:1 n-7 | Offspring sex (Ref.: male) | −0.134 | −0.216 | −0.052 | 0.001 |
| 18:2, n-6 (LA) | Pre-pregnancy BMI | −0.033 | −0.066 | −0.001 | 0.044 |
| Maternal age | −0.036 | −0.064 | −0.009 | 0.009 | |
| 18:3, n3 (ALA) | Education level (Ref.: low) | −0.090 | −0.138 | −0.042 | 0.000 |
| 20:5, n-3 (EPA) | Offspring sex (Ref.: male) | −0.060 | −0.103 | −0.016 | 0.008 |
| 22:5, n-3 (DPA) | Inadequate GWG | 0.637 | 0.271 | 1.002 | 0.001 |
| Adequate GWG (ref.) | - | - | - | - | |
| Excessive GWG | −0.078 | −0.429 | 0.272 | 0.661 | |
| 22:6, n-3 (DHA) | Inadequate GWG | 0.337 | −0.152 | 0.828 | 0.177 |
| Adequate GWG (ref.) | - | - | - | - | |
| Excessive GWG | −0.714 | −1.200 | −0.228 | 0.004 | |
| Pre-pregnancy BMI | 0.055 | 0.010 | 0.099 | 0.016 | |
| Gestational age | 0.343 | 0.183 | 0.503 | 0.000 | |
| Total MUFAs | Pre-pregnancy BMI | −0.112 | −0.207 | −0.017 | 0.021 |
| Total PUFAs | Gestational age | 0.662 | 0.075 | 1.248 | 0.027 |
| Total n-3 | Gestational age | 0.254 | 0.020 | 0.488 | 0.033 |
| Total n-6 | Maternal age | −0.096 | −0.177 | −0.015 | 0.021 |
| Dependent Variable | Independent Variable | Coeff. | 95% CI | p | |
|---|---|---|---|---|---|
| Lower Bound | Upper Bound | ||||
| 14:0 | Maternal 14:0 | 0.779 | 0.727 | 0.831 | 0.000 |
| Education level (Ref.: low) | 0.166 | 0.060 | 0.271 | 0.002 | |
| 16:0 | Maternal 16:0 | 0.654 | 0.569 | 0.738 | 0.000 |
| 18:0 | Maternal 18:0 | 0.696 | 0.606 | 0.786 | 0.000 |
| trans 16:1 n-7 | Maternal 16:1t | 0.291 | 0.210 | 0.371 | 0.000 |
| 18:2, n-6 (LA) | maternal 18:2, n-6 | 0.111 | 0.078 | 0.143 | 0.000 |
| 20:5, n-3 (EPA) | Maternal EPA | 0.591 | 0.541 | 0.641 | 0.000 |
| 22:5, n-3 (DPA) | Maternal DPA | 0.482 | 0.454 | 0.510 | 0.000 |
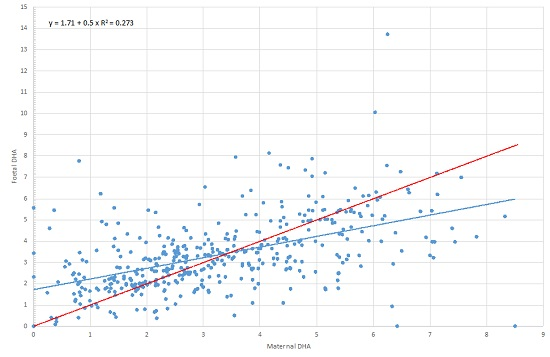
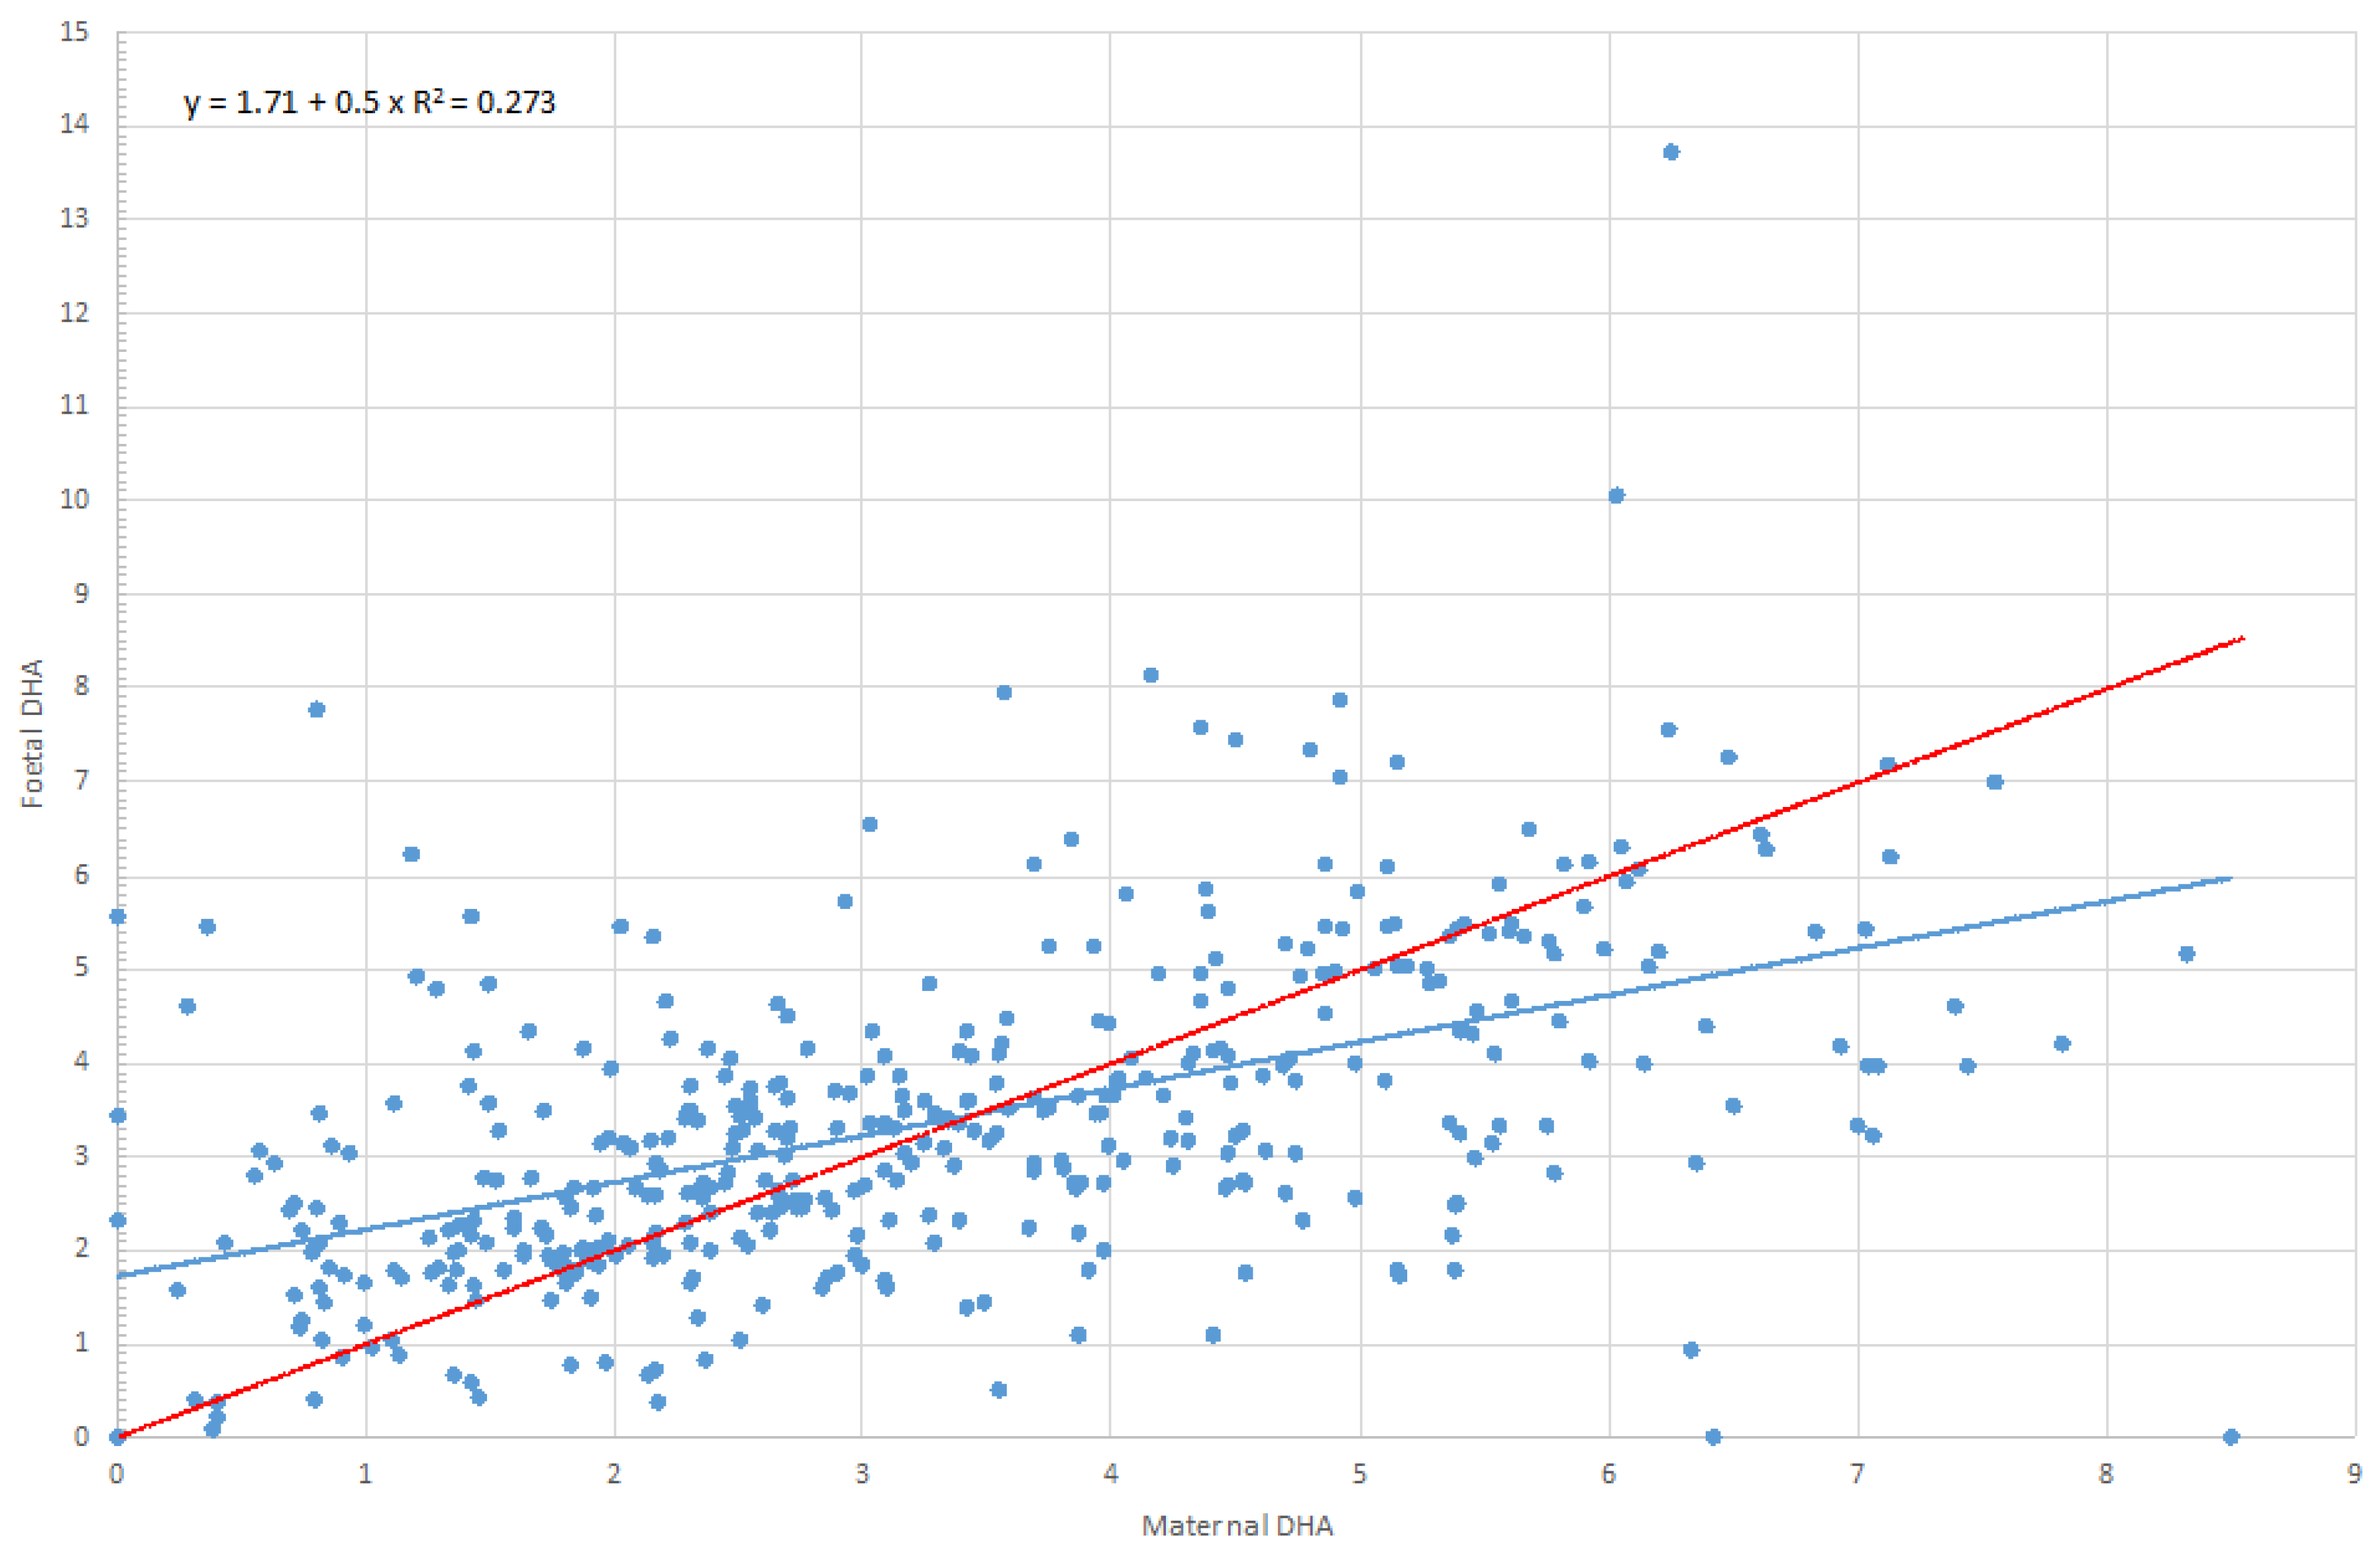
| 22:6, n-3 (DHA) | Maternal DHA | 0.590 | 0.520 | 0.661 | 0.000 |
| Pre-pregnancy BMI | −0.029 | −0.055 | −0.002 | 0.036 | |
| 20:4, n-6 (AA) | Maternal AA | 0.948 | 0.839 | 1.058 | 0.000 |
| 20:3, n-6 (DGLA) | Maternal 20:3, n-6 | 1.113 | 0.993 | 1.234 | 0.000 |
| Total SFAs | Maternal SFAs | 0.539 | 0.421 | 0.657 | 0.000 |
| Total MUFAs | Maternal MUFAs | 0.277 | 0.217 | 0.337 | 0.000 |
| Total PUFAs | Maternal PUFAs | 0.415 | 0.317 | 0.513 | 0.000 |
| Pre-pregnancy BMI | −0.172 | −0.301 | −0.043 | 0.009 | |
| Total n-3 | Maternal omega 3 | 0.678 | 0.623 | 0.733 | 0.000 |
| Smoking (Ref.: no) | 0.513 | 0.058 | 0.968 | 0.027 | |
| Total n-6 | Maternal omega 6 | 0.697 | 0.618 | 0.776 | 0.000 |
| Pre-pregnancy BMI | −0.098 | −0.177 | −0.019 | 0.015 | |
| Smoking (Ref.: no) | 1.031 | 0.057 | 2.005 | 0.038 | |
© 2016 by the authors; licensee MDPI, Basel, Switzerland. This article is an open access article distributed under the terms and conditions of the Creative Commons Attribution (CC-BY) license (http://creativecommons.org/licenses/by/4.0/).
Share and Cite
Cinelli, G.; Fabrizi, M.; Ravà, L.; Ciofi degli Atti, M.; Vernocchi, P.; Vallone, C.; Pietrantoni, E.; Lanciotti, R.; Signore, F.; Manco, M. Influence of Maternal Obesity and Gestational Weight Gain on Maternal and Foetal Lipid Profile. Nutrients 2016, 8, 368. https://0-doi-org.brum.beds.ac.uk/10.3390/nu8060368
Cinelli G, Fabrizi M, Ravà L, Ciofi degli Atti M, Vernocchi P, Vallone C, Pietrantoni E, Lanciotti R, Signore F, Manco M. Influence of Maternal Obesity and Gestational Weight Gain on Maternal and Foetal Lipid Profile. Nutrients. 2016; 8(6):368. https://0-doi-org.brum.beds.ac.uk/10.3390/nu8060368
Chicago/Turabian StyleCinelli, Giulia, Marta Fabrizi, Lucilla Ravà, Marta Ciofi degli Atti, Pamela Vernocchi, Cristina Vallone, Emanuela Pietrantoni, Rosalba Lanciotti, Fabrizio Signore, and Melania Manco. 2016. "Influence of Maternal Obesity and Gestational Weight Gain on Maternal and Foetal Lipid Profile" Nutrients 8, no. 6: 368. https://0-doi-org.brum.beds.ac.uk/10.3390/nu8060368