Bioelectrical Impedance Vector Analysis and Muscular Fitness in Healthy Men

 ,
,  and
and
Abstract
:1. Introduction
2. Materials and Methods
2.1. Subjects
2.2. Anthropometric Assessment
2.3. Handgrip Strength
2.4. Bioelectrical Impedance
2.5. Statistical Analysis
3. Results
4. Discussion
5. Conclusions
Acknowledgments
Author Contributions
Conflicts of Interest
Abbreviations
| MF | Muscular fitness |
| HG | Handgrip |
| BIVA | Bioelectrical impedance vector analysis |
| PhA | Phase angle |
| R | Resistance |
| Xc | Reactance |
References
- Ramírez-Vélez, R.; Meneses-Echavez, J.F.; González-Ruíz, K.; Correa, J.E. Muscular fitness and cardiometabolic risk factors among Colombian young adults. Nutr. Hosp. 2014, 30, 769–775. [Google Scholar] [PubMed]
- Richards, L.G.; Palmiter-Thomas, P. Grip strength measurement: A critical review of tools, methods, and clinical utility. Crit. Rev. Phys. Rehabil. Med. 1996, 8, 87–109. [Google Scholar] [CrossRef]
- Cohen, D.D.; Voss, C.; Taylor, M.J.; Sandercock, G.R.H. Handgrip strength in English schoolchildren. Acta Paediatr. 2010, 99, 1065–1072. [Google Scholar] [CrossRef] [PubMed]
- Ortega, F.B.; Ruiz, J.R.; Castillo, M.J.; Sjostrom, M. Physical fitness in childhood and adolescence: A powerful marker of health. Int. J. Obes. (Lond.) 2008, 32, 1–11. [Google Scholar] [CrossRef] [PubMed]
- Ruiz, J.R.; Sui, X.; Lobelo, F.; Morrow, J.R., Jr.; Jackson, A.W.; Sjostrom, M.; Blair, S.N. Association between muscular strength and mortality in men; prospective cohort study. BMJ 2008, 1. [Google Scholar] [CrossRef] [PubMed]
- Steene-Johannessen, J.; Anderssen, S.A.; Kolle, E.; Andersen, L.B. Low muscle fitness is associated with metabolic risk in youth. Med. Sci. Sports Exerc. 2009, 41, 1361–1167. [Google Scholar] [CrossRef] [PubMed]
- Pollock, M.L.; Franklin, B.A.; Balady, G.J.; Chaitman, B.L.; Fleg, J.L.; Fletcher, B.; Limacher, M.; Piña, I.L.; Stein, R.A.; Williams, M.; et al. Resistance exercise in individuals with and without cardiovascular disease benefits, rationale, safety, and prescription an advisory from the committee on exercise, rehabilitation, and prevention, council on clinical cardiology, American Heart Association. Circulation 2000, 101, 828–833. [Google Scholar] [CrossRef] [PubMed]
- Cetinus, E.; Buyukbese, M.A.; Uzel, M.; Ekerbicer, H.; Karaoguz, A. Hand grip strength in patients with type 2 diabetes mellitus. Diabetes Res. Clin. Pract. 2005, 70, 278–286. [Google Scholar] [CrossRef] [PubMed]
- Angst, F.; Drerup, S.; Werle, S.; Herren, D.B.; Simmen, B.R.; Goldhahn, J. Prediction of grip and key pinch strength in 978 healthy subjects. BMC Musculoskelet. Disord. 2010, 11, 94. [Google Scholar] [CrossRef] [PubMed]
- Norman, K.; Stobäus, N.; Gonzalez, M.C.; Schulzke, J.D.; Pirlich, M. Hand grip strength: Outcome predictor and marker of nutritional status. Clin. Nutr. 2011, 30, 135–142. [Google Scholar] [CrossRef] [PubMed]
- Peng, S.; Plank, L.D.; McCall, J.L.; Gillanders, L.K.; McIlroy, K.; Gane, E.J. Body composition, muscle function, and energy expenditure in patients with liver cirrhosis: A comprehensive study. Am. J. Clin. Nutr. 2007, 85, 1257–1266. [Google Scholar] [PubMed]
- Norman, K.; Stobäus, N.; Pirlich, M.; Bosy-Westphal, A. Bioelectrical phase angle and impedance vector analysis-clinical relevance and applicability of impedance parameters. Clin. Nutr. 2012, 31, 854–861. [Google Scholar] [CrossRef] [PubMed]
- Norman, K.; Pirlich, M.; Sorensen, J.; Christensen, P.; Kemps, M.; Schütz, T.; Lochs, H.; Kondrup, J. Bioimpedance vector analysis as a measure of muscle function. Clin. Nutr. 2009, 28, 78–82. [Google Scholar] [CrossRef] [PubMed]
- Piccoli, A.; Rossi, B.; Pillon, L.; Bucciante, G. A new method for monitoring body fluid variation by bioimpedance analysis: The RXc graph. Kidney Int. 1994, 46, 534–539. [Google Scholar] [CrossRef] [PubMed]
- Koury, J.C.; Trugo, N.M.; Torres, A.G. Phase angle and bioelectrical impedance vectors in adolescent and adult male athletes. Int. J. Sports Physiol. Perform. 2014, 9, 798–804. [Google Scholar] [CrossRef] [PubMed]
- Saragat, B.; Buffa, R.; Mereu, E.; de Rui, M.; Coin, A.; Sergi, G.; Marini, E. Specific bioelectrical impedance vector reference values for assessing body composition in the Italian elderly. Exp. Gerontol. 2014, 50, 52–56. [Google Scholar] [CrossRef] [PubMed]
- Buffa, R.; Floris, G.; Marini, E. Bioelectrical impedance vector in pre- and postmenarcheal females. Nutrition 2002, 18, 474–478. [Google Scholar] [CrossRef]
- Micheli, M.L.; Pagani, L.; Marella, M.; Gulisano, M.; Piccoli, A.; Angelini, F.; Burtscher, M.; Gatterer, H. Bioimpedance and impedance vector patterns as predictors of league level in male soccer players. Int. J. Sports Physiol. Perform. 2014, 9, 532–539. [Google Scholar] [CrossRef] [PubMed]
- Buffa, R.; Saragat, B.; Cabras, S.; Rinaldi, A.C.; Marini, E. Accuracy of specific BIVA for the assessment of body composition in the United States population. PLoS ONE 2013, 8, e58533. [Google Scholar] [CrossRef] [PubMed] [Green Version]
- Araujo, A.B.; Chiu, G.R.; Kupelian, V.; Hall, S.A.; Williams, R.E.; Clark, R.V.; McKinlay, J.B. Lean mass, muscle strength, and physical function in a diverse population of men: A population-based cross-sectional study. BMC Public Health 2010, 21. [Google Scholar] [CrossRef] [PubMed]
- Dalton, A.R.; Bottle, A.; Soljak, M.; Majeed, A.; Millett, C. Ethnic group differences in cardiovascular risk assessment scores: National cross-sectional study. Ethn. Health 2014, 19, 367–384. [Google Scholar] [CrossRef] [PubMed]
- Barbosa-Silva, M.C.; Barros, A.J.; Wang, J.; Heymsfield, S.B.; Pierson, R.N., Jr. Bioelectrical impedance analysis: Population reference values for phase angle by age and sex. Am. J. Clin. Nutr. 2005, 82, 49–52. [Google Scholar] [PubMed]
- Espinosa-Cuevas Mde, L.; Rivas-Rodríguez, L.; González-Medina, E.C.; Atilano-Carsi, X.; Miranda-Alatriste, P.; Correa-Rotter, R. Bioimpedance vector analysis for body composition in Mexican population. Rev. Investig. Clin. 2007, 59, 15–24. [Google Scholar]
- Llames, L.; Baldomero, V.; Iglesias, M.L.; Rodota, L.P. Values of the phase angle by bioelectrical impedance; nutritional status and prognostic value. Nutr. Hosp. 2013, 28, 286–295. [Google Scholar] [PubMed]
- Bonaccorsi, G.; Santomauro, F.; Lorini, C.; Indiani, L.; Pellegrino, E.; Pasquini, G.; Molino-Lova, R.; Epifani, F.; Macchi, C.; Mugello Study Working Group. Risk of malnutrition in a sample of nonagenarians: Specific versus classic bioelectrical impedance vector analysis. Nutrition 2016, 32, 368–374. [Google Scholar] [CrossRef] [PubMed]
- Marini, E.; Buffa, R.; Saragat, B.; Coin, A.; Toffanello, E.; Berton, L.; Manzato, E.; Sergi, G. The potential of classic and specific bioelectrical impedance vector analysis for the assessment of sarcopenia and sarcopenic obesity. Clin. Interv. Aging 2012, 7, 585–591. [Google Scholar] [CrossRef] [PubMed] [Green Version]
- Schwenk, A.; Beisenherz, A.; Romer, K.; Kremer, G.; Salzberger, B.; Elia, M. Phase angle from bioelectrical impedance analysis remains an independent predictive marker in HIV-infected patients in the era of highly active antiretroviral treatment. Am. J. Clin. Nutr. 2000, 72, 496–501. [Google Scholar] [PubMed]
- Wirth, R.; Volkert, D.; Rosler, A.; Sieber, C.C.; Bauer, J.M. Bioelectric impedance phase angle is associated with hospital mortality of geriatric patients. Arch. Gerontol. Geriatr. 2010, 51, 290–294. [Google Scholar] [CrossRef] [PubMed]
- Chertow, G.; Jacobs, D.; Lazarus, J.M.; Lew, N.; Lowrie, E. Phase angle predicts survival in hemodialysis patients. J. Ren. Nutr. 1997, 7, 204–207. [Google Scholar] [CrossRef]
- McGregor, R.A.; Cameron-Smith, D.; Poppitt, S.D. It is not just muscle mass: A review of muscle quality, composition and metabolism during ageing as determinants of muscle function and mobility in later life. Longev. Healthspan 2014, 3, 9. [Google Scholar] [CrossRef] [PubMed]
- Rothenberg, E.; Dahlin-Ivanoff, S.; Lindblad, A.; Bosaeus, I. Body composition and hand grip strength in healthy community-dwelling older adults in Sweden. J. Aging Res. Clin. Pract. 2015, 4, 54–58. [Google Scholar]
- Abe, T.; Thiebaud, R.S.; Loenneke, J.P. Age-related change in handgrip strength in men and women: Is muscle quality a contributing factor? Age (Dordr) 2016, 38, 28. [Google Scholar] [CrossRef] [PubMed]
- Rolland, Y.; Czerwinski, S.; Abellan, G.; Kan, V.; Morley, J.E.; Cesari, M.; Onder, G.; Woo, J.; Baumgartner, R.; Pillard, F.; et al. Sarcopenia: Its assessment, etiology, pathogenesis, consequences and future perspectives. J. Nutr. Health Aging 2008, 12, 433–450. [Google Scholar] [CrossRef] [PubMed]
- Fukuda, D.H.; Stout, J.R.; Moon, J.R.; Smith-Ryan, A.E.; Kendall, K.L.; Hoffman, J.R. Effects of resistance training on classic and specific bioelectrical impedance vector analysis in elderly women. Exp. Gerontol. 2015, 2, 9–12. [Google Scholar] [CrossRef] [PubMed]
- Buffa, R.; Mereu, E.; Comandini, O.; Ibanez, M.E.; Marini, E. Bioelectrical impedance vector analysis (BIVA) for the assessment of two-compartment body composition. Eur. J. Clin. Nutr. 2014, 68, 1234–1240. [Google Scholar] [CrossRef] [PubMed]
- Rodríguez, R.F.J.; Almagià, F.A.A.; Berral, R.F.J. Estimación de la masa muscular de los miembros apendiculares, a partir de densitometría fotónica dual (DEXA). Int. J. Morphol. 2010, 28, 1205–1210. [Google Scholar] [CrossRef]
- Shafer, K.J.; Siders, W.A.; Johnson, L.K.; Lukaski, H.C. Validity of segmental multiple-frequency bioelectrical impedance analysis to estimate body composition of adults across a range of body mass indexes. Nutrition. 2009, 25, 25–32. [Google Scholar] [CrossRef] [PubMed]
- Hsieh, K.; Kao, M.; Jang, T.; Lin, W.; Lu, H.; Chen, Y. Estimation of segmental fat free mass in Taiwanese elderly females by bioelectrical impedance analysis with new mathematical model. Afr. J. Biotechnol. 2011, 10, 17339–17346. [Google Scholar]
- Franco-Villoria, M.; Wright, C.M.; McColl, J.H.; Sherriff, A.; Pearce, M.S.; the Gateshead Millennium Study core team. Assessment of adult body composition using bioelectrical impedance: Comparison of researcher calculated to machine outputted values. BMJ Open 2016, 6, e008922. [Google Scholar] [CrossRef] [PubMed]


| MF | n | ht | W | BMI | HG | HG/W | Total Body Water | Extra Cellular Water | Hydration | Phase Angle | R | Xc | R/ht | Xc/ht | R Sp | Xc Sp | r |
|---|---|---|---|---|---|---|---|---|---|---|---|---|---|---|---|---|---|
| m | kg | Kg/m2 | kg | L | L | % | ° | Ω | Ω | cm2/Ω | cm2/Ω | cm/Ω | cm/Ω | ||||
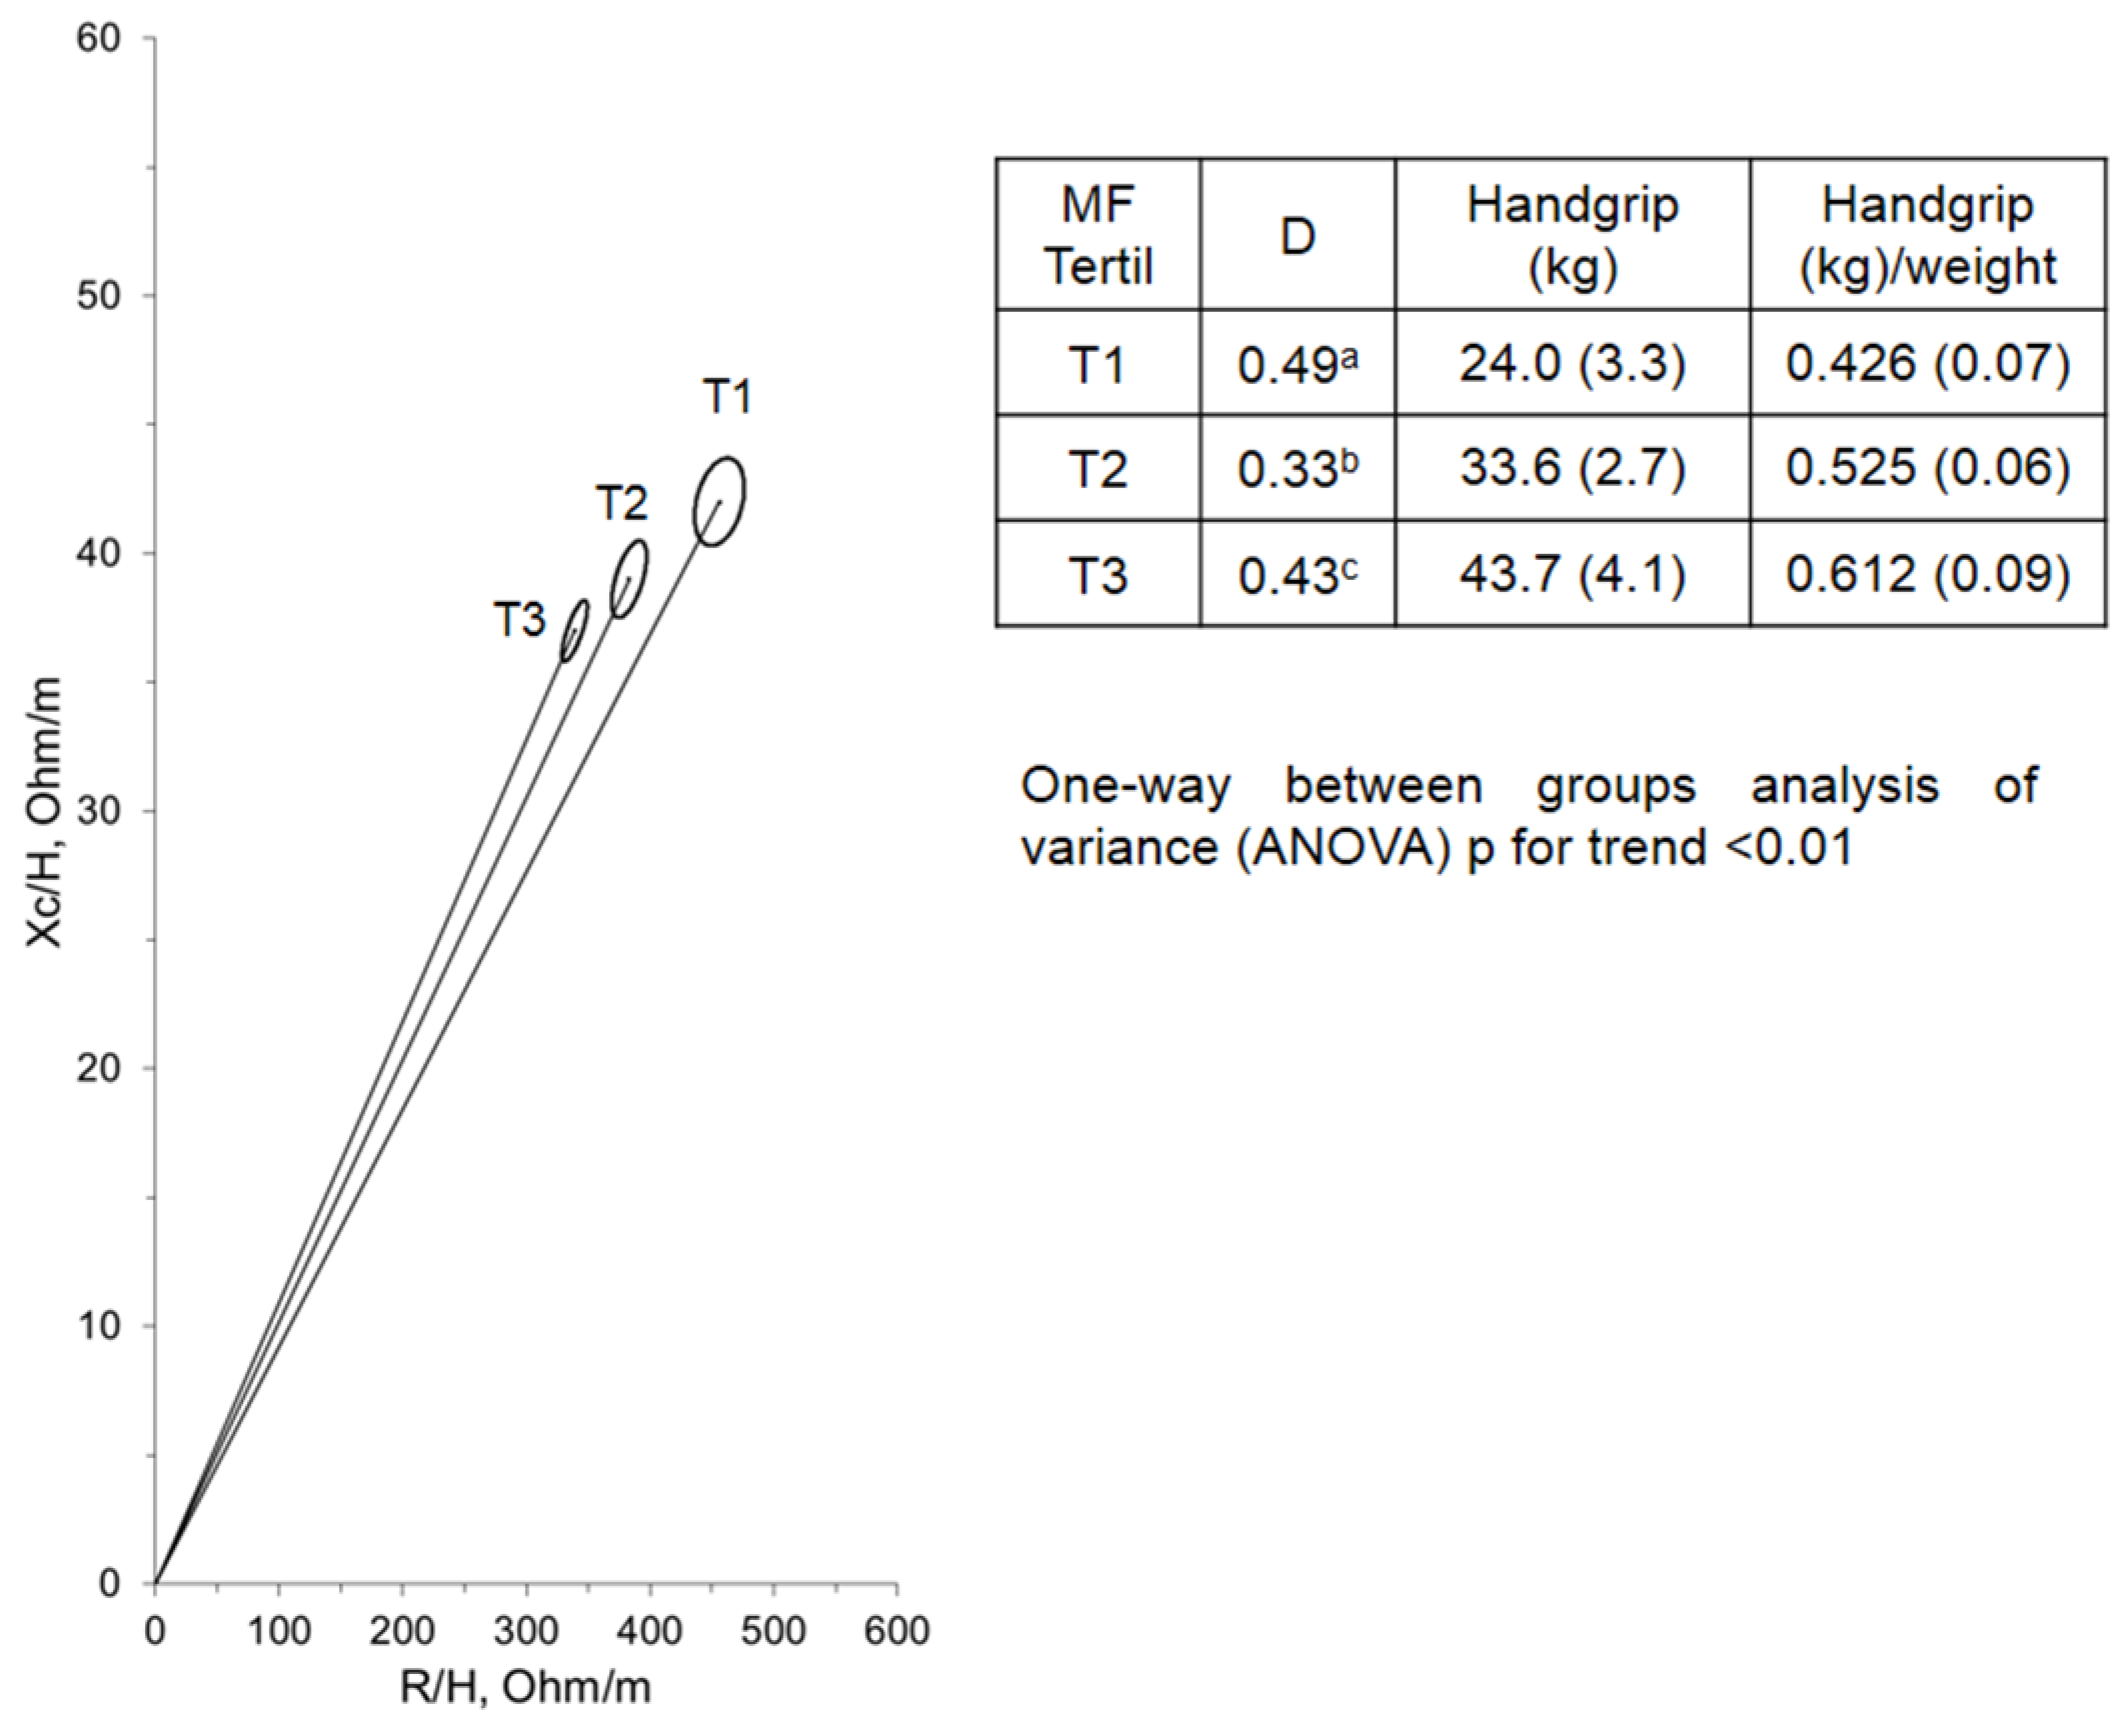
| Tertile 1 (low HG) | 79 | 1.60 (0.06) † | 57.5 (8.7) † | 22.3 (3.0) | 24.0 (3.3) † | 0.426 (0.07) † | 32.2 (6.1) † | 13.5 (2.2) | 73.3 (6.1) † | 5.2 (0.6) † | 732.9 (109.6) | 68.8 (9.2) † | 456.7 (71.0) † | 42.9 (6.3) † | 488.0 (46.8) † | 32.8 (9.2) † | 0.33 |
| Tertile 2 (medium HG) | 71 | 1.69 (0.05) ‡ | 64.8 (9.7) ‡ | 22.6 (3.0) | 33.6 (2.7) ‡ | 0.525 (0.06) ‡ | 35.1 (8.0) ‡ | 14.1 (2.9) ‡ | 68.4 (6.0) ‡ | 5.9 (0.6) ‡ | 647.6 (69.6) | 66.8 (7.3) ‡ | 383.8 (47.2) ‡ | 39.5 (4.7) ‡ | 402.8 (51.7) ‡ | 45.5 (8.8) ‡ | 0.59 |
| Tertile 3 (high HG) | 73 | 1.72 (0.03) * | 72.7 (10.2) * | 23.6 (2.7) * | 43.7 (4.1) * | 0.612 (0.09) * | 36.4 (7.3) * | 15.3 (1.8) * | 64.4 (64.2) * | 6.2 (0.4) * | 592.0 (54.9) * | 64.7 (7.0) * | 339.0 (35.3) * | 37.1 (4.6) * | 477.1 (55.7) * | 55.2 (10.3) * | 0.78 |
| Total | 223 | 1.68 (0.08) | 65.0 (11.3) | 22.8 (2.9) | 33.8 (8.7) | 0.52 (0.10) | 36.4 (7.3) | 14.6 (2.4) | 67.3 (6.2) | 5.8 (0.7) | 659.6 (99.1) | 66.8 (8.1) | 395.0 (72.8) | 39.9 (5.8) | 428 (45.8) | 45.3 (10.9) | 0.66 |
© 2016 by the authors; licensee MDPI, Basel, Switzerland. This article is an open access article distributed under the terms and conditions of the Creative Commons Attribution (CC-BY) license (http://creativecommons.org/licenses/by/4.0/).
Share and Cite
Rodríguez-Rodríguez, F.; Cristi-Montero, C.; González-Ruíz, K.; Correa-Bautista, J.E.; Ramírez-Vélez, R. Bioelectrical Impedance Vector Analysis and Muscular Fitness in Healthy Men. Nutrients 2016, 8, 407. https://0-doi-org.brum.beds.ac.uk/10.3390/nu8070407
Rodríguez-Rodríguez F, Cristi-Montero C, González-Ruíz K, Correa-Bautista JE, Ramírez-Vélez R. Bioelectrical Impedance Vector Analysis and Muscular Fitness in Healthy Men. Nutrients. 2016; 8(7):407. https://0-doi-org.brum.beds.ac.uk/10.3390/nu8070407
Chicago/Turabian StyleRodríguez-Rodríguez, Fernando, Carlos Cristi-Montero, Katherine González-Ruíz, Jorge Enrique Correa-Bautista, and Robinson Ramírez-Vélez. 2016. "Bioelectrical Impedance Vector Analysis and Muscular Fitness in Healthy Men" Nutrients 8, no. 7: 407. https://0-doi-org.brum.beds.ac.uk/10.3390/nu8070407