Associations of Maternal Dietary Patterns during Pregnancy with Offspring Adiposity from Birth Until 54 Months of Age

 , , , ,
Abstract
:1. Introduction
2. Materials and Methods
2.1. Study Design
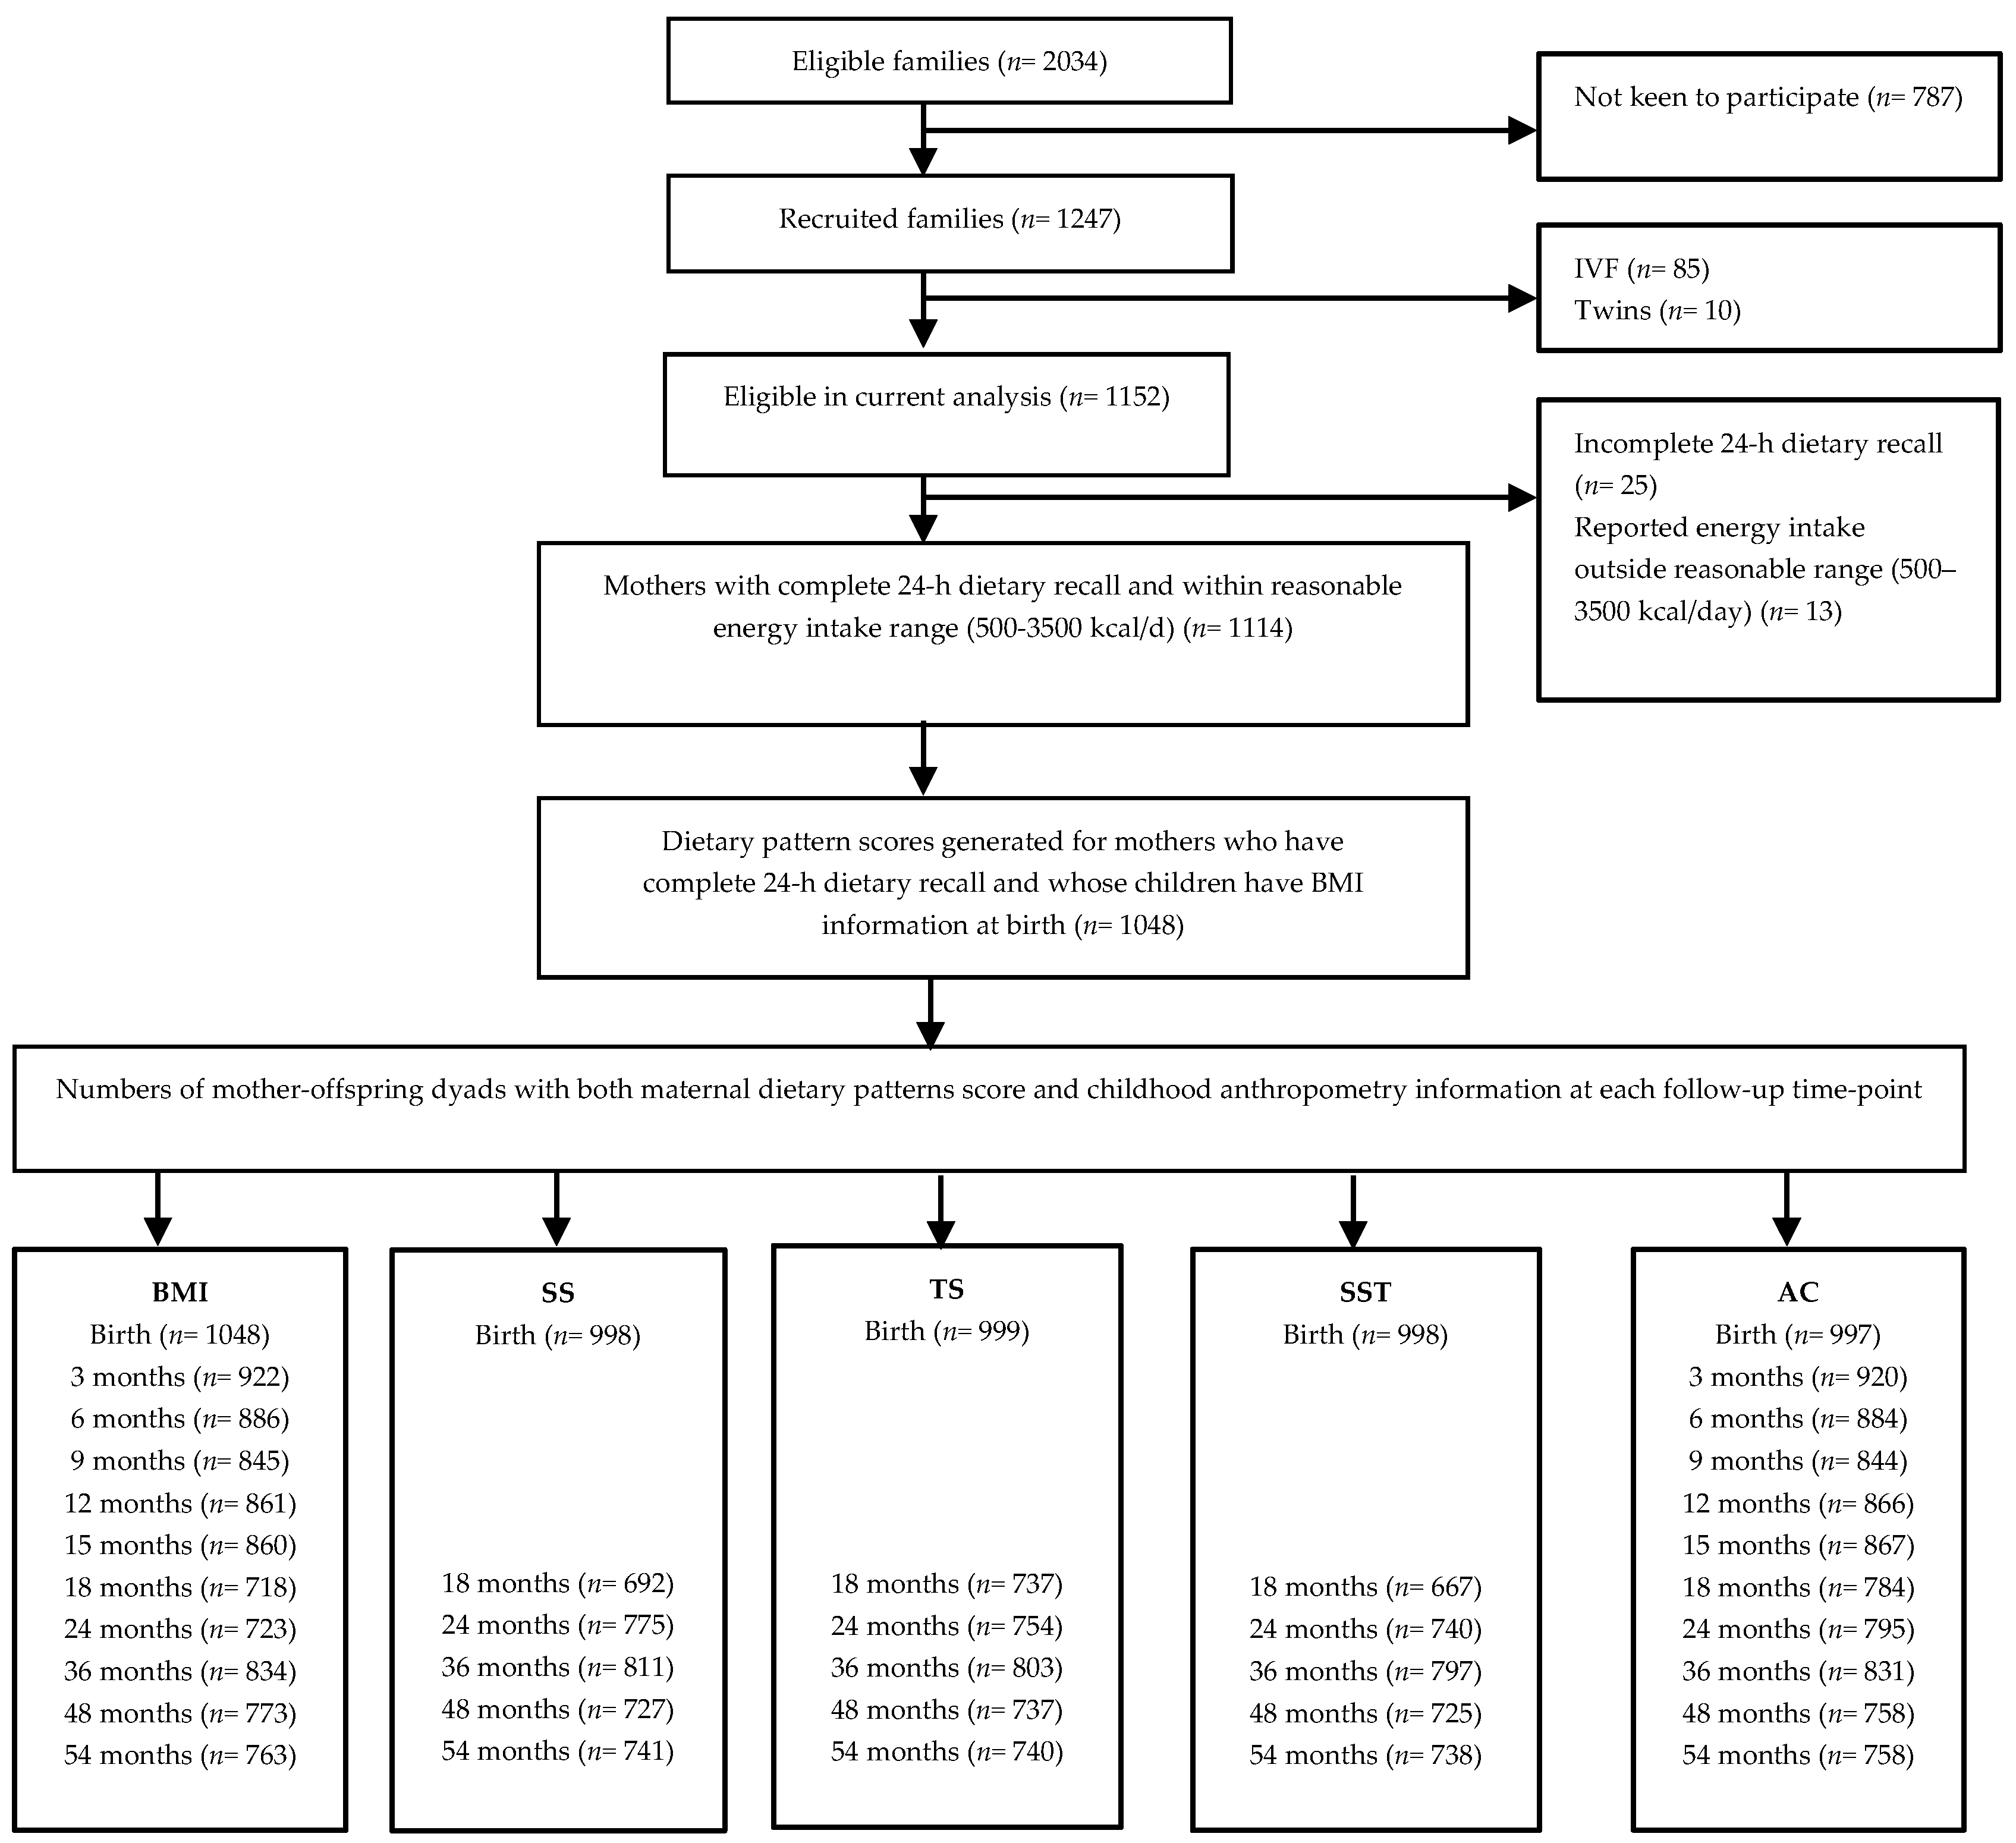
2.2. Subjects
2.3. Maternal Dietary Assessment and Extraction of Dietary Patterns
2.4. Maternal Characteristic
2.5. Child Characteristics
2.6. Statistical Analysis
3. Results
3.1. Maternal and Child Characteristics
3.2. Longitudinal Analysis (LME Models)
3.3. Individual Time-Points Analyses (Multiple Linear Regression Models)
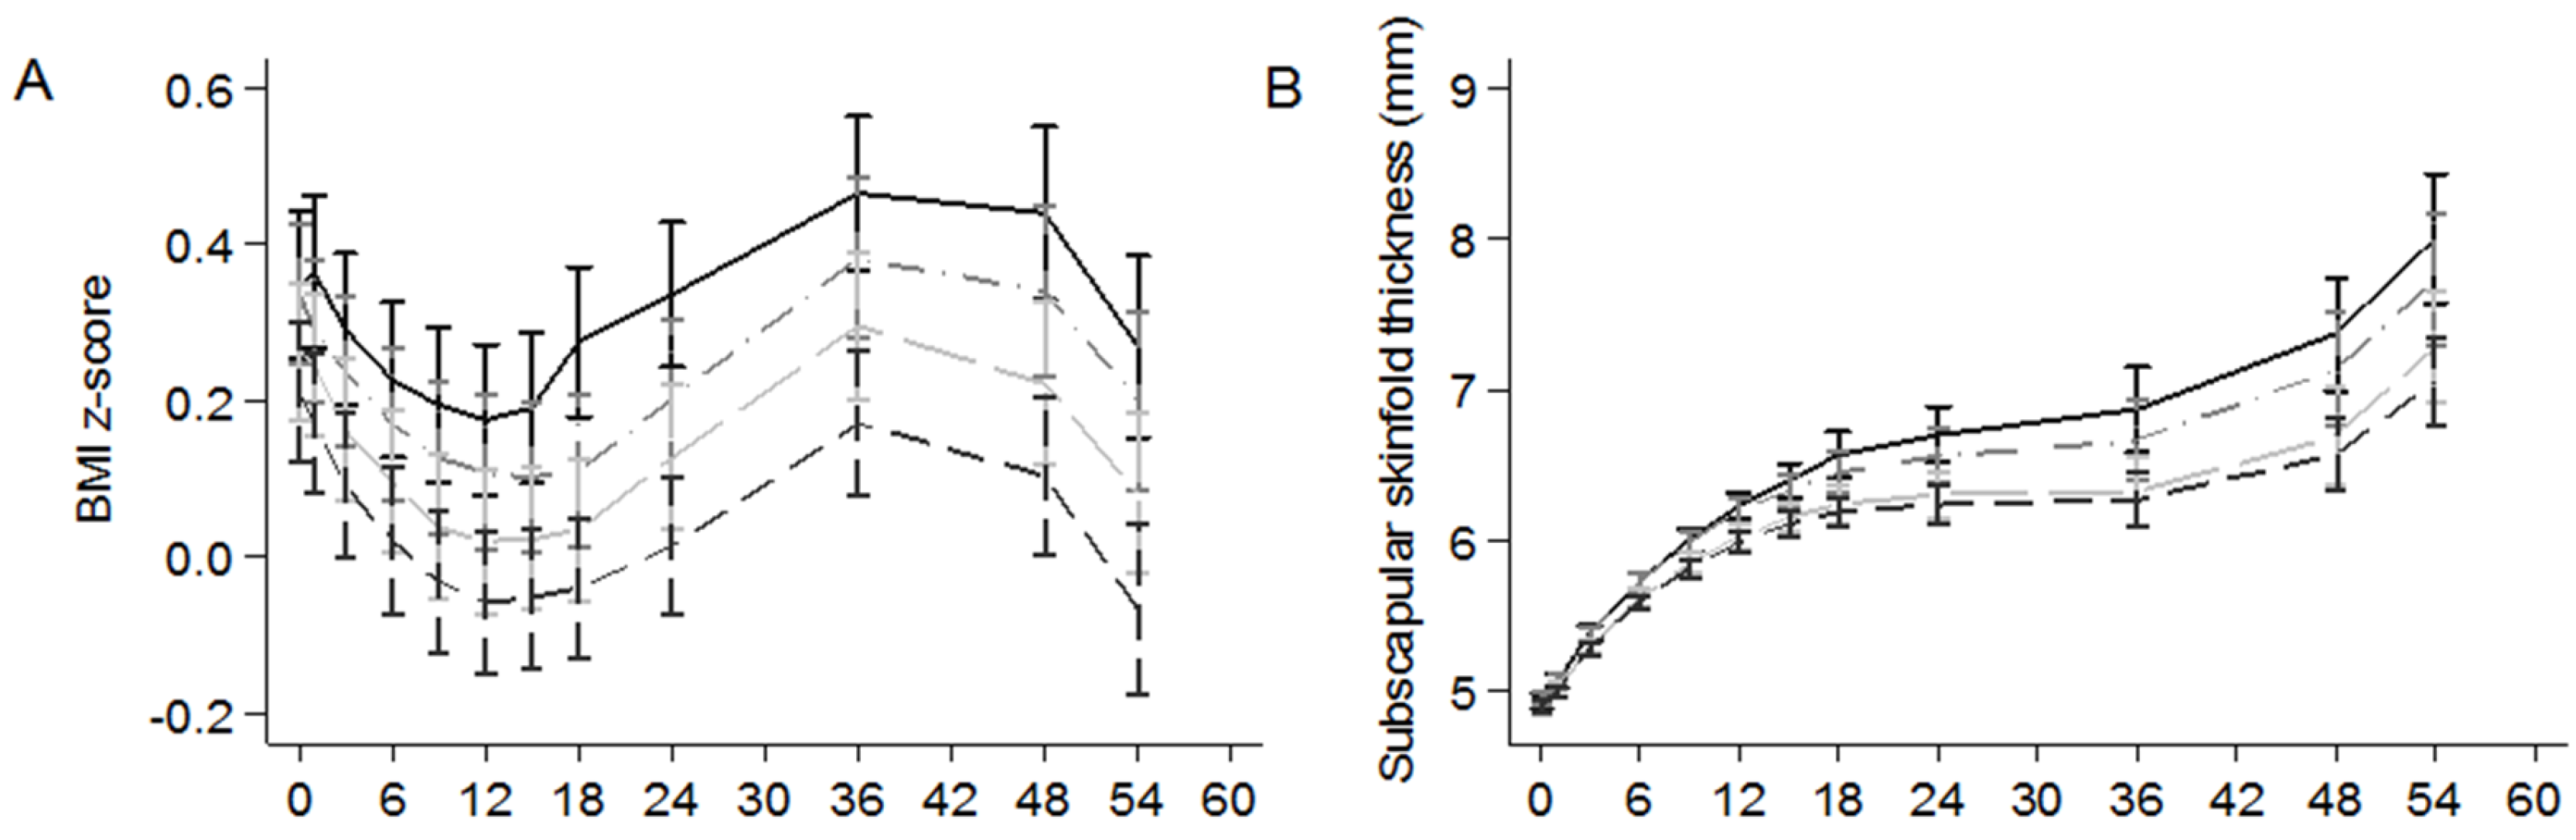
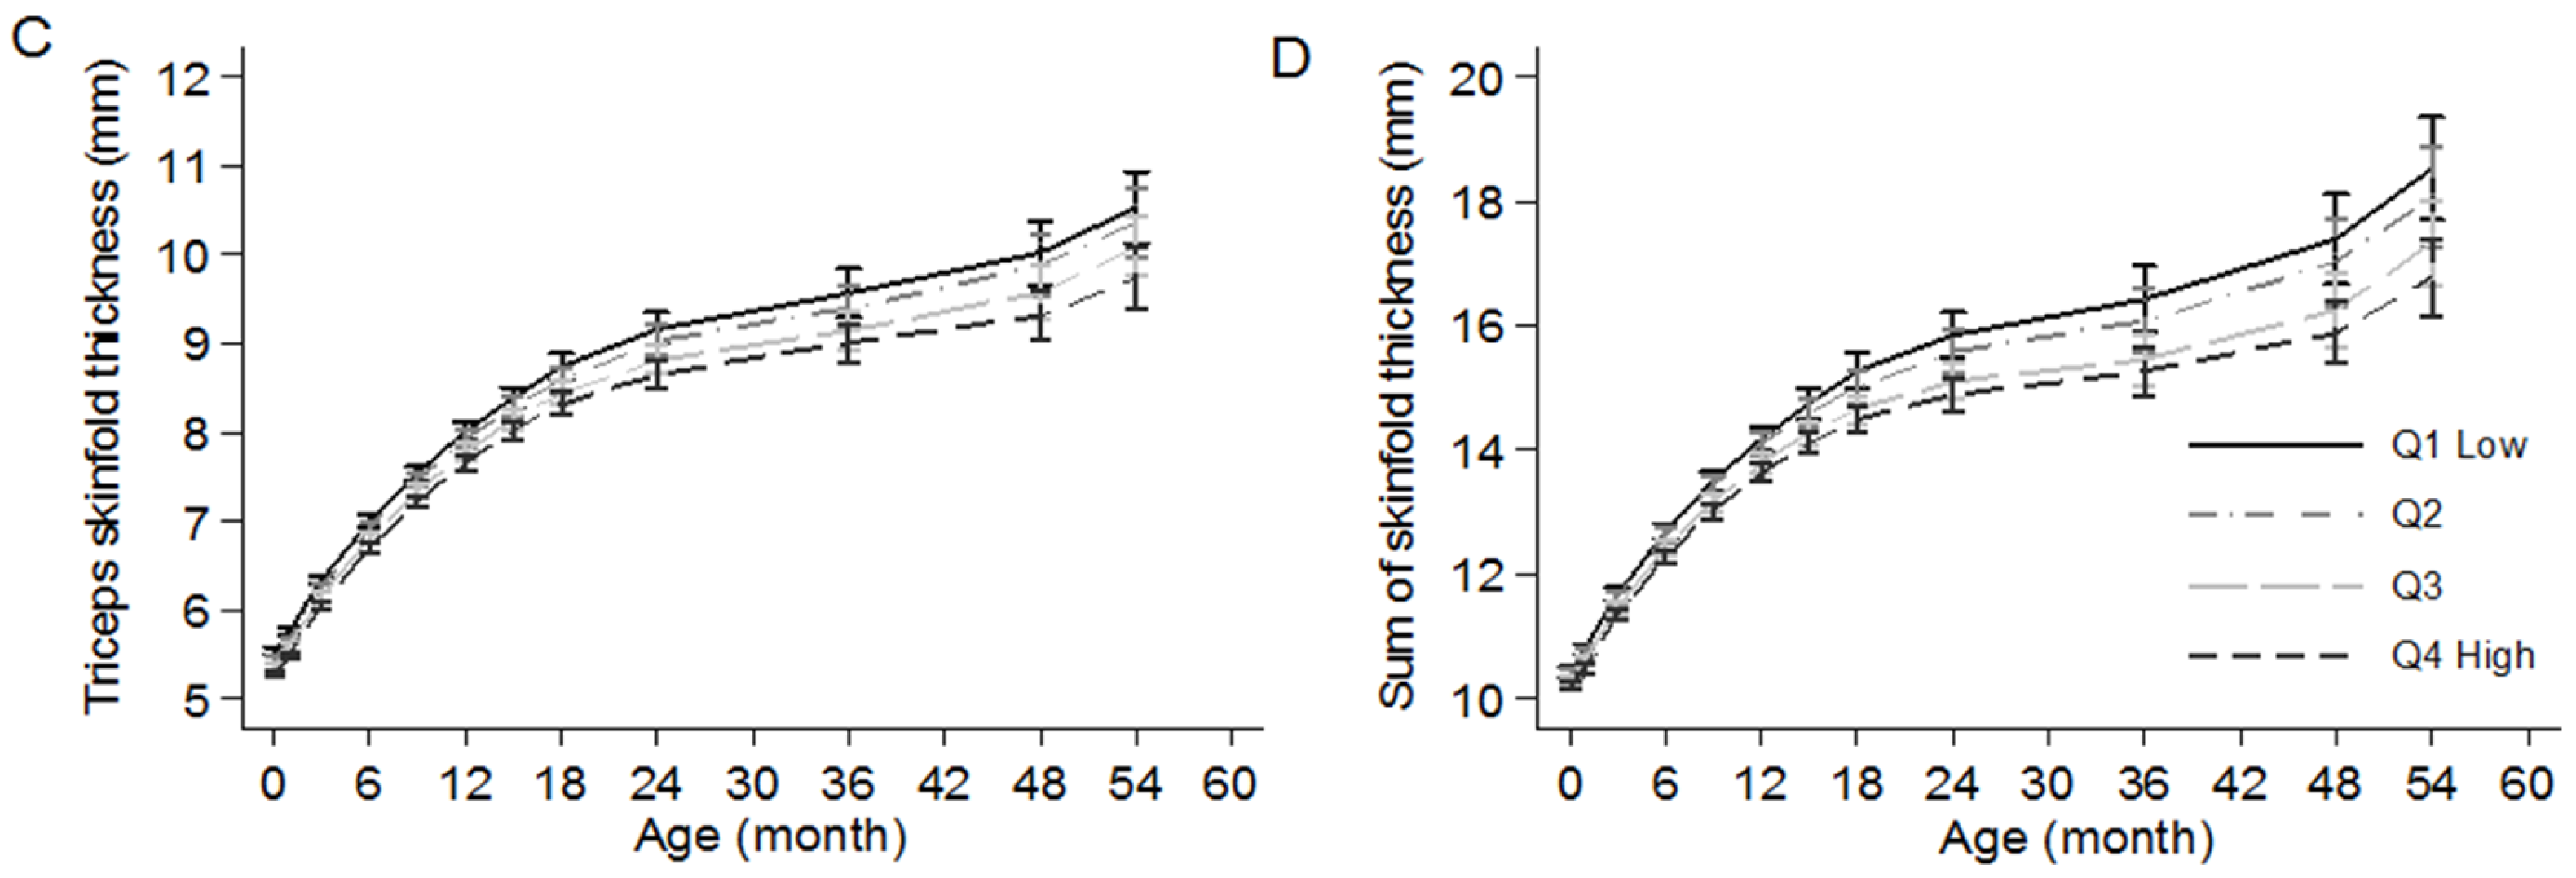
3.4. Associations between Quartiles of Maternal VFR Pattern Score and Childhood Adiposity (LME Models)
4. Discussion
5. Conclusions
Supplementary Materials
Acknowledgments
Author Contributions
Conflicts of Interest
References
- Lobstein, T.; Jackson-Leach, R.; Moodie, M.L.; Hall, K.D.; Gortmaker, S.L.; Swinburn, B.A.; James, W.P.T.; Wang, Y.; McPherson, K. Child and adolescent obesity: Part of a bigger picture. Lancet 2015, 385, 2510–2520. [Google Scholar] [CrossRef]
- The Lancet. The Lancet Managing the tide of childhood obesity. Lancet 2015, 385, 2434. [Google Scholar]
- The United Nations Children’s Fund is a United Nations (UNICEF); World Health Organization (WHO); World Bank. Levels and Trends in Child Malnutrition: UNICEF-WHO-World Bank Joint Child Malnutrition Estimates; UNICEF: New York, NY, USA; WHO: Geneva, Switzerland; World Bank: Washington, DC, USA, 2015. [Google Scholar]
- Nishtar, S.; Gluckman, P.; Armstrong, T. Ending childhood obesity: A time for action. Lancet 2016, 387, 825–827. [Google Scholar] [CrossRef]
- Barker, D.J.P. The origins of the developmental origins theory. J. Intern. Med. 2007, 261, 412–417. [Google Scholar] [CrossRef] [PubMed]
- Gluckman, P.D.; Hanson, M.A.; Cooper, C.; Thornburg, K.L. Effect of in utero and early-life conditions on adult health and disease. N. Engl. J. Med. 2008, 359, 61–73. [Google Scholar] [CrossRef] [PubMed]
- Jackson, A.A.; Burdge, G.C.; Lillicrop, K.A. Diet, nutrition and modulation of genomic expression in fetal origins of adult disease. J. Nutrigenet. Nutrigenom. 2010, 3, 192–208. [Google Scholar] [CrossRef] [PubMed]
- Roseboom, T.J.; Van Der Meulen, J.H.; Osmond, C.; Barker, D.J.; Ravelli, A.C.; Schroeder-Tanka, J.M.; Van Montfrans, G.A.; Michels, R.P.; Bleker, O.P. Coronary heart disease after prenatal exposure to the Dutch famine, 1944–1945. Heart 2000, 84, 595–598. [Google Scholar] [CrossRef] [PubMed]
- Huang, C.; Li, Z.; Wang, M.; Martorell, R. Early life exposure to the 1959–1961 Chinese famine has long-term health consequences. J. Nutr. 2010, 140, 1874–1878. [Google Scholar] [CrossRef] [PubMed]
- Maslova, E.; Rytter, D.; Bech, B.H.; Henriksen, T.B.; Rasmussen, M.A.; Olsen, S.F.; Halldorsson, T.I. Maternal protein intake during pregnancy and offspring overweight 20 y later. Am. J. Clin. Nutr. 2014, 100, 1139–1148. [Google Scholar] [CrossRef] [PubMed]
- Gluckman, P.D.; Beedle, A.S.; Hanson, M.A.; Yap, E.P. Developmental perspectives on individual variation: Implications for understanding nutritional needs. Nestlé Nutr. Workshop Ser. Paediatr. Program. 2008, 62, 1–12. [Google Scholar]
- Hu, F.B. Dietary pattern analysis: A new direction in nutritional epidemiology. Curr. Opin. Lipidol. 2002, 13, 3–9. [Google Scholar] [CrossRef] [PubMed]
- Knudsen, V.K.; Orozova-Bekkevold, I.M.; Mikkelsen, T.B.; Wolff, S.; Olsen, S.F. Major dietary patterns in pregnancy and fetal growth. Eur. J. Clin. Nutr. 2008, 62, 463–470. [Google Scholar] [CrossRef] [PubMed]
- Rasmussen, M.A.; Maslova, E.; Halldorsson, T.I.; Olsen, S.F. Characterization of dietary patterns in the Danish national birth cohort in relation to preterm birth. PLoS ONE 2014, 9, e93644. [Google Scholar] [CrossRef] [PubMed] [Green Version]
- Murrin, M.C.; Heinen, M.M.; Kelleher, C.C. Are dietary patterns of mothers during pregnancy related to children’s weight status? Evidence from the lifeways cross-generational cohort study. AIMS Public Health 2015, 2, 274–296. [Google Scholar] [CrossRef]
- Van den Broek, M.; Leermakers, E.T.; Jaddoe, V.W.; Steegers, E.A.; Rivadeneira, F.; Raat, H.; Hofman, A.; Franco, O.H.; Kiefte-de Jong, J.C. Maternal dietary patterns during pregnancy and body composition of the child at age 6 y: The Generation R Study. Am. J. Clin. Nutr. 2015, 102, 873–880. [Google Scholar] [CrossRef] [PubMed]
- Kurpad, A.V.; Varadharajan, K.S.; Aeberli, I. The thin-fat phenotype and global metabolic disease risk. Curr. Opin. Clin. Nutr. Metab. Care 2011, 14, 542–547. [Google Scholar] [CrossRef] [PubMed]
- Pan, W.-H.; Yeh, W.-T.; Weng, L.-C. Epidemiology of metabolic syndrome in Asia. Asia Pac. J. Clin. Nutr. 2008, 17 (Suppl. 1), 37–42. [Google Scholar] [PubMed]
- Simmons, D.; Williams, D.R.; Powell, M.J. The Coventry Diabetes Study: Prevalence of diabetes and impaired glucose tolerance in Europids and Asians. Q. J. Med. 1991, 81, 1021–1030. [Google Scholar] [CrossRef] [PubMed]
- Soh, S.-E.; Tint, M.T.; Gluckman, P.D.; Godfrey, K.M.; Rifkin-Graboi, A.; Chan, Y.H.; Stünkel, W.; Holbrook, J.D.; Kwek, K.; Chong, Y.-S.; et al. Cohort profile: Growing Up in Singapore Towards healthy Outcomes (GUSTO) birth cohort study. Int. J. Epidemiol. 2014, 43, 1401–1409. [Google Scholar] [CrossRef] [PubMed]
- Tobias, D.K.; Hu, F.B.; Chavarro, J.; Rosner, B.; Mozaffarian, D.; Zhang, C. Healthful dietary patterns and type 2 diabetes mellitus risk among women with a history of gestational diabetes mellitus. Arch. Intern. Med. 2012, 172, 1566–1572. [Google Scholar] [CrossRef] [PubMed]
- Chong, M.F.F.; Chia, A.-R.; Colega, M.; Tint, M.-T.; Aris, I.M.; Chong, Y.-S.; Gluckman, P.; Godfrey, K.M.; Kwek, K.; Saw, S.-M.; et al. Maternal protein intake during pregnancy is not associated with offspring birth weight in a multiethnic Asian population. J. Nutr. 2015, 145, 1303–1310. [Google Scholar] [CrossRef] [PubMed]
- Chen, L.-W.; Tint, M.; Fortier, M.V.; Aris, I.M.; Bernard, J.Y.; Colega, M.; Gluckman, P.D.; Saw, S.; Chong, Y.; Yap, F.; et al. Maternal macronutrient intake during pregnancy is associated with neonatal abdominal adiposity: The Growing Up in Singapore Towards healthy Outcomes (GUSTO). J. Nutr. 2016, 146, 1571–1579. [Google Scholar] [CrossRef] [PubMed]
- Conway, J.M.; Ingwersen, L.A.; Vinyard, B.T.; Moshfegh, A.J. Effectiveness of the US Department of Agriculture 5-step multiple-pass method in assessing food intake in obese and nonobese women. Am. J. Clin. Nutr. 2003, 77, 1171–1178. [Google Scholar] [PubMed]
- Energy & Nutrient Composition Search. Available online: http://focos.hpb.gov.sg/eservices/ENCF/ (accessed on 18 December 2015).
- Hu, F.B.; Rimm, E.B.; Stampfer, M.J.; Ascherio, A.; Spiegelman, D.; Willett, W.C. Prospective study of major dietary patterns and risk of coronary heart disease in men. Am. J. Clin. Nutr. 2000, 72, 912–921. [Google Scholar] [PubMed]
- Meyerhardt, J.A.; Niedzwiecki, D.; Hollis, D.; Saltz, L.B.; Hu, F.B.; Mayer, R.J.; Nelson, H.; Whittom, R.; Hantel, A.; Thomas, J.; et al. Association of dietary patterns with cancer recurrence and survival in patients with stage III colon cancer. JAMA 2007, 298, 754–764. [Google Scholar] [CrossRef] [PubMed]
- Englund-Ogge, L.; Brantsaeter, A.L.; Sengpiel, V.; Haugen, M.; Birgisdottir, B.E.; Myhre, R.; Meltzer, H.M.; Jacobsson, B. Maternal dietary patterns and preterm delivery: Results from large prospective cohort study. BMJ 2014, 348, g1446. [Google Scholar] [CrossRef] [PubMed] [Green Version]
- Lopez-Garcia, E.; Schulze, M.B.; Fung, T.T.; Meigs, J.B.; Rifai, N.; Manson, J.E.; Hu, F.B. Major dietary patterns are related to plasma concentrations of markers of inflammation and endothelial dysfunction. Am. J. Clin. Nutr. 2004, 80, 1029–1035. [Google Scholar] [PubMed]
- Montonen, J.; Knekt, P.; Härkänen, T.; Järvinen, R.; Heliövaara, M.; Aromaa, A.; Reunanen, A. Dietary patterns and the incidence of type 2 diabetes. Am. J. Epidemiol. 2005, 161, 219–227. [Google Scholar] [CrossRef] [PubMed]
- Crozier, S.R.; Inskip, H.M.; Barker, M.E.; Lawrence, W.T.; Cooper, C.; Robinson, S.M. Development of a 20-item food frequency questionnaire to assess a “prudent” dietary pattern among young women in Southampton. Eur. J. Clin. Nutr. 2010, 64, 99–104. [Google Scholar] [CrossRef] [PubMed]
- Odegaard, A.O.; Koh, W.-P.; Yuan, J.-M.; Gross, M.D.; Pereira, M.A. Dietary patterns and mortality in a Chinese population. Am. J. Clin. Nutr. 2014, 100, 877–883. [Google Scholar] [CrossRef] [PubMed]
- Chia, A.-R.; de Seymour, J.V.; Colega, M.; Chen, L.-W.; Chan, Y.-H.; Aris, I.M.; Tint, M.-T.; Quah, P.L.; Godfrey, K.M.; Yap, F.; et al. A vegetable, fruit, and white rice dietary pattern during pregnancy is associated with a lower risk of preterm birth and larger birth size in a multiethnic Asian cohort: The Growing Up in Singapore Towards healthy Outcomes (GUSTO) study. Am. J. Clin. Nutr. 2016, 104, 1416–1423. [Google Scholar] [CrossRef] [PubMed]
- De Seymour, J.; Chia, A.; Colega, M.; Jones, B.; McKenzie, E.; Shirong, C.; Godfrey, K.; Kwek, K.; Saw, S.-M.; Conlon, C.; et al. Maternal dietary patterns and gestational diabetes mellitus in a multi-ethnic Asian cohort: The GUSTO study. Nutrients 2016, 8, 574. [Google Scholar] [CrossRef] [PubMed]
- Alberti, K.G.; Zimmet, P.Z. Definition, diagnosis and classification of diabetes mellitus and its complications. Part 1: Diagnosis and classification of diabetes mellitus provisional report of a WHO consultation. Diabet. Med. 1998, 15, 539–553. [Google Scholar] [CrossRef]
- Chong, Y.-S.; Cai, S.; Lin, H.; Soh, S.E.; Lee, Y.-S.; Leow, M.K.-S.; Chan, Y.-H.; Chen, L.; Holbrook, J.D.; Tan, K.-H.; et al. Ethnic differences translate to inadequacy of high-risk screening for gestational diabetes mellitus in an Asian population: A cohort study. BMC Pregnancy Childbirth 2014, 14, 345. [Google Scholar] [CrossRef] [PubMed]
- Hamilton, C.M.; Strader, L.C.; Pratt, J.G.; Maiese, D.; Hendershot, T.; Kwok, R.K.; Hammond, J.A.; Huggins, W.; Jackman, D.; Pan, H.; et al. The PhenX Toolkit: Get the most from your measures. Am. J. Epidemiol. 2011, 174, 253–260. [Google Scholar] [CrossRef] [PubMed]
- National Healthcare Group Polyclinics. Age and Gender-Specific National BMI Cut-Offs (Singapore); National Healthcare Group Polyclinics: Singapore, 2010. [Google Scholar]
- Finucane, M.M.; Samet, J.H.; Horton, N.J. Translational methods in biostatistics: Linear mixed effect regression models of alcohol consumption and HIV disease progression over time. Epidemiol. Perspect. Innov. 2007, 4, 8. [Google Scholar] [CrossRef] [PubMed]
- Chamson-Reig, A.; Thyssen, S.M.; Hill, D.J.; Arany, E. Exposure of the pregnant rat to low protein diet causes impaired glucose homeostasis in the young adult offspring by different mechanisms in males and females. Exp. Biol. Med. (Maywood) 2009, 234, 1425–1436. [Google Scholar] [CrossRef] [PubMed]
- Theys, N.; Bouckenooghe, T.; Ahn, M.-T.; Remacle, C.; Reusens, B. Maternal low-protein diet alters pancreatic islet mitochondrial function in a sex-specific manner in the adult rat. Am. J. Physiol. Regul. Integr. Comp. Physiol. 2009, 297, R1516–R1525. [Google Scholar] [CrossRef] [PubMed]
- Gale, C.; Logan, K.; Jeffries, S.; Parkinson, J.; Santhakumaran, S.; Uthaya, S.; Durighel, G.; Alavi, A.; Thomas, E.; Bell, J.; et al. Sexual dimorphism in relation to adipose tissue and intrahepatocellular lipid deposition in early infancy. Int. J. Obes. 2015, 39, 629–632. [Google Scholar] [CrossRef] [PubMed]
- Haugaard, L.K.; Ajslev, T.A.; Zimmermann, E.; Ängquist, L.; Sørensen, T.I.A.; Bruch, H.; Touraine, G.; Ravelli, G.; Belmont, L.; Wang, H.; et al. Being an only or last-born child increases later risk of obesity. PLoS ONE 2013, 8, e56357. [Google Scholar] [CrossRef] [PubMed]
- Ochiai, H.; Shirasawa, T.; Ohtsu, T.; Nishimura, R.; Morimoto, A.; Obuchi, R.; Hoshino, H.; Tajima, N.; Kokaze, A. Number of siblings, birth order, and childhood overweight: A population-based cross-sectional study in Japan. BMC Public Health 2012, 12, 766. [Google Scholar] [CrossRef] [PubMed]
- Mikolajczyk, R.T.; Zhang, J.; Betran, A.P.; Souza, J.P.; Mori, R.; Gülmezoglu, A.M.; Merialdi, M. A global reference for fetal-weight and birthweight percentiles. Lancet 2011, 377, 1855–1861. [Google Scholar] [CrossRef]
- Vioque, J.; Weinbrenner, T.; Castelló, A.; Asensio, L.; Garcia De La Hera, M. Intake of fruits and vegetables in relation to 10-year weight gain among Spanish adults. Obesity (Silver Spring) 2008, 16, 664–670. [Google Scholar] [CrossRef] [PubMed]
- He, K.; Hu, F.B.; Colditz, G.A.; Manson, J.E.; Willett, W.C.; Liu, S. Changes in intake of fruits and vegetables in relation to risk of obesity and weight gain among middle-aged women. Int. J. Obes. Relat. Metab. Disord. 2004, 28, 1569–1574. [Google Scholar] [CrossRef] [PubMed]
- Epstein, L.H.; Paluch, R.A.; Beecher, M.D.; Roemmich, J.N. Increasing healthy eating vs. reducing high energy-dense foods to treat pediatric obesity. Obesity (Silver Spring) 2008, 16, 318–326. [Google Scholar] [CrossRef] [PubMed]
- Wang, Y.; Ge, K.; Popkin, B.M. Why do some overweight children remain overweight, whereas others do not? Public Health Nutr. 2003, 6, 549–558. [Google Scholar] [CrossRef] [PubMed]
- Rolls, B.J.; Ello-Martin, J.A.; Tohill, B.C. What can intervention studies tell us about the relationship between fruit and vegetable consumption and weight management? Nutr. Rev. 2004, 62, 1–17. [Google Scholar] [CrossRef] [PubMed]
- Pereira, M.A.; Kartashov, A.I.; Ebbeling, C.B.; Van Horn, L.; Slattery, M.L.; Jacobs, D.R.; Ludwig, D.S. Fast-food habits, weight gain, and insulin resistance (the CARDIA study): 15-year prospective analysis. Lancet 2005, 365, 36–42. [Google Scholar] [CrossRef]
- Bowman, S.A.; Vinyard, B.T. Fast food consumption of U.S. adults: Impact on energy and nutrient intakes and overweight status. J. Am. Coll. Nutr. 2004, 23, 163–168. [Google Scholar] [CrossRef] [PubMed]
- Ong, Z.Y.; Muhlhausler, B.S. Maternal “junk-food” feeding of rat dams alters food choices and development of the mesolimbic reward pathway in the offspring. FASEB J. 2011, 25, 2167–2179. [Google Scholar] [CrossRef] [PubMed]
- Lillycrop, K.A.; Phillips, E.S.; Jackson, A.A.; Hanson, M.A.; Burdge, G.C. Dietary protein restriction of pregnant rats induces and folic acid supplementation prevents epigenetic modification of hepatic gene expression in the offspring. J. Nutr. 2005, 135, 1382–1386. [Google Scholar] [PubMed]
- Buescher, J.L.; Musselman, L.P.; Wilson, C.A.; Lang, T.; Keleher, M.; Baranski, T.J.; Duncan, J.G. Evidence for transgenerational metabolic programming in Drosophila. Dis. Model Mech. 2013, 6, 1123–1132. [Google Scholar] [CrossRef] [PubMed]
- Gaillard, R.; Rifas-Shiman, S.L.; Perng, W.; Oken, E.; Gillman, M.W. Maternal inflammation during pregnancy and childhood adiposity. Obesity (Silver Spring) 2016, 24, 1320–1327. [Google Scholar] [CrossRef] [PubMed]
- Sen, S.; Simmons, R.A. Maternal antioxidant supplementation prevents adiposity in the offspring of Western diet-fed rats. Diabetes 2010, 59, 3058–3065. [Google Scholar] [CrossRef] [PubMed]
- Holt, E.M.; Steffen, L.M.; Moran, A.; Basu, S.; Steinberger, J.; Ross, J.A.; Hong, C.-P.; Sinaiko, A.R. Fruit and vegetable consumption and its relation to markers of inflammation and oxidative stress in adolescents. J. Am. Diet. Assoc. 2009, 109, 414–421. [Google Scholar] [CrossRef] [PubMed]
- Giugliano, D.; Ceriello, A.; Esposito, K. The effects of diet on inflammation: Emphasis on the metabolic syndrome. J. Am. Coll. Cardiol. 2006, 48, 677–685. [Google Scholar] [CrossRef] [PubMed]
- Toro-Ramos, T.; Paley, C.; Pi-Sunyer, F.X.; Gallagher, D. Body composition during fetal development and infancy through the age of 5 years. Eur. J. Clin. Nutr. 2015, 69, 1279–1289. [Google Scholar] [CrossRef] [PubMed]
- Slater-Jefferies, J.L.; Lillycrop, K.A.; Townsend, P.A.; Torrens, C.; Hoile, S.P.; Hanson, M.A.; Burdge, G.C. Feeding a protein-restricted diet during pregnancy induces altered epigenetic regulation of peroxisomal proliferator-activated receptor-α in the heart of the offspring. J. Dev. Orig. Health Dis. 2011, 2, 250–255. [Google Scholar] [CrossRef] [PubMed]
- Crozier, S.R.; Robinson, S.M.; Godfrey, K.M.; Cooper, C.; Inskip, H.M. Women’s dietary patterns change little from before to during pregnancy. J. Nutr. 2009, 139, 1956–1963. [Google Scholar] [CrossRef] [PubMed]
- Cuco, G.; Fernandez-Ballart, J.; Sala, J.; Viladrich, C.; Iranzo, R.; Vila, J.; Arija, V. Dietary patterns and associated lifestyles in preconception, pregnancy and postpartum. Eur. J. Clin. Nutr. 2006, 60, 364–371. [Google Scholar] [CrossRef] [PubMed]


| Food or Food Groups | VFR | SfN | PCB |
|---|---|---|---|
| Cruciferous, leafy-green and dark-yellow vegetables | 0.52 * | - | - |
| Other vegetables 2 | 0.45 * | - | - |
| Fruits | 0.37 * | - | - |
| White rice | 0.31 * | −0.40 | - |
| Non-fried red meat | 0.26 | - | - |
| Flavored rice 3 | −0.27 | - | - |
| Red meat and poultry (deep fried/in curry) | −0.29 | - | - |
| Sweetened drinks 4 | −0.29 | - | - |
| Hamburger | −0.35 | - | - |
| Carbonated drinks | −0.35 | - | - |
| Fried potatoes | −0.44 | - | - |
| Soup | - | 0.46 * | - |
| Fish and seafood products | - | 0.40 * | - |
| Flavored noodles 5 | - | 0.38 * | - |
| Noodles (in soup) | - | 0.37 * | - |
| Non-fried red meat | - | 0.37 | - |
| Soya sauce based gravies | - | 0.31 | - |
| Seafood | - | 0.29 | - |
| Curry based gravies | - | −0.30 | - |
| Legumes and pulses | - | −0.37 | - |
| Ethnic bread 6 | - | −0.44 | - |
| Pasta | - | - | 0.56 * |
| Tomato based gravies | - | - | 0.56 * |
| Cheese | - | - | 0.51 * |
| White bread | - | - | 0.46 * |
| Margarine and peanut butter | - | - | 0.32 |
| Cream based gravies | - | - | 0.31 |
| Low fat milk | - | - | 0.30 |
| Whole-grain bread | - | - | 0.26 |
| All (n = 1048) | Vegetables-Fruit-and-White Rice | Seafood-and-Noodles | Pasta-Cheese-and-Bread | |||||||
|---|---|---|---|---|---|---|---|---|---|---|
| Q1 (n = 262) | Q4 (n = 262) | p-Trend | Q1 (n = 262) | Q4 (n = 262) | p-Trend | Q1 (n = 261) | Q4 (n = 262) | p-Trend | ||
| Maternal characteristics | ||||||||||
| Age, year | 30.5 ± 5.1 | 28.4 ± 5.1 | 32.1 ± 4.8 | <0.001 | 30.6 ± 5.3 | 30.9 ± 4.8 | 0.53 | 30.1 ± 5.0 | 30.8 ± 5.3 | 0.40 |
| Height, cm | 158.2 ± 5.6 | 157.7 ± 5.1 | 158.1 ± 5.8 | 0.35 | 157.4 ± 5.4 | 158.7 ± 5.5 | 0.010 | 157.8 ± 5.3 | 158.6 ± 5.6 | 0.19 |
| Pre-pregnancy BMI, kg/m2 | 22.7 ± 4.4 | 22.8 ± 4.6 | 22.2 ± 3.7 | 0.07 | 23.4 ± 4.5 | 21.9 ± 4.0 | <0.001 | 22.5 ± 4.1 | 22.7 ± 4.5 | 0.97 |
| Weight gain till 26 weeks, kg | 8.6 ± 4.4 | 8.9 ± 4.5 | 8.5 ± 4.0 | 0.12 | 8.2 ± 4.0 | 8.9 ± 4.2 | 0.09 | 8.8 ± 4.3 | 8.7 ± 4.3 | 0.91 |
| Ethnicity | <0.001 | <0.001 | 0.45 | |||||||
| Chinese | 580 (55.3%) | 97 (37.0%) | 197 (75.2%) | 69 (26.3%) | 211 (80.5%) | 138 (52.9%) | 153 (58.4%) | |||
| Malay | 275 (26.2%) | 135 (51.5%) | 18 (6.9%) | 62 (23.7%) | 45 (17.2%) | 81 (31.0%) | 74 (28.2%) | |||
| Indian | 193 (18.4%) | 30 (11.5%) | 47 (17.9%) | 131 (50.0%) | 6 (2.3%) | 42 (16.1%) | 35 (13.4%) | |||
| Education status | <0.001 | 0.06 | 0.012 | |||||||
| Primary/secondary | 319 (30.4%) | 94 (35.9%) | 65 (24.8%) | 69 (26.3%) | 83 (31.7%) | 99 (37.9%) | 66 (25.2%) | |||
| Post-secondary | 384 (36.6%) | 114 (43.5%) | 81 (30.9%) | 86 (32.8%) | 94 (35.9%) | 92 (35.3%) | 106 (40.5%) | |||
| University | 345 (32.9%) | 54 (20.6%) | 116 (44.3%) | 107 (40.8%) | 85 (32.4%) | 70 (26.8%) | 90 (34.4%) | |||
| Maternal nutrient intake | ||||||||||
| Energy, kcal/day | 1846 ± 562 | 1945 ± 578 | 1978 ± 530 | 0.37 | 1807 ± 576 | 2017 ± 515 | <0.001 | 1878 ± 579 | 1997 ± 519 | <0.001 |
| Protein, % kcal/day | 15.6 ± 3.8 | 14.9 ± 3.8 | 16.7 ± 4.1 | <0.001 | 15.2 ±3.6 | 16.3 ± 3.8 | <0.001 | 14.4 ± 3.6 | 17.2 ± 3.9 | <0.001 |
| Fat, % kcal/day | 32.5 ± 7.6 | 35.2 ± 7.3 | 31.2 ± 7.7 | <0.001 | 30.2 ± 8.0 | 33.9 ± 7.1 | <0.001 | 33.5 ± 7.6 | 32.8 ± 6.9 | 0.63 |
| Carbohydrate, % kcal/day | 51.9 ± 8.8 | 49.9 ± 8.3 | 52.1 ± 9.4 | 0.014 | 54.7 ± 9.0 | 49.8 ± 8.1 | <0.001 | 53.0 ± 9.3 | 50.0 ± 7.8 | 0.001 |
| Sugar, % kcal/day | 16.1 ± 7.1 | 17.2 ± 7.6 | 14.5 ± 6.3 | <0.001 | 14.1 ± 6.5 | 16.6 ± 6.8 | <0.001 | 16.9 ± 7.3 | 15.5 ± 6.2 | 0.035 |
| Starch, % kcal/day | 33.8 ± 9.6 | 33.9 ± 9.0 | 35.1 ± 10.2 | <0.001 | 38.7 ± 10.6 | 32.2 ± 7.4 | <0.001 | 33.2 ± 8.8 | 32.3 ± 8.5 | 0.07 |
| Dietary fiber, g/1000 kcal | 8.8 ± 4.3 | 7.2 ± 2.7 | 10.7 ± 5.2 | <0.001 | 10.6 ± 6.2 | 8.3 ± 3.1 | <0.001 | 8.4 ± 3.6 | 8.7 ± 4.4 | 0.89 |
| Child characteristics | ||||||||||
| Birth weight, kg | 3.1 ± 0.5 | 3.0 ± 0.5 | 3.1 ± 0.5 | 0.36 | 3.1 ± 0.4 | 3.1 ± 0.5 | 0.06 | 3.1 ± 0.5 | 3.1 ± 0.5 | 0.20 |
| Gestational age at birth, week | 38.7 ± 1.4 | 38.6 ± 1.5 | 38.8 ± 1.4 | 0.48 | 38.8 ± 1.3 | 38.7 ± 1.3 | 0.39 | 38.7 ± 1.4 | 38.8 ± 1.5 | 0.24 |
| Infant sex | 0.32 | 0.10 | 0.60 | |||||||
| Male | 544 (51.9%) | 131 (50.0%) | 142 (54.2%) | 125 (47.7%) | 147 (56.1%) | 130 (49.8%) | 139 (53.1%) | |||
| Female | 504 (48.1%) | 131 (50.0%) | 120 (45.8%) | 137 (52.3%) | 115 (43.9%) | 131 (50.2%) | 123 (47.0%) | |||
| Birth order | 0.004 | 0.014 | 0.23 | |||||||
| First-born | 446 (42.6%) | 128 (48.9%) | 98 (37.4%) | 94 (35.9%) | 119 (45.4%) | 119 (45.6%) | 127 (48.5%) | |||
| Non first-born | 602 (57.4%) | 134 (51.2%) | 164 (62.6%) | 168 (64.1%) | 143 (54.6%) | 142 (54.4%) | 135 (51.5%) | |||
| n | Vegetables-Fruit-and-White Rice | Seafood-and-Noodles | Pasta-Cheese-and-Bread | ||||
|---|---|---|---|---|---|---|---|
| β (95% CI) | p | β (95% CI) | p | β (95% CI) | p | ||
| BMI z-score | |||||||
| Model 1 | 1048 | −0.06 (−0.11, −0.02) 1 | 0.010 | 0.06 (0.01, 0.11) | 0.012 | −0.01 (−0.05, 0.04) | 0.84 |
| Model 2 | 1048 | −0.02 (−0.07, 0.03) | 0.45 | 0.06 (0.01, 0.12) | 0.026 | −0.01 (−0.06, 0.03) | 0.53 |
| Subscapular skinfold, mm | |||||||
| Model 1 | 1034 | −0.04 (−0.10, 0.03) | 0.25 | 0.06 (0.003, 0.12) | 0.039 | −0.001 (−0.06, 0.06) | 0.97 |
| Model 2 | 1034 | −0.04 (−0.11, 0.02) | 0.18 | 0.03 (−0.03, 0.10) | 0.32 | 0.003 (−0.06, 0.06) | 0.92 |
| Triceps skinfold, mm | |||||||
| Model 1 | 1036 | −0.09 (−0.16, −0.02) | 0.008 | 0.04 (−0.03, 0.10) | 0.31 | −0.01 (−0.08, 0.06) | 0.82 |
| Model 2 | 1036 | −0.09 (−0.17, −0.01) | 0.022 | 0.04 (−0.04, 0.12) | 0.38 | −0.004 (−0.07, 0.07) | 0.90 |
| Sum of skinfolds, mm | |||||||
| Model 1 | 1034 | −0.11 (−0.23, 0.01) | 0.08 | 0.10 (−0.02, 0.22) | 0.10 | −0.01 (−0.13, 0.11) | 0.85 |
| Model 2 | 1034 | −0.12 (−0.25, 0.01) | 0.07 | 0.07 (−0.07, 0.21) | 0.31 | −0.003 (−0.12, 0.11) | 0.96 |
| Abdominal circumference, cm | |||||||
| Model 1 | 1039 | 0.17 (0.05, 0.30) | 0.007 | 0.20 (0.08, 0.33) | 0.002 | 0.03 (−0.09, 0.16) | 0.61 |
| Model 2 | 1039 | 0.06 (−0.08, 0.19) | 0.41 | 0.04 (−0.11, 0.18) | 0.63 | −0.02 (−0.14, 0.11) | 0.80 |
© 2016 by the authors; licensee MDPI, Basel, Switzerland. This article is an open access article distributed under the terms and conditions of the Creative Commons Attribution (CC-BY) license (http://creativecommons.org/licenses/by/4.0/).
Share and Cite
Chen, L.-W.; Aris, I.M.; Bernard, J.Y.; Tint, M.-T.; Chia, A.; Colega, M.; Gluckman, P.D.; Shek, L.P.-C.; Saw, S.-M.; Chong, Y.-S.; et al. Associations of Maternal Dietary Patterns during Pregnancy with Offspring Adiposity from Birth Until 54 Months of Age. Nutrients 2017, 9, 2. https://0-doi-org.brum.beds.ac.uk/10.3390/nu9010002
Chen L-W, Aris IM, Bernard JY, Tint M-T, Chia A, Colega M, Gluckman PD, Shek LP-C, Saw S-M, Chong Y-S, et al. Associations of Maternal Dietary Patterns during Pregnancy with Offspring Adiposity from Birth Until 54 Months of Age. Nutrients. 2017; 9(1):2. https://0-doi-org.brum.beds.ac.uk/10.3390/nu9010002
Chicago/Turabian StyleChen, Ling-Wei, Izzuddin M. Aris, Jonathan Y. Bernard, Mya-Thway Tint, Airu Chia, Marjorelee Colega, Peter D. Gluckman, Lynette Pei-Chi Shek, Seang-Mei Saw, Yap-Seng Chong, and et al. 2017. "Associations of Maternal Dietary Patterns during Pregnancy with Offspring Adiposity from Birth Until 54 Months of Age" Nutrients 9, no. 1: 2. https://0-doi-org.brum.beds.ac.uk/10.3390/nu9010002