
Identifying SSR Markers Related to Seed Fatty Acid Content in Perilla Crop (Perilla frutescens L.)


1
Department of Applied Plant Sciences, College of Agriculture and Life Sciences, Kangwon National University, Chuncheon 24341, Korea
2
Interdisciplinary Program in Smart Agriculture, Kangwon National University, Chuncheon 24341, Korea
3
National Agrobiodiversity Center, National Institute of Agricultural Sciences, RDA, Jeonju 54874, Korea
*
Author to whom correspondence should be addressed.
†
These authors contributed equally to this work.
Plants 2021, 10(7), 1404; https://0-doi-org.brum.beds.ac.uk/10.3390/plants10071404
Submission received: 12 June 2021
/
Revised: 7 July 2021
/
Accepted: 7 July 2021
/
Published: 9 July 2021
(This article belongs to the Special Issue Gene Networks in Seeds)
Abstract
:Perilla seed oil has been attracting attention in South Korea as a health food. Five fatty acids of 100 Perilla accessions were identified as follows: palmitic acid (PA) (5.10–9.13%), stearic acid (SA) (1.70–3.99%), oleic acid (OA) (11.1–21.9%), linoleic acid (LA) (10.2–23.4%), and linolenic acid (LNA) (54.3–75.4%). Additionally, the 100 Perilla accessions were divided into two groups (high or low) based on the total fatty acid content (TFAC). By using an association analysis of 40 simple sequence repeat (SSR) markers and the six Perilla seed oil traits in the 100 Perilla accessions, we detected four SSR markers associated with TFAC, five SSR markers associated with LNA, one SSR marker associated with LA, two SSR markers each associated with OA and PA, and four SSR markers associated with SA. Among these SSR markers, four SSR markers (KNUPF14, KNUPF62, KNUPF72, KNUPF85) were all associated with TFAC and LNA. Moreover, two SSR markers (KNUPF62, KNUPF85) were both associated with TFAC, LNA, and OA. Therefore, these SSR markers are considered to be useful molecular markers for selecting useful accessions related to fatty acid contents in Perilla germplasm and for improving the seed oil quality of Perilla crop through marker-assisted selection (MAS) breeding programs.
1. Introduction
Perilla frutescens (L.) Britt. is widely distributed and cultivated in the Himalayan hills and Eastern and Southeast Asian countries, but it is widely cultivated and mainly used in East Asia [1,2,3,4,5]. This species is self-fertilizing and an annual plant of the Lamiaceae family, and it is classified into two cultivated types (or varieties), P. frutescens var. frutescens and var. crispa, based on their morphological characters and use [1,6]. In East Asia, P. frutescens var. frutescens is used as both a seed oil and a leafy vegetable crop (ren in Chinese, dlggae in Korean, and egoma in Japanese), while P. frutescens var. crispa is used in herbal medicine and as a vegetable crop (zisu in Chinese, cha-jo-ki in Korean, and shiso in Japanese) [1,2,3]. Additionally, for centuries in East Asian countries, seed oil of P. frutescens var. frutescens has been used for foods such as cooking oils, such as soybean, rapeseed, corn, and sesame seed oils, and for industrial applications such as ink, paint, waterproofing agent, and varnish [7,8,9,10].
Meanwhile, the seeds of a cultivated type of P. frutescens var. frutescens are a good source of polyunsaturated fatty acids. Perilla seed oil of P. frutescens var. frutescens comprises approximately 40% of Perilla seed mass, and polyunsaturated fatty acids of Perilla seed oil, such as linoleic acid (18:2) and α-linolenic acid (18:3), comprise approximately 80% of Perilla seed oil. These polyunsaturated fatty acids show health benefits and have a slightly higher content than in flaxseed oil and chia seed oil, accounting for more than 60% of the total fatty acids of Perilla seed oil. In addition, Perilla seed oil contains a higher proportion of omega-3 fatty acids (54–64%) than other vegetable oils. Additionally, the omega-6 (linoleic acid) component is usually around 14%, and omega-9 (oleic acid) is also present in Perilla seed oil [11,12,13].
Many researchers have reported that the Perilla seed oil of cultivated P. frutescens var. frutescens contains polyunsaturated fatty acids such as ω-3 fatty acids (alpha-linolenic acid), ω-6 fatty acids (linoleic acid), and ω-9 fatty acids (oleic acid) [14,15,16,17,18]. These are most beneficial to human health in the prevention and control of various diseases such as cardiovascular disorders, cancer, inflammation, rheumatoid arthritis, and mental health conditions. Therefore, the Perilla seed oil of cultivated P. frutescens var. frutescens has attracted attention in South Korea as a health food. This has led to a significant expansion in the cultivation area of cultivated P. frutescens var. frutescens, making it one of the most important crops in South Korea.
To provide successful breeding programs for Perilla in South Korea, information about the seed oil content among Perilla germplasm accessions is very important for the development of Perilla oil varieties using the preserved Perilla genetic resources of the Rural Development Administration Genebank (RDA-Genebank) collection from South Korea. In particular, in order to maximize the efficient utilization of Perilla germplasm resources, it is necessary to accurately evaluate the Perilla germplasm accessions. Recently, DNA molecular marker systems, such as restriction fragment length polymorphisms (RFLPs) [19], randomly amplified polymorphic DNA (RAPD) [20], amplified fragment length polymorphism (AFLP) [21], simple sequence repeat (SSR) [22], and single nucleotide polymorphisms (SNPs) [23], have provided useful information on genetic diversity and relationships, population structure, and association mapping between and within accessions of many crop species and their wild species [24,25,26,27]. Furthermore, in order to develop molecular markers related to agricultural traits following the development of statistical analysis and molecular breeding technology, association mapping was proposed as a method to identify loci related to the inheritance of complex traits in many crop species [28,29]. Among the many molecular marker systems, in particular, the SSR marker system has provided useful information for the analysis of genetic diversity and relationships, population structure, genetic mapping (construct linkage maps), and association mapping in many crop species because of high reproducibility, allelic variation, codominant nature, and abundant crop genomes [22,24,27,30,31]. Recently, in the Perilla crop, SSR primer sets have been developed by many researchers [32,33,34,35,36]. They have successfully analyzed genetic diversity and relationships, population structure, and association mapping among the accessions of cultivated and weedy types of Perilla crop [4,5,26,34,36,37,38,39].
Therefore, in this study, we estimated the content of five fatty acids of Perilla accessions and used Perilla SSR primers to determine the genetic variation and population structure of Perilla accessions that showed high and low values in fatty acid composition. Additionally, we studied association mapping to identify molecular markers related to the content of the five fatty acids in the Perilla accessions, which would allow better accession selection in molecular breeding programs for the development of useful seed oil varieties of Perilla crop using marker-assisted selection (MAS).
2. Results
2.1. Fatty Acid Composition in Perilla Accessions
Table 1 showed the differences in the content of five fatty acids among 100 Perilla accessions collected from South Korea. As a result, the content of the five fatty acids in the 100 Perilla accessions was found to be 5.10–9.13% for PA, 1.70–3.99% for SA, 11.1–21.9% for OA, 10.2–23.4% for LA, and 54.3–75.4% for LNA. In addition, for the two groups of Perilla accessions, the content of the five fatty acids was found to be 6.52–9.13% for PA, 2.56–3.99% for SA, 15.6–21.9% for OA, 10.2–23.4% for LA, and 65.9–75.4% for LNA in the 50 Perilla accessions in Group I (Supplementary Table S1a); and 5.10–7.85% for PA, 1.70–3.53% for SA, 11.1–18.8% for OA, 2.5–22.7% for LA, and 54.3–62.3% for LNA in the 50 Perilla accessions in Group II (Supplementary Table S1b). Among the 100 Perilla accessions used for the analysis, in particular, the IT105801, IT105936, and IT157587 accessions showed the highest TFAC (120%) compared with the other accessions, while the IT117093, IT117133, and IT157549 accessions showed the lowest TFAC (97.3% or less) compared with the other accessions (Table 1).
In addition, for the five fatty acids measured in the 100 Perilla accessions, the content values for PA were in the range of 5.10–9.13%, with an average value of 7.43% and the highest value in the IT157587 accession and the lowest in the IT177137 accession. For SA, the values were in the range of 1.70–3.99%, with an average value of 3.15% and the highest value in the IT157489 accession and the lowest in the IT209222 accession. For OA, the values were in the range of 11.1–21.9%, with an average value of 16.3% and the highest value in the IT117033 accession and the lowest in the IT177137 accession. For LA, the values were in the range of 10.2–23.4%, with an average value of 16.2% and the highest value in the IT157587 accession and the lowest in the IT117015 accession. For LNA, values were in the range of 54.3–75.4%, with an average value of 64.6% and the highest value in the IT117153 accession and the lowest in the IT117015 accession. Furthermore, for TFAC, the values were in the range of 97.1–124.8%, with an average value of 107.6% and the highest value in the IT157587 accession and the lowest in the IT117133 accession (Table 1).
Correlation analysis was performed to evaluate the relationships among the five fatty acid contents and total fatty acid content in the 100 accessions of cultivated P. frutescens var. frutescens. Among all combinations, the combinations of PA and SA (0.315 **), PA and LA (0.246 *), PA and TFAC (0.303 **), SA and OA (0.619 **), SA and LNA (0.477 **), SA and TFAC (0.503 **), OA and LNA (0.724 **), OA and TFAC (0.829 **), LA and TFAC (0.417 **), and LNA and TFAC (0.929 **) showed a higher positive correlation coefficient than the other combinations, with a significance level of 0.01 or 0.05. The SA and LA combination (−0.157) showed the only negative correlation compared with the other combinations (Table 2).
2.2. Genetic Variation in the Perilla Accessions Using SSR Markers
The genetic variation for 40 SSR loci was measured with regard to the number of alleles, genetic diversity (GD), polymorphic information content (PIC), and major allele frequency (MAF) among the 100 accessions of cultivated P. frutescens var. frutescens (Table 3). The 40 SSR loci were confirmed to have a total of 231 alleles in the 100 accessions of cultivated P. frutescens var. frutescens. The number of alleles per locus ranged from 3 (KNUPF26, KNUPF58, KNUPF74, KNUPF77) to 12 (KNUPF89), and the average number of alleles per locus was 5.8 (Table 4). The average GD was 0.614, with a range of 0.313 (KNUPF11)–0.847 (KNUPF113). The average PIC value was 0.570, with a range of 0.293 (KNUPF11)–0.830 (KNUPF113). The average MAF was 0.522, with a range of 0.270 (KNUPF117, KNUPF125)–0.820 (KNUPF4) (Table 3).
2.3. Population Structure and Association Analysis among 100 Perilla Accessions Using SSR Markers and Fatty Acid Content
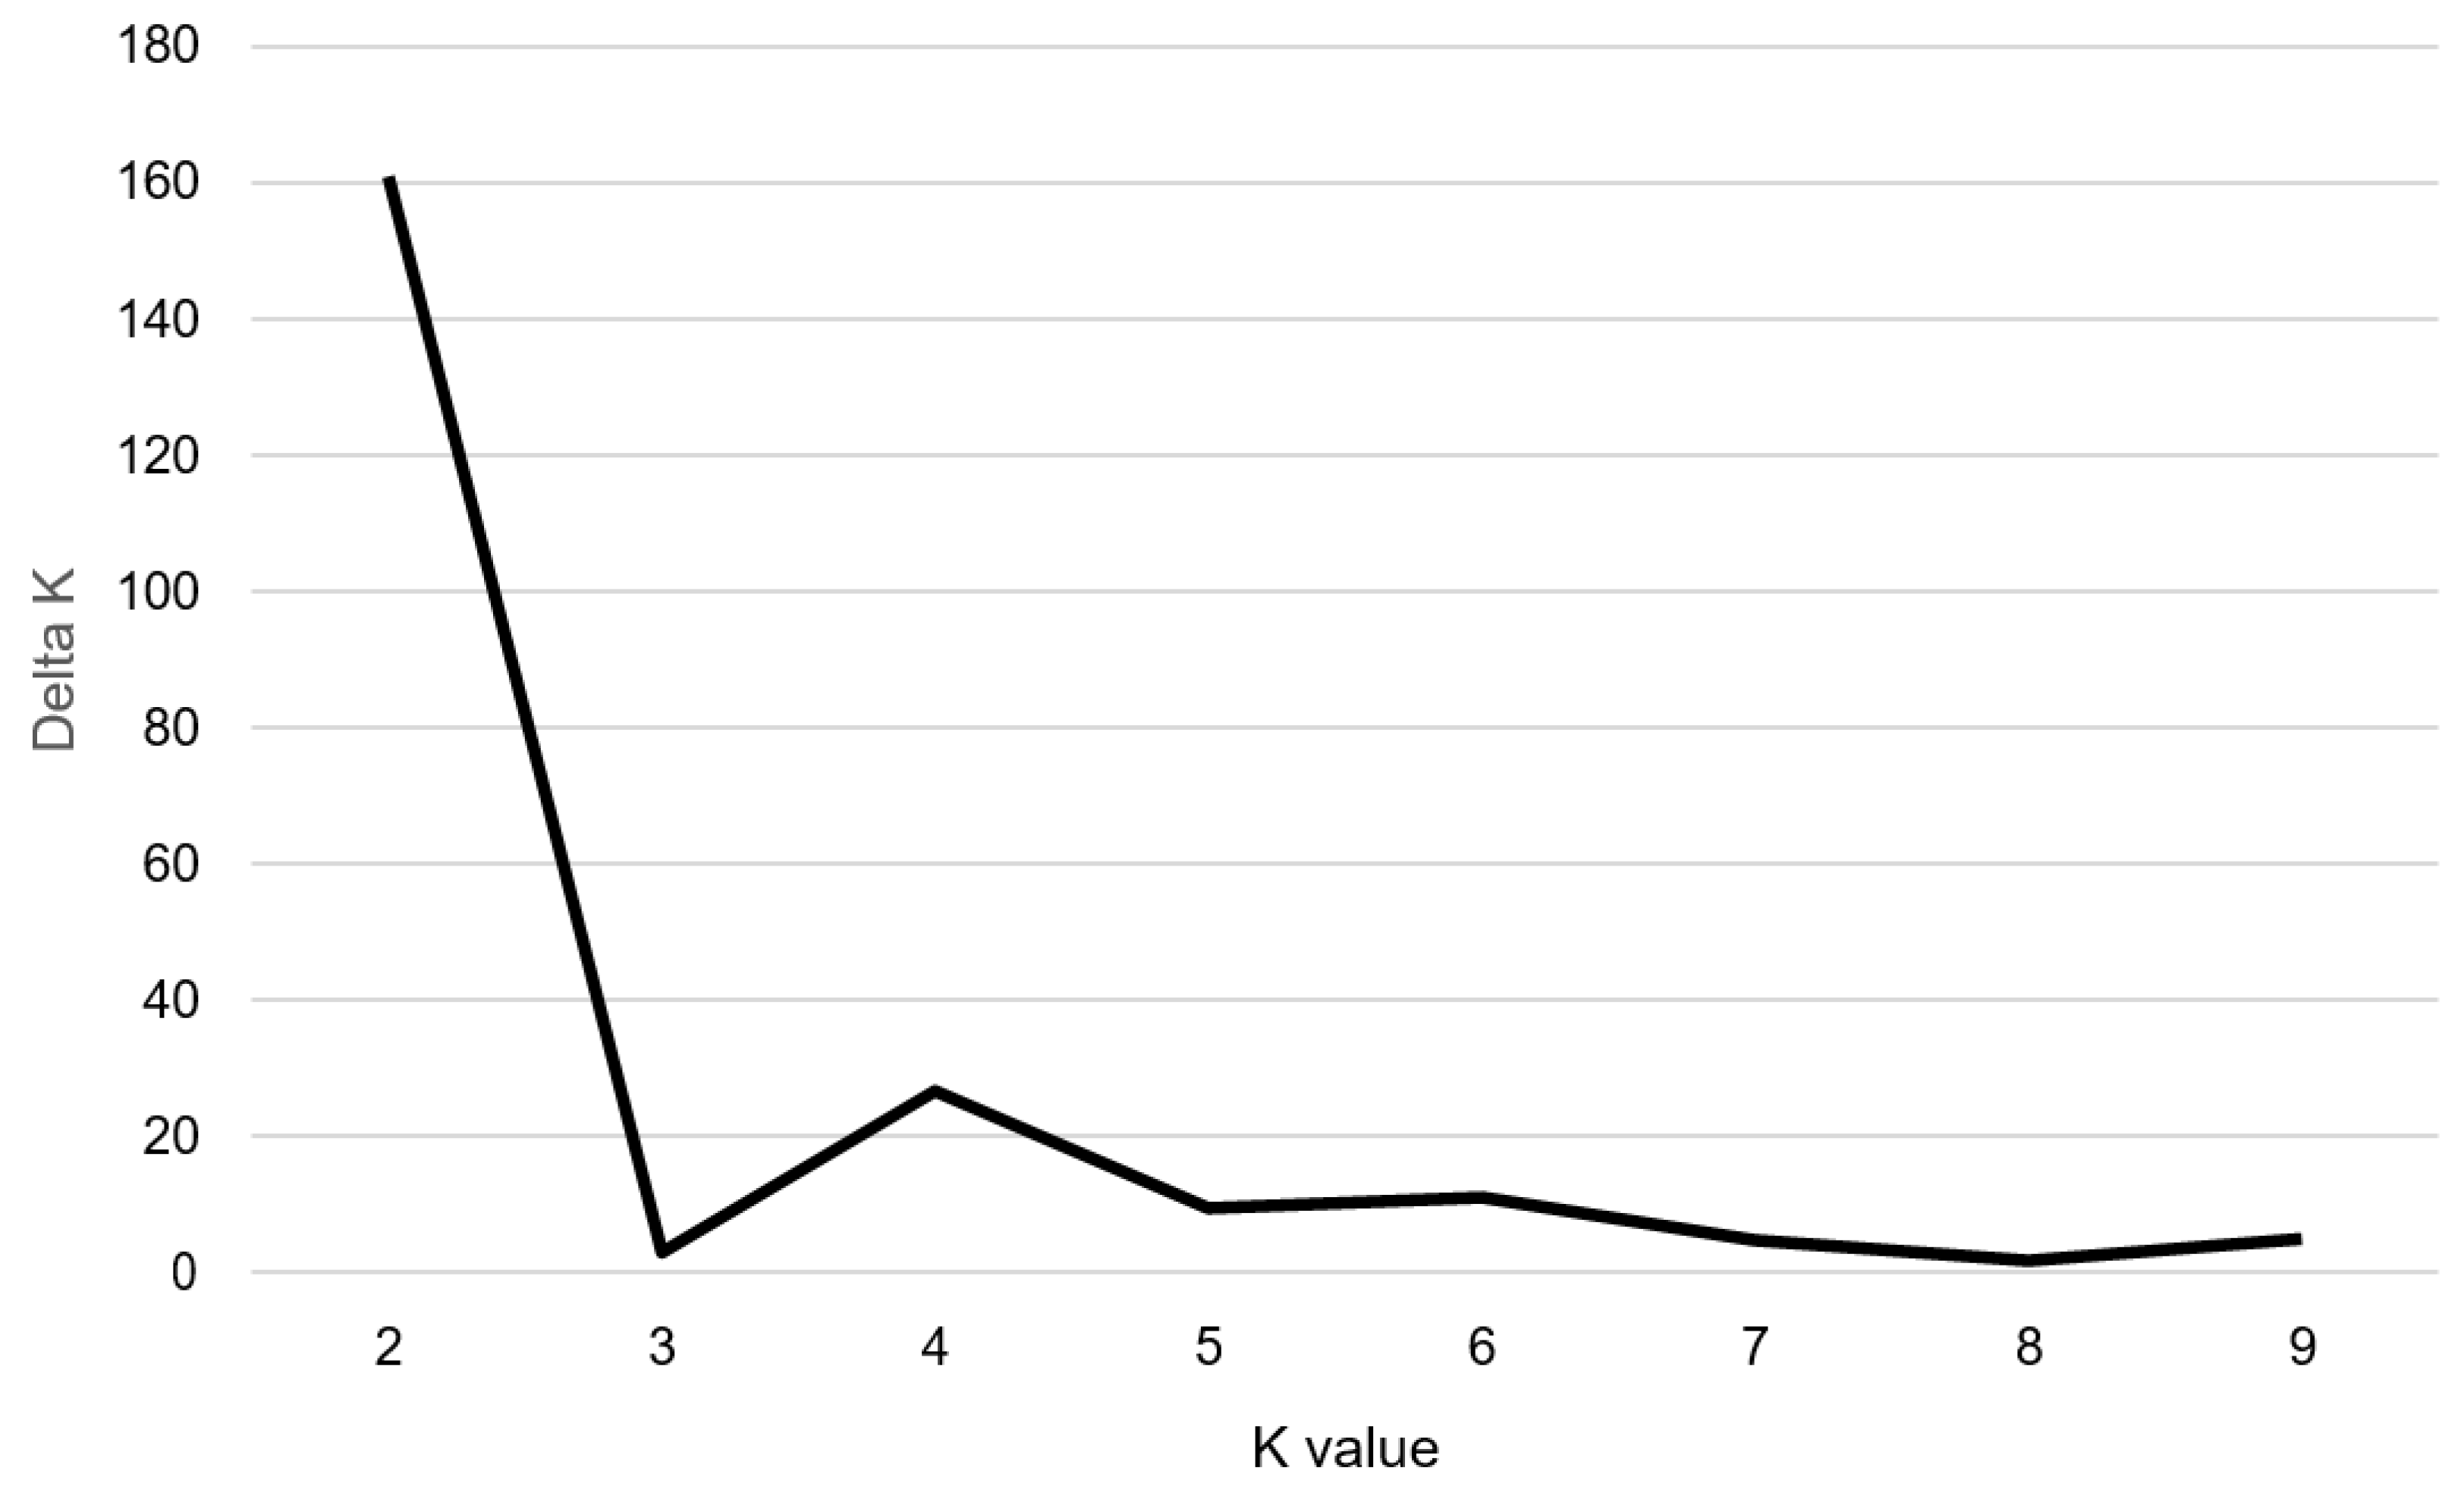
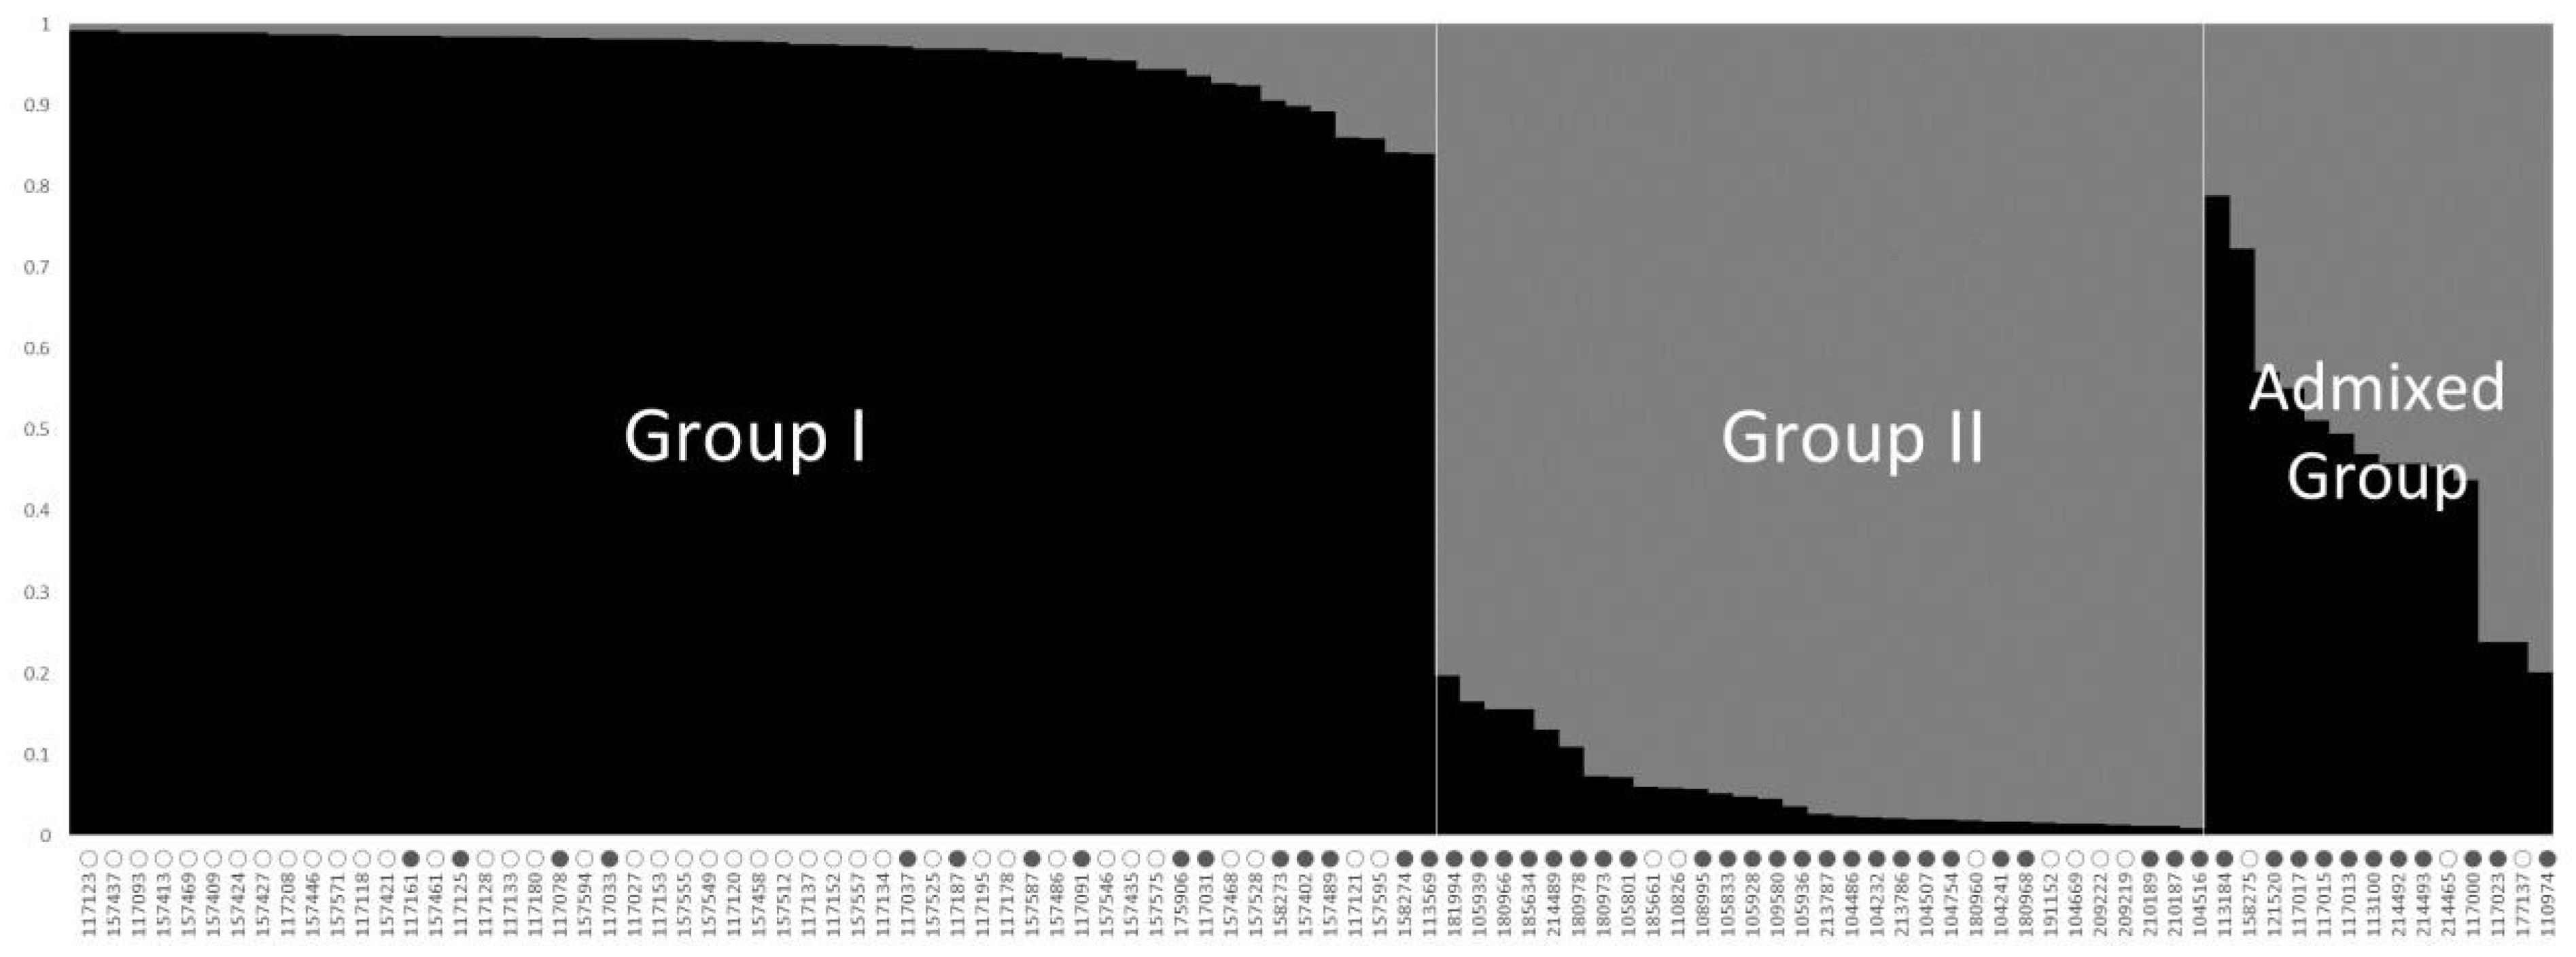
To understand the population structure among the 100 accessions of cultivated P. frutescens var. frutescens, we divided each accession into corresponding subgroups using the model-based approach in STRUCTURE software. The highest value of ΔK for the 100 accessions of cultivated P. frutescens var. frutescens was for K = 2 (Figure 1). As a result, all accessions were divided into two main groups and an admixed group at K = 2 (Figure 2). At K = 2, Group I included 55 accessions of the cultivated P. frutescens var. frutescens, of which 15 accessions had high total fatty acid content, and 40 accessions had low total fatty acid content. Group II included 31 accessions of the cultivated P. frutescens var. frutescens, of which 24 accessions had high total fatty acid content, and seven accessions had low total fatty acid content. The admixed group contained a total of 14 accessions of the cultivated P. frutescens var. frutescens, 11 of which had a high total fatty acid content, and three accessions had a low total fatty acid content (Figure 2). Most of the accessions with high fatty acid content were included in Group II and the admixed group.
In addition, to select the SSR markers associated with the five fatty acids in the 100 accessions of cultivated P. frutescens var. frutescens, the genotypes of the 40 SSR markers and the Perilla seed oil traits, namely PA, SA, OA, LA, LNA, and TFAC, were used to confirm significant marker-trait associations (SMTAs) using TASSEL software. From the results, we detected 11 SSR markers (KNUPF10, KNUPF14, KNUPF16, KNUPF53, KNUPF62, KNUPF71, KNUPF72, KNUPF85, KNUPF89, KNUPF118, and KNUPF125) associated with the six Perilla seed oil traits using a GLM at a significance level of p ≤ 0.01 or 0.001 (Table 4). Among the 11 SSR markers related to the Perilla seed oil traits, four SSR markers (KNUPF14, KNUPF62, KNUPF72, and KNUPF85) were associated with the TFAC trait at a significance level of p ≤ 0.01 or 0.001. Five SSR markers (KNUPF14, KNUPF53, KNUPF62, KNUPF72, and KNUPF85) were associated with the LNA trait at a significance level of p ≤ 0.01 or 0.001 (Table 4). Only one SSR marker (KNUPF125) was associated with the LA trait, with a significance level of p ≤ 0.01. Each of the OA and PA traits was associated with two SSR markers, KNUPF62 and KNUPF85, and KNUPF10 and KNUPF89, respectively, with a significance level of p ≤ 0.01 or 0.001. Finally, four SSR markers (KNUPF10, KNUPF16, KNUPF71, and KNUPF118) were associated with the SA trait at a significance level of p ≤ 0.01 or 0.001 (Table 4). Among these significant markers related to Perilla seed oil traits, the SSR markers KNUPF14, KNUPF62, KNUPF72, and KNUPF85 were associated with both the TFAC and LNA traits. In addition, one SSR marker (KNUPF62) was associated with each of the TFAC, LNA, and OA traits. Additionally, one SSR marker (KNUPF10) was associated with both the PA and SA traits (Table 4).
2.4. Genetic Verification of SSR Markers among 100 Perilla Accessions
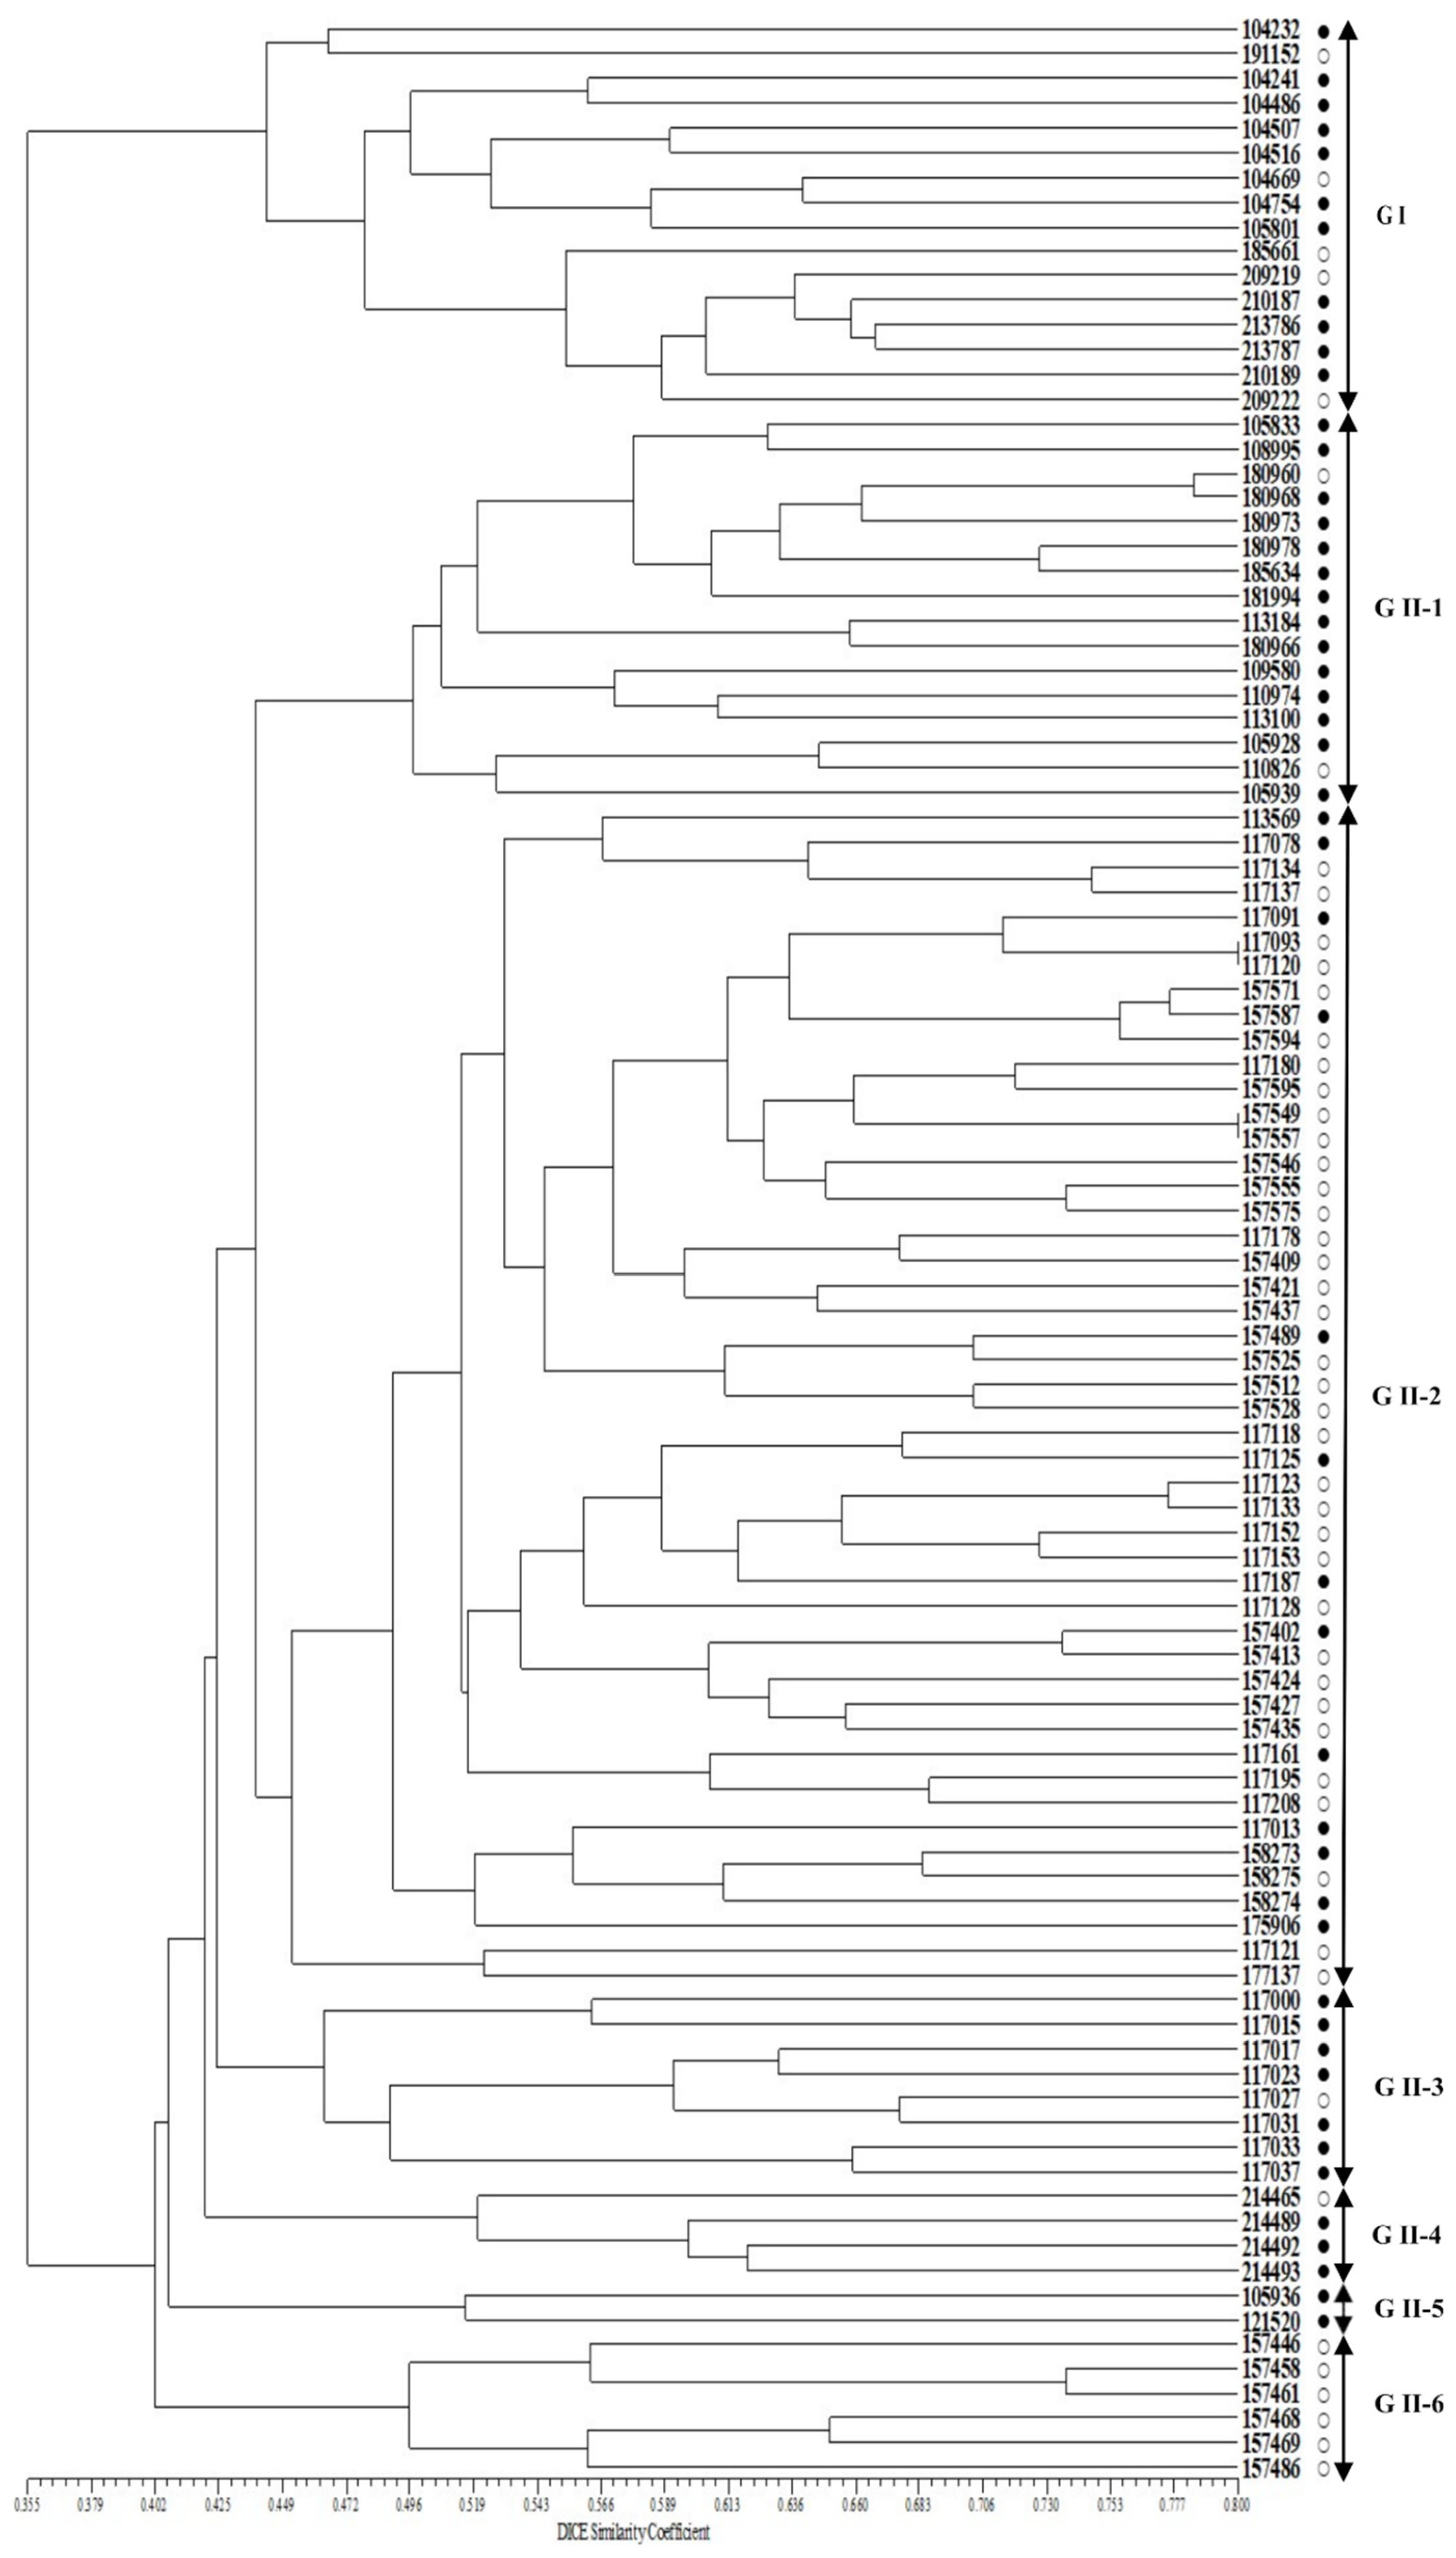
A phylogenetic tree constructed using UPGMA and 40 SSR markers revealed the 100 Perilla accessions clustering into two major groups with a genetic similarity of 40.2% (Figure 3). Group I contained 16 accessions of the cultivated var. frutescens. Group II contained 84 accessions of the cultivated P. frutescens var. frutescens. In addition, Group II was divided into six subclusters with a genetic similarity of 44.9% (Figure 3). The first subcluster (G II-1) contained 16 accessions. The second subcluster (G II-2) contained 48 accessions. The third subcluster (G II-3) contained eight accessions. The fourth subcluster (G II-4) contained four accessions. The fifth subcluster (G II-5) contained two accessions. The sixth subcluster (G II-6) contained six accessions (Figure 3). According to our results, the clustering patterns could not clearly distinguish the accessions of cultivated P. frutescens var. frutescens to match fatty acid content, such as high or low fatty acid content. However, the groups G I, G II-1, G II-3, and G II-4 contained comparatively many accessions with high fatty acid content.
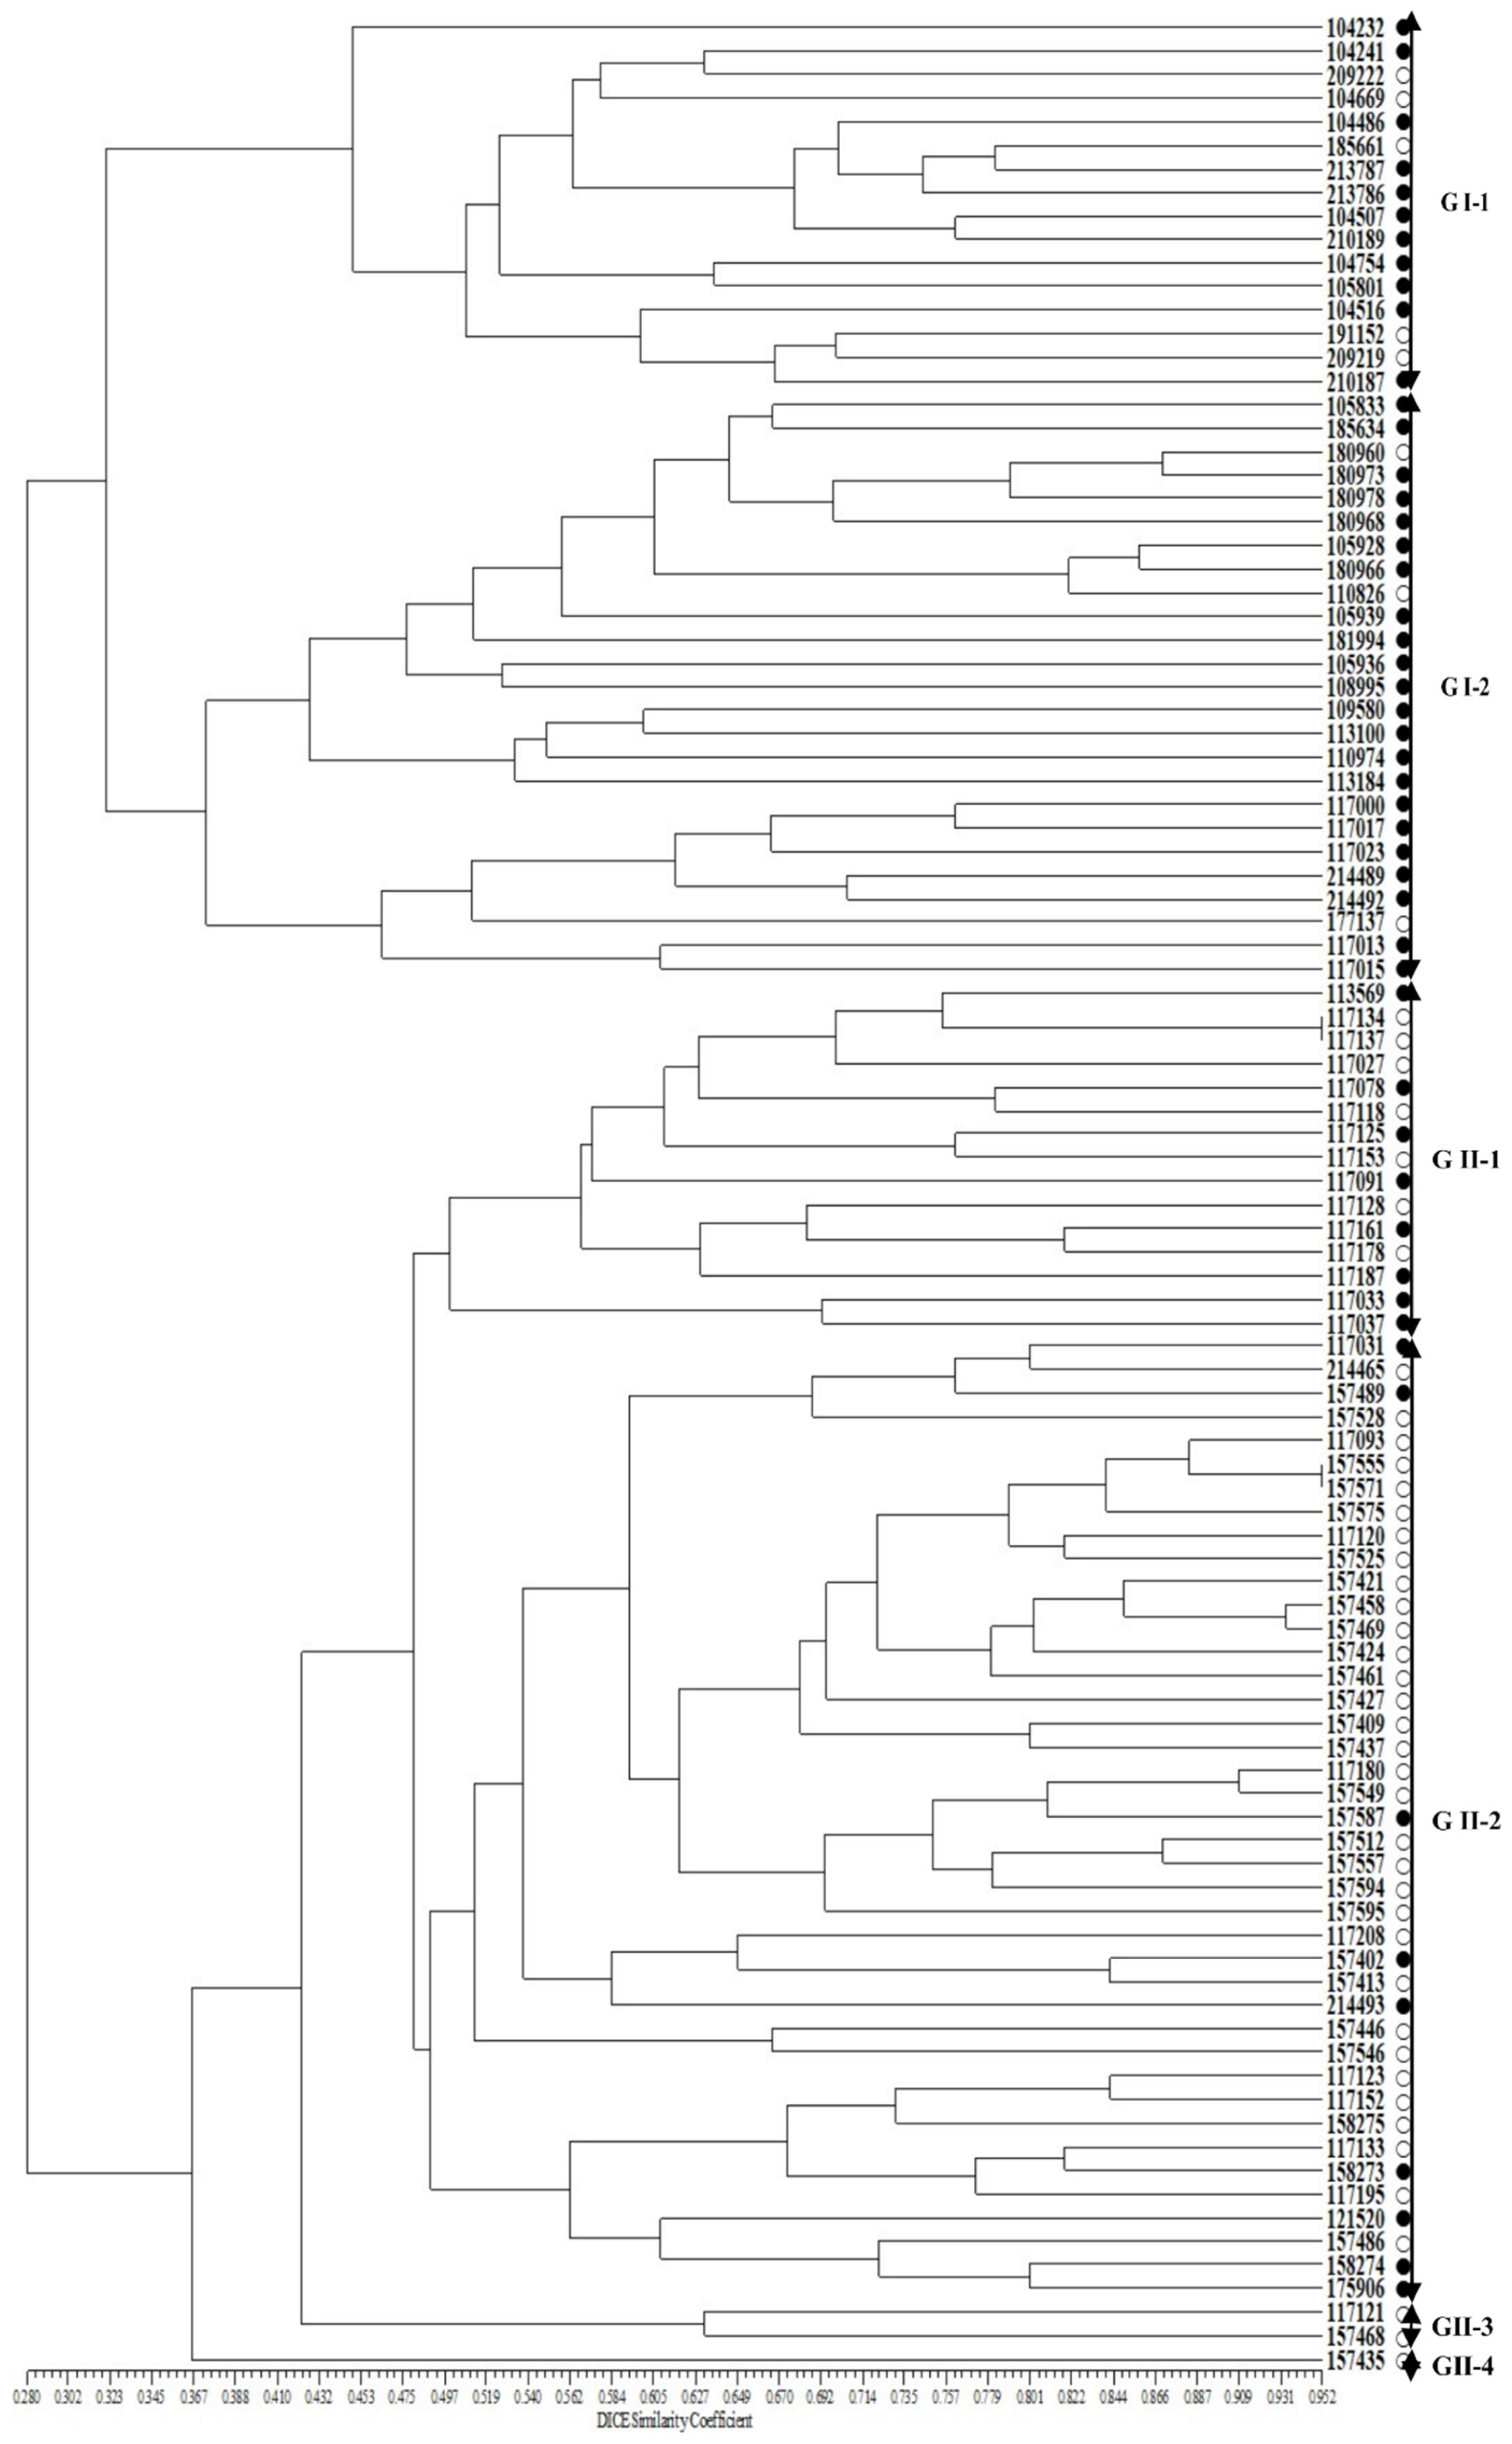
In addition, to verify the selected SSR markers associated with the Perilla seed oil traits among the 100 Perilla accessions, a UPGMA dendrogram was re-constructed using the 11 SSR markers (Figure 4). The phylogenetic tree constructed using UPGMA revealed the 100 Perilla accessions clustering into two major groups with a genetic similarity of 29.3%. Group I included 41 accessions of the cultivated P. frutescens var. frutescens consisting of 33 accessions with high fatty acid content and eight accessions with low fatty acid content. Group II contained 59 accessions of the cultivated P. frutescens var. frutescens. In addition, Group I was divided into two subclusters with a genetic similarity of 36.7% (Figure 4). The first subcluster (G I-1) contained 16 accessions consisting of 11 accessions with high fatty acid content and five accessions with low fatty acid content. The second subcluster (G I-2) contained 25 accessions consisting of 22 accessions with high fatty acid content and three accessions with low fatty acid content. Group II was divided into four subclusters with a genetic similarity of 44.9% (Figure 4). The first subcluster (G II-1) contained 15 accessions consisting of eight accessions with high fatty acid content and seven accessions with low fatty acid content. The second subcluster (G II-2) contained 41 accessions consisting of nine accessions with high fatty acid content and 32 accessions with low fatty acid content. The third subcluster (G II-3) contained only two accessions, which had low fatty acid content. The fourth subcluster (G II-4) contained only one accession, which had high fatty acid content.
3. Discussion
Perilla crop in East Asia is thought to have originated from China [1,7,40], but the two cultivated types of Perilla crop are widely cultivated and used in South Korea and Japan [2,3,4]. The cultivated type of P. frutescens var. frutescens is extensively cultivated in South Korea as both an oil crop and a vegetable crop [4,25,26], while the cultivated type of P. frutescens var. crispa is widely cultivated and used in Japan as a spicy vegetable crop [1,2,3,7]. Meanwhile, the seeds of the cultivated type of P. frutescens var. frutescens are used for plant oil production. They are a good source of polyunsaturated fatty acids, such as linoleic acid and α-linolenic acid, as these account for about 80% of Perilla seed oil. In particular, two essential fatty acids, oleic and linolenic acid, are significant fatty acids in terms of quality and quantity of Perilla seed oils [11,12,13,41]. In addition, Perilla leaves are rich in vitamins B and C and are preferred as salad vegetables and pickles in South Korea. Especially due to the increase in meat consumption and the development of various dishes, foods, and methods using fresh leaves and seed oil, leaves and seed oil of the cultivated type of P. frutescens var. frutescens are attracting attention as health foods in South Korea [4,26,38,39]. Therefore, in order to develop high-quality Perilla seed oil varieties, it is necessary to analyze the characteristics related to seed fatty acid content of genetic resources of P. frutescens var. frutescens.
In our study, to select SSR markers associated with Perilla seed oil traits in accessions of cultivated P. frutescens var. frutescens, we studied the genotypes of 40 SSR markers and the content of five fatty acids and total fatty acid content (PA, SA, OA, LA, LNA, and TFAC) in 100 Perilla accessions. In the Perilla crop, SSR markers were developed by Kwon et al. 2005, Park et al. 2008, Sa et al. 2018, 2019, and Kim et al. 2021 [32,33,34,35,36]. From among them, as a preliminary test, we selected 40 SSR primer sets that showed high allele band amplification and a clear banding pattern in Perilla accessions. Furthermore, the 100 Perilla accessions used in this study were selected based on the results of fatty acid content analysis in genetic resources for the development of leaf vegetable and seed oil cultivars and stored in the Rural Development Administration Genebank (RDA-Genebank) collection from South Korea (http://genebank.rda.go.kr/, accessed on 1 November 2020).
As described in Material and Methods, for analysis of association mapping to identify SSR markers associated with Perilla seed oil traits of the Perilla accessions, two groups of Perilla accessions were selected based on the total contents of five fatty acids of the 100 accessions of cultivated P. frutescens var. frutescens of Perilla crop. Group I (50 accessions) showed a high total fatty acid content of 115% or more, and Group II (50 accessions) had a low total fatty acid content of 100% or less (Supplementary Table S1). According to our results, among the 100 accessions of cultivated P. frutescens var. frutescens, the IT105801, IT105936, and IT157587 accessions showed the highest total fatty acid content compared with the other accessions, with a content of 120% or more. Meanwhile, the IT117093, IT117133, and IT157549 accessions showed the lowest total fatty acid content compared with the other accessions with a content of 97.3% or less (Table 1). Most of the five fatty acid composition values investigated in this study were similar to those reported in previous studies on Perilla seeds [8,9,12,41,42,43,44]. However, the contents of the five fatty acids measured in each Perilla accession tended to be high or low, depending on the Perilla accession. For example, the IT105801 accession, which has the highest total content of 121.5% of the five fatty acids, had relatively high PA, LA, and LNA contents compared with the other accessions, while the SC content was not high compared with that of the other accessions. As such, the contents of the five fatty acids measured in each Perilla accession varied depending on the Perilla accession (Table 1). Meanwhile, from the results of correlation analysis among the contents of the five fatty acids in the 100 accessions of cultivated P. frutescens var. frutescens, the combinations of PA and SA (0.315 **), PA and TFAC (0.303 **), SA and OA (0.619 **), SA and LNA (0.477 **), SA and TFAC (0.503 **), OA and LNA (0.724 **), OA and TFAC (0.829 **), LA and TFAC (0.417 **), and LNA and TFAC (0.929 **) showed a higher positive correlation, with a significance level of 0.01 (Table 2). In particular, OA and TFAC (0.829 **) and LNA and TFAC (0.929 **) showed high positive correlation coefficients compared with the other combinations. The SA and LA combination (−0.157) showed the only negative correlation compared with the other combinations (Table 2). Therefore, these results are expected to provide useful information for breeding studies to increase the content of the five fatty acids in the Perilla crop in the future.
Genetic diversity between individuals in a population or between populations in a crop species, derived from genes or environmental effects or from both, can be easily assessed using a variety of molecular markers [22,28,29]. As already explained in the Introduction, SSR markers have many advantages over other marker systems. The advantage of SSR markers is that they are highly reproducible and produce very high allelic variations even between very closely related varieties [22,24,27,38]. Therefore, in our study, we used SSR markers to determine the genetic diversity and relationships, population structure, and association mapping analysis in 100 accessions of cultivated P. frutescens var. frutescens, which were selected based on the content of five fatty acids in accessions of Perilla germplasm.
In the study of genetic diversity among these accessions, 40 SSR markers showed useful molecular markers for the study of genetic diversity and relationships in the 100 accessions of cultivated P. frutescens var. frutescens. A total of 231 alleles with 40 SSRs were detected segregating in the 100 accessions of cultivated P. frutescens var. frutescens, which yielded an average of 5.8 alleles per locus (Table 3). The number of alleles detected in our study should provide useful information for detecting SSR markers associated with the Perilla seed oil traits of PA, SA, OA, LA, LNA, and TFAC in the 100 accessions of cultivated P. frutescens var. frutescens. Previously, Sa et al. 2018, Kim et al. 2021, Ha et al. 2021, and Lim et al. 2021 reported the usefulness of SSR markers in determining unique genotypes of individual accessions of Perilla crop and related weedy types in studies of association mapping and bulk segregant analyses [34,36,38,39]. Therefore, in our study, to select SSR markers associated with Perilla seed oil traits in accessions of cultivated P. frutescens var. frutescens, we analyzed marker-trait associations (SMTAs) between 40 SSR markers and six Perilla seed oil traits, namely PA, SA, OA, LA, LNA, and TFAC, in the 100 Perilla accessions using TASSEL software. From the results, we found 11 SSR markers related to Perilla seed oil traits at a significance level of p ≤ 0.01 or 0.001 as follows: four markers were associated with the TFAC trait, five markers were associated with the LNA trait, one marker was associated with the LA trait, two SSR markers were associated with both the OA and PA traits, and four SSR markers were associated with the SA trait (Table 4). Among these SSR markers related to Perilla seed oil traits, particularly KNUPF14, KNUPF62, KNUPF72, and KNUPF85 were all associated with the TFAC and LNA traits. In addition, one SSR marker (KNUPF62) was associated with each of the TFAC, LNA, and OA traits. Additionally, one SSR marker (KNUPF10) was associated with both the PA and SA traits (Table 4). Therefore, these SSR markers are thought to be useful molecular markers for distinguishing Perilla seed oil traits in the Perilla crop.
Furthermore, in order to understand the genetic variability and genetic relationships among accessions of the cultivated P. frutescens var. frutescens used in our study in more detail, we analyzed phylogenetic relationships for the 100 Perilla accessions using the 40 SSR markers and also the selected 11 SSR markers related to Perilla seed oil traits. In the case of the 40 SSR markers, the 100 Perilla accessions were clustered into two major groups with 40.2% genetic similarity (Figure 3). Group I contained 16 Perilla accessions consisting of 11 accessions with high fatty acid content and 5 accessions with low fatty acid content. Group II contained 84 accessions consisting of 39 accessions with high fatty acid content and 45 accessions with low fatty acid content (Figure 3). The results show that these 40 SSR markers were not clearly identified among the accessions of cultivated P. frutescens var. frutescens by high or low fatty acid content. In the case of the 11 SSR markers related to Perilla seed oil traits, the 100 Perilla accessions were clustered into two major groups with a genetic similarity of 29.3% (Figure 4). Group I included 41 accessions of the cultivated var. frutescens consisting of 33 accessions with high fatty acid content and eight accessions with low fatty acid content. Group II contained 59 accessions of the cultivated var. frutescens consisting of 17 accessions with high fatty acid content and 42 accessions with low fatty acid content (Figure 4). The results show that most accessions with high fatty acid content were clustered in Group I rather than Group II. According to our results, although some accessions were still mixed in the UPGMA dendrogram of Figure 4, when divided into sub-groups, the 11 SSR markers related to the Perilla seed oil traits showed a clear distinction between accessions with high or low fatty acid contents compared with the cluster results using the 40 SSR markers. Therefore, these SSR markers related to the Perilla seed oil traits are expected to be useful in selecting Perilla accessions for the content of the five fatty acids.
One particular finding in our study was that, of the 11 selected SSR markers related to the Perilla seed oil traits, four SSR markers (KNUPF14, KNUPF62, KNUPF72, KNUPF85) were all associated with the two traits of TFAC and LNA. Additionally, 2 SSR markers (KNUPF62, KNUPF85) were both associated with the three traits of TFAC, LNA, and OA (Table 4). In addition, in the correlation analysis between the five fatty acid contents, the combination of LNA and TFAC (0.929 **) showed the highest positive correlation coefficients compared with the other combinations. Furthermore, the combinations of OA and LNA (0.724 **) and OA and TFAC (0.829 **) showed high positive correlation coefficients compared with the other combinations (Table 2). Therefore, these results suggest that these SSR markers, particularly KNUPF62 and KNUPF85, are useful molecular markers for selecting accessions of cultivated P. frutescens var. frutescens with high or low content of fatty acids such as TFAC, LNA, and OA. Meanwhile, among the 11 SSR markers found in this study, three SSR markers (KNUPF10, KNUPF16, and KNUPF85) were previously reported by previous studies of Ha et al. 2021 and Lim et al. 2021 [38,39]. They reported that the SSR marker KNUPF85 was associated with seed characteristics such as germination rate, seed hardness, and seed size (Ha et al. 2021) [38]. Additionally, the two SSR markers, KNUPF10 and KNUPF16, were associated with leaf- and seed-related traits, respectively (Lim et al. 2021) [39]. Therefore, these SSR markers are thought to be useful molecular markers for selecting accessions related to fatty acid content and seed- or leaf-related traits in Perilla genetic resources. Meanwhile, for the 11 SSR markers associated with the Perilla seed oil traits selected in this study, there is still a still lack of genomic information on the Perilla crop, making it difficult to compare genetic characteristics.
Recently, the Perilla seed oil of P. frutescens var. frutescens has been attracting attention as a health food, and the cultivation area of cultivated P. frutescens var. frutescens has expanded significantly, making it one of the most important crops in South Korea. However, even though it is one of the representative minor crops in South Korea, there is a lack of genomic studies compared with other important crops. Therefore, if active research such as genome analysis is carried out in the Perilla crop, it is expected that the characteristics of the selected Perilla SSR markers can be specifically analyzed. The Perilla SSR markers found in our study are expected to be useful markers for genetic diversity analysis of Perilla germplasm and the selection of Perilla accessions with high seed oil composition for improving the oil yield and quality in Perilla breeding. Therefore, these results are very important for understanding the Perilla seed oil traits of Perilla crop. Additionally, they may provide support for effective selection and utilization of existing accessions and allow better accession selection in molecular breeding programs for the development of useful seed oil varieties of the Perilla crop through MAS breeding programs.
4. Materials and Methods
4.1. Plant Materials and Fatty Acid Composition
In this study, for the analysis of the fatty acid composition of Perilla accessions and association mapping, a total of 100 accessions of cultivated P. frutescens var. frutescens of Perilla crop were selected, based on the content of five fatty acids, from among the accessions of Perilla germplasm that were published on the website of the RDA-Genebank of the Republic of Korea (https://genebank.rda.go.kr/, accessed on 1 November 2020). The method of fatty acid analysis performed by the Korean RDA-Genebank was presented by Song et al. 2012 [41]. When performing fatty acid analysis on Perilla genetic resources in the RDA-Genebank, they used the fatty acid calculation method for each accession as follows; the relative fatty acid content between Perilla germplasms was assessed by making a calibration graph for each fatty acid (oleic acid, linoleic acid, etc.) and using Near-Infrared Reflectance Spectroscopy (NIR). Therefore, some accessions with a very high fatty acid content had a total fatty acid content exceeding 100%, and some accessions with a relatively low fatty acid content showed a value of less than 100%. In addition, there have been many previous studies that have reported analyses of the fatty acid content for the Perilla crop, such as Lee et al. 1986, Shin and Kim 1994, Asif 2011, Ciftci et al. 2012, and Lee et al. 2016 [8,10,11,12,13]. The results of our study on the content of five fatty acids, namely palmitic acid (PA), stearic acid (SA), oleic acid (OA), linoleic acid (LA), and linolenic acid (LNA), for the 100 Perilla accessions are shown in Supplementary Table S1. In addition, for analysis of association mapping to find SSR markers associated with the content of the five fatty acids of Perilla seeds, we divided the 100 accessions into two groups based on total fatty acid content (TFAC) as follows: Group I showed a high total fatty acid content of 115% or more (50 accessions), and Group II had a low total fatty acid content of 100% or less (50 accessions) (Supplementary Table S1). The information on the content of the five fatty acids of the 100 Perilla accessions used in this study is shown in Table 1 and Supplementary Table S1.
4.2. SSR Analysis and DNA Electrophoresis
For SSR analysis, the total DNA of 100 Perilla accessions was extracted from young leaf tissue of individual representative plants of each accession according to Plant DNAzol Reagent protocols (GibcoBRL Inc., Grand Island, NY, USA). The information on the 40 Perilla SSR primer sets used in this study is shown in Table 5. The SSR amplification method for the Perilla crop has been described in a previous study by Oh et al. 2020 [26]. After polymerase chain reaction (PCR) amplification using Perilla SSR primer sets, DNA electrophoresis analysis was performed with a QIAxcel advanced system (QIAGEN Co., Hilden, Germany) based on the protocol described in the QIAxcel DNA Handbook. The samples were run in the QIAxcel advanced electrophoresis system, and sample separation was performed over 15 min. Gel images were obtained as the results, and the quantification analysis was performed with QIAxcel software. The results were displayed as gel images and electropherograms acquired from the QIAxcel advanced system software.
4.3. Data Analysis
DNA fragments amplified for each SSR primer set were scored as present (1) or absent (0). Power Marker version 3.25 [45] was applied to obtain information on the number of alleles, allele frequency, major allele frequency (MAF), gene diversity (GD), and the polymorphic information content (PIC). Genetic similarity (GS) was calculated for each pair of accessions using the Dice similarity index [46]. The similarity matrix was then used to construct a dendrogram with the unweighted pair group method with the arithmetic mean (UPGMA) by the application of SAHN clustering in NTSYS-pc V2.1 [47]. Population structure was investigated for 100 Perilla accessions using STRUCTURE 2.2 software [48]. Five independent runs with K values ranging from one to ten were performed with 100,000 cycles for both burn-in and run length. The delta K statistic, based on the rate of change in the log probability of data between K values [49], was calculated with STRUCTURE HARVESTER (http://taylor0.biology.ucla.edu/structHarvester/, accessed on 1 November 2020) based on the STRUCTURE results. Association mapping was performed for marker-trait association using TASSEL 3.0 [50], which was used to evaluate marker-trait associations using a general linear model (Q GLM). The Q GLM method was performed using the population structure (Q) matrix derived from the STRUCTURE program. The number of permutation runs was set to 10,000 to obtain a marker significance value of p ≤ 0.01. Correlation analysis of the content of the five fatty acids of the 100 Perilla accessions was performed using SPSS software.
5. Conclusions
In order to identify simple sequence repeat (SSR) markers associated with Perilla seed oil traits in Perilla crop (Perilla frutescens (L.), the genetic variation, population structure, and association mapping of Perilla accessions were studied using five fatty acid contents of 100 Perilla accessions and 40 Perilla SSR primers. Perilla seed oil of cultivated type of P. frutescens var. frutescens has been attracting attention in South Korea as a health food. Five fatty acids of 100 Perilla accessions were identified as follows: palmitic acid (PA) (5.10–9.13%), stearic acid (SA) (1.70–3.99%), oleic acid (OA) (11.1–21.9%), linoleic acid (LA) (10.2–23.4%), and linolenic acid (LNA) (54.3–75.4%). Additionally, the 100 Perilla accessions were divided into two groups (high or low) based on the total fatty acid content (TFAC). In a correlation analysis among these six Perilla seed oil traits of the 100 Perilla accessions, the combinations of OA and LNA (0.724 **), OA and TFAC (0.829 **), and LNA and TFAC (0.929 **) showed a higher positive correlation coefficient than the other combinations. By using an association analysis of 40 SSR markers and the six Perilla seed oil traits in the 100 Perilla accessions, we detected four SSR markers associated with TFAC, five SSR markers associated with LNA, one SSR marker associated with LA, two SSR markers each associated with OA and PA, and four SSR markers associated with SA. Among these SSR markers, four SSR markers (KNUPF14, KNUPF62, KNUPF72, and KNUPF85) were all associated with TFAC and LNA. Additionally, two SSR markers (KNUPF62 and KNUPF85) were both associated with TFAC, LNA, and OA. The Perilla SSR markers found in our study are expected to be useful markers for genetic diversity analysis of Perilla germplasm and the selection of Perilla accessions with high seed oil composition for improving the oil yield and quality in Perilla breeding. Therefore, these results are very important for understanding the Perilla seed oil traits of the Perilla crop. Additionally, they may provide support for effective selection and utilization of existing accessions and allow better accession selection in molecular breeding programs for the development of useful seed oil varieties of Perilla crop through MAS breeding programs.
Supplementary Materials
The following are available online at https://0-www-mdpi-com.brum.beds.ac.uk/article/10.3390/plants10071404/s1, Table S1a: Difference in the contents of five fatty acids between 50 Perilla accessions with a high total fatty acid content of 115% or more, Table S1b: Difference in the contents of five fatty acids between 50 Perilla accessions with a low total fatty acid content of 100% or less.
Author Contributions
D.Y.H. and S.L. provided the genetic material and fatty acid analysis results. H.P. and K.J.S. conducted molecular biology experiments. H.P., K.J.S. and J.K.L. performed statistical analysis. H.P., K.J.S. and J.K.L. wrote the manuscript. All authors have read and agreed to the published version of the manuscript.
Funding
This research received no external funding.
Data Availability Statement
Data is contained within the article or Supplementaryary Materials.
Acknowledgments
This study was supported by the Basic Science Research Program through the National Research Foundation of Korea (NRF), funded by the Ministry of Education, Science, and Technology (#2016R1D1A1B01006461) and the Cooperative Research Program for Agriculture Science and Technology Development (project no. PJ014227032020 and PJ0142272020), Rural Development Administration, Republic of Korea.
Conflicts of Interest
The authors declare that they have no conflict of interests.
References
- Lee, J.K.; Ohnishi, O. Geographical differentiation of morphological characters among Perilla crops and their weedy types in East Asia. Breed Sci. 2001, 51, 247–255. [Google Scholar] [CrossRef] [Green Version]
- Lee, J.K.; Ohnishi, O. Genetic relationships among cultivated types of Perilla Frutescens and their weedy types in East Asia revealed by AFLP markers. Genet. Resour. Crop Evol. 2003, 50, 65–74. [Google Scholar] [CrossRef]
- Nitta, M.; Lee, J.K.; Ohnishi, O. Asian Perilla crops and their weedy forms: Their cultivation, utilization and genetic relationships. Econ. Bot. 2003, 57, 245–253. [Google Scholar] [CrossRef]
- Sa, K.J.; Choi, S.H.; Ueno, M.; Park, K.C.; Park, Y.J.; Ma, K.H.; Lee, J.K. Identification of genetic variations of cultivated and weedy types of Perilla species in Korea and Japan using morphological and SSR markers. Genes Genom. 2013, 35, 649–659. [Google Scholar] [CrossRef]
- Ma, S.J.; Sa, K.J.; Hong, T.K.; Lee, J.K. Genetic diversity and population structure analysis in Perilla crop and their weedy types from northern and southern areas of China based on simple sequence repeat (SSRs). Genes Genom. 2019, 41, 267–281. [Google Scholar] [CrossRef] [PubMed]
- Makino, T. Makino’s New Illustrated Flora of Japan; Hokuryukan Co.: Tokyo, Japan, 1961. (In Japanese) [Google Scholar]
- Nitta, M. Origin Perilla Crops and Their Weedy Type. Ph.D. Thesis, Kyoto University, Kyoto, Japan, 2001; p. 78. [Google Scholar]
- Lee, J.I.; Han, E.D.; See, S.T.; Park, H.W. Study on the evaluation of oil quality and the differences of fatty acid composition between varieties in Perilla (Perilla frutescens Britton var. japonica Hara). Kor. J. Breed Sci. 1986, 18, 228–233. [Google Scholar]
- Lee, J.I.; Bang, J.K.; Lee, B.H.; Kim, K.H. Quality improvement in Perilla. I. Varietal differences of oil content and fatty acid composition. Kor. J. Crop Sci. 1991, 36, 48–61. [Google Scholar]
- Lee, J.; Lee, M.H.; Cho, E.J.; Lee, S. High-yield methods for purification of a-linolenic acid from Perilla frutescens var. japonica oil. Appl. Biol. Chem. 2016, 59, 89–94. [Google Scholar] [CrossRef]
- Shin, H.S.; Kim, S.W. Lipid composition of perilla seed. J. Am. Oil Chem. Soc. 1994, 71, 619–622. [Google Scholar] [CrossRef]
- Asif, M. Health effects of omega-3,6,9 fatty acids: Perilla frutescens is a good example of plant oils. Orient Pharm. Exp. Med. 2011, 11, 51–59. [Google Scholar] [CrossRef] [Green Version]
- Ciftci, O.N.; Przybylski, R.; Rudzińska, M. Lipid components of flax, perilla, and chia seeds. Eur. J. Lipid Sci. Technol. 2012, 114, 794–800. [Google Scholar] [CrossRef]
- Okamoto, M.; Mitsunobu, F.; Ashida, K.; Mifune, T.; Hosaki, Y.; Tsugeno, H.; Harada, S.; Tanizaki, Y. Effects of dietary supplementation with n-3 fatty Acids compared with n-6 fatty acids on bronchial asthma. Intern Med. 2000, 39, 107–111. [Google Scholar] [CrossRef] [Green Version]
- Talbott, S.M.; Hughes, K. Perilla seed oil (Perilla frutescens). In The Health Professional’s Guide to Dietary Supplements; Lippincott Williams & Wilkins: Baltimore, MD, USA, 2006; pp. 258–260. [Google Scholar]
- Kopecky, J.; Rossmeisl, M.; Flachs, P.; Kuda, O.; Brauner, P.; Jilkova, Z.; Stankova, B.; Tvrzicka, E.; Bryhn, M. n-3 PUFA: Bioavailability and modulation of adipose tissue function. Proc. Nutr. Soc. 2009, 68, 361–369. [Google Scholar] [CrossRef] [PubMed] [Green Version]
- Russo, G.L. Dietary n-6 and n-3 polyunsaturated fatty acids: From biochemistry to clinical implications in cardiovascular prevention. Biochem. Pharmacol. 2009, 77, 937–946. [Google Scholar] [CrossRef]
- Hashimoto, M.; Matsuzaki, K.; Kato, S.; Hossain, S.; Ohno, M.; Shido, O. Twelve-Month Studies on Perilla Oil Intake in Japanese Adults-Possible Supplement for Mental Health. Foods 2020, 9, 530. [Google Scholar] [CrossRef] [Green Version]
- Debener, T.; Salamini, E.; Gebhardt, C. Phylogeny of wild and cultivated Solanum species based on nuclear restriction fragment length polymorphisms (RFLPs). Theor. Appl. Genet. 1990, 79, 360–368. [Google Scholar] [CrossRef]
- Baird, E.; Coper-Bland, S.; Waugh, R.; DeMaine, M.; Powell, W. Molecular characterisation of interand intra-specific somatic hybrids of potato using randomly amplified polymorphic DNA (RAPD) markers. Mol. Gen. Genet. 1992, 233, 469–475. [Google Scholar] [CrossRef] [PubMed]
- Vos, P.; Hogers, R.; Bleeker, M.; Reijans, M.; Van De Lee, T.; Hornes, M.; Frijters, A.; Pot, J.; Peleman, J.; Kuiper, M. AFLP: A new technique for DNA fingerprinting. Nucleic Acids Res. 1995, 23, 4407–4414. [Google Scholar] [CrossRef] [Green Version]
- Park, Y.J.; Lee, J.K.; Kim, N.S. Simple sequence repeat polymorphisms (SSRPs) for evaluation of molecular diversity and germplasm classification of minor crops. Molecules 2009, 14, 4546–4569. [Google Scholar] [CrossRef] [Green Version]
- Nasu, S.; Suzuki, J.; Ohta, R.; Hasegawa, K.; Yui, R.; Kitazawa, N.; Monna, L.; Minobe, Y. Search for and analysis of single nucleotide polymorphisms (SNPs) in rice (Oryza sativa, Oryza rufipogon) and establishment of SNP markers. DNA Res. 2002, 9, 163–171. [Google Scholar] [CrossRef] [PubMed] [Green Version]
- Akagi, H.; Yokozaki, Y.; Inagaki, A.; Fujimura, T. Highly polymorphic microsatellites of rice consist of AT repeats, and a classification of closely related cultivars with these microsatellite loci. Theor. Appl. Genet. 1997, 94, 61–67. [Google Scholar] [CrossRef]
- Lee, J.K.; Nitta, M.; Kim, N.S.; Park, C.H.; Yoon, K.M.; Shin, Y.B.; Ohnishi, O. Genetic diversity of Perilla and related weedy types in Korea determined by AFLP analyses. Crop Sci. 2002, 42, 2161–2166. [Google Scholar] [CrossRef]
- Oh, J.K.; Sa, K.J.; Hyun, D.Y.; Cho, G.T.; Lee, J.K. Assessment of genetic diversity and population structure among a collection of Korean Perilla germplasms based on SSR markers. Genes Genom. 2020, 42, 1419–1430. [Google Scholar] [CrossRef]
- Powell, W.; Morgante, M.; Andre, C.; Hanafey, M.; Vogelet, J.; Tingey, S.; Rafalski, A. The comparison of RFLP, RAPD, AFLP and SSR (microsatellite) markers for germplasm analysis. Mol. Breed. 1996, 2, 225–238. [Google Scholar] [CrossRef]
- Ball, R.D. Statistical analysis and experimental design. In Association Mapping in Plants; Oraguzie, N.C., Rikkerink, E.H.A., Gardiner, S.E., Eds.; Springer Science + Business Media LLC: New York, NY, USA, 2007; pp. 133–196. [Google Scholar]
- Gupta, P.K.; Kulwal, P.L.; Jaiswal, V. Association mapping in crop plants: Opportunities and challenges. In Advances in Genetics; Friedmann, T., Dunlap, J., Goodwin, S., Eds.; Academic Elsevier: Amsterdam, The Netherlands, 2014; Volume 85, pp. 109–148. [Google Scholar]
- Sa, K.J.; Park, J.Y.; Woo, S.Y.; Ramekar, R.V.; Jang, C.S.; Lee, J.K. Mapping of QTL traits in corn using a RIL population derived from a cross of dent corn x waxy corn. Genes Genom. 2015, 37, 1–14. [Google Scholar] [CrossRef]
- Choi, J.K.; Sa, K.J.; Park, D.H.; Lim, S.E.; Ryu, S.H.; Park, J.Y.; Park, K.J.; Rhee, H.I.; Lee, M.; Lee, J.K. Construction of genetic linkage map and identification of QTLs related to agronomic traits in DH. population of maize (Zea mays L.) using SSR markers. Genes Genom. 2019, 41, 667–678. [Google Scholar] [CrossRef]
- Kwon, S.J.; Lee, J.K.; Kim, N.S.; Yu, J.W.; Dixit, A.; Cho, E.G.; Park, Y.J. Isolation and characterization of SSR. markers in Perilla frutescens Britt. Mol. Eco. Notes 2005, 5, 454–456. [Google Scholar] [CrossRef]
- Park, Y.J.; Dixit, A.; Ma, K.H.; Lee, J.K.; Lee, M.H.; Chung, C.S.; Nitta, M.; Okuno, K.; Kim, T.S.; Cho, E.G.; et al. Evaluation of genetic diversity and relationships within an on-farm collection of Perilla frutescens (L.) Britt. using microsatellite markers. Genet. Resour. Crop Evol. 2008, 55, 523–535. [Google Scholar] [CrossRef]
- Sa, K.J.; Choi, I.K.; Park, K.C.; Lee, J.K. Genetic diversity and population structure among accessions of Perilla frutescens (L.) Britton in East Asia using new developed microsatellite markers. Genes Genom. 2018, 40, 1319–1329. [Google Scholar] [CrossRef] [PubMed]
- Sa, K.J.; Lim, S.E.; Choi, I.K.; Park, K.C.; Lee, J.K. Development and Characterization of New Microsatellite Markers for Perilla frutescens (L.) Britton. Amer. J. Plant Sci. 2019, 10, 1623–1630. [Google Scholar] [CrossRef] [Green Version]
- Kim, J.Y.; Sa, K.Y.; Ha, Y.J.; Lee, J.K. Genetic variation and association mapping in F2 population of Perilla crop (Perilla frutescens L.) using new developed Perilla SSR markers. Euphytica 2021, 217, 135. [Google Scholar] [CrossRef]
- Park, D.H.; SA, K.J.; Lim, S.E.; Ma, S.J.; Lee, J.K. Genetic diversity and population structure of Perilla frutescens collected from Korea and China based on simple sequence repeats (SSRs). Genes Genom. 2019, 41, 1329–1340. [Google Scholar] [CrossRef] [PubMed]
- Ha, Y.J.; Sa, K.J.; Lee, J.K. Identifying SSR markers associated with seed characteristics in Perilla (Perilla frutescens L.). Physiol. Mol. Biol. Plants 2021, 27, 93–105. [Google Scholar] [CrossRef] [PubMed]
- Lim, S.E.; Sa, K.J.; Lee, J.K. Bulk segregant analysis identifies SSR markers associated with leaf-and seed related traits in-Perilla crop (Perilla frutescens L.). Genes Genom. 2021, 43, 323–332. [Google Scholar] [CrossRef] [PubMed]
- Li, H.L. The vegetables of ancient china. Econ. Bot. 1969, 23, 235–260. [Google Scholar] [CrossRef]
- Song, J.Y.; Lee, J.R.; Kim, C.Y.; Bae, C.H.; Lee, G.A.; Ma, K.H.; Choi, Y.M.; Park, H.J.; Lee, M.C. Assessment of Genetic Diversity and Fatty acid Composition of Perilla (Perilla frutescens var. frutescens) Germplasm. Kor. J. Plant Res. 2012, 25, 762–772. [Google Scholar] [CrossRef] [Green Version]
- Gunstone, F.D.; Harwood, J.; Padley, F.B. The Lipid Handbook, 2nd ed.; Chapman & Hall: London, UK, 1994. [Google Scholar]
- Ding, Y.; Neo, C.M.; Hu, Y.; Shi, L.; Ma, C.; Liu, Y.J. Characterization of fatty acid composition from five perilla seed oils in China and its relationship to annual growth temperature. J. Med. Plants Res. 2012, 6, 1645–1651. [Google Scholar]
- Gwari, G.; Lohani, H.; Haider, S.Z.; Bhandari, U.; Chauhan, N.; Rawat, D.S. Fatty acid and nutrient composition of perilla (Perilla frutescens L.) accessions collected from Uttarakhand. Inter. J. Phytop. 2014, 5, 379–382. [Google Scholar]
- Liu, K.; Muse, S.V. PowerMarker: An integrated analysis environment for genetic marker analysis. Bioinformatics 2005, 21, 2128–2129. [Google Scholar] [CrossRef] [Green Version]
- Dice, L.R. Measures of the amount of ecologic association between species. Ecology 1945, 26, 297–302. [Google Scholar] [CrossRef]
- Rohlf, F. NTSYS-pc: Numerical Taxonomy and Multivariate Analysis System; Version Exter Software: Setauket, NY, USA, 2000. [Google Scholar]
- Pritchard, J.K.; Wen, W. Documentation for STRUCTURE Software: Version. 2003. Available online: http://www.pritc.h.bsd.uchicago.Edu (accessed on 10 January 2021).
- Evanno, G.; Regnaut, S.; Goudet, J. Detecting the number of clusters of individuals using the software. STRUCTURE: A simulation study. Mol. Ecol. 2005, 14, 2611–2620. [Google Scholar] [CrossRef] [PubMed] [Green Version]
- Bradbury, P.J.; Zhang, Z.; Kroon, D.E.; Casstevens, T.M.; Ramdoss, Y.; Buckler, E.S. TASSEL: Software for association mapping of complex traits in diverse samples. Bioinformatics 2007, 23, 2633–2635. [Google Scholar] [CrossRef] [PubMed]
Figure 1.
The magnitude of ∆K as a function of K; the peak value of ∆K was at K = 2, suggesting two genetic clusters in the 100 Perilla accessions.
Figure 1.
The magnitude of ∆K as a function of K; the peak value of ∆K was at K = 2, suggesting two genetic clusters in the 100 Perilla accessions.

Figure 2.
The population structure pattern for the highest ΔK value, K = 2, of 100 accessions of the cultivated var. frutescens based on 40 SSR markers. ○: accessions of cultivated var. frutescens with a low total fatty acid content, ●: accessions of cultivated var. frutescens with high total fatty acid content.

Figure 3.
UPGMA dendrogram of 100 accessions of cultivated var. frutescens based on 40 SSR markers. ○: accessions of cultivated var. frutescens with a low total fatty acid content, ●: accessions of cultivated var. frutescens with high total fatty acid content.
Figure 3.
UPGMA dendrogram of 100 accessions of cultivated var. frutescens based on 40 SSR markers. ○: accessions of cultivated var. frutescens with a low total fatty acid content, ●: accessions of cultivated var. frutescens with high total fatty acid content.

Figure 4.
UPGMA dendrogram of 100 accessions of cultivated var. frutescens based on 11 SSR markers related to Perilla seed oil traits. ○: accessions of cultivated var. frutescens with a low total fatty acid content, ●: accessions of cultivated var. frutescens with a high total fatty acid content.
Figure 4.
UPGMA dendrogram of 100 accessions of cultivated var. frutescens based on 11 SSR markers related to Perilla seed oil traits. ○: accessions of cultivated var. frutescens with a low total fatty acid content, ●: accessions of cultivated var. frutescens with a high total fatty acid content.


Table 1.
The difference in the content of five fatty acids among 100 Perilla accessions collected from South Korea.
Table 1.
The difference in the content of five fatty acids among 100 Perilla accessions collected from South Korea.
| Accession No. | Fatty Acid Content | |||||
|---|---|---|---|---|---|---|
| Total (%) | ||||||
| Palmitic Acid (%) | Stearic Acid (%) | Oleic Acid (%) | Linoleic Acid (%) | Linolenic Acid (%) | ||
| 104232 | 7.39 | 3.47 | 17.9 | 15.4 | 74.4 | 118.6 |
| 104241 | 7.38 | 3.19 | 19.0 | 15.4 | 71.7 | 116.7 |
| 104486 | 7.29 | 3.36 | 17.7 | 16.6 | 70.5 | 115.4 |
| 104507 | 7.28 | 3.13 | 19.6 | 20.9 | 65.9 | 116.8 |
| 104516 | 8.18 | 3.26 | 18.4 | 20.3 | 66.4 | 116.6 |
| 104669 | 7.57 | 3.10 | 14.3 | 14.8 | 57.9 | 97.6 |
| 104754 | 8.23 | 3.28 | 19.1 | 22.1 | 65.9 | 118.6 |
| 105801 | 8.91 | 3.33 | 18.5 | 21.0 | 69.7 | 121.5 |
| 105833 | 7.09 | 3.41 | 20.9 | 15.2 | 70.5 | 117.1 |
| 105928 | 8.76 | 3.24 | 18.7 | 18.3 | 69.8 | 118.8 |
| 105936 | 7.84 | 3.20 | 18.8 | 15.7 | 75.0 | 120.5 |
| 105939 | 7.41 | 2.56 | 17.1 | 20.2 | 72.2 | 119.4 |
| 108995 | 7.07 | 3.14 | 20.4 | 19.3 | 68.1 | 118.0 |
| 109580 | 7.43 | 3.34 | 18.2 | 17.0 | 72.4 | 118.4 |
| 110826 | 7.39 | 2.87 | 14.2 | 15.4 | 58.1 | 97.9 |
| 110974 | 7.79 | 3.30 | 18.5 | 14.2 | 75.1 | 118.9 |
| 113100 | 7.54 | 3.21 | 19.1 | 20.1 | 66.3 | 116.2 |
| 113184 | 8.53 | 3.29 | 17.8 | 21.0 | 68.6 | 119.2 |
| 113569 | 7.45 | 3.06 | 18.6 | 20.0 | 68.8 | 117.9 |
| 117000 | 7.02 | 3.77 | 21.2 | 13.5 | 70.8 | 116.3 |
| 117013 | 7.08 | 3.47 | 20.4 | 15.3 | 69.5 | 115.8 |
| 117015 | 7.05 | 3.88 | 19.0 | 10.2 | 75.4 | 115.5 |
| 117017 | 6.87 | 3.78 | 20.3 | 19.7 | 67.3 | 117.9 |
| 117023 | 7.28 | 3.70 | 19.6 | 12.6 | 72.9 | 116.0 |
| 117027 | 7.26 | 3.37 | 14.2 | 15.2 | 57.9 | 97.9 |
| 117031 | 7.49 | 3.95 | 21.3 | 12.0 | 71.0 | 115.7 |
| 117033 | 6.85 | 3.97 | 21.9 | 15.1 | 68.8 | 116.6 |
| 117037 | 7.37 | 3.79 | 21.3 | 14.5 | 69.1 | 116.0 |
| 117078 | 6.91 | 3.62 | 19.8 | 13.3 | 71.7 | 115.4 |
| 117091 | 7.19 | 3.28 | 18.1 | 20.6 | 70.3 | 119.5 |
| 117093 | 7.74 | 3.53 | 13.5 | 15.9 | 56.5 | 97.3 |
| 117118 | 7.18 | 3.06 | 15.3 | 15.8 | 56.9 | 98.2 |
| 117120 | 6.95 | 2.91 | 13.6 | 14.4 | 60.3 | 98.2 |
| 117121 | 7.33 | 2.96 | 11.9 | 14.5 | 61.0 | 97.7 |
| 117123 | 7.54 | 3.27 | 11.9 | 17.1 | 57.7 | 97.6 |
| 117125 | 7.53 | 3.71 | 19.2 | 16.7 | 68.0 | 115.2 |
| 117128 | 7.54 | 3.24 | 14.2 | 15.1 | 57.7 | 97.8 |
| 117133 | 7.76 | 3.38 | 11.3 | 15.6 | 59.1 | 97.1 |
| 117134 | 7.42 | 2.67 | 13.8 | 16.0 | 57.7 | 97.6 |
| 117137 | 7.67 | 2.95 | 12.5 | 17.7 | 56.6 | 97.5 |
| 117152 | 7.84 | 3.22 | 12.6 | 16.9 | 57.1 | 97.7 |
| 117153 | 7.67 | 3.28 | 14.8 | 17.7 | 54.3 | 97.7 |
| 117161 | 8.92 | 3.36 | 17.2 | 16.4 | 70.5 | 116.4 |
| 117178 | 7.85 | 3.33 | 16.5 | 12.6 | 57.6 | 98.0 |
| 117180 | 7.63 | 2.86 | 12.8 | 15.5 | 59.3 | 98.0 |
| 117187 | 7.28 | 3.25 | 18.7 | 13.6 | 72.5 | 115.4 |
| 117195 | 7.72 | 3.02 | 17.1 | 14.3 | 55.8 | 97.9 |
| 117208 | 7.59 | 3.03 | 16.8 | 14.2 | 56.1 | 97.7 |
| 121520 | 6.52 | 3.72 | 18.5 | 13.8 | 73.8 | 116.3 |
| 157402 | 7.26 | 2.95 | 17.3 | 20.0 | 67.9 | 115.4 |
| 157409 | 7.74 | 3.14 | 13.5 | 14.0 | 59.4 | 97.8 |
| 157413 | 7.47 | 3.21 | 15.6 | 15.2 | 56.3 | 97.8 |
| 157421 | 7.70 | 3.02 | 15.8 | 15.2 | 56.4 | 98.1 |
| 157424 | 7.61 | 3.22 | 14.7 | 17.1 | 55.2 | 97.8 |
| 157427 | 7.76 | 3.16 | 13.4 | 13.8 | 59.5 | 97.6 |
| 157435 | 7.78 | 3.18 | 13.1 | 14.4 | 59.2 | 97.6 |
| 157437 | 7.55 | 3.09 | 13.9 | 14.5 | 59.0 | 98.0 |
| 157446 | 7.46 | 3.11 | 13.1 | 16.5 | 57.4 | 97.6 |
| 157458 | 7.12 | 2.70 | 14.4 | 14.0 | 59.9 | 98.1 |
| 157461 | 7.12 | 2.67 | 13.8 | 14.3 | 60.3 | 98.3 |
| 157468 | 7.38 | 2.71 | 13.7 | 14.3 | 59.7 | 97.8 |
| 157469 | 6.00 | 1.90 | 12.0 | 21.2 | 58.8 | 99.9 |
| 157486 | 6.84 | 2.95 | 18.8 | 13.7 | 57.0 | 99.2 |
| 157489 | 7.10 | 3.99 | 19.2 | 12.6 | 74.4 | 117.3 |
| 157512 | 7.60 | 3.17 | 13.8 | 15.8 | 57.3 | 97.6 |
| 157525 | 7.19 | 3.11 | 14.8 | 14.3 | 58.5 | 97.9 |
| 157528 | 7.41 | 2.93 | 12.8 | 14.8 | 59.8 | 97.7 |
| 157546 | 7.06 | 2.64 | 13.1 | 14.4 | 60.4 | 97.6 |
| 157549 | 6.98 | 3.19 | 13.7 | 12.7 | 60.7 | 97.3 |
| 157555 | 7.18 | 2.82 | 14.4 | 13.8 | 59.3 | 97.5 |
| 157557 | 7.10 | 2.84 | 13.5 | 13.3 | 60.7 | 97.4 |
| 157571 | 7.09 | 2.71 | 12.6 | 15.1 | 60.6 | 98.1 |
| 157575 | 7.06 | 2.49 | 13.2 | 13.5 | 61.8 | 98.1 |
| 157587 | 9.13 | 3.29 | 17.7 | 23.4 | 71.3 | 124.8 |
| 157594 | 6.70 | 2.59 | 14.3 | 12.5 | 62.3 | 98.4 |
| 157595 | 6.90 | 2.55 | 12.4 | 14.8 | 61.5 | 98.2 |
| 158273 | 7.01 | 3.01 | 19.7 | 21.0 | 66.0 | 116.7 |
| 158274 | 8.52 | 3.12 | 15.6 | 20.2 | 68.7 | 116.1 |
| 158275 | 7.07 | 3.14 | 14.8 | 15.0 | 57.7 | 97.7 |
| 175906 | 7.52 | 3.06 | 16.8 | 17.7 | 72.5 | 117.6 |
| 177137 | 5.10 | 2.10 | 11.1 | 22.7 | 58.9 | 99.9 |
| 180960 | 6.89 | 2.81 | 16.5 | 14.4 | 57.2 | 97.8 |
| 180966 | 7.73 | 3.10 | 16.7 | 16.1 | 73.8 | 117.4 |
| 180968 | 6.79 | 3.69 | 19.2 | 17.5 | 68.6 | 115.8 |
| 180973 | 7.78 | 3.14 | 16.2 | 17.9 | 71.1 | 116.1 |
| 180978 | 8.73 | 3.12 | 16.0 | 19.2 | 70.9 | 117.9 |
| 181994 | 7.08 | 3.18 | 18.5 | 17.1 | 73.1 | 119.0 |
| 185634 | 8.03 | 3.24 | 17.7 | 21.8 | 66.3 | 117.1 |
| 185661 | 7.05 | 2.95 | 13.8 | 14.2 | 59.9 | 97.9 |
| 191152 | 7.08 | 3.03 | 14.8 | 14.3 | 58.2 | 97.4 |
| 209219 | 7.08 | 2.93 | 12.7 | 14.9 | 60.3 | 97.9 |
| 209222 | 6.20 | 1.70 | 15.3 | 17.0 | 59.7 | 99.9 |
| 210187 | 7.33 | 3.34 | 19.0 | 20.6 | 66.6 | 116.8 |
| 210189 | 7.62 | 3.35 | 16.1 | 14.0 | 74.7 | 115.8 |
| 213786 | 8.33 | 3.33 | 17.5 | 16.3 | 71.7 | 117.1 |
| 213787 | 7.57 | 3.01 | 18.5 | 12.7 | 74.8 | 116.6 |
| 214465 | 7.22 | 2.87 | 13.5 | 14.4 | 59.9 | 97.9 |
| 214489 | 7.58 | 3.13 | 17.3 | 18.0 | 71.1 | 117.1 |
| 214492 | 8.58 | 3.28 | 16.5 | 17.8 | 68.9 | 115.1 |
| 214493 | 7.14 | 3.67 | 17.9 | 13.7 | 73.3 | 115.7 |
| Mean | 7.43 ± 0.592 | 3.15 ± 0.39 | 16.3 ± 2.75 | 16.2 ± 2.76 | 64.6 ± 6.44 | 107.6 ± 9.79 |
| Max | 9.13 | 3.99 | 21.9 | 23.4 | 75.4 | 124.8 |
| Min | 5.10 | 1.70 | 11.1 | 10.2 | 54.3 | 97.1 |
Table 2.
The correlation analysis for six traits related to the fatty acid content in 100 Perilla accessions.
Table 2.
The correlation analysis for six traits related to the fatty acid content in 100 Perilla accessions.
| SA | OA | LA | LNA | TFAC | |
|---|---|---|---|---|---|
| PA | 0.315 ** | 0.123 | 0.246 * | 0.192 | 0.303 ** |
| SA | 0.619 ** | −0.157 | 0.477 ** | 0.503 ** | |
| OA | 0.141 | 0.724 ** | 0.829 ** | ||
| LA | 0.132 | 0.417 ** | |||
| LNA | 0.929 ** |
** Significance at p < 0.01, * Significance at p < 0.05.
Table 3.
Estimates of the allele number, GD, PIC, and MAF of 40 SSR primer sets among 100 Perilla accessions.
Table 3.
Estimates of the allele number, GD, PIC, and MAF of 40 SSR primer sets among 100 Perilla accessions.
| SSR Loci | Allele No | GD | PIC | MAF |
|---|---|---|---|---|
| KNUPF1 | 5 | 0.332 | 0.315 | 0.810 |
| KNUPF2 | 9 | 0.757 | 0.717 | 0.450 |
| KNUPF3 | 6 | 0.625 | 0.585 | 0.630 |
| KNUPF4 | 5 | 0.709 | 0.655 | 0.820 |
| KNUPF5 | 6 | 0.687 | 0.633 | 0.620 |
| KNUPF10 | 9 | 0.743 | 0.718 | 0.280 |
| KNUPF11 | 4 | 0.313 | 0.293 | 0.550 |
| KNUPF14 | 5 | 0.594 | 0.544 | 0.700 |
| KNUPF16 | 9 | 0.798 | 0.769 | 0.710 |
| KNUPF19 | 4 | 0.329 | 0.310 | 0.650 |
| KNUPF23 | 4 | 0.502 | 0.457 | 0.570 |
| KNUPF25 | 6 | 0.637 | 0.575 | 0.280 |
| KNUPF26 | 3 | 0.398 | 0.353 | 0.810 |
| KNUPF28 | 5 | 0.486 | 0.450 | 0.320 |
| KNUPF35 | 4 | 0.635 | 0.579 | 0.670 |
| KNUPF36 | 4 | 0.665 | 0.618 | 0.490 |
| KNUPF37 | 4 | 0.661 | 0.602 | 0.750 |
| KNUPF39 | 7 | 0.695 | 0.662 | 0.690 |
| KNUPF43 | 5 | 0.645 | 0.574 | 0.560 |
| KNUPF53 | 11 | 0.807 | 0.783 | 0.520 |
| KNUPF55 | 9 | 0.759 | 0.720 | 0.500 |
| KNUPF58 | 3 | 0.462 | 0.414 | 0.470 |
| KNUPF59 | 5 | 0.543 | 0.457 | 0.490 |
| KNUPF62 | 6 | 0.612 | 0.570 | 0.370 |
| KNUPF71 | 4 | 0.639 | 0.568 | 0.430 |
| KNUPF72 | 9 | 0.771 | 0.740 | 0.430 |
| KNUPF74 | 3 | 0.516 | 0.453 | 0.310 |
| KNUPF77 | 3 | 0.663 | 0.589 | 0.320 |
| KNUPF78 | 4 | 0.665 | 0.603 | 0.700 |
| KNUPF80 | 7 | 0.794 | 0.764 | 0.570 |
| KNUPF82 | 6 | 0.697 | 0.643 | 0.570 |
| KNUPF85 | 4 | 0.565 | 0.516 | 0.460 |
| KNUPF89 | 12 | 0.824 | 0.802 | 0.370 |
| KNUPF107 | 6 | 0.568 | 0.540 | 0.640 |
| KNUPF112 | 8 | 0.588 | 0.567 | 0.370 |
| KNUPF113 | 10 | 0.847 | 0.830 | 0.440 |
| KNUPF117 | 4 | 0.617 | 0.566 | 0.270 |
| KNUPF118 | 4 | 0.446 | 0.383 | 0.400 |
| KNUPF121 | 4 | 0.461 | 0.424 | 0.610 |
| KNUPF125 | 5 | 0.516 | 0.463 | 0.270 |
| Mean | 5.8 | 0.614 | 0.570 | 0.522 |
| Total | 231 |
GD: Gene Diversity, PIC: Polymorphism Information Content, MAF: Major Allele Frequency.
Table 4.
Information on SMTA markers using the GLM method for 100 Perilla accessions.
| Trait | SSR Marker | GLM |
|---|---|---|
| TFAC | KNUPF14 | *** |
| KNUPF62 | *** | |
| KNUPF72 | ** | |
| KNUPF85 | *** | |
| LNA | KNUPF14 | *** |
| KNUPF53 | ** | |
| KNUPF62 | *** | |
| KNUPF72 | ** | |
| KNUPF85 | *** | |
| LA | KNUPF125 | ** |
| OA | KNUPF62 | ** |
| KNUPF85 | ** | |
| PA | KNUPF10 | ** |
| KNUPF89 | *** | |
| SA | KNUPF10 | *** |
| KNUPF16 | ** | |
| KNUPF71 | *** | |
| KNUPF118 | ** |
** p ≤ 0.01, *** p ≤ 0.001.
Table 5.
Characteristics of the 40 Perilla microsatellite loci used in the study.
| SSR Loci | Forward Primer | Reverse Primer | Repeat Motif |
|---|---|---|---|
| KNUPF1 | CTTGCAGCTGATCATTAAGCTA | TTTCTTGTGTGCTCTAACAACG | (AG)11 |
| KNUPF2 | GAAACCAAATTTCTTGTTCTTACA | CAAACGCAGACTCTTATCAATG | (AG)16 |
| KNUPF3 | TTCCTTGTAGTCATCTGATCCC | TGGAAATTAATTAAAGGGCTGA | (AG)16 |
| KNUPF4 | TTTCAAAAATCTTACCAACGCT | TTCGTTTTTGCATCTAATTATTCA | (AT)10 |
| KNUPF5 | TCCATCTCATCTCATTCAAACA | ATGGATCGGAAATCTAAAAACA | (AT)10 |
| KNUPF10 | GCTGATGGGACTACCCATAATA | AGGATCGGAACAATTATTAGCC | (AT)11 |
| KNUPF11 | TTGCAAGGTAAGATGATGATGA | TTGAGGATTGACAATGTTCGT | (CA)10 |
| KNUPF14 | AAATTCTCCCTCCACTCTTCAC | TGTTGGCTTTTTCAAATCTTTT | (CT)12 |
| KNUPF16 | CCTGTATCTCTCCCCGATAAAT | TGGATTTAATGCAGTTGAGTTG | (CT)22 |
| KNUPF19 | TCGAGGTTGAACAGATACAATG | TGATTAATTTCTTACGTACACTCCA | (TG)10 |
| KNUPF23 | TTGCAAGTTCTTGAATTGTGAC | CACTCCTTCCCTCCTCTTTAAT | (TG)11 |
| KNUPF25 | GCTTAGTGTGAGGAATTATGTAGGA | ACTCAGCATGCTTGAATTCTC | (AAG)12 |
| KNUPF26 | ATTTGAAATCGAAAAAGCAAAA | TGCAACCCTATTAGCAGTTTCT | (ACA)8 |
| KNUPF28 | CAACCTCTTAAGCCTTTGAACA | AATGTGACGGGTTCTGTAAATC | (AGA)8 |
| KNUPF35 | CTCTTTCCTTCTCATTCACCAC | CCCTTTTTCTTACCCACTCTCT | (CTT)10 |
| KNUPF36 | GGGAGACGAGATAACACATGAT | TGCATACTCGATTGAAAGAAGA | (GCT)8 |
| KNUPF37 | GGTGTGAAAAAGAGAGTGGAGA | TTGAATTGCCTGTTGATAGTGA | (GGT)10 |
| KNUPF39 | TCACCTTCCCCTTCATTTATTA | AGGATCGAACAGAACAAACTGT | (TCT)13 |
| KNUPF43 | GTCAAATGAAATTCACACATTTTA | GTAAATGGGAATTTTTGAGGAG | (AT)7 |
| KNUPF53 | GATTCATCATTCAGCTCTCTCC | ATGACCAATGGATTAAACAAGG | (CT)17 |
| KNUPF55 | TGCTGTTGATGACTTGTATGGT | ATGAGATTTGGCTTCACAGAGT | (AGC)7 |
| KNUPF58 | GTATATGTGTGGGAAGGTTGCT | TCAATTTCCTCATCAAATCAAA | (ATG)7 |
| KNUPF59 | AATCTCGATGCCTAACAACAGT | TTCCTTGTAAATCCAGCTAAGG | (CAG)7 |
| KNUPF62 | CCATCCTTCTTGTTCAACTCAT | AATGTTGATGAGGAGACGTTTT | (CAT)7 |
| KNUPF71 | GAAGAATGCATCAGTAACACGA | ATGCTGGCCAAGTAATAAGAGA | (AGCT)4 |
| KNUPF72 | TAATTTGAGGGATTCCTTTCCT | CGCCACCCTTACTACTTCATAC | (TCGA)4 |
| KNUPF74 | TTGACTGTACCAGAGCATCAAG | GGGTACACTCACAACTCTACCAA | (AAAT)6 |
| KNUPF77 | TTTTTGGTTGCTTTTTCTTGAT | AGCAGATAAAATGTGCTGGATT | (TATG)10 |
| KNUPF78 | GCGTTATTATTTTTCAAGATCG | TCAATGATTTTACAGAAGATGCT | (AAC)7 |
| KNUPF80 | GATTCATCATTCAGCTCTCTCC | ATGACCAATGGATTAAACAAGG | (CT)17 |
| KNUPF82 | AAACCAAGGAACTCGTCAACTA | CGCTTCGTCTTTATTGTGTGTA | (AGA)7 |
| KNUPF85 | GATGACGATGAAGCTTTTCAG | CTCCTCAGCAGTTTCACCTAAC | (GAT)7 |
| KNUPF89 | ATATCCCATTTTCTGATGCAAG | CCTTTTTCTTGCCTACTCATCA | (AGTG)6 |
| KNUPF107 | TAAGGTTGCCGATTGTACTTTT | ACAGAATGGCTCACAAGGATAG | (AG)25 |
| KNUPF112 | AGTTGGAGTGGTTAAACTTGGA | CACGCACACTCCAATACTACAA | (AG)17 |
| KNUPF113 | GTAGGCATCCCTTTTTCTTCC | TTCAAGTTTACTCTTCACCGCT | (CT)17 |
| KNUPF117 | GTTGACCGATTTAGTTGGTTGT | TTTACACTGGTGACCGTCATT | (ATA)7 |
| KNUPF118 | CTAAAGATCATTGTGGAGGGAA | ACTCCATGAAATCCAACTCATC | (ATG)7 |
| KNUPF121 | ACATACAAATGTCTTTCCTGGG | AAGTAAGACATGGGAATTGGTG | (TCT)7 |
| KNUPF125 | TGTCCTTATTTTTCGTCGTCTT | TTCATAGAAACCTATGCCCTTG | (AAAG)4 |
Publisher’s Note: MDPI stays neutral with regard to jurisdictional claims in published maps and institutional affiliations. |
© 2021 by the authors. Licensee MDPI, Basel, Switzerland. This article is an open access article distributed under the terms and conditions of the Creative Commons Attribution (CC BY) license (https://creativecommons.org/licenses/by/4.0/).
Share and Cite
MDPI and ACS Style
Park, H.; Sa, K.J.; Hyun, D.Y.; Lee, S.; Lee, J.K. Identifying SSR Markers Related to Seed Fatty Acid Content in Perilla Crop (Perilla frutescens L.). Plants 2021, 10, 1404. https://0-doi-org.brum.beds.ac.uk/10.3390/plants10071404
AMA Style
Park H, Sa KJ, Hyun DY, Lee S, Lee JK. Identifying SSR Markers Related to Seed Fatty Acid Content in Perilla Crop (Perilla frutescens L.). Plants. 2021; 10(7):1404. https://0-doi-org.brum.beds.ac.uk/10.3390/plants10071404
Chicago/Turabian StylePark, Hyeon, Kyu Jin Sa, Do Yoon Hyun, Sookyeong Lee, and Ju Kyong Lee. 2021. "Identifying SSR Markers Related to Seed Fatty Acid Content in Perilla Crop (Perilla frutescens L.)" Plants 10, no. 7: 1404. https://0-doi-org.brum.beds.ac.uk/10.3390/plants10071404
Note that from the first issue of 2016, this journal uses article numbers instead of page numbers. See further details here.