Article

PbCOP1.1 Contributes to the Negative Regulation of Anthocyanin Biosynthesis in Pear

College of Horticulture, Northwest A&F University, Taicheng Road NO.3, Yangling 712100, China
*
Authors to whom correspondence should be addressed.
Submission received: 26 December 2018 / Revised: 30 January 2019 / Accepted: 30 January 2019 / Published: 12 February 2019

Abstract

:
The synthesis of anthocyanin in pear (Pyrus bretschneideri) fruit is regulated by light. However, little is known about the molecular mechanisms of pear fruit coloring mediated by upstream light-signaling regulators. Here, the photoresponse factors CONSTITUTIVE PHOTOMORPHOGENIC (COP) 1.1 and 1.2 were cloned from ‘Red Zaosu’ peel to study their functions in pear fruit coloring. The overexpression vectors pBI121-PbCOP1.1 and pBI121-PbCOP1.2 were constructed to analyze their effects on anthocyanin synthesis in pear fruit. A protein sequence alignment and phylogenetic tree analysis revealed that PbCOP1 proteins are highly homologous with those of other species. An analysis of tissue differential expression showed that the greatest expression levels of PbCOP1s occurred in the leaves. Their expression levels increased in the leaves during development, when the leaves changed from red to green. The overexpression of PbCOP1s in the peel resulted in reduced anthocyanin synthesis at the injection sites. A quantitative PCR analysis of the injection sites showed that PbCOP1.1 significantly inhibited the expression of the anthocyanin synthesis-related genes CHI, DFR, UFGT2, bHLH3, HY5 and GST. Based on the above results, we hypothesize that PbCOP1.1 is an anthocyanin synthetic inhibitory factor of pear coloration.

1. Introduction

Fruit color is an important factor that influences consumer choice. Red-skinned pear is popular among consumers because of the bright color. Globally, European pear contains the most red-skinned cultivars, and some, like Red Bartlett, undergo color fading after ripening. This phenomenon has serious effects on the economic values of these cultivars. Anthocyanins are the main pigments that determine pear fruit coloration [1]. Consequently, it is important to study the mechanisms of anthocyanin accumulation and degradation in pear.
Anthocyanin biosynthesis is regulated by structural (PAL, CHS, CHI, F3H, DFR, ANS, and UFGT) and regulatory genes [2,3,4,5]. The latter can act as master regulators to coordinate the expression of the former in the anthocyanin biosynthetic pathway. Regulatory genes are mainly derived from two major classes of transcription factors, the myeloblastosis (MYB) and basic helix–loop–helix (bHLH) families, which, along with WD-repeat protein, form a MYB–bHLH–WDR transcription complex to regulate anthocyanin synthesis [6,7]. In addition, anthocyanin synthesis is controlled by external environmental factors, such as nutrient depletion, drought, pathogen infection, temperature, and light [8]. Light is a decisive environmental factor that affects the accumulation of anthocyanins in fruit. Light can cause an increase in anthocyanin abundance, indicating that there is a correlation between anthocyanin synthesis and the status of the light-signaling pathway [9,10,11,12].
Higher plants have sophisticated light-receiving and signal transduction systems. The E3 ubiquitin ligase COP1 is a photomorphogenic inhibitor that plays a decisive role in phototransduction and acts as a molecular switch during light-induced plant growth and development. It affects flowering time, photoperiodic growth and stomatal development [13,14,15]. CONSTITUTIVELY PHOTOMORPHOGENIC1/SUPPRESSOR OF PHYA-105 (COP1/SPA) ubiquitin ligase degrades the photomorphogenesis-promoting transcription factors ELONGATED HYPOCOTYL5 (HY5), LONG AFTER FAR-RED1 and LONG HYPOCOTYL IN FAR-RED1 through the 26S proteasome pathway [16,17,18]. In addition to these transcription factors, the photoreceptors phytochrome (PHY) A and B and cryptochrome (CRY) 2 are subjected to COP1-mediated degradation [19,20,21,22]. Among these transcription factors, HY5 positively regulates anthocyanin synthesis by binding to the promoters of anthocyanin biosynthetic genes. COP1 degrades HY5 by ubiquitination to reduce anthocyanin accumulation [23,24]. In pear, the blue-light signal transduction module CRY–COP1–HY5 is involved in the regulation of anthocyanin synthesis, but this does not directly verify the function of COP1 [25]. In apples and Arabidopsis, the COP1/SPA complex regulates anthocyanin synthesis by regulating the transcriptional and translational levels of MYB transcription factors [26,27].
COP1 plays an important role in the regulatory pathways of anthocyanin synthesis. At present, no functional verification study has proven that PbCOP1 effects the coloration of pear fruit. In this study, two COP1 genes, PbCOP1.1 and PbCOP1.2, were isolated from the fruit of ‘Red Zaosu’. The tissue-specific expression, and expression at different leaf developmental stages for PbCOP1s was investigated. It indicates that PbCOP1s may also inhibit anthocyanin synthesis in pears. We overexpressed PbCOP1s to identify its function in pear fruits, and then the structural and regulatory genes of anthocyanin synthesis pathway regulated by COP1 was discussed.

2. Results

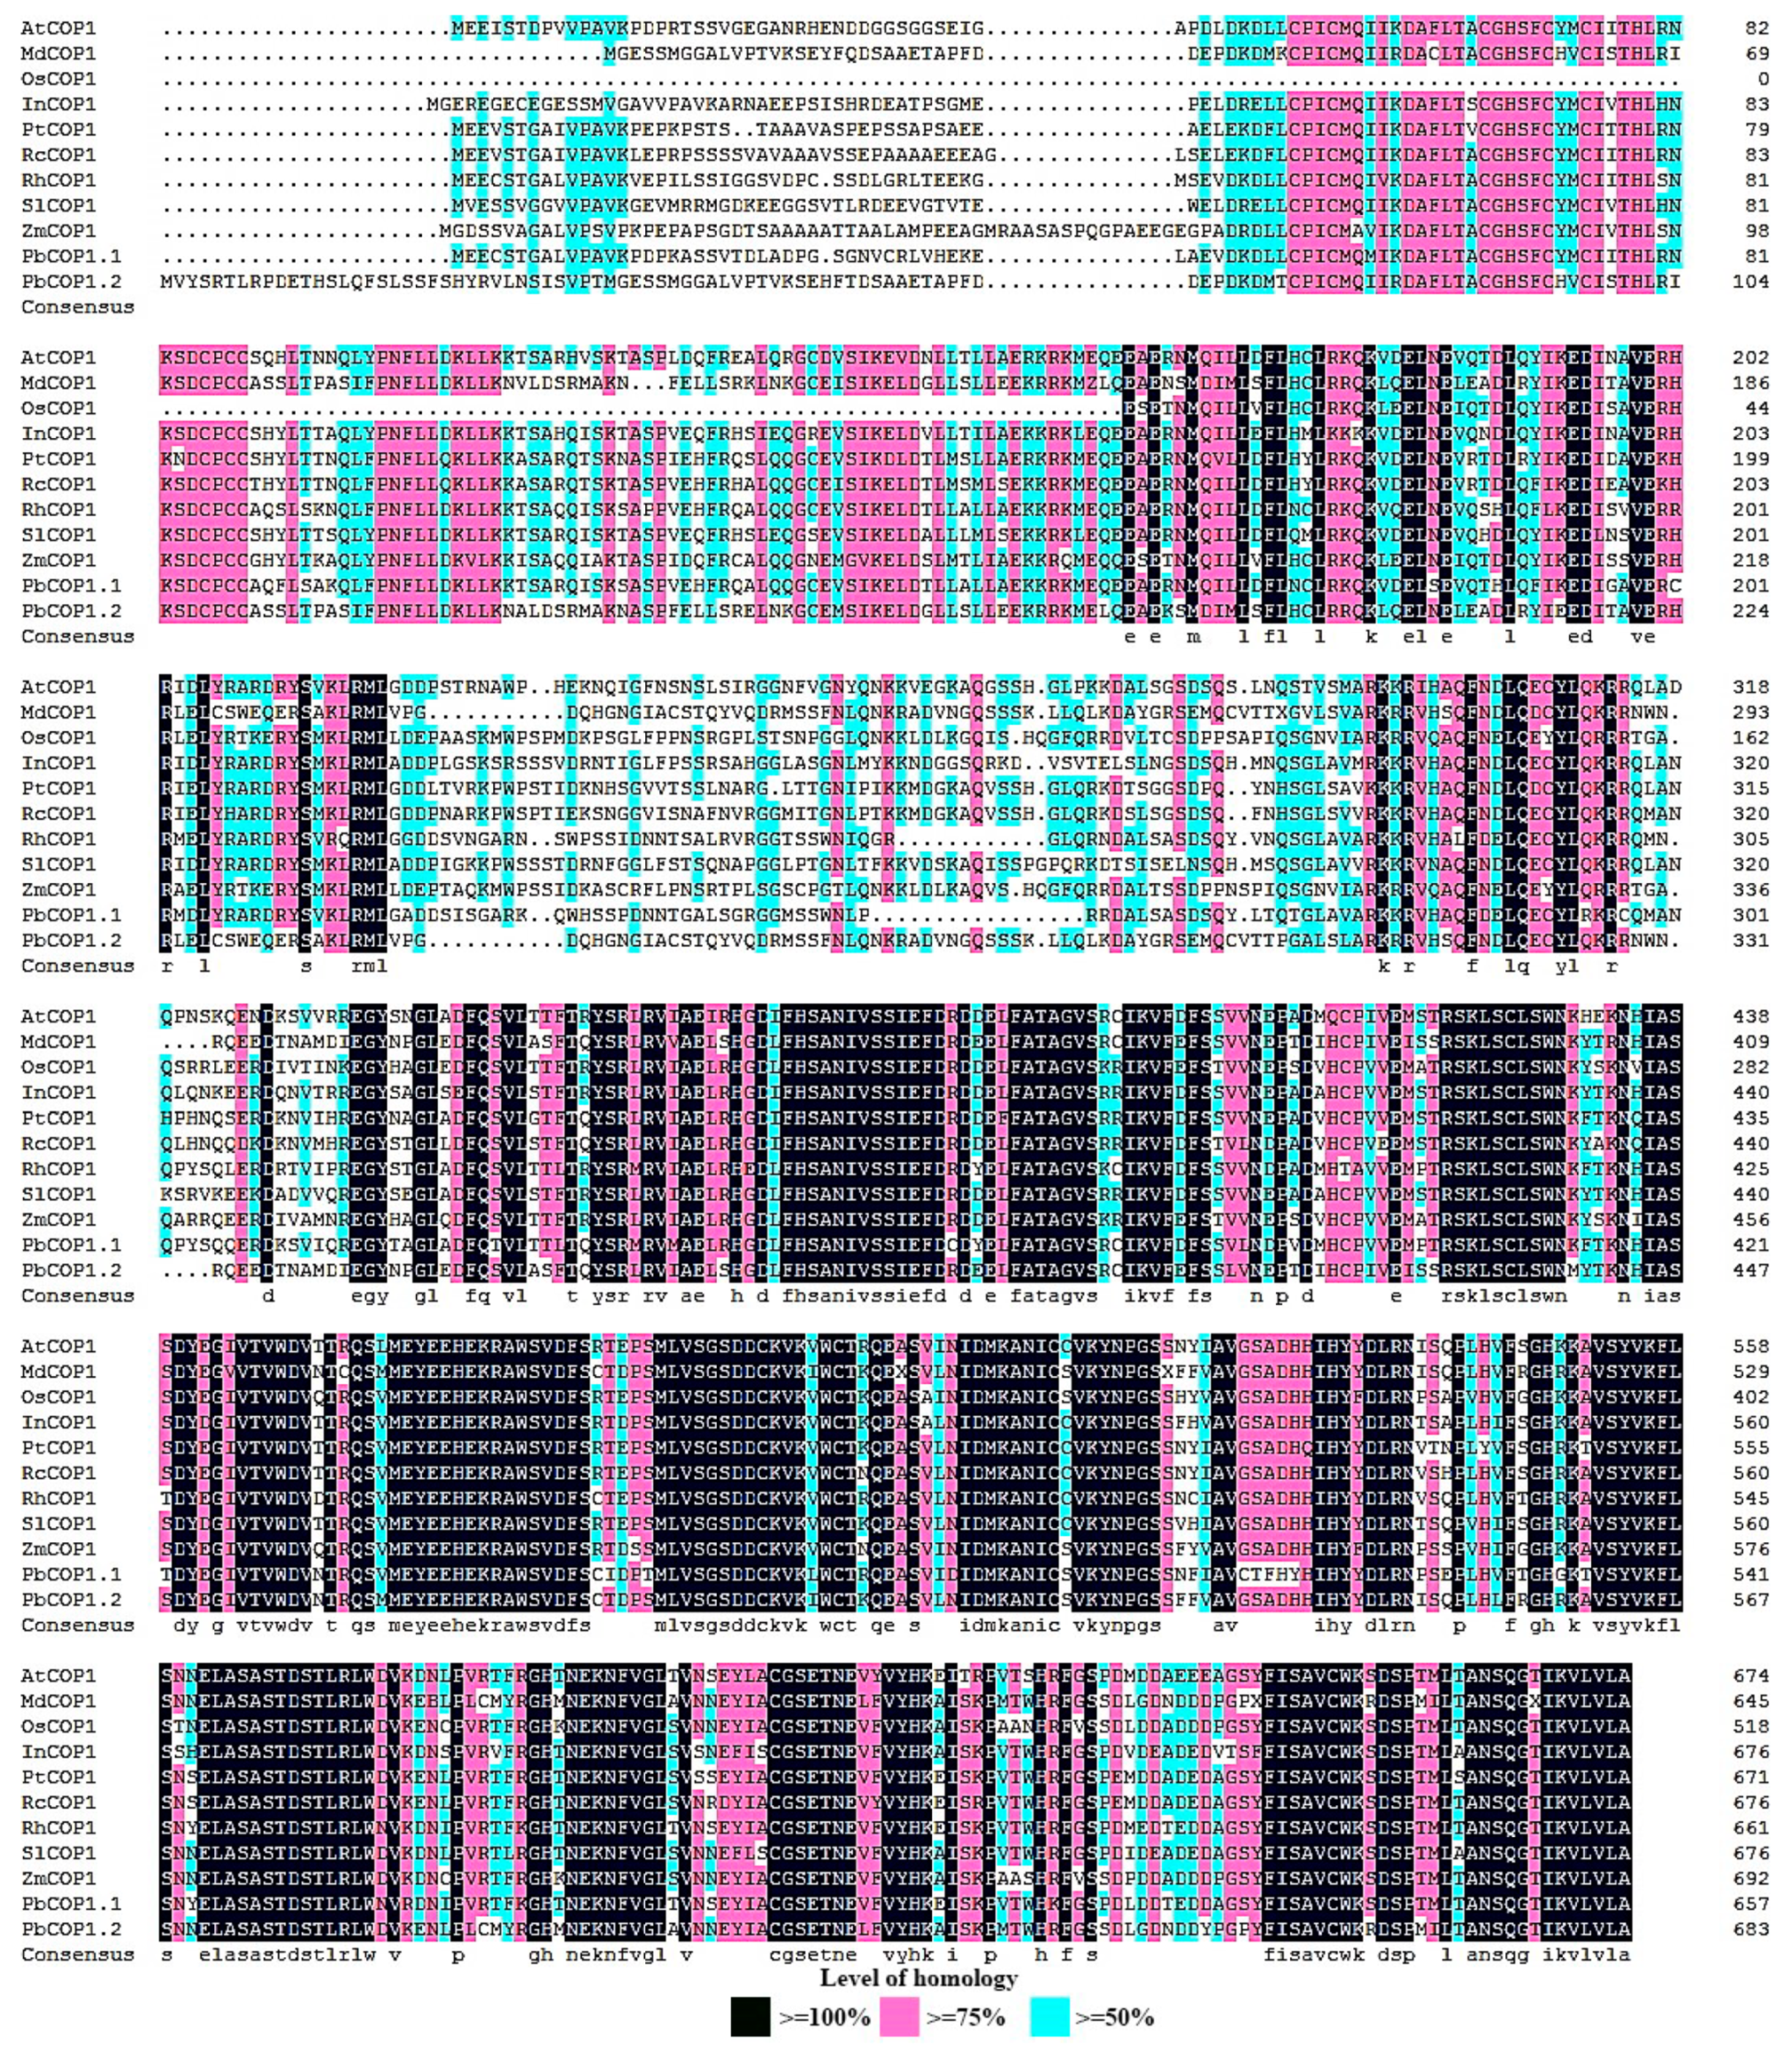
2.1. PbCOP1 Cloning and Homology Analysis

PbCOP1 genes were isolated from pear. A BLAST-algorithm based search of the pear genomic database found two COP1-like genes, named PbCOP1.1 and PbCOP1.2, respectively. We cloned the full-length cDNA sequences of PbCOP1.1 and PbCOP1.2 (Supplemental Figure S1). The open reading frame of PbCOP1.1 is 2055 bp and encodes a protein containing 684 amino acid residues. The open reading frame of PbCOP1.2 is 1977 bp and encodes a protein containing 658 amino acid residues. The amino acid sequences of the predicted PbCOP1.1 and PbCOP1.2 proteins were highly similar (60.23%). A multiple COP1 protein sequence alignment indicated that PbCOP1s were highly homologous with those of other species, including Arabidopsis thaliana AtCOP1 (AEC08766.1), Malus × domestica MdCOP1 (AB668570.1), Oryza sativa subsp. indica OsCOP1 (BAA94422.1), Ipomoea tricolor InCOP1 (AAG31173.1), Populustrichocarpa PtCOP1 (XP_002321154.1), Solanum lycopersicum SlCOP1 (AAC98912.1), Ricinus communis RcCOP1 (XP_002534127.1), Rosa spp. hybrid cultivar RhCOP1 (AAK81856.1), and Zea mays ZmCOP1 (ACG47820.1) (Figure 1).
Furthermore, a phylogenetic analysis based on amino acid sequences was used to analyze the phylogenetic relationship between each of the PbCOP1s and the COP1s from other plant species. PbCOP1.1 was most closely related with MdCOP1, and they form one clade. Interestingly, PbCOP1.2 was most similar to RhCOP1 and AtCOP1, and they clustered together in the other clade (Figure 2).

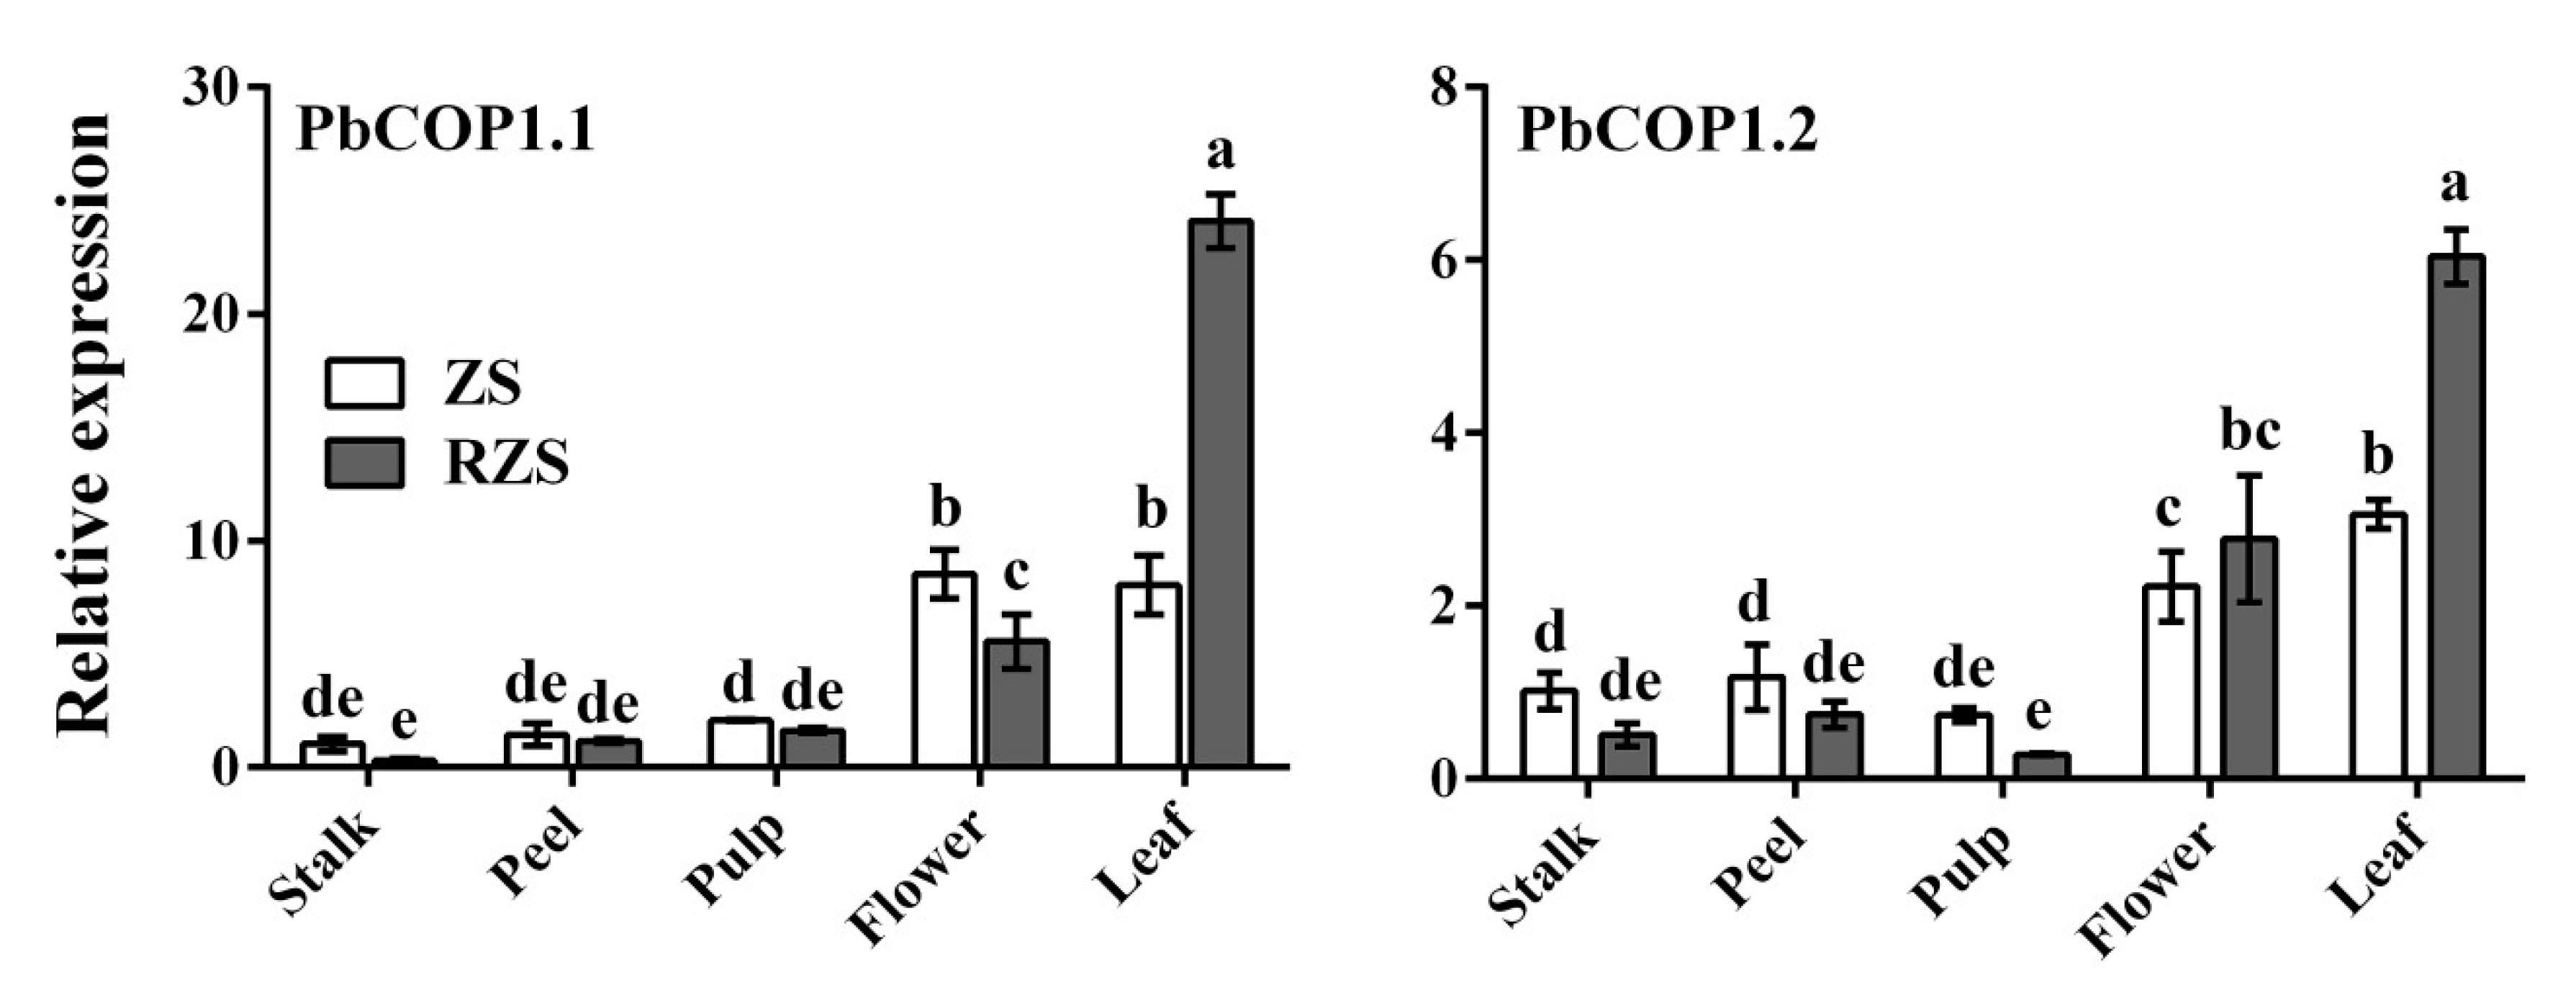
2.2. Expression Level Analysis of PbCOP1s in Pear

PbCOP1.1 and PbCOP1.2 were expressed in stalks, peel, flesh, flowers and mature leaves, with the greatest expression level occurring in mature leaves, followed by flowers. The PbCOP1.1 expression level was lowest in the stalk, and the PbCOP1.2 expression level was lowest in the pulp. In mature leaves, the PbCOP1.1 and PbCOP1.2 expression levels in ‘Red Zaosu’ were more than twice as high as in ‘Zaosu’ (Figure 3).
Subsequently, we analyzed the PbCOP1s’ expression levels in the leaves of ‘Red Zaosu’ and ‘Zaosu’ at different developmental stages. ‘Red Zaosu’ is a red sport of ‘Zaosu’. The anthocyanin contents of ‘Red Zaosu’ decreased sharply as leaves changed color from fully red to fully green. The anthocyanin contents of ‘Zaosu’ were slightly reduced, and there were no significant differences among the developmental stages (Figure 4A,B). The PbCOP1.1 expression level in fully green leaves was approximately three times of that in fully red leaves. The PbCOP1.2 expression level in fully green leaves was approximately two times that in fully red leaves. As the leaves of ‘Red Zaosu’ changed from fully red to fully green, the expression levels of PbCOP1.1 and PbCOP1.2 gradually trended upward, which was the opposite of the anthocyanin accumulation pattern. However, PbCOP1.1 and PbCOP1.2 showed downward expression trends in ‘Zaosu’ during the same developmental period (Figure 4C). This indicated that PbCOP1.1 and PbCOP1.2 may be negatively regulate anthocyanin synthesis. In addition, we also examined the anthocyanin contents and the expression levels of PbCOP1s of ‘Red Bartlett’ at different stages of fruit development. The anthocyanin contents showed a rise–drop tendency. PbCOP1.1’s expression level showed a drop–rise tendency, which was the opposite of the anthocyanin. However, the PbCOP1.2’s expression level was on the rise (Supplementary Material Figure S2). This suggests that PbCOP1.1 and PbCOP1.2 may have different functions in the peel.

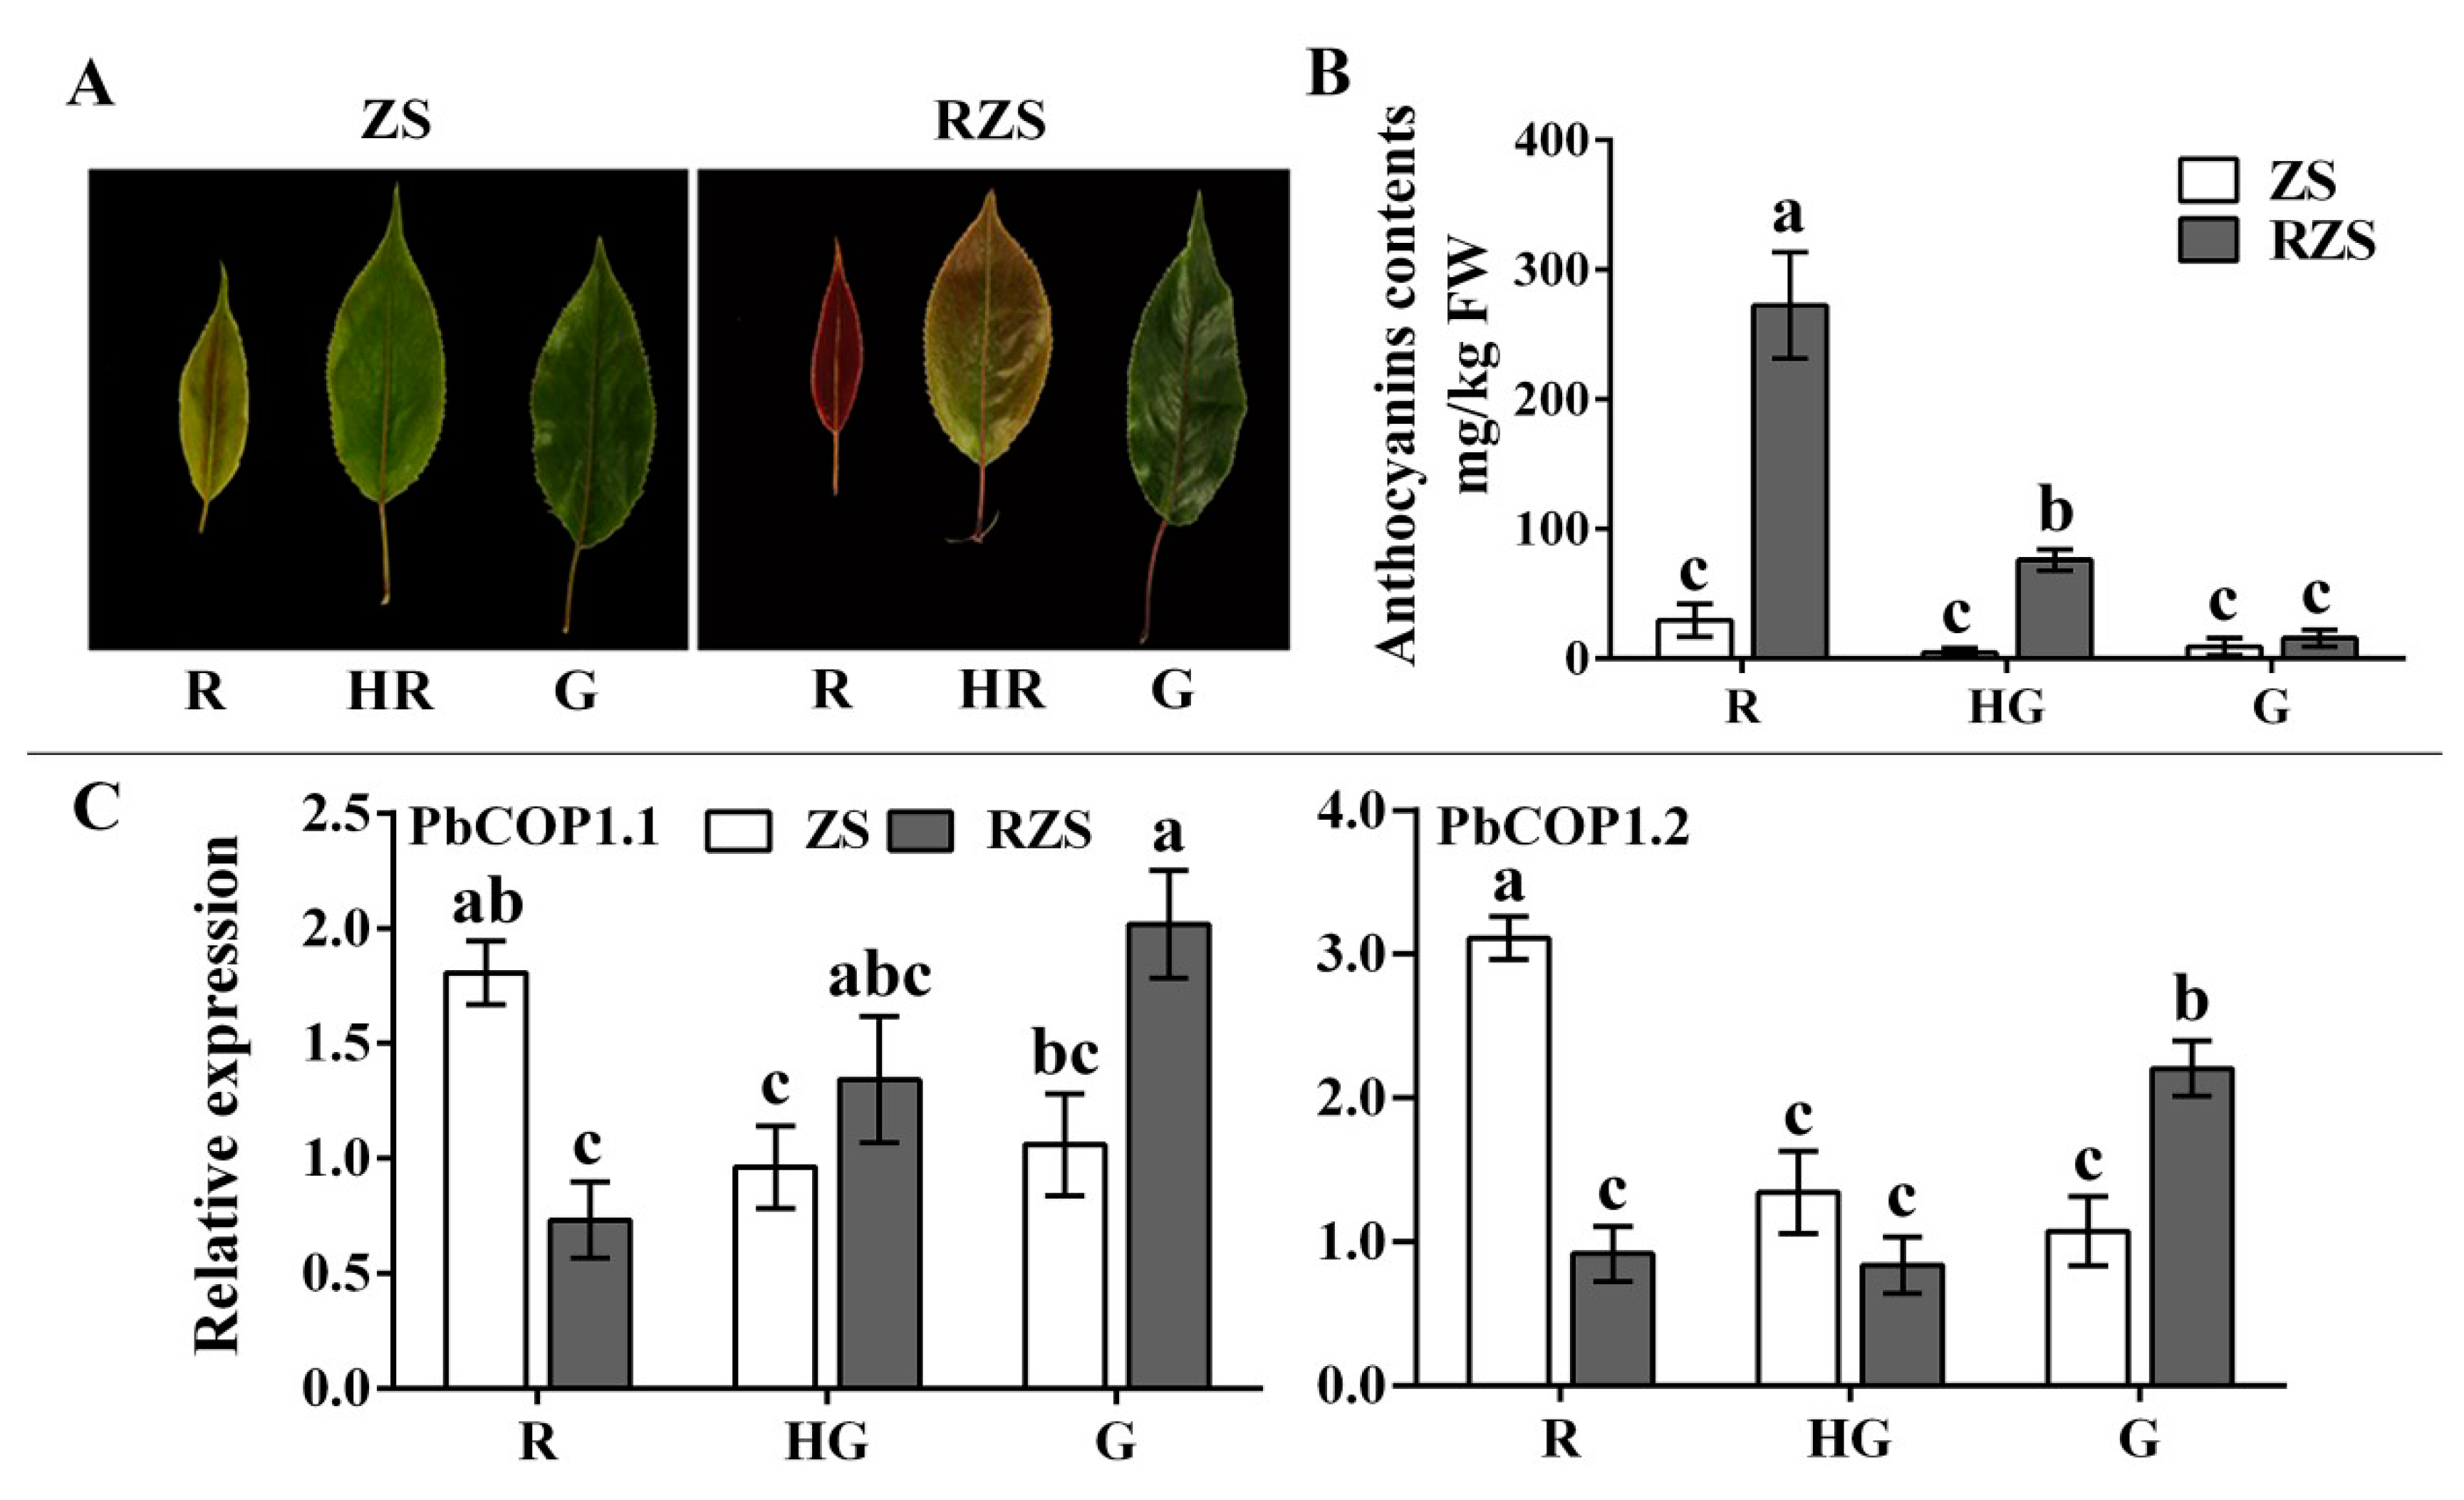
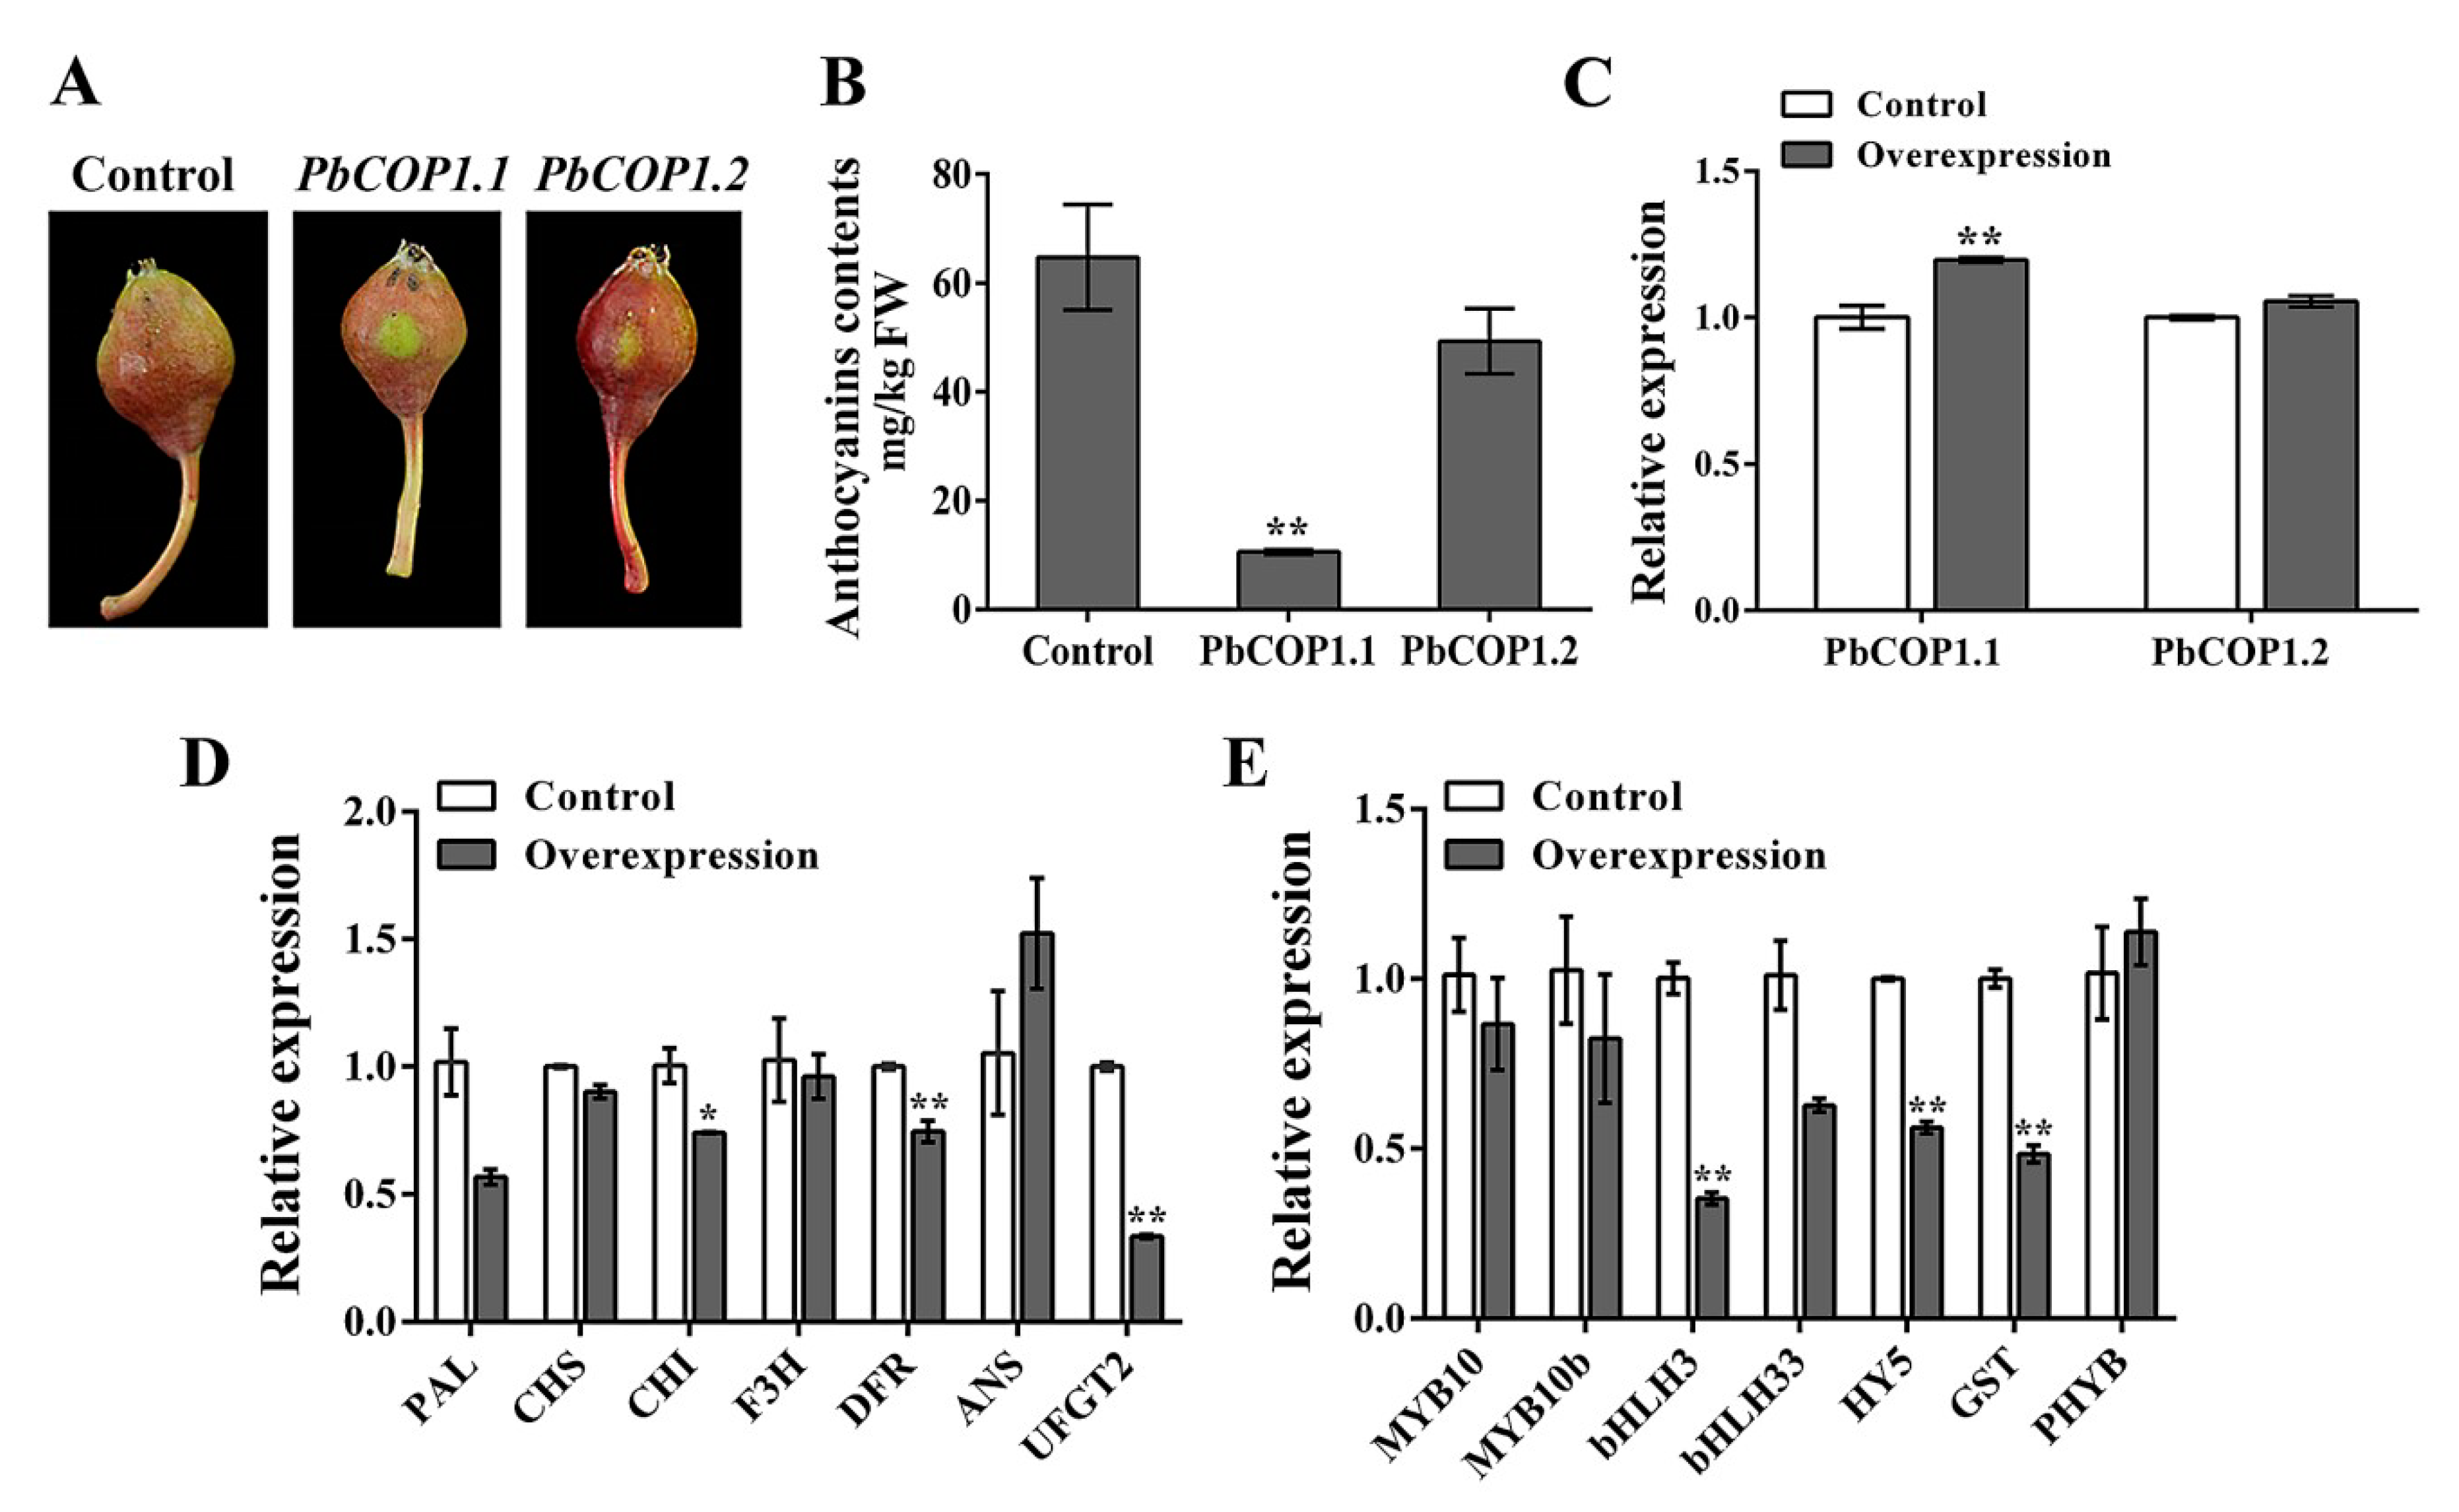
2.3. PbCOP1.1 Negatively Regulates Fruit Coloration in Pear

To verify PbCOP1 functions in pear fruit coloration, their expression levels were enhanced in transient overexpression assays. The overexpression of both PbCOP1.1 and PbCOP1.2 inhibited fruit coloration around the injection sites in ‘Red Bartlett”. The expression level of PbCOP1.1 was significantly enhanced in its overexpressing fruit compared with in the empty vector, while that of PbCOP1.2 was also enhanced in its overexpressing fruit, but not significantly. Compared with the control, the anthocyanin contents were reduced significantly in the peel of fruit overexpressing PbCOP1.1, while no significant difference was observed in the anthocyanin contents of fruit overexpressing PbCOP1.2 (Figure 5A–C). Therefore, the expression levels of anthocyanin-related synthetic genes were assessed by real-time PCR using PbCOP1.1 overexpressing peel.
The expression levels of structural genes were down-regulated, and among them CHI, DFR and UFGT2 were significantly down-regulated. Although ANS was up-regulated, no significant changes were detected in its expression levels (Figure 5D). Moreover, the expression levels of the regulatory genes (bHLH3, HY5 and GST) in anthocyanin synthesis pathway were significantly down-regulated. The expression level of the light-responsive gene PHYB did not show any significant differences (Figure 5E). Thus, the overexpression of PbCOP1.1 decreased the expression levels of anthocyanin-related synthetic genes and negatively regulated fruit coloration in pear.

3. Discussion

In plants, COP1 is an inhibitor of photomorphogenesis, interacting with upstream photoreceptors and downstream target proteins to regulate light-induced plant growth and development [28]. When the cells are located in the dark, COP1 is localized to the nucleus and the photomorphogenesis is inhibited. But when the cells are exposed to light, COP1 is transferred to the cytoplasm and photomorphogenesis is restored [29]. Light and photoreceptor proteins regulate the nuclear localization of COP1 proteins. These photoreceptors mainly include PHYs, CRYs and UV-B receptors [30,31,32]. Photoreceptors regulate the COP1 protein content in the nucleus in different ways. PHYA may inhibit the transport of the COP1 protein from the nucleus into the cytoplasm. PHYB mainly regulates the transport or degradation of COP1 proteins in the nucleus [33]. COP1 regulates anthocyanin synthesis by altering its sub-cellular localization. First, HY5 protein was degraded through COP1/SPA E3 ubiquitin ligase in dark-growing seedlings. HY5 promotes the biosynthesis of anthocyanins by inducing the expression of anthocyanin biosynthetic genes such as CHS, DFR, ANS and PAP1 [16,23,34]. Second, the COP1 protein promotes MYB protein degradation through ubiquitination, resulting in the down-regulation of the main structural genes and a decrease in the anthocyanin contents [26,27,35]. Other studies have shown that, COP1 does not inhibit anthocyanin accumulation in the nucleus. Under dark conditions, the COP1 content of ‘Jingxiu’ grapefruit increases compared with under light conditions, and the anthocyanin contents decreases. However, in another study, no differences were found in the COP1 contents and anthocyanin abundances between ‘Jingyan’ grapes maintained under light and dark conditions [36]. In this study, the analysis of the phylogenetic tree’s cluster showed that PbCOP1.1 and MdCOP1 formed one clade, while PbCOP1.2, AtCOP1 and RhCOP1 were assigned to another one (Figure 2). COP1 negatively regulates the accumulation of anthocyanin in Arabidopsis and apple in the darkness; therefore, PbCOP1.1 and PbCOP1.2 may be involved in the regulation of anthocyanin synthesis. In ‘Red Zaosu’, the transcriptional levels of the PbCOP1s were much greater in fully red leaves compared with fully green leaves, which was contrary to the anthocyanin accumulation level (Figure 4). This may indicate that PbCOP1s negatively regulate anthocyanin synthesis. In addition, COP1 was considered a candidate gene in a transcriptome study in which genes related to color fading in ‘Red Bartlett’ were screened [37]. Therefore, we selected ‘Red Bartlett’ as the material used in the functional verification of PbCOP1s.
Here, the expression levels of PbCOP1.1 in the peel around injection areas increased and the anthocyanin levels decreased significantly, when compared with the empty vector. However, the PbCOP1.2 expression levels were only slightly elevated, and the anthocyanin levels decreased slightly. This may result from the presence of other mechanisms that inhibit the overexpression of PbCOP1.2, or due to PbCOP1.2 not acting as an efficient gene in the anthocyanin synthetic pathway in pear fruit. After overexpressing PbCOP1.1, the expression levels of anthocyanin synthesis-related genes, except for ANS, decreased to different degrees, and CHI, DFR, UFGT2, bHLH3, HY5 and GST were significantly down-regulated (Figure 5). This further demonstrates that PbCOP1.1 negatively regulates the synthesis of anthocyanin involved in the coloration of pear fruit, as reported previously [26,27]. Indeed, MYB10 and MYB10b act as positive regulators to induce the expression levels of structural genes in the anthocyanin biosynthetic pathway in pear [38,39,40]. PbCOP1 and PbMYB10 interact physically with each other [25]. Moreover, the MdCOP1 protein directly interacts with the MdMYB1 protein, resulting in the degradation of MdMYB1. However, the overexpression of MdCOP1 in apple fruit revealed that MdMYB1 was significantly different only at the protein, and not at the transcriptional level [26]. This may be why MYB10 is not significantly down-regulated at the transcriptional level after the overexpression of PbCOP1.1. In pear, the overexpression of MYB10 causes the up-regulation of the structural gene UFGT, and the overexpression of MYB10b promotes the up-regulation of DFR [39,40]. The overexpression of MYB10/bHLH3 in peach induced the expression levels of structural genes CHS, DFR and UFGT [41]. GST proteins are involved in the transport of anthocyanins and positively regulate the accumulation of anthocyanins [42,43,44]. In this study, the overexpression of PbCOP1.1 caused an enhanced degradation of the anthocyanin contents, possibly because PbCOP1.1 degraded HY5 and MYB10 proteins through ubiquitination, resulting in the down-regulated expression levels of CHI, DFR, UFGT2, bHLH3 and GST.
COP1 can degrade MYB and HY5 proteins by ubiquitination, thus directly or indirectly affecting the expression levels of anthocyanin-related synthetic genes that regulate anthocyanin accumulation in plants. However, no studies have determined whether COP1 can directly act on the promoters of the structural genes involved in anthocyanin synthesis. Studies on the regulatory mechanisms of COP1 in anthocyanin synthesis have focused on Arabidopsis and apple, but the specific regulatory mechanisms remain unclear. Among consumers, fruit color is treated as an indicator of fruit quality, but there are few studies on the roles of COP1s in fruit coloring. The results of this study indicated that the overexpression of PbCOP1.1 in ‘Red Bartlett’ peel negatively regulated the anthocyanin synthesis, resulting in the down-regulated expression of the anthocyanin-related genes CHI, DFR, UFGT2, bHLH3, HY5 and GST. This provides a theoretical reference for understanding the molecular mechanisms of the light-signaling molecule PbCOP1 that are involved in regulating the anthocyanin-related synthetic genes to affect the coloration of pear fruit.

4. Materials and Methods

4.1. Plant Materials, Treatments and Growth Conditions

The leaves and fruit of ‘Red Zaosu’ and ‘Zaosu’ were collected from an orchard in Meixian, Shaanxi Province, China, in May 2017. The young leaves of ‘Red Zaosu’ are fully red, but the color gradually fades with leaf age, becoming fully green. Leaves were picked during three growth periods represented by young (fully red), tender (half red), and mature (fully green) leaves. twenty leaves acted as biological repeats, with three biological replicates per period. The different tissues (stalks, peels, pulp, leaves and flowers) of the two cultivars were collected at 45 d after flowering and immediately frozen in liquid nitrogen, and then stored at −80 °C for further use.
The fruit of ‘Red Bartlett’ were collected from the same orchard. In April 2018, trees with strong growth were selected and their fruit were bagged in double-layered paper bags at 5 d after flowering. The bags were unpacked before being injected with COP1-containing constructs. The fruit were harvested 7 d after injection, and the peels near the injection areas were isolated. The peels of 10 fruits were treated as a biological repeat. The peels of the fruit were removed at about 1 mm thickness. All tissues were analyzed using three biological replicates. The fruits of ‘Red Bartlett’ were collected at 20, 50 and 80 d after flowering. 15 fruits were treated as a biological repeat. There are three biological replicates (Supplementary Material Figure S2). The fruits were immediately frozen in liquid nitrogen, and then stored at −80 °C for further use.

4.2. Anthocyanin Analysis

The total anthocyanin extraction was carried out as described by Giusti and Wrolstad [45], with slight modifications. Samples (0.2 g) rapidly ground into a powder in liquid nitrogen, and then 1% HCL-methanol solution (5 mL) was added. Specific extraction steps and calculation method of anthocyanin content are in accordance with the method of Wang et al. [37]. The anthocyanin content was determined spectrophotometrically. The absorbance of each extract was measured at 520 nm and 700 nm with a UV-Visible spectrophotometer (UV-1700, Kyoto, Japan). The total anthocyanin content was expressed as mg/kg FW. The value used for each sample was the mean of three independent biological replicates.

4.3. PbCOP1.1 and PbCOP1.2 Cloning

Total RNA was isolated from pear cultivar ‘Red Zaosu’ fruit. RNA was extracted using the RNAprep Pure Plant Kit (Tiangen, Beijing, China) according to the manufacturer’s instructions. The RNA concentration and quality were detected by UV-Visible spectrophotometer (UV-1700, Kyoto, Japan). the First-strand cDNA was synthesized using the PrimeScript RT reagent kit with gDNA Eraser (TaKaRa, Dalian, China). The complete coding DNA sequences (CDS) of PbCOP1 genes were isolated from the database of the pear genome (http://peargenome.njau.edu.cn/) [46]. The complete CDS were used as query to search for homologous sequences using National Center for Biotechnology Information, the GenBank accessions of COP1 genes are PbCOP1.1 (XP_009357519.2) and PbCOP1.2 (XP_009340196.1). We used Primer 5.0 software to design specific primer pairs (Supplemental Table S1) for cloning.

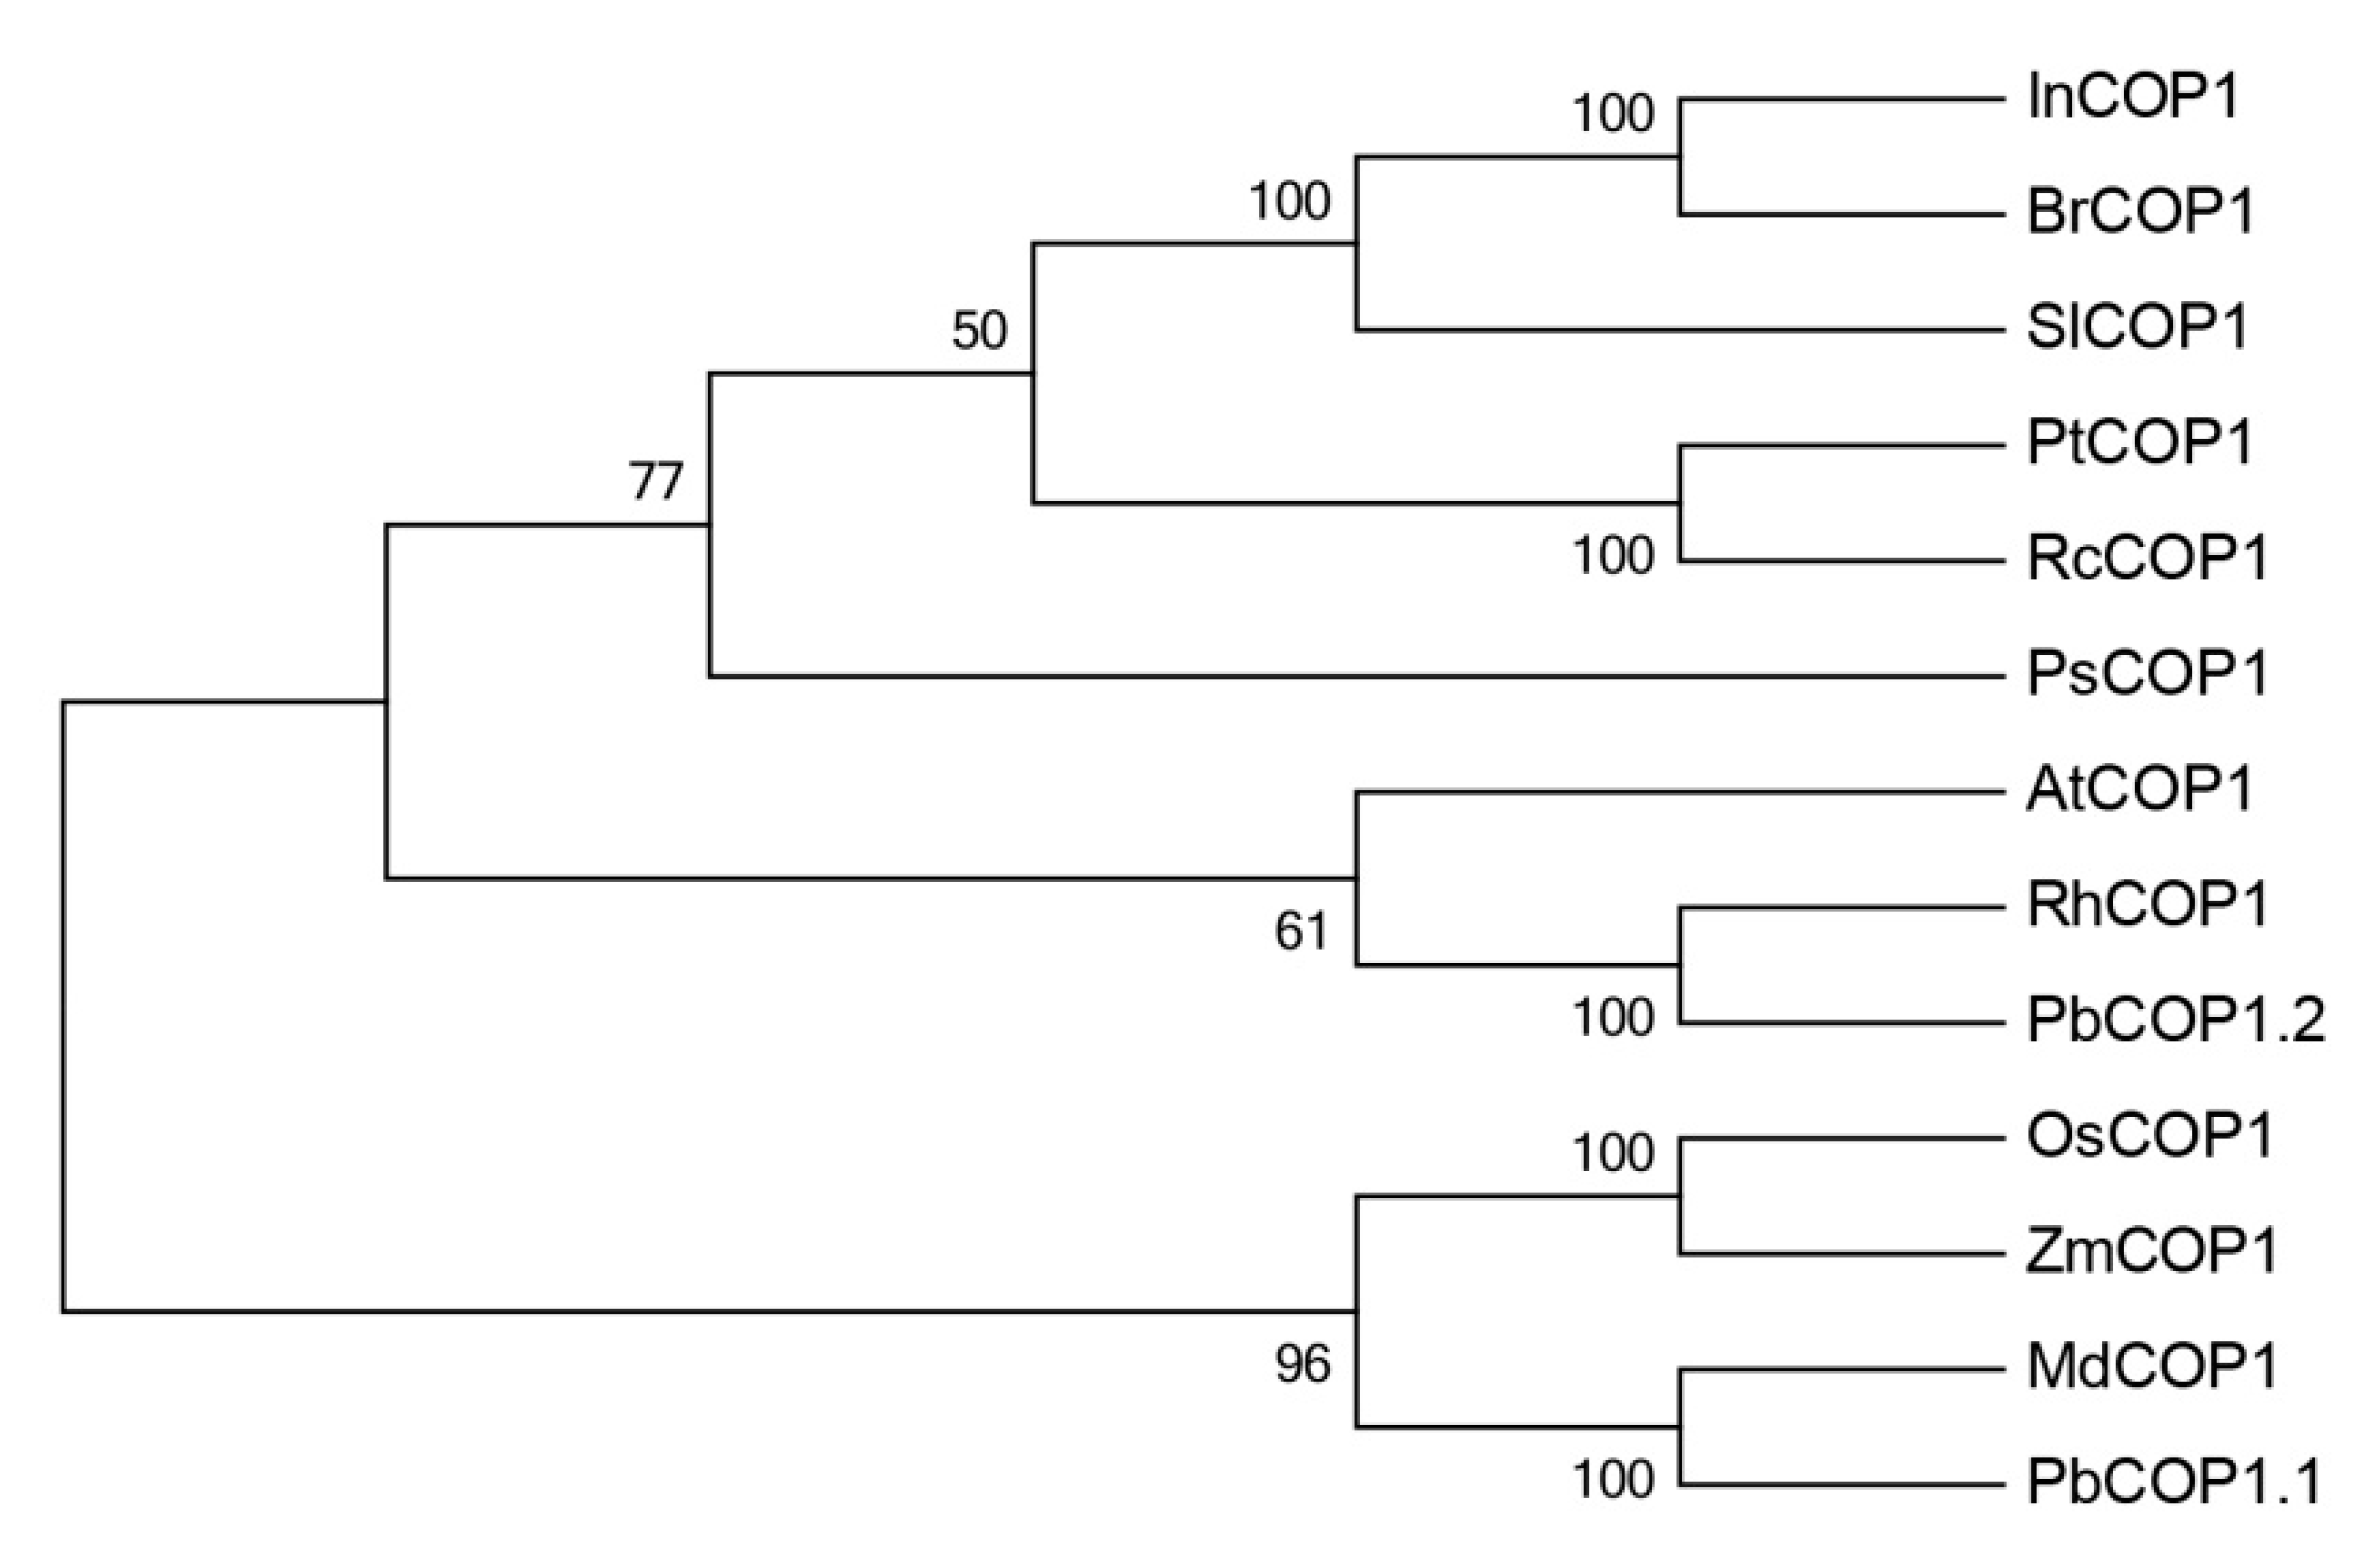
4.4. Construction of the Phylogenetic Tree

Multiple alignments of amino acid sequences were performed between pear and other plants using ClustalW in DNAMAN (LynnonBiosoft, CA, USA). The phylogenetic analysis was carried out by the Neighbor–Joining method with the JTT+G model using the MEGA 5.0 program. Branches corresponding to partitions were reproduced from 1,000 bootstrap replicates. The evolutionary distances were computed using the p-distance method.

4.5. Vector Construction and Genetic Transformation

The complete cDNAs of PbCOP1.1 and PbCOP1.2 were cloned into the expression vector pBI121 under the control of the 35S promoter. The pBI121-PbCOP1.1, pBI121-PbCOP1.2 and pBI121 vectors were independently transformed into Agrobacterium tumefaciens EHA105 strains that incubated in LB medium and resuspended in the infiltration buffer (10 mM MgCl2, 10 mM MES at pH 5.6 and 150 mM acetosyringone). Final OD600 was adjusted to ~0.8 before infiltration. Infiltration was conducted as described by Zhai et al. [40]. The pBI121-PbCOP1.1-, pBI121-PbCOP1.2- and negative control pBI121-containing bacterial solutions were independently injected 1-mm below the peel at sunset after the bags were removed of pear fruit. The fruit were harvested 7 d after injection, and the peels near the injection areas were isolated. The pear fruits infiltrated with Agrobacterium containing the empty pBI121 were used as negative controls.

4.6. Expression Analysis Using Quantitative Real-Time PCR (qRT-PCR)

The qRT-PCR reaction used the SYBR Premix Ex Taq II (TaKaRa), following the manufacturer’s instructions. It was performed using an Icycler iQ5 (Bio-Rad, Berkeley, CA, USA). Three biological replicates were analyzed for each sample. Each of biological samples were assayed in technical triplicates. Relative expression levels were calculated with the 2−ΔΔCT algorithm method. The primers of all genes used here are provided in Supplemental Table S1.

4.7. Statistical Analysis

Data were analyzed with multivariate analysis methods using SPSS 23.0 software (SPSS, Chicago, IL, USA). An analysis of variance and significant difference tests were conducted to identify differences among means using a one-way ANOVA with Tukey’s honestly significant difference test. Drawings were constructed using GraphPad Prism 6.01 (GraphPad Prism, San Diego, CA, USA) software.

Supplementary Materials

The spplementary materials are available online at https://0-www-mdpi-com.brum.beds.ac.uk/2223-7747/8/2/39/s1.

Author Contributions

Conceptualization, M.W., L.X. and Z.W.; data curation, M.W. and Z.W.; formal analysis, M.W., M.S., X.L. and L.S.; funding acquisition, L.X. and Z.W.; methodology, M.W., R.Z., X.L. and Z.W.; project administration, F.M., L.X. and Z.W.; resources, L.X.; software, M.W. and X.L.; supervision, C.Y., L.X. and Z.W.; validation, M.W., M.S., L.C. and R.Y.; writing—original draft, M.W.; writing—review and editing, J.L., L.S., C.Y. and Z.W.

Funding

This work was supported by the National Natural Science Foundation of China (31572086, 31171925 and 31401845), the Weinan Experimental Station Foundation of Northwest A&F University and the China Postdoctoral Science Foundation Funded Project (2015M582714).

Acknowledgements

We thank Lesley Benyon, PhD, from LiwenBianji, Edanz Group China (www.liwenbianji.cn/ac), for editing the English text of a draft of this manuscript.

Conflicts of Interest

The authors declare that the research was conducted in the absence of any commercial or financial relationships that could be construed as a potential conflict of interest.

References

  1. Dussi, M.C.; Sugar, D.; Wrolstad, R.E. Characterizing and quantifying anthocyanins in red pears and the effect of light quality on fruit color. J. Am. Soc. Hortic. Sci. 1995, 120, 785–789. [Google Scholar] [CrossRef]
  2. Holton, T.A.; Cornish, E.C. Genetics and biochemistry of anthocyanin biosynthesis. Plant Cell 1995, 7, 1071–1083. [Google Scholar] [CrossRef] [PubMed]
  3. Broun, P. Transcriptional control of flavonoid biosynthesis: A complex network of conserved regulators involved in multiple aspects of differentiation in Arabidopsis. Curr. Opin. Plant Biol. 2005, 8, 272–279. [Google Scholar] [CrossRef] [PubMed]
  4. Petroni, K.; Tonelli, C. Recent advances on the regulation of anthocyanin synthesis in reproductive organs. Plant Sci. 2011, 181, 219–229. [Google Scholar] [CrossRef] [PubMed]
  5. Zhai, R.; Liu, X.T.; Feng, W.T.; Chen, S.S.; Xu, L.F.; Wang, Z.G.; Zhang, J.L.; Li, P.M.; Ma, F.W. Different biosynthesis patterns among flavonoid 3-glycosides with distinct effects on accumulation of other flavonoid metabolites in pears (Pyrus bretschneideri Rehd.). PLoS ONE 2014, 9, e91945. [Google Scholar] [CrossRef] [PubMed]
  6. Feller, A.; Machemer, K.; Braun, E.L.; Grotewold, E. Evolutionaryand comparative analysis of MYB and bHLH plant transcription factors. Plant J. 2011, 66, 94–116. [Google Scholar] [CrossRef]
  7. Xu, W.; Dubos, C.; Lepiniec, L. Transcriptional control of flavonoid biosynthesis by myb-bhlh-wdr complexes. Trends Plant Sci. 2015, 20, 176–185. [Google Scholar] [CrossRef]
  8. Cutuli, B.; Lemanski, C.; Fourquet, A.; Lafontan, B.D.; Giard, S.; Lancrenon, S. Environmental significance of anthocyanins in plant stress responses. Photochem. Photobiol. 2010, 70, 1–9. [Google Scholar]
  9. Takos, A.M.; Jaffe, F.W.; Jacob, S.R.; Bogs, J.; Robinson, S.P.; Walker, A.R. Light-induced expression of a MYB gene regulates anthocyanin biosynthesis in red apples. Plant Physiol. 2006, 142, 1216–1232. [Google Scholar] [CrossRef]
  10. Allan, A.C.; Hellens, R.P.; Laing, W.A. MYB transcription factors that colour our fruit. Trends Plant Sci. 2008, 13, 99–102. [Google Scholar] [CrossRef]
  11. Azuma, A.; Yakushiji, H.; Koshita, Y.; Kobayashi, S. Flavonoid biosynthesis-related genes in grape skin are differentially regulated by temperature and light conditions. Planta 2012, 236, 1067–1080. [Google Scholar] [CrossRef] [PubMed]
  12. Jaakola, L. New insights into the regulation of anthocyanin biosynthesis in fruits. Trends Plant Sci. 2013, 18, 477–483. [Google Scholar] [CrossRef] [PubMed] [Green Version]
  13. Jang, S.; Marchal, V.; Panigrahi, K.C.; Wenkel, S.; Soppe, W.; Deng, X.W.; Valverde, F.; Coupland, G. Arabidopsis COP1 shapes the temporal pattern of CO accumulation conferring a photoperiodic flowering response. Embo J. 2008, 27, 1277–1288. [Google Scholar] [CrossRef] [PubMed] [Green Version]
  14. Yu, J.W.; Rubio, V.; Lee, N.Y.; Bai, S.; Lee, S.Y.; Kim, S.S.; Liu, L.; Zhang, Y.; Irigoyen, M.L.; Sullivan, J.A.; et al. COP1 and ELF3 control circadian function and photoperiodic flowering by regulating GI stability. Mol. Cell 2008, 32, 617–630. [Google Scholar] [CrossRef] [PubMed]
  15. Khanna, R.; Li, J.; Tseng, T.S.; Schroeder, J.I.; Ehrhardt, D.W.; Briggs, W.R. COP1 jointly modulates cytoskeletal processes and electrophysiological responses required forstomatal closure. Mol. Plant 2014, 7, 1441–1454. [Google Scholar] [CrossRef] [PubMed]
  16. Osterlund, M.T.; Hardtke, C.S.; Wei, N.; Deng, X.W. Targeted destabilization of HY5 during light–regulated development of Arabidopsis. Nature 2000, 405, 462–466. [Google Scholar] [CrossRef] [PubMed]
  17. Seo, H.S.; Yang, J.Y.; Ishikawa, M.; Bolle, C.; Ballesteros, M.L.; Chua, N.H. LAF1 ubiquitination by COP1 controls photomorphogenesis and isstimulated by SPA1. Nature 2003, 423, 995–999. [Google Scholar] [CrossRef]
  18. Yang, J.; Lin, R.; Sullivan, J.; Hoecker, U.; Liu, B.; Xu, L.; Deng, X.W.; Wang, H. Light regulates COP1-mediated degradation of HFR1, a transcription factor essential for light signaling in Arabidopsis. Plant Cell 2005, 17, 804–821. [Google Scholar] [CrossRef]
  19. Seo, H.S.; Watanabe, E.; Tokutomi, S.; Nagatani, A.; Chua, N.H. Photoreceptor ubiquitination by COP1 E3 ligase desensitizes phytochrome A signaling. Genes Dev. 2004, 18, 617–622. [Google Scholar] [CrossRef] [Green Version]
  20. Jang, I.C.; Henriques, R.; Seo, H.S.; Nagatani, A.; Chua, N.H. Arabidopsis phytochrome interacting factor proteins promote phytochrome B polyubiquitination by COP1 E3 ligase in the nucleus. Plant Cell 2010, 22, 2370–2383. [Google Scholar] [CrossRef]
  21. Shalitin, D.; Yang, H.Y.; Mockler, T.C.; Maymon, M.; Guo, H.W.; Whitelam, G.C.; Lin, C.T. Regulation of Arabidopsis cryptochrome 2 by blue-light-dependent phosphorylation. Nature 2002, 417, 763–767. [Google Scholar] [CrossRef] [PubMed]
  22. Weidler, G.; Zur Oven-Krockhaus, S.; Heunemann, M.; Orth, C.; Schleifenbaum, F.; Harter, K.; Hoecker, U.; Batschauer, A. Degradation of Arabidopsis CRY2 is regulated by SPA proteins and phytochrome A. Plant Cell 2012, 24, 2610–2623. [Google Scholar] [CrossRef] [PubMed]
  23. Lee, J.; He, K.; Stolc, V.; Lee, H.; Figueroa, P.; Gao, Y.; Tongprasit, W.; Zhao, H.; Lee, I.; Deng, X.W. Analysis of transcription factor HY5 genomic binding sites revealed its hierarchical role in light regulation of development. Plant Cell 2007, 19, 731–749. [Google Scholar] [CrossRef] [PubMed]
  24. An, J.P.; Qu, F.J.; Yao, J.F.; Wang, X.N.; You, C.X.; Wang, X.F.; Hao, Y.J. The bZIP transcription factor MdHY5 regulates anthocyanin accumulation and nitrate assimilation in apple. Hortic. Res. 2017, 4, 17023. [Google Scholar] [CrossRef] [PubMed] [Green Version]
  25. Tao, R.; Bai, S.; Ni, J.; Yang, Q.; Zhao, Y.; Teng, Y. The blue light signal transduction pathway is involved in anthocyanin accumulation in ‘Red Zaosu’ pear. Planta 2018, 248, 37–48. [Google Scholar] [CrossRef] [PubMed]
  26. Li, Y.Y.; Mao, K.; Zhao, C.; Zhao, X.Y.; Zhang, H.L.; Shu, H.R.; Hao, Y.J. MdCOP1 ubiquitin E3 ligases interact with MdMYB1 to regulate light-induced anthocyanin biosynthesis and red fruit coloration in apple. Plant Physiol. 2012, 160, 1011–1022. [Google Scholar] [CrossRef] [PubMed]
  27. Maier, A.; Schrader, A.; Kokkelink, L.; Falke, C.; Welter, B.; Iniesto, E.; Rubio, V.; Uhrig, J.F.; Hülskamp, M.; Hoecker, U. Light and the E3 ubiquitinligase COP1/SPA control the protein stability of the MYB transcription factors PAP1 and PAP2 involved in anthocyanin accumulation in Arabidopsis. Plant J. 2013, 74, 638–651. [Google Scholar] [CrossRef] [PubMed]
  28. Ma, L.; Gao, Y.; Qu, L.; Chen, Z.; Li, J.; Zhao, H.; Deng, X.W. Genomic evidence for COP1 as a repressor of light-regulated gene expression and development in Arabidopsis. Plant Cell 2002, 14, 2383–2398. [Google Scholar] [CrossRef] [PubMed]
  29. Yi, C.; Deng, X.W. COP1 from plant photomorphogenesis to mammalian tumorigenesis. Trends Cell Biol. 2005, 15, 618–625. [Google Scholar] [CrossRef] [PubMed]
  30. Kami, C.; Lorrain, S.; Hornitschek, P.; Fankhauser, C. Light-regulated plant growth and development. Curr. Top. Dev. Biol. 2010, 91, 29–66. [Google Scholar] [PubMed]
  31. Liu, B.; Zuo, Z.; Liu, H.; Liu, X.; Lin, C. Arabidopsis COP1 progress in anthocyanin biosynthesis of plants regulated by COP1 cryptochrome 1 interacts with SPA1 to suppress COP1 activity in response to blue light. Genes Dev. 2011, 25, 1029–1034. [Google Scholar] [CrossRef] [PubMed]
  32. Jenkins, G.I. The UV-B photoreceptor UVR8: From structure to physiology. Plant Cell 2014, 26, 21–37. [Google Scholar] [CrossRef] [PubMed]
  33. Osterlund, M.T.; Deng, X.W. Multiple photoreceptors mediate the light-induced reduction of GUS-COP1 from Arabidopsis hypocotyl nuclei. Plant J. 1998, 16, 201–208. [Google Scholar] [CrossRef] [PubMed] [Green Version]
  34. Zhang, Y.; Zheng, S.; Liu, Z.; Wang, L.; Bi, Y. Both HY5 and HYH are necessary regulators for low temperature-induced anthocyanin accumulation in arabidopsis seedlings. J. Plant Physiol. 2011, 168, 367–374. [Google Scholar] [CrossRef] [PubMed]
  35. Mitsunami, T.; Nishihara, M.; Galis, I.; Alamgir, K.M.; Hojo, Y.; Fujita, K.; Sasaki, N.; Nemoto, K.; Sawasaki, T.; Arimura, G. Overexpression of the PAP1 transcription factor reveals a complex regulation of flavonoid and phenylpropanoid metabolism in nicotiana tabacum plants attacked by spodopteralitura. PLoS ONE 2014, 9, e108849. [Google Scholar] [CrossRef] [PubMed]
  36. Wu, B.H.; Cao, Y.G.; Guan, L.; Xin, H.P.; Li, J.H.; Li, S.H. Genome-wide transcriptional profiles of the berry skin of two red grape cultivars (VitisVinifera) in which anthocyanin synthesis is sunlight-dependent or-independent. PLoS ONE 2014, 9, e105959. [Google Scholar] [CrossRef] [PubMed]
  37. Wang, Z.G.; Du, H.; Zhai, R.; Song, L.Y.; Ma, F.W.; Xu, L.F. Transcriptome Analysis Reveals Candidate Genes Related to Color Fading of ‘Red Bartlett’ (Pyrus communis L.). Front. Plant Sci. 2017, 8, e0142112. [Google Scholar] [CrossRef]
  38. Feng, S.Q.; Wang, Y.L.; Yang, S.; Xu, Y.T.; Chen, X.S. Anthocyanin biosynthesis in pears is regulated by a R2R3-MYB transcription factor PyMYB10. Planta 2010, 232, 245–255. [Google Scholar] [CrossRef]
  39. Wang, Z.G.; Meng, D.; Wang, A.D.; Li, T.L.; Jiang, S.L.; Cong, P.H.; Li, T.Z. The methylation of the PcMYB10 promoter is associated with green-skinned sport in Max Red Bartlett pear. Plant Physiol. 2013, 162, 885–896. [Google Scholar] [CrossRef]
  40. Zhai, R.; Wang, Z.M.; Zhang, S.W.; Meng, G.; Song, L.Y.; Wang, Z.G.; Li, P.M.; Ma, F.W.; Xu, L.F. Two MYB transcription factors regulate flavonoid biosynthesis in pear fruit (Pyrus bretschneideri Rehd.). J. Exp. Bot. 2016, 67, 1275. [Google Scholar] [CrossRef]
  41. Rahim, M.A.; Busatto, N.; Trainotti, L. Regulation of anthocyanin biosynthesis in peach fruits. Planta 2014, 240, 913–929. [Google Scholar] [CrossRef] [PubMed]
  42. Mueller, L.A.; Goodman, C.D.; Silady, R.A.; Walbot, V. AN9, a petunia glutathione S–transferase required for anthocyanin sequestration, is a flavonoid–binding protein. Plant Physiol. 2000, 123, 1561–1570. [Google Scholar] [CrossRef] [PubMed]
  43. Conn, S.; Curtin, C.; Bezier, A.; Franco, C.; Zhang, W. Purification, molecular cloning, and characterization of glutathione S-transferases (GSTs) from pigmented Vitis vinifera L. cell suspension cultures as putative anthocyanin transport proteins. J. Exp. Bot. 2008, 59, 3621–3634. [Google Scholar] [CrossRef] [PubMed]
  44. Kitamura, S.; Akita, Y.; Ishizaka, H.; Narumi, I.; Tanaka, A. Molecular characterization of an anthocyanin-related glutathione S-transferase gene in cyclamen. J. Plant Physiol. 2012, 169, 636–642. [Google Scholar] [CrossRef] [PubMed]
  45. Giusti, M.M.; Wrolstad, R.E. Characterization and Measurement of Anthocyanins by UV-Visible Spectroscopy; Current Protocols in Food Analytical Chemistry: New York, NY, USA, 2001. [Google Scholar]
  46. Wu, J.; Wang, Z.; Shi, Z.; Zhang, S.; Ming, R.; Zhu, S.; Khan, M.A.; Tao, S.; Korban, S.S.; Wang, H.; et al. The genome of the pear (Pyrus bretschneideri Rehd.). Genome Res. 2013, 23, 396–408. [Google Scholar] [CrossRef] [PubMed]
Figure 1. Amino acid sequence alignment analysis of COP1 in pear and other related plants. At, Arabidopsis thaliana; Md, Malus × domestica; Os, Oryza sativa subsp. indica; In, Ipomoea tricolor; Pt, Populustrichocarpa; Rc, Ricinus communis; Rh, Rosa spp. hybrid cultivar; Sl, Solanum lycopersicum; Zm, Zea mays; Pb, Pyrus bretschneideri.
Plants 08 00039 g001
Figure 2. Phylogenetic tree of COP1 from different species. In, Ipomoea tricolor (AAG31173.1); Br, Brassica capitata (AAN86553.1); Sl, Solanum lycopersicum(AAC98912.1); Pt, Populustrichocarpa (XP_002321154.1); Rc, Ricinus communis (XP_002534127.1); Ps, Pisum sativum (CAB94800.1); At, Arabidopsis thaliana (AEC08766.1); Rh, Rosa spp. hybrid cultivar (AAK81856.1); Pb, Pyrus bretschneideri (XP_009357519.2, XP_009340196.1); Os, Oryza sativa subsp. indica (BAA94422.1); Zm, Zea mays (ACG47820.1); Md, Malus × domestica (AB668570.1).
Plants 08 00039 g002
Figure 3. Expression patterns of PbCOP1.1 and PbCOP1.2 in different pear tissues. ZS, ‘Zaosu’, RZS, ‘Red Zaosu’. All data are presented as the means ± standard errors (SE) of three biological replicates, and different letters above the columns indicate significant differences at P < 0.05 (Duncan’s range test).
Plants 08 00039 g003
Figure 4. Phenotypes, anthocyanin contents and expression levels of PbCOP1 genes at different leaf developmental stages. (A) Leaf phenotypes. (B) Anthocyanin contents in leaves. (C) PbCOP1 expression levels in leaves. R, red; HR, half red; G, green. ZS, ‘Zaosu’; RZS, ‘Red Zaosu’. All data are presented as the means ± standard errors of three biological replicates, and different letters above the columns indicate significant differences at P < 0.05 (Duncan’s range test).
Plants 08 00039 g004
Figure 5. The overexpression of PbCOP1.1 reduced fruit coloring in the ‘Red Bartlett’ peel. (A) The ‘Red Bartlett’ peel coloration around the injection sites after overexpressing PbCOP1s. Seven days after injection, the peels around the injection sites were used for qRT-PCR and anthocyanin contents analysis. (B) The anthocyanin contents in ‘Red Bartlett’ peels around the injection sites. (C) Expression levels of PbCOP1s in ‘Red Bartlett’ peels around the injection sites. (D) Expression levels of structural genes in PbCOP1.1 overexpressed fruit. (E) Expression levels of regulatory and anthocyanin-related synthetic genes in PbCOP1.1 overexpressed fruit. Error bars indicate the standard errors of the means. * indicates differences that are statistically significant at the P < 0.05 level; ** indicates differences that are statistically significant at the P < 0.01 level.
Plants 08 00039 g005

