Article

Phylogenetic Reconstruction and Divergence Time Estimation of Blumea DC. (Asteraceae: Inuleae) in China Based on nrDNA ITS and cpDNA trnL-F Sequences

1
Tropical Crops Genetic Resources Institute/Hainan Provincial Engineering Research Center for Blumea Balsamifera, Chinese Academy of Tropical Agricultural Sciences (CATAS), Haikou 571101, China
2
School of Traditional Chinese Medicine Resources, Guangdong Pharmaceutical University, Guangzhou 510006, China
*
Author to whom correspondence should be addressed.
These authors contributed equally to this work.
Submission received: 21 May 2019 / Revised: 2 July 2019 / Accepted: 5 July 2019 / Published: 8 July 2019
(This article belongs to the Special Issue Molecular Phylogenetics)

Abstract

:
The genus Blumea is one of the most economically important genera of Inuleae (Asteraceae) in China. It is particularly diverse in South China, where 30 species are found, more than half of which are used as herbal medicines or in the chemical industry. However, little is known regarding the phylogenetic relationships and molecular evolution of this genus in China. We used nuclear ribosomal DNA (nrDNA) internal transcribed spacer (ITS) and chloroplast DNA (cpDNA) trnL-F sequences to reconstruct the phylogenetic relationship and estimate the divergence time of Blumea in China. The results indicated that the genus Blumea is monophyletic and it could be divided into two clades that differ with respect to the habitat, morphology, chromosome type, and chemical composition of their members. The divergence time of Blumea was estimated based on the two root times of Asteraceae. The results indicated that the root age of Asteraceae of 76–66 Ma may maintain relatively accurate divergence time estimation for Blumea, and Blumea might had diverged around 49.00–18.43 Ma. This common ancestor had an explosive expansion during the Oligocene and Miocene and two major clades were differentiated during these epochs 29.60 Ma (17.76–45.23 Ma 95% HPD (Highest Posterior Density). Evidence from paleogeography and paleoclimate studies has confirmed that Blumea experienced differentiation and an explosive expansion during the Oligocene and Miocene.

Graphical Abstract

1. Introduction

The genus Blumea is one of the largest genera of Inuleae (Asteraceae), containing approximately 100 species [1,2,3]. It is most diverse in Asia, Africa, and Australia, and it has more than one main center of diversity in Africa and South Asia [3]. China is one center of diversity of this genus, with 30 species being distributed throughout South China, of which five are endemic [4,5]. Blumea DC. has economic and ecological value in China. More than half of the species that belong to this genus have medical or ethnobotanical value [6]; for example, Blumea balsamifera (L.) DC. is an economic source of L-borneol or camphor extraction, and it is widely cultivated in the Philippines and China [7,8,9]. Blumea megacephala (Randeria) Chang et Tseng and Blumea riparia (Bl.) DC. are important sources of medical materials for “fuxuekang” [8]. Other species, such as Blumea aromatica DC., Blumea formosana Kitam, and Blumea densiflora DC., are used to treat rheumatism, esophagitis, headache, and hypertension [6]. Zhang and Cheng first described the taxonomy, plant morphology, and anatomy of the genus Blumea in China [4]; the authors treated six subsections and 30 species. Since the first description of this genus, its phylogenetic analysis and molecular evolution have been vigorously disputed. Phylogenetic analysis using molecular markers has been widely used to attempt to resolve this dispute; Pornpongrungrueng conducted important research [10,11], whose results showed that Blumea is monophyletic if the genera Blumeopsis Gagnep. and Merrittia Merr. are included, and suggested that this genus could be divided into two main clades that differ with respect to habitat, ecology, and distribution; however, few samples of the Blumea species from China were included [10,11]. In this study, we extended the molecular phylogenetic analysis of Blumea by (1) adding several samples from China to provide more thorough coverage of the overall distribution and diversity of Blumea, and (2) performing divergence time estimation. We aimed to: (1) estimate the molecular evolution and phylogenetic relationships of Blumea with a focus on the genus in China and (2) offer the best hypothesis for the divergence time and evolutionary events of this genus in China.

2. Results

2.1. Features of nrDNA ITS and cpDNA trnL-F Sequences in Blumea DC.

Based on the results of the sequence features and substitution models of single sequences or combined sequences from MEGA 7.0 [12], DAMBE [13], and jmodeltest 2.1.7 [14], the results indicated (Table 1): (1) the nrDNA ITS sequence ranged from 694 to 738 bp; after alignment, the sequence contained 657 characters, including 230 constant characters (35.01%), 314 informative characters (47.79%), and 114 uninformative characters (17.20%). (2) The chloroplast DNA (cpDNA) trnL-trnF intergenic spacer sequence ranged from 766 to 850 bp; after alignment, the sequence contained 858 characters, which included 730 constant characters (85.08%), 58 informative characters (6.76%), and 70 uninformative characters (8.16%). (3) The combined sequence ranged from 1,423 to 1,507 bp, including 960 constant characters (63.49%) and 370 informative characters (24.47%). The results from the incongruence length difference (ILD) test with PAUP 4.0a164 [15] indicated that the nrDNA ITS sequence and cpDNA trnL-F sequence could be combined (p = 0.19).
The results of the best substitution models from jmodeltest 2.1.7 with Akaike information criterion (AIC) [16] and Bayesian information criterion (BIC) [17] indicated that the best substitution models for ITS, trnL-F, or combined sequnces were, respectively, as SYM (symmetrical model) + I (proportion of invariable sites) + G (gamma distribution), TVM (transversion model) + G, and GTR (general time reversible) + I + G (Table 1); Table 1 also lists other parameters.

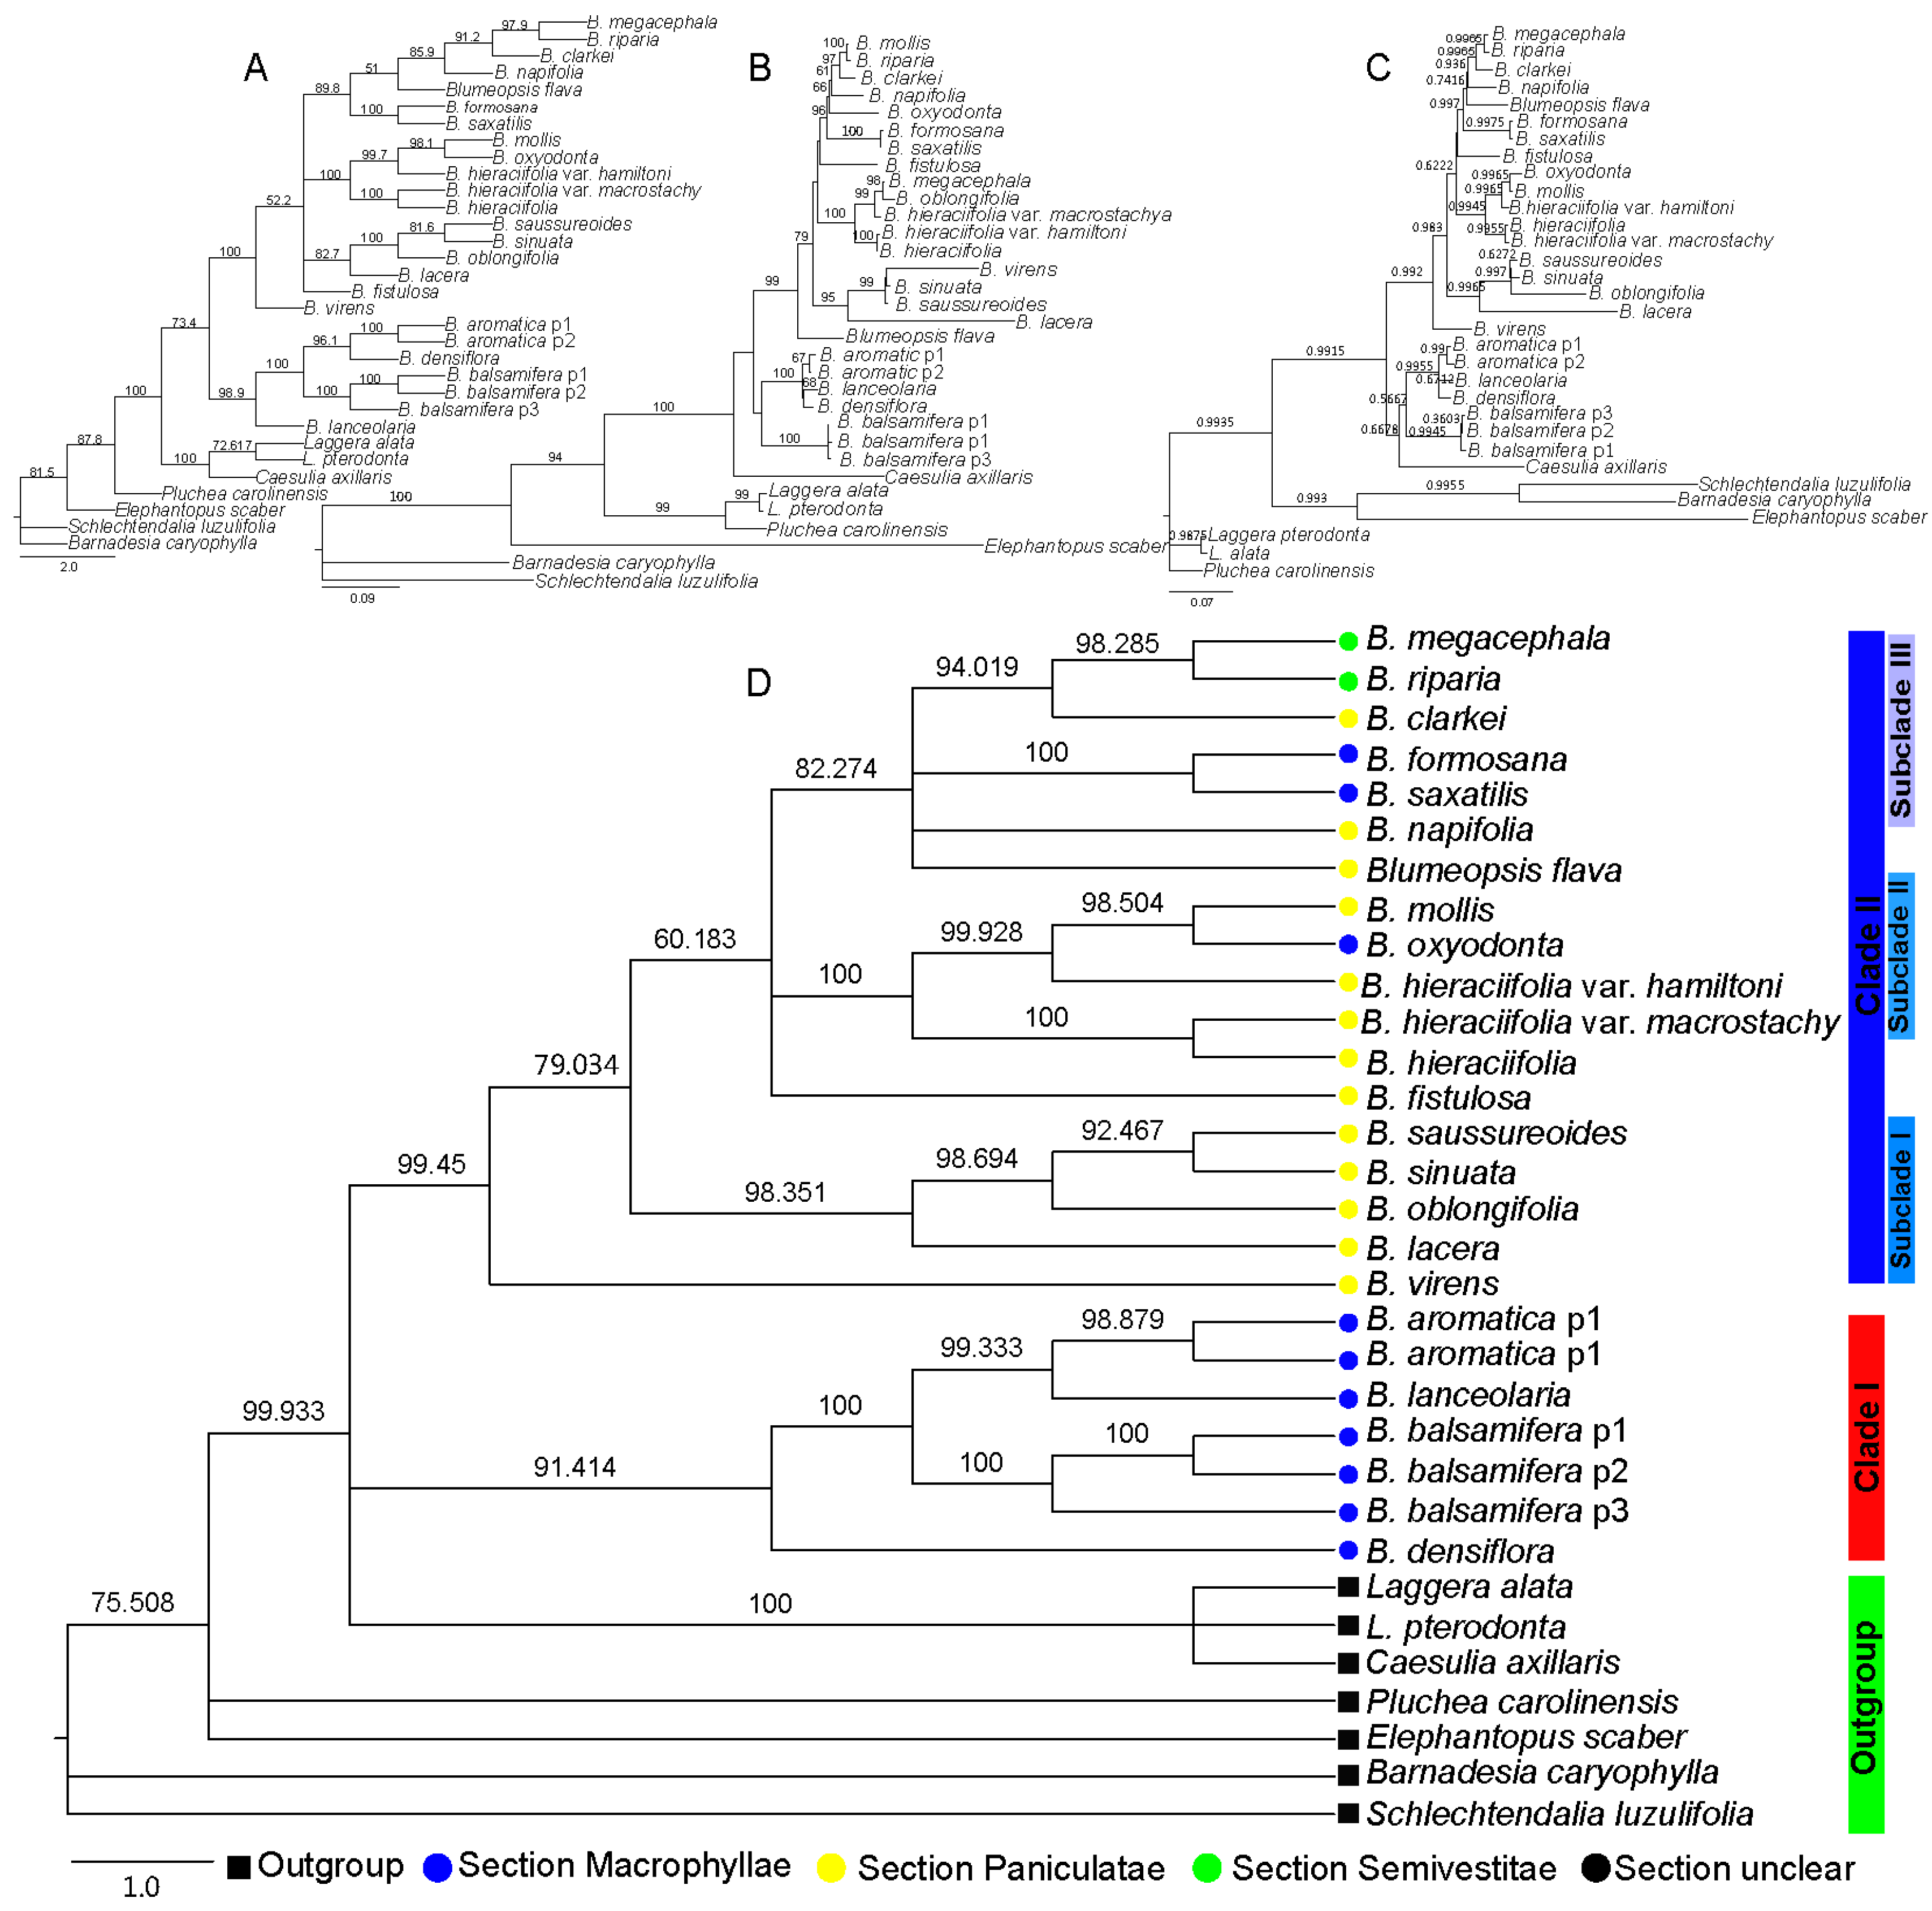
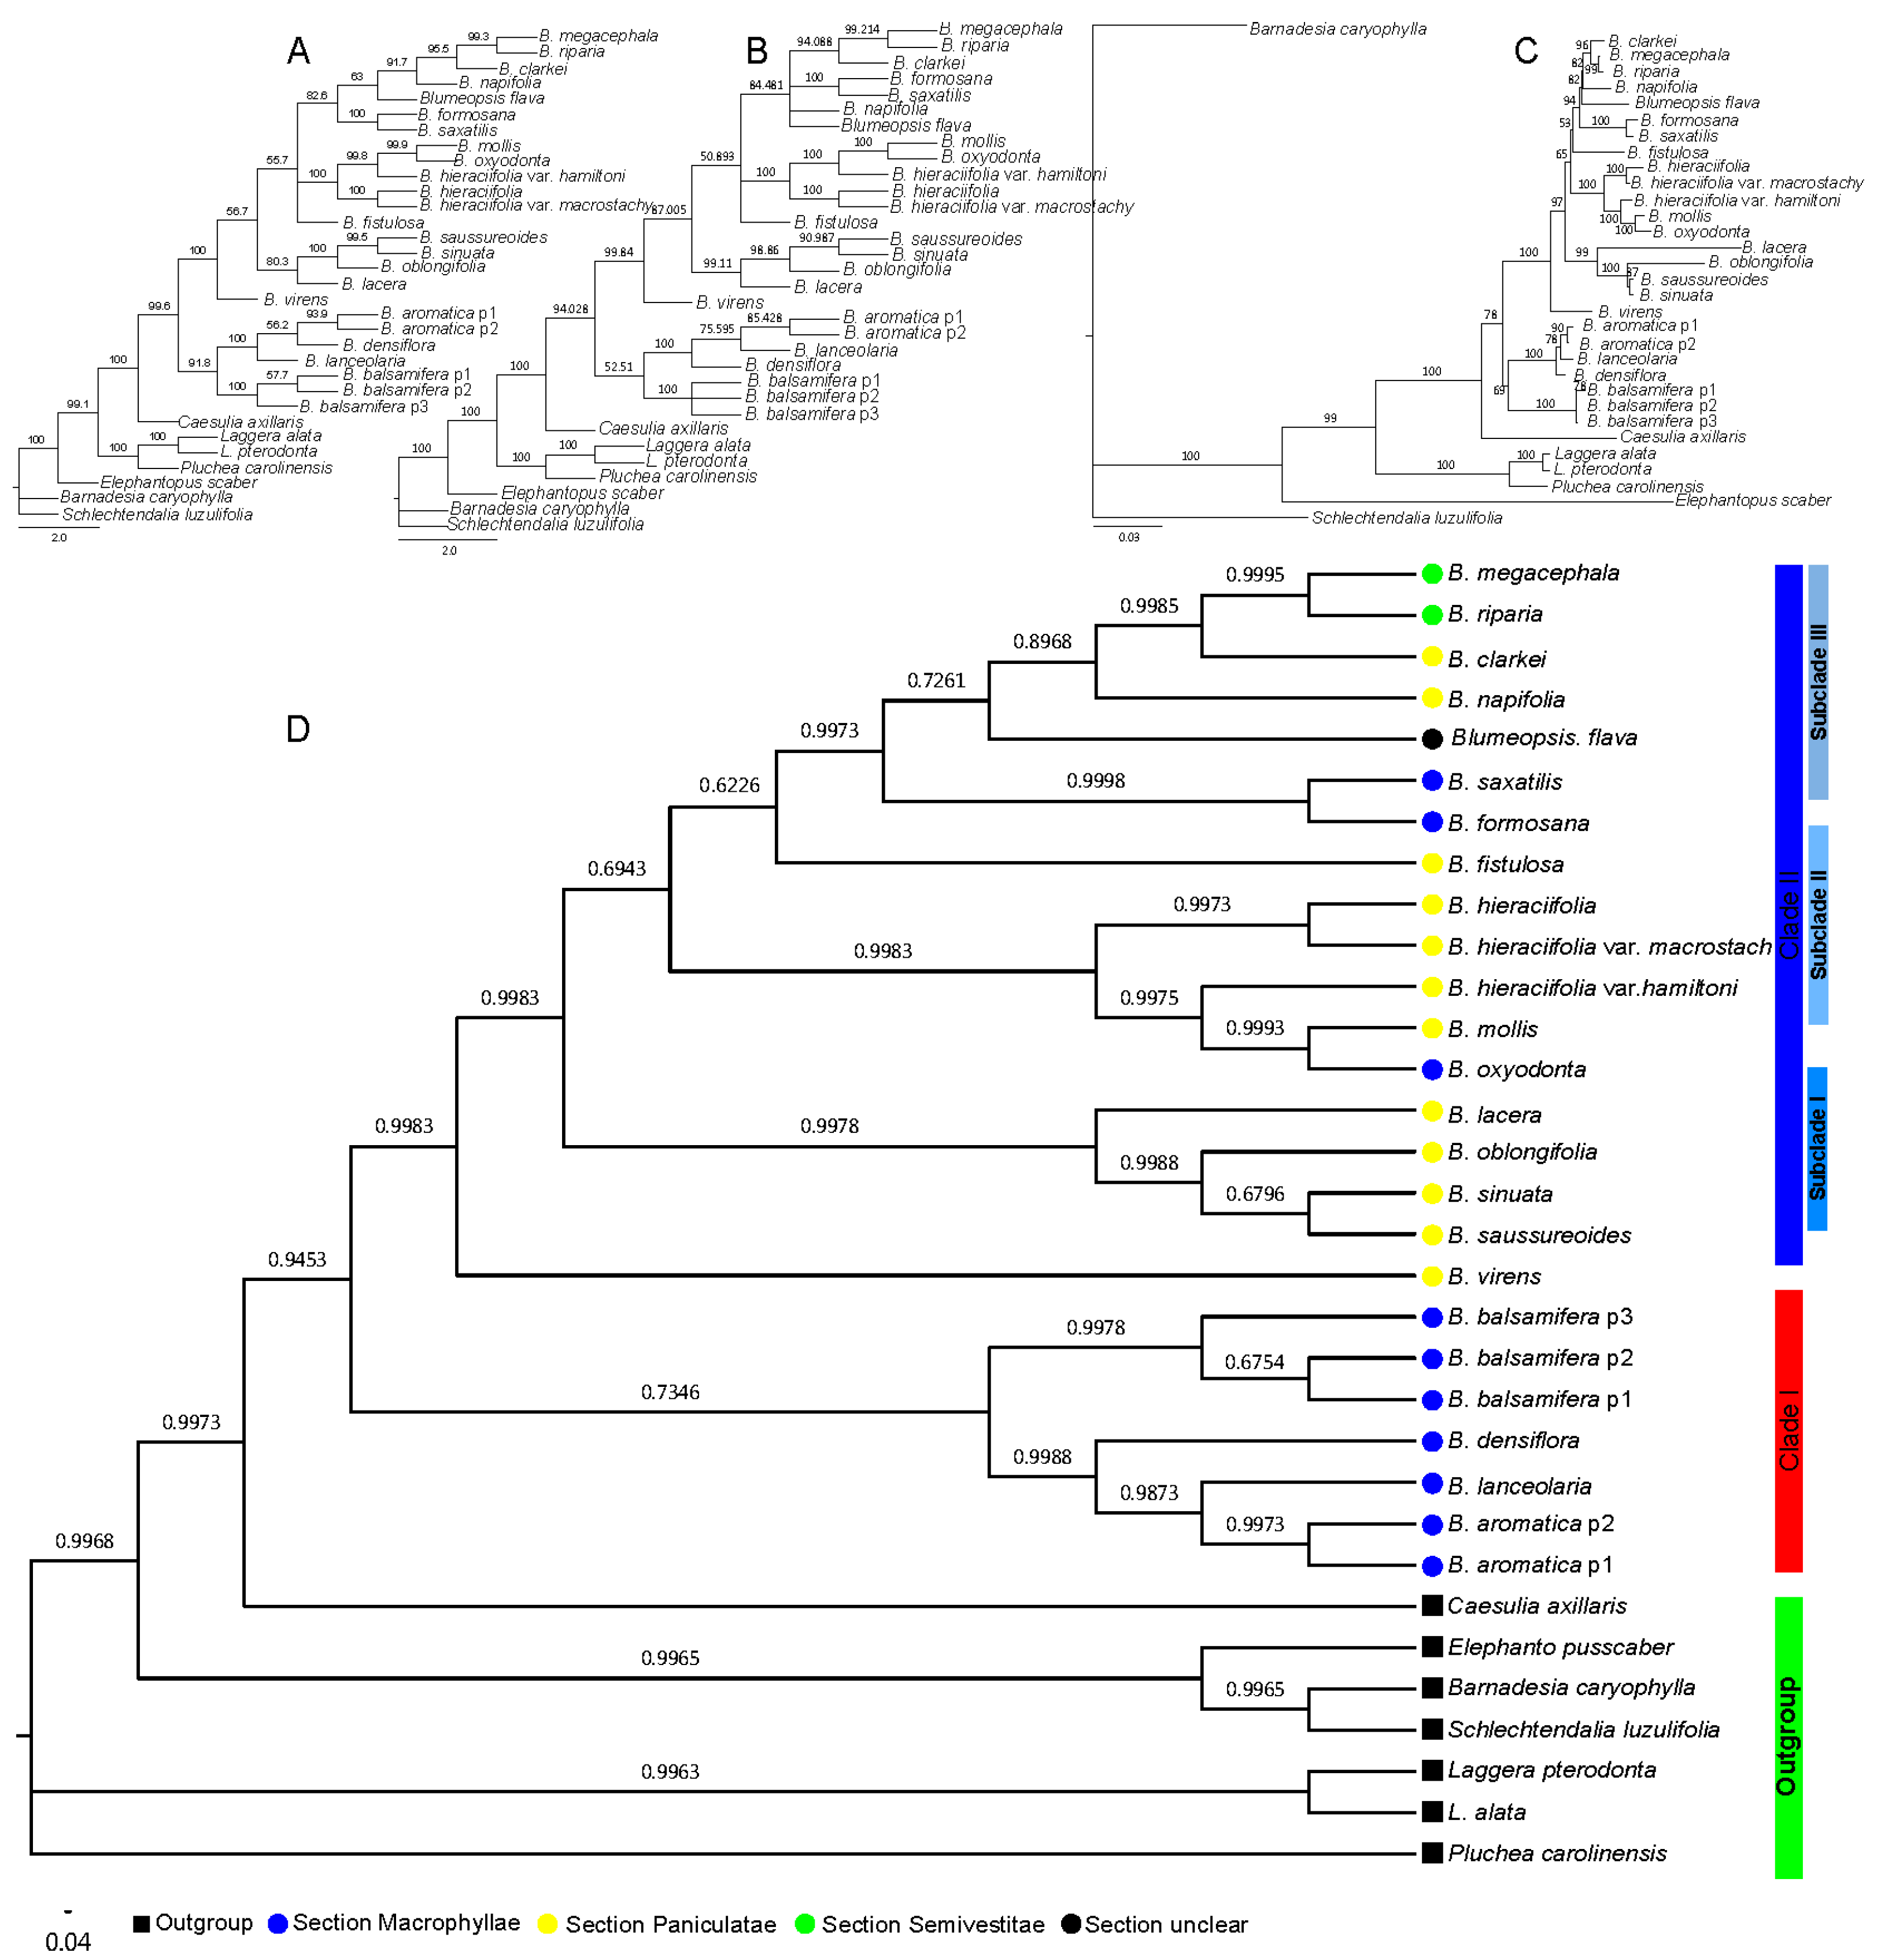
2.2. Phylogenetic Relationship of Blumea DC.

Based on the sequence of nrDNA ITS, with four different phylogenetic analysis methods—Neighbor-joining (NJ), Maximum Parsimony (MP), Maximum Likelihood (ML), and Bayesian inference (BI)—the results of all indicated that the Blumea genus was monophyletic, but the topology of the four methods was different. For example, the topology of the NJ method (Figure 1A) indicated that Blumea could be divided into two clades. The phylogenetic relationship of the B. aromatica clade may be clear, but the phylogenetic relationships of the others were disordered, also with very low posterior probabilities. The results from the MP method (Figure 1B) seem to mostly conform to the traditional classification relationship of Blumea; the genus could be divided into three clades: clade B. balsamifera was the basal clade, the B. aromatica clade may be the transitional clade, and others may be the higher group with more extensive environmental adaptability, such as with one-year lifetime, diverse habitats, and morphological characteristics. The results of the BI method (Figure 1C) seem to be the same as those of the NJ method; also, with high posterior probabilities, but Caesulia axillaris Roxb is placed in the B. aromatica clade. The topology with different methods was compared with TreePuzzle 5.3.rc16 [18] and CONSEL [19], and the results indicated that the ML method was the most suitable tree-reconstruction method for ITS sequences and with first rank (Table 2). The genus of Blumea could be divided into two major clades based on the phylogenetic tree with ITS sequence and the MP method (Figure 1D). Clade I consisted of three species of Macrophyllae (including B. aromatica, B. densiflora, and B. balsamifera) and one species of section Paniculatae (B. lanceolaria (Roxb.) Druce.), but with a very low bootstrap. Clade II, with a perfect bootstrap, consisted of three subclades and two single species, B. virens DC. and B. fistulosa. Subclade I consisted of three species of section Paniculatae (including B. saussureoides Chang & Tseng, B. sinuata (Lour.) Merr., B. oblongifolia Kitam, and B. lacera (Burm. f.) DC.), with an ideal bootstrap value. Subclade II consisted of three species (B. oxyodonta DC., B. mollis (Burm. f.) DC., and B. hieraciifolia (D. Don) DC.) and two variants of B. hieraciifolia (B. hieraciifolia var. hamiltoni and B. hieraciifolia var. macrostachy). Subclade III consisted of seven species, but with diverse inscape, which include two species belong to Semivestitae section (B. megacephala and B. riparia), two species belong to Macrophyllae section (B. formosana and B. saxatilis Zoll. & Mor.), two species belong to Paniculatae section (B. napifolia DC. and B. clarkei Hook. f.), and Blumeopsis flava Gagnep.
With the cpDNA trnL-F sequence, the results of the four different methods also indicated that the genus Blumea was divided into two clades, but the relationships that were revealed by the four methods were different, especially for the species in clade II (Figure 2). Combining the topology results indicated that the Bayesian inference (BI) method was possibly the most suitable tree reconstruction method (Table 2). With the BI method, Blumea could also been divided into two clades: clade I, with the same members of the nrDNA ITS dataset, consisting of three species of Macrophyllae (B. aromatica, B. densiflora, and B. balsamifera) and one species of section Paniculatae (B. lanceolaria), and the other species were combined into clade II, but with low posterior probabilities (Figure 2D). The same results were observed with the NJ, MP, and ME methods (Figure 2A–C): the genus could be divided into two clades, but with a low bootstrap value, especially in the phylogenetic tree in the NJ and MP methods. The scant information in the trnL-F dataset may have caused this.
Furthermore, the results of the combined sequences indicated that the BI method was also the most suitable tree-reconstructed method for combined sequences (Table 2), with the same topology based on the nrDNA ITS sequence when analyzed with all four methods, (Figure 3). The genus Blumea could be divided into two clades; clade II also consisted of three subclades and two single species (Figure 3D). The same thing was observed from the results of the NJ, MP, and ME methods (Figure 3A–C), and with a better bootstrap posterior supported value. This means that the combined sequence can improve the lower posterior probabilities or bootstrap that is caused by the single sequence.

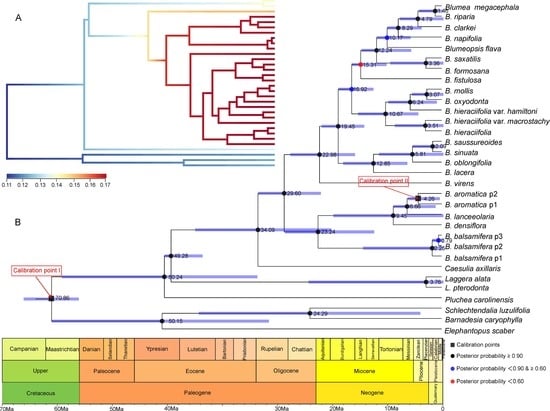
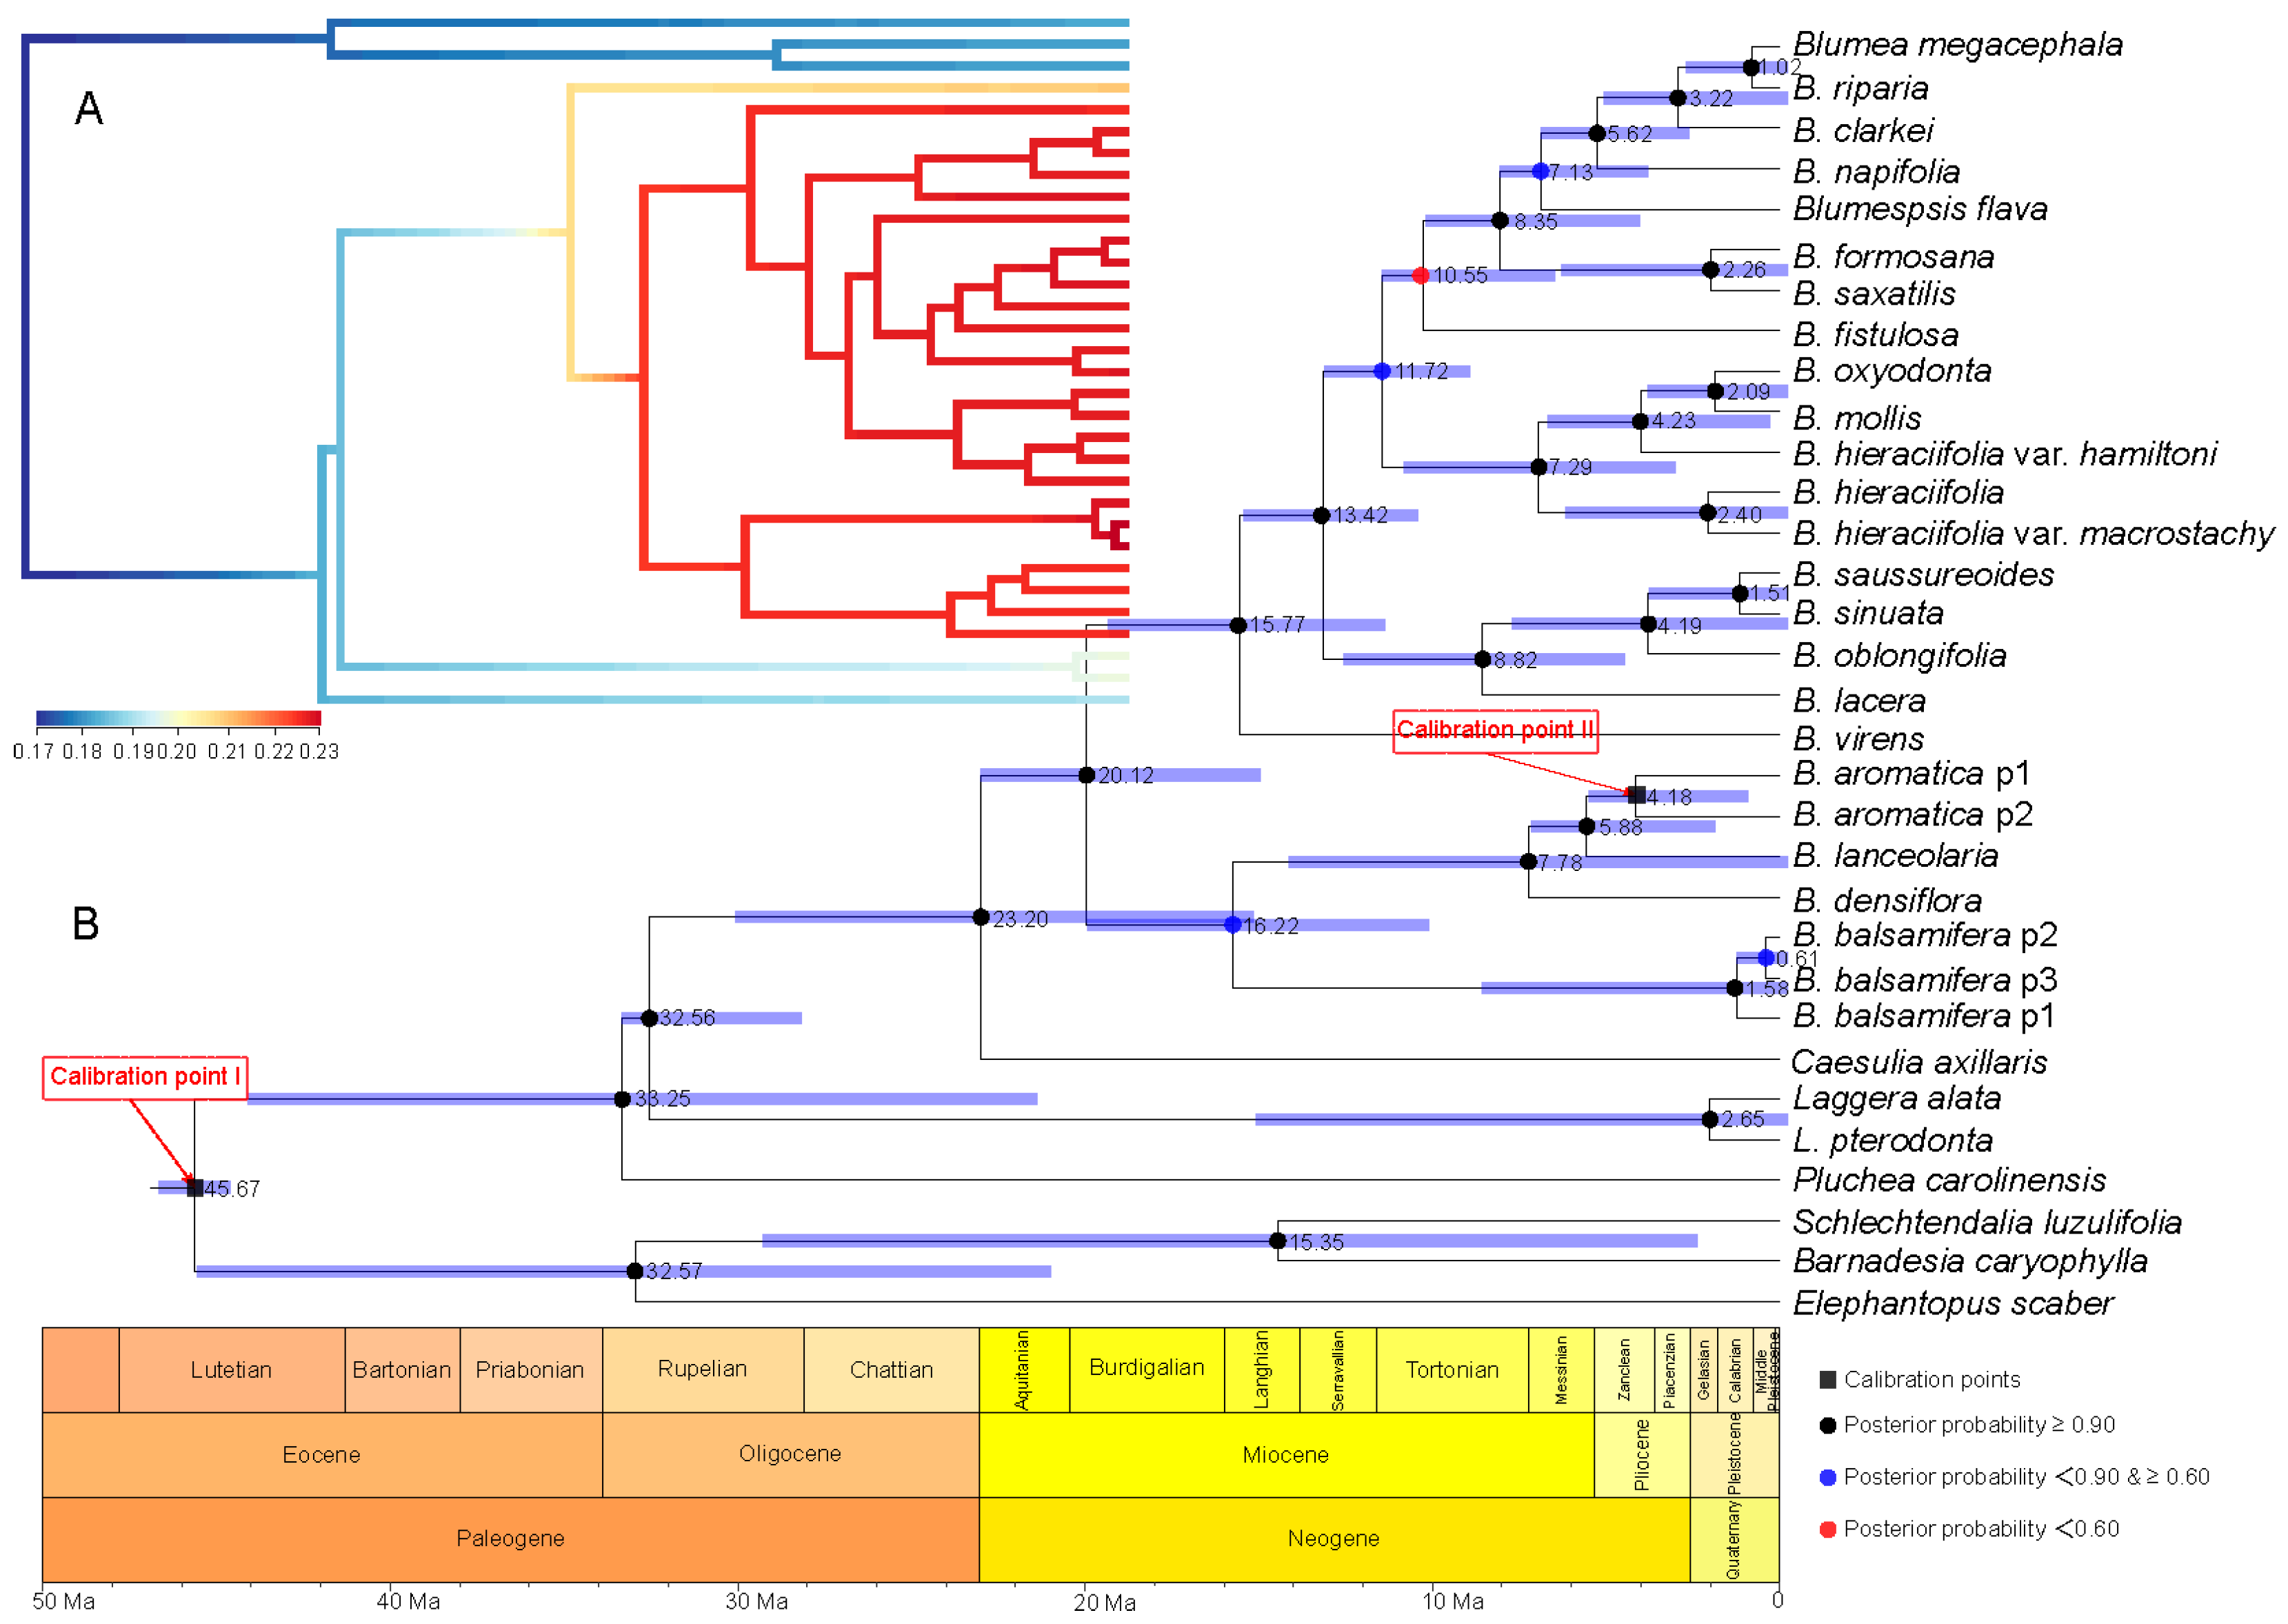
2.3. Divergence Time Estimation and Evolutionary Event Hypothesis

A series of evolutionary events and divergence times were estimated based on a comparison of the two calibration points of the root age of Asteraceae and geography–species differentiation time (Figure 4 and Figure 5). With the root age of Asteraceae as 49–42 Ma [20,21,22] (Figure 4), the time of genus Blumea differentiated from Inuleae is estimated to be 23.20 Ma, with the highest posterior density (HPD) between 32.86 and 14.51 Ma (the time between the late Oligocene and the early Miocene). The divergence time of the two major clades in Blumea is estimated to be 20.12 Ma (with HPD between 28.89 and 12.40 Ma). Further investigation with BAMM [23] and BAMMtools [24] showed that this genus underwent an explosive expansion during the Miocene, and many new species speciate during this period (Figure 4A).
With the root age of Asteraceae as 76–66 Ma [27] (Figure 5), the time genus Blumea differentiated from Inuleae is estimated to be 34.09 Ma, with a HPD between 49.00 and 18.43 Ma (the time between the late Oligocene and the early Miocene), and the divergence time of the two major clades is estimated to be 45.23–17.76 Ma (median time of 29.60). Further investigation with BAMM [23] and BAMMtools [24] showed that (Figure 4A) this genus experienced an explosive expansion, since it differentiated from Inuleae.
Two series of divergence time were estimated with two different root ages of Asteraceae (76–66 Ma [27] and 49–42 Ma [20,21,22]) (Figure 4 and Figure 5). A third web tool, TimeTree (http://www.timetree.org/) [28], was used for further divergence time estimation and for making the final decision. The results indicated that the median divergence time of B. balsamifera and Plumea carolinensis (Jacq.) G. Don. may have been in the early Miocene, around 26 Ma ago (Figure 6). Combining the results of TimeTree with the two calibration points for the root age of Asteraceae, we think that the root age of Asteraceae of 76–66 Ma [27] may be relatively accurate divergence time estimation for Blumea. First, based on the paleogeography and paleoclimate of the Oligocene (Figure 6), the Oligocene interrupted the temperature decline in the Paleogene (~33.5 Ma ago), and a stepwise climate increase began at 32.5 Ma and lasted until 25.5 Ma ago [29,30], also accompanied with a reduction of the CO2/O2 rate. This same time was the most important period for grassland and forest expansion, and the sunflower family also underwent an explosive expansion during this time [27]. The early Miocene (~20 Ma ago) is the time of formation and differentiation of Malaysian flora [31]. The old Chinese mainland, because of the relatively warm climate, was the most fertile area on Earth, had become one diversity center of earth. The genus of Blumea, which mostly originated from palaeotropical region, had moved to south China, also accompanied with an explosive expansion for more herbal members, such as B. saussureoides, B. sinuata, B. oblongifolia, B. lacera, and others that are more suitable for the low CO2/O2 rate.
Combining the evidence from paleogeography and paleoclimate and two root ages of Asteraceae, the originate time of genus Blumea may be estimated to be 49.00–18.43 Ma; the divergence time of the two major clades was further estimated to be 45.23–17.76 Ma ago. This genus experienced an explosive expansion during the Oligocene and Miocene.

3. Discussion

The genus Blumea is one of the largest genera of Inuleae (Asteraceae), being widely distributed in ancient tropical regions around the Pacific. South China is one diversity center of this genus, containing 30 species. Given the variety of its morphology, its phylogenetic analysis and trait characterization have been vigorously disputed since the first description of this genus. Phylogenetic analysis using molecular markers has been widely used to attempt to resolve this dispute [10,11]. Pornpongrungrueng [11] conducted a phylogenetic analysis on Blumea. The results showed that Blumea (including Blumeopsis flava) is monophyletic, and suggested that this genus could be divided into two main clades and one single species, B. balsamifera, which differ in terms of habitat, ecology, and distribution. However, few samples were obtained from species in China. In this study, 16 Chinese samples, which include 12 species belonging to three sections of Blumea, that were sequenced with nrDNA ITS and cpDNA trnL-F sequences, were used to estimate the phylogenetic relationship between the members of this genus. The results repeatedly verified the conclusions of Pornpongrungrueng [11], which indicated that this genus could be divided into two clades: clade I, including B. aromatica, B. densiflora, B. balsamifera, and B. lanceolaria, and the others belonging to clade II. When comparing the habitat, distribution, chromosome number, and chemical composition, we found that the two main clades differ in all of these aspects plus ecology, with the Blumea clade mostly containing perennial shrubs or subshrubs, which were mostly distributed from evergreen forests, and those with the same chromosome number (2n = 18) and chromosome structure (6M + 8m + 4sm) [32], and whose chemical composition is similar [33]. Clade II is a widespread paleotropical group that comprises mostly annual, weedy herbs of open forests and fields. Divergence time estimation and evolutionary event hypothesizing are important tools in phylogenetic analysis, but, it is difficult to estimate evolutionary events and divergence time because of the fossil record. Choosing some geological events as calibration points could provide more evidence for the process of phylogenetic evolution and divergence event hypothesis [34]. Most of the families have no fossil record because the fossil record information on Inuleae is scant. Several fossils are clearly identifiable as members of Asteraceae and Goodeniaceae from the Oligocene and, later, and there are seeds of Menyanthaceae and Campanulaceae from the Oligocene and Miocene, respectively [35]. There are also several records of Eocene pollen of Asteraceae found in South America or China [36,37]. As Oligocene pollen of the Asteraceae is of a comparatively specialized type and it is found on several continents, it is reasonable to assume that it dates back at least to the Oligocene–Eocene boundary (42–49 Ma). Hind et al. estimated the same date [38]. However, according to a more recent paper by Barreda et al. [27], the most recent common ancestor of Asteraceae may have originated 76–66 Ma ago. In this research, by considering the time of formation of Hainan Island and Qiongzhou Strait (5.8–3.7 Ma) [39,40,41], we were able to estimate the divergence time of Blumea DC. The results indicated that Blumea may have originated from 49.00 to 18.43 Ma, and had an explosive expansion during the Oligocene and Miocene (45.23–17.76 Ma), when the two major clades differentiated. The evidence from paleogeography and paleoclimate are consistent with the conclusion that Blumea underwent differentiation and explosive expansion during the Oligocene and Miocene [29,30].

4. Materials and Methods

4.1. Plant Materials

In this study, 16 Chinese samples, including 12 species that belong to three sections of Blumea DC, were newly collected and sequenced, and the specimens of those samples were deposited in the herbarium of the Chinese Academy of Tropical Agricultural Sciences (herbarium code: CATCH). Nine reference samples of Blumea and seven samples of outgroups (seven species, six genera) were downloaded from Genbank. Table 3 provides the sequence information, locality, and other details of the accessions.

4.2. DNA Isolation

Genomic DNA was isolated from the above accessions while using the QIAGEN DNeasy Plant Minikit (QIAGEN, Düsseldorf, Germany), according to the manufacturer’s instructions. The DNA was diluted to 30 ng/μL and the ultraviolet absorption values at A260 were used.

4.3. DNA Amplification and Sequencing: ITS and trnL-F Sequence Amplification and Sequencing

Internal transcribed spacer (ITS) and trnL-F sequence amplification and analysis were conducted according to the previously established protocols [39,40]. The PCR mixture consisted of 60 ng DNA, 1.0 μM of each primer (Invitrogen Corp., Carlsbad, CA, USA), and 25.0 μL of 2× Taq PCR Master Mix (0.1 U/μL Taq polymerase, 500 μM of each dNTP, 20 mM Tris-HCl at pH 8.3, 100 mM KCl, 3 mM MgCl2; Tiangen, Beijing, China) in a 50-μL volume. The PCR cycle protocol was based on previously established methods [42]. The PCR products that were obtained were separated on a 1.2% agarose gel, and then the bands of the expected size were excised from the gel and purified while using the QIAquick Gel Extraction Kit (QIAGEN Inc., Valencia, CA, USA), according to the manufacturer’s instructions. The purified PCR products were subjected to sequencing (Invitrogen, Shanghai, China).

4.4. Sequence Processing, Conversion, and Analysis

4.4.1. Single Sequence

First, the raw sequences of the ITS and trnL-F fragments (Invitrogen, Shanghai, China) were edited to remove the low-quality parts. The edited sequences were then submitted to GenBank (Table 3). The sequences of both loci were aligned while using MEGA 7.0 [12] with the default options and saved in *.nexus and *.aln formats. The interleaved *.nexus files were converted to the non-interleaved *.nex format while using PAUP 4.0a164 [15]. The sequence saturation and best substitution model were analyzed using DAMBE [13] and jmodeltest 2.1.7 [14], and then the poorly aligned positions and divergent regions in each aligned sequence were removed using Gblocks0.91b [43,44], using the filtration parameters that were described by Guillou [44].

4.4.2. Combined Sequence

The datasets of ITS and trnL-F sequences were loaded into PAUP 4.0 (https://paup.phylosolutions.com/) [14] for compatibility testing (ILD test) [47]. The compatibility testing (ILD test) revealed no incongruence between ITS and trnL-F sequences (p = 0.19). Subsequently, the sequences were merged while using SequenceMatrix1.8 [48] and saved in *.nex format.

4.5. Phylogenetic Tree Construction

To reconstruct a more accurate phylogeny of Blumea, first, a single sequence or combined sequence was used for constructing a phylogeny tree while using four phylogenetic tree construction methods: neighbor-joining (NJ) method, the maximum parsimony (MP) method, the maximum likelihood (ML) method, and the Bayesian inference (BI) method in PAUP 4.0a164 [15], IQ-TREE [49,50], and MrBayes 3.2.6 [51]. Afterwards, the topology of the phylogenetic tree was evaluated with different methods in TreePuzzle 5.3.rc16 [18] and CONSEL software [19]. The phylogenetic trees with the best topology were edited with FigTree 1.4.2 (http://tree.bio.ed.ac.uk/software/figtree/) and Inkscape 0.9.2 (https://inkscape.org/).

4.5.1. Neighbor-Joining (NJ) Method

The NJ analysis was performed with PAUP version 4.0a164 [15] with heuristic searches under the random option of the stepwise addition algorithm with equal weighting of all characters. Bootstrap 50% majority-rule consensus trees were reconstructed by performing heuristic searches with 1000 bootstrap replicates.

4.5.2. Maximum Parsimony (MP) Method

The same as the NJ method, an MP analysis was reconstructed with PAUP 4.0a164 [15], performing heuristic searches with 1000 bootstrap replicates.

4.5.3. Maximum Likelihood (ML) Method

Before ML analysis with IQ-TREE [49,50], the best substitution models of the single or combined sequences were computed with jmodeltest 2.1.7 [14]. Subsequently, the phylogenetic tree with the ML method was analyzed with IQ-TREE [49,50] using the default settings, with 1000 bootstrap (BP) values for tree evaluation.

4.5.4. Bayesian inference (BI) method

With the best substitution models and parameters that were computed by jmodeltest 2.1.7 [14], BI analysis was performed with MrBayes 3.2.6 [51], but not all of the substitution models computed by jmodeltest 2.1.7 [14] were available in MrBayes, so an General time reversible (GTR) model with unequal rates and unequal base freq) model were used for BI analysis, and the base frequency of the nucleic acids and transition/transversion rates were set according the results from jmodeltest 2.1.7 [14]. The analysis parameters were set as four chains that were run simultaneously for 10,000,000 generations or until the average standard deviation of the split frequencies fell below 0.01. The trees were sampled with every 100 generations and a total of 20,000 trees were generated with the initial sample. Subsequently, the consensus tree was summarized with LogCombiner 1.10.4 and TreeAnnotator 1.10.4, and the parameters were first set to 10%, but then discarded as burn-in, and a 50% majority-rule consensus tree with posterior probability (PP) values was used.

4.6. Divergence Time Estimation

4.6.1. Time Node Selection and Correction

As there are no unequivocal fossils for Blumea DC and its relatives in Inuleae, the divergence and diversification times were difficult to estimate. Two root ages of Asteraceae were compared to accurately estimate divergence time estimation for Blumea, in this study: the recent results from Barreda et al. [27], who estimated the root age of Asteraceae at 76–66 Ma; and, the time generally accepted by other researchers, 49–42 Ma [20,21,22]. Subsequently, the geological ages of Qiongzhou Strait and Hainan Island, 5.8–3.7 Ma, were selected as the latest differentiation time of B. aromatica DC samples from Guizhou and Hainan [38,40,41]. To investigate the speciation rates of Blumea DC along with time, BAMM (http://bamm-project.org/) [23] and BAMMtools (https://cran.rstudio.com/web/packages/BAMMtools/index.html) [24] were used to compare the speciation rates with the two hypotheses of the root age of Asteraceae.

4.6.2. Divergence Time Estimation and Evolutionary Event Hypothesis

All of the divergence times and evolutionary events were hypothesized while using BEAST 1.10.4 (http://beast.community/) [25]. First, the likelihood ratio test (LRT) [52] was used to determine that the ITS or trnL-F data conformed to the molecular clock hypothesis. The results indicated that the Blumea data were not suitable for the molecular clock hypothesis (p = 0.03). Afterwards, the divergence times were analyzed while using BEAST 1.10.4 [25], incorporating an uncorrelated lognormal clock model and a birth–death speciation process, and the nucleotide substitution model settings were compared with the jmodeltest results. The parameters were set to be similar to those used in MrBayes 3.2.6 during the analysis process [51], and with four gamma Categories, 10,000,000 generations for four independent Markov chain Monte Carlo (MCMC) runs, sampling every 10,000 generations, with substitution and clock models being unlinked between partitions. The convergence and effective sample size (>200) of parameters were analyzed with Tracer 1.7. LogCombiner 1.10.4 and TreeAnnotator 1.10.4 were used for summarizing the trees, and the parameters, which were set at first to 10%, were discarded as burn-in, and a 50% majority-rule consensus tree with PP values was used instead. Lastly, a strap package [26] in R was used for visualization of the results of BEAST to reflect the divergence time of Blumea, especially the geological time scale.

Author Contributions

Conceptualization, Y.P. and F.Y.; methodology, Y.Y.; software, Y.Z.; validation, Y.P., F.Y. and Y.Z.; investigation, Y.P.; resources, Y.Y.; data curation, X.H.; writing—original draft preparation, Y.Z.; writing—review and editing, Y.Y.; visualization, C.Y.; supervision, D.W.; project administration, Y.P. and F.Y; funding acquisition, Y.P. and D.W.

Funding

This research was funded by the National Natural Science Foundation of China, grant numbers 81374065 and 81403035.

Conflicts of Interest

The authors declare no conflict of interest.

References

  1. Randeria, A.J. The compositae genus blumea: A taxonomic revision. Blumea Biodivers. Evol. Biogeogr. Plants 1960, 10, 176–317. [Google Scholar]
  2. Bremer, K.; Anderberg, A.A. Asteraceae: Cladistics & Classification; Timber Press: Portland, OR, USA, 1994. [Google Scholar]
  3. Anderberg, A.A.; Eldenäs, P. XVII. Tribe inuleae cass. In Flowering Plants. Eudicots: Asterales; Kadereit, J.W., Jeffrey, C., Eds.; Springer: Berlin, Germany, 2007; pp. 374–390. [Google Scholar]
  4. Chao-chien, C.; Yong-qian, T. The asteraceae: Tribe of inuleae-helenieae. In Flora Reipublicae Popularis Sinica; Yong, L., Ed.; Science: Beijing, China, 1984; Volume 75, pp. 11–44. [Google Scholar]
  5. Shi, Z.; Chen, Y.; Chen, Y.; Lin, Y.; Liu, S.; Ge, X.; Gao, T.; Zhu, S.; Liu, Y.; Yang, Q.; et al. Asteraceae (Compositae) [family introduction, glossary, systematic list, and key to tribes]. In Flora of China; Raven, P.H., Zhang, L., Al-Shehbaz, I.A., Turland, N.J., Guanghua, Z., Pepper, L.J., Eds.; Science Press: Beijing, China; Missouri Botanical Garden Press: St. Louis, MO, USA, 2011; Volumes 20–21, pp. 829–837. [Google Scholar]
  6. Jia, M.; Li, X. Chinese National Pharmacology, 1st ed.; Chinese Medical Science: Beijing, China, 2005. [Google Scholar]
  7. Perry, L.M.; Metzger, J. Medicinal Plants of East and Southeast Asia: Attributed Properties and Uses, 1st ed.; Massachusetts Institute of Technology: Cambridge, MA, USA, 1980. [Google Scholar]
  8. State Pharmacopoeia Commission of the PRC. Pharmacopoeia of the People’s Republic of China; Chemical Industry Press: Beijing, China, 2000. [Google Scholar]
  9. Huang, T.; Di, Z.; Zhao, S. Modern Ben Cao Gang Mu, 1st ed.; Chinese Medical Science Press: Beijing, China, 2001. [Google Scholar]
  10. Pornpongrungrueng, P.; Borchsenius, F.; Englund, M.; Anderberg, A.A.; Gustafsson, M.H.G. Phylogenetic relationships in Blumea (Asteraceae: Inuleae) as evidenced by molecular and morphological data. Plant Syst. Evol. 2007, 269, 223–243. [Google Scholar] [CrossRef]
  11. Pornpongrungrueng, P.; Borchsenius, F.; Gustafsson, M.H.G. Relationships within Blumea (Inuleae, Asteraceae) and the Utility of the 5S-NTS in Species-Level Phylogeny Reconstruction. Taxon 2009, 58, 259–272. [Google Scholar] [CrossRef]
  12. Kumar, S.; Stecher, G.; Tamura, K. MEGA7: Molecular Evolutionary Genetics Analysis version 7.0 for bigger datasets. Mol. Biol. Evol. 2016, 33, 1870–1874. [Google Scholar] [CrossRef] [PubMed]
  13. Xia, X. DAMBE7: New and Improved Tools for Data Analysis in Molecular Biology and Evolution. Mol. Biol. Evol. 2018, 35, 1550–1552. [Google Scholar] [CrossRef] [Green Version]
  14. Darriba, D.; Taboada, G.L.; Doallo, R.; Posada, D. jModelTest 2: More models, new heuristics and high-performance computing. Nat. Methods 2012, 9, 772. [Google Scholar] [CrossRef]
  15. Swofford, D.L. PAUP*; Version 4; Sinauer Associates: Sunderland, MA, USA, 2003. [Google Scholar]
  16. Akaike, H. Information theory and an extension of the maximum likelihood principle. In Proceedings of the 2nd International Symposium on Information Theory, Tsahkadsor, Armenia, 2–8 September 1971; Csáki, F., Petrov, B.N., Eds.; Akadémiai Kiado: Budapest, Hungary, 1973; p. 5. [Google Scholar]
  17. Schwarz, G.E. Estimating the Dimension of a Model. Ann. Stat. 1978, 6, 461–464. [Google Scholar] [CrossRef]
  18. Schmidt, H.A.; Petzold, E.; Vingron, M.; Von Haeseler, A. Molecular phylogenetics: Parallelized parameter estimation and quartet puzzling. J. Parallel Distrib. Comput. 2003, 63, 719–727. [Google Scholar] [CrossRef]
  19. Shimodaira, H.; Hasegawa, M. CONSEL: For assessing the confidence of phylogenetic tree selection. Bioinformatics 2001, 17, 1246–1247. [Google Scholar] [CrossRef]
  20. Ki-Joong, K.; Keung-Sun, C.; Jansen, R.K. Two chloroplast DNA inversions originated simultaneously during the early evolution of the sunflower family (Asteraceae). Mol. Biol. Evol. 2005, 22, 1783–1792. [Google Scholar]
  21. Torices, R. Adding time-calibrated branch lengths to the Asteraceae supertree. J. Syst. Evol. 2010, 48, 271–278. [Google Scholar] [CrossRef]
  22. Wagstaff, S.J.; Ilse, B.; Motomi, I. Evolution and biogeography of Pleurophyllum (Astereae, Asteraceae), a small genus of megaherbs endemic to the subantarctic islands. Am. J. Bot. 2011, 98, 62–75. [Google Scholar] [CrossRef] [PubMed]
  23. Rabosky, D.L. Automatic Detection of Key Innovations, Rate Shifts, and Diversity-Dependence on Phylogenetic Trees. PLoS ONE 2014, 9, e89543. [Google Scholar] [CrossRef] [PubMed]
  24. Rabosky, D.L.; Grundler, M.; Anderson, C.; Title, P.; Shi, J.J.; Brown, J.W.; Huang, H.; Larson, J.G. BAMMtools: An R package for the analysis of evolutionary dynamics on phylogenetic trees. Methods Ecol. Evol. 2014, 5, 701–707. [Google Scholar] [CrossRef]
  25. Suchard, M.A.; Baele, G.; Lemey, P.; Ayres, D.L.; Drummond, A.J.; Rambaut, A. Bayesian phylogenetic and phylodynamic data integration using BEAST 1.10. Virus Evol. 2018, 4. [Google Scholar] [CrossRef] [PubMed]
  26. Bell, M.A.; Lloyd, G.T. strap: An R package for plotting phylogenies against stratigraphy and assessing their stratigraphic congruence. Palaeontology 2015, 58, 379–389. [Google Scholar] [CrossRef]
  27. Barreda, V.D.; Palazzesi, L.; Tellería, M.C.; Olivero, E.B.; Raine, J.I.; Forest, F. Early evolution of the angiosperm clade Asteraceae in the Cretaceous of Antarctica. Proc. Natl. Acad. Sci. USA 2015, 112, 10989–10994. [Google Scholar] [CrossRef] [PubMed] [Green Version]
  28. Hedges, S.B.; Marin, J.; Suleski, M.; Paymer, M.; Kumar, S. Tree of Life Reveals Clock-Like Speciation and Diversification. Mol. Biol. Evol. 2015, 32, 835–845. [Google Scholar] [CrossRef]
  29. Lisiecki, L.E.; Raymo, M.E. A Pliocene-Pleistocene stack of 57 globally distributed benthic δ18O records. Paleoceanogr. Paleoclimatol. 2005, 20. [Google Scholar] [CrossRef]
  30. Miller, K.G.; Browning, J.V.; Aubry, M.P.; Wade, B.S.; Katz, M.E.; Kulpecz, A.A.; Wright, J.D. Eocene-Oligocene global climate and sea-level changes: St. Stephens Quarry, Alabama. Geol. Soc. Am. Bull. 2008, 120, 34–53. [Google Scholar] [CrossRef] [Green Version]
  31. Smedmark, J.E.E.; Anderberg, A.A. Boreotropical migration explains hybridization between geographically distant lineages in the pantropical clade Sideroxyleae (Sapotaceae). Am. J. Bot. 2007, 94, 1491–1505. [Google Scholar] [CrossRef] [PubMed]
  32. Lu, W. A Systematic Study of Blumea DC. (Asteraceae) of Taiwan; National Taiwan University: Taibei, Taiwan, 1996. [Google Scholar]
  33. Pang, Y.; Wang, D.; Fan, Z.; Chen, X.; Yu, F.; Hu, X.; Wang, K.; Yuan, L. Blumea balsamifera—A phytochemical and pharmacological review. Molecules 2014, 19, 9453–9477. [Google Scholar] [CrossRef] [PubMed]
  34. Lanyon, S.M.; Omland, K.E. A Molecular Phylogeny of the Blackbirds (Icteridae): Five Lineages Revealed by Cytochrome-B Sequence Data. Auk Ornithol. Adv. 1999, 116, 629–639. [Google Scholar] [CrossRef]
  35. Benton, M. Fossil Record 2, 1st ed.; Springer: Dordrecht, The Netherlands, 1993. [Google Scholar]
  36. Graham, A. A contribution to the geologic history of the Compositae. In Proceedings of the International Compositae Conference, Kew, UK, 24 July–5 August 1994; Hind, D.J.N., Beentje, H., Eds.; Royal Botanic Gardens: London, UK, 1996; Volume 1, pp. 123–140. [Google Scholar]
  37. De-xin, J.; Hu-qiu, Y. A research on Tertiary Palynology from the Qaidam Basin, Qinghai Province (in Chinese). Acta Bot. Sin. 1998, 1, 77–82. [Google Scholar]
  38. Hind, D.J.N.; Jeffrey, C.; Pope, G.V. Advances in compositae systematics. In Distributed for Royal Botanic Gardens, Kew; Royal Botanic Gardens, Kew: London, UK, 1995. [Google Scholar]
  39. Zhao, H.; Wang, L.; Yuan, J. Origin and time of Qiongzhou strait. Mar. Quat. Geol. 2007, 27, 33–38. [Google Scholar]
  40. Yong, H.; Guo, X.; Ho, S.Y.W.; Shi, H.; Li, J.; Li, J.; Bo, C.; Wang, Y. Diversification and Demography of the Oriental Garden Lizard (Calotes versicolor) on Hainan Island and the Adjacent Mainland. PLoS ONE 2013, 8, e64754. [Google Scholar]
  41. Zhu, H. Biogeographical Evidences Help Revealing the Origin of Hainan Island. PLoS ONE 2016, 11, e0151941. [Google Scholar] [CrossRef] [PubMed]
  42. Taberlet, P.; Gielly, L.; Pautou, G.; Bouvet, J. Universal primers for amplification of three non-coding regions of chloroplast DNA. Plant Mol. Biol. 1991, 17, 1105–1109. [Google Scholar] [CrossRef] [PubMed]
  43. Castresana, J. Selection of conserved blocks from multiple alignments for their use in phylogenetic analysis. Mol. Biol. Evol. 2000, 17, 540–552. [Google Scholar] [CrossRef]
  44. Talavera, G.; Castresana, J. Improvement of Phylogenies after Removing Divergent and Ambiguously Aligned Blocks from Protein Sequence Alignments. Syst. Biol. 2007, 56, 564–577. [Google Scholar] [CrossRef] [Green Version]
  45. Panero, J.L.; Funk, V.A. The value of sampling anomalous taxa in phylogenetic studies: Major clades of the Asteraceae revealed. Mol. Phylogenetics Evol. 2008, 47, 757–782. [Google Scholar] [CrossRef] [PubMed]
  46. Funk, V.A.; Sancho, G.; Roque, N.; Kelloff, C.L.; Ventosa-Rodríguez, I.; Diazgranados, M.; Bonifacino, J.M.; Chan, R. A phylogeny of the Gochnatieae: Understanding a critically placed tribe in the Compositae. Taxon 2014, 63, 859–882. [Google Scholar] [CrossRef]
  47. Farris, J.S.; Källersjö, M.; Kluge, A.G.; Bult, C. Testing Significance of Incongruence. Cladistics Int. J. Willi Hennig Soc. 2010, 10, 315–319. [Google Scholar] [CrossRef]
  48. Vaidya, G.; Lohman, D.J.; Meier, R. SequenceMatrix: Concatenation software for the fast assembly of multi-gene datasets with character set and codon information. Cladistics Int. J. Willi Hennig Soc. 2011, 27, 171–180. [Google Scholar] [CrossRef]
  49. Lam-Tung, N.; Schmidt, H.A.; Arndt, V.H.; Bui Quang, M. IQ-TREE: A fast and effective stochastic algorithm for estimating maximum-likelihood phylogenies. Mol. Biol. Evol. 2015, 32, 268–274. [Google Scholar]
  50. Chernomor, O.; Haeseler, A.V.; Minh, B.Q. Terrace Aware Data Structure for Phylogenomic Inference from Supermatrices. Syst. Biol. 2016, 65, 997–1008. [Google Scholar] [CrossRef] [PubMed] [Green Version]
  51. Huelsenbeck, J.P.; Ronquist, F. Mrbayes: Bayesian inference of phylogenetic trees. Bioinformatics 2001, 17, 754–755. [Google Scholar] [CrossRef] [PubMed]
  52. Felsenstein, J. Phylogenies from molecular sequences: Inference and reliability. Annu. Rev. Genet. 1988, 22, 521–565. [Google Scholar] [CrossRef] [PubMed]
Figure 1. Phylogenetic tree based on the nrDNA internal transcribed spacer (ITS) sequence, where the numbers above the branches indicate the bootstrap value or posterior probabilities. (A) Phylogenetic tree determined by Neighbor-joining (NJ) method using the PAUP program; the numbers above the branches indicate the bootstrap value. (B) Phylogenetic tree with best topology, determined by Maximum Parsimony (MP) method using the PAUP program. The numbers above the branches indicate the bootstrap value. (C) Phylogenetic tree determined by Bayesian inference (BI) method using the MrBayes program; the numbers above the branches indicate the posterior probabilities. (D) Phylogenetic tree determined by Maximum Likelihood (ML) method using the IQtree program; the numbers above the branches indicate the bootstrap value.
Plants 08 00210 g001
Figure 2. Phylogenetic tree based on the cpDNA trnL-F sequence, where the numbers above the branches indicate the bootstrap value or posterior probabilities. (A) Phylogenetic tree determined by the NJ method using the PAUP program; the numbers above the branches indicate the bootstrap value. (B) Phylogenetic tree with best topology, determined by the MP method using the PAUP program; the numbers above the branches indicate the bootstrap value. (C) Phylogenetic tree determined by the ML method using the IQtree program; the numbers above the branches indicate the bootstrap value. (D) Phylogenetic tree determined by the BI method with using the MrBayes program; the numbers above the branches indicate the posterior probabilities.
Plants 08 00210 g002
Figure 3. Phylogenetic tree based on the combined sequence; the numbers above the branches indicate the bootstrap value or posterior probabilities. The numbers above the branches indicate the bootstrap value. (A) Phylogenetic tree determined by the neighbor-joining (NJ) method using the PAUP program, (B) phylogenetic tree determined by the MP method using the PAUP program, (C) phylogenetic tree determined by the ML method using the IQtree program, and (D) phylogenetic tree determined by the BI method using the MrBayes program.
Plants 08 00210 g003
Figure 4. Divergence time estimation and speciation–extinction rate analysis based on the root age of Asteraceae as 49–42 Ma [20,21,22] and combined sequence. (A) The speciation–extinction rates analysis performed by BAMM [23] and BAMMtools [24]. (B) The divergence time estimation performed by BEAST 1.10.4 [25], and geological time scale visualized with the strap package [26]. The values beside nodes indicate the estimated median time of differentiation, and error bars indicate 95% highest posterior density (HPD) of differentiation. The black squares on nodes indicate calibration time. The circles with black, blue and red respectively indicate posterior probability more than 0.90, 0.60–0.90, and less than 0.60.
Plants 08 00210 g004
Figure 5. Divergence time estimation and speciation–extinction rates analysis based on the root age of Asteraceae as 76–66 Ma [27] and the combined sequence. (A) The speciation–extinction rates analysis performed by BAMM [23] and BAMMtools [24]. (B) The divergence time estimation performed by BEAST 1.10.4 [25], and geological time scale visualized with the strap package [26]. The values beside nodes indicate the estimated median time of differentiation, and error bars indicate 95% HPD of differentiation. The black squares on nodes indicate calibration time. The circles with black, blue and red respectively indicate posterior probability more than 0.90, 0.60-0.90, and less than 0.60.
Plants 08 00210 g005
Figure 6. The divergence time estimation between Blumea balsamifera DC. and Pluchea. Carolinensis (Jacq.) G. Don., based on TimeTree.
Plants 08 00210 g006
Table 1. Features of Nuclear ribosomal DNA (nrDNA) internal transcribed spacer (ITS) and chloroplast DNA (cpDNA) tRNA gene L region (trnL)- tRNA gene F region (trnL) intergenic spacer sequences of Blumea DC.
DNA RegionNumber of CharactersNumber of Constant CharactersNumber of Variable CharactersNumber of Informative CharactersPercent of Informative Sites (%)Best Substitution ModelModel Matrix
RatesNcatP-invarGamma Shape
nrDNA ITS65723042731447.79SYM + I + G aGamma40.23902.1770
cpDNA trnL-F858700158708.16TVM + G bGamma40.00.9240
Combined sequence154596055137524.27GTR + I + G a Gamma40.00.7302
Notes: a SYM (symmetrical model) + I (proportion of invariable sites) + G (gamma distribution); b TVM (transversion model) + G; c GTR (general time reversible) + I + G.
Table 2. The topology compared with four phylogenetic tree construction methods.
DNA RegionTree MethodRankobsaaubnpcbpdppekhfshgwkhhwshi
nrDNA ITSNJa32.60.3580.3310.0950.0670.3370.5570.2850.635
MPb426.50.0020.0020.0023.000 × 10−120.0130.0250.0130.019
MLc1−2.60.6810.6690.6740.8660.6620.8590.6620.885
BId22.60.3570.3310.2290.0670.3380.5580.3380.648
cpDNA trnL-FNJ40.40.3370.2740.2750.1760.3000.3090.3000.309
MP30.00.4100.2130.2100.2740.3260.7430.3260.620
ML20.00.5030.3570.3510.2740.4530.6820.4530.655
BI10.00.7310.1630.1640.2750.5470.9970.5470.992
Combined sequenceNJ48.50.0970.0770.0771.000 × 10−40.1250.2290.1250.187
MP30.00.3280.2930.3010.0090.2970.4350.2970.413
ML20.00.1650.0550.0560.4950.0850.7530.0850.691
BI10.00.8670.5780.5660.4960.9150.9820.9150.986
Notes: NJa = Neighbor-joining; MPb = Maximum Parsimony; MLc = Maximum Likelihood; BId = Bayesian inference; Obsa = observed log-likelihood difference to the best topology; aub = approximately unbiased; npc = bootstrap probability of the topology (i.e., the probability that the given topology has the largest likelihood in 10 scaled sets of 10,000 bootstrap replicates); bpd = np with 10 non-scaled sets of 10,000 bootstrap replicates; ppe = Bayesian posterior probabilities of the model; khf = Kishino–Hasegawa; shg = Shimodeira–Hasegawa; wkhh = weighted Kishino–Hasegawa; wshi = weighted Shimodeira–Hasegawa.
Table 3. Localities and samples used in the present study.
SectionCodeLatin NameLocalityGenBank Accession NumberReference
ITStrnL-F
Semivestitae
(2 spp.)
B. megacephalaBlumea megacephala (Randeria) Chang & TsengGuangxi, ChinaKP052666KP052682This research
B. ripariaB. riparia (Bl.) DC.Yunnan, ChinaKP052668KP052685This research
Macrophyllae
(6 spp.)
B. balsamifera p1B. balsamifera (L.) DC.Guizhou, ChinaKP052658KP052674This research
B. balsamifera p2B. balsamifera (L.) DC.Yunnan, ChinaKP052659KP052675This research
B. balsamifera p3B. balsamifera (L.) DC.Hainan, ChinaKP052660KP052676This research
B. aromatic p1B. aromatica DC.Guizhou, ChinaKP052656KP052672This research
B. aromatic p2B. aromatica DC.Hainan, ChinaKP052657KP052673This research
B. oxydontaB. oxyodonta DC.ThailandEU195665EU195630[11]
B. densifloraB. densiflora DC.ThailandEF210934EF211029[10]
B. saxatilisB. saxatilis Zoll. & Mor.AustraliaEF210945EF211040[10]
B. formosanaB. formosana KitamZhejiang, ChinaKP052665KP052678This research
B. clarkeiB. clarkei Hook. f.ThailandEF210974EF211069[10]
Paniculatae
(9 spp. and 2 varieties)
B. fistulosaB. fistulosa (Roxb.) Kurz.Yunnan, ChinaKP052661KP052677This research
B. hieraciifoliaB. hieraciifolia (D. Don) DC.Yunnan, ChinaKP052662KP052679This research
B. hieraciifolia var. hamiltoniiB. hieraciifolia var. hamiltoniiBurmaEF210972EF211067[10]
B. hieraciifolia var. macrostachyaB. hieraciifolia var. macrostachyaThailandEF210937EF211032[10]
B. lanceolariaB. lanceolaria (Roxb.) Druce.Guangxi, ChinaKP052664KP052681This research
B. laceraB. lacera (Burm. f.) DC.Zhejiang, ChinaKP052663KP052680This research
B. mollisB. mollis (D. Don) Merr. Hainan, ChinaKP052670KP052683This research
B. napifoliaB. napifolia DC.ThailandEF210959EF211054[10]
B. oblongifoliaB. oblongifolia KitamHainan, ChinaKP052667KP052684This research
B. saussureoidesB. saussureoides Chang & TsengYunan, ChinaKP052669KP052686This research
B. sinuataB. sinuata (Lour.) Merr.ThailandEF210948EF211043[10]
B. virensB. virens DC.ThailandEF210957EF211052[10]
UncertaintyBlumeposis flavaBlumeposis flava Gagnep.ThailandEF210960EF211055[10]
OutgroupCaesulia axillarisCaesulia axillaris Roxb.IndiaEF210949EF211044[10]
Pluchea carolinensisPluchea carolinensis (Jacq.) G. Don.Taiwan, ChinaAF437850EU385104[45]
Laggera alataLaggera alata (D. Don) Sch. Bip. ex Oliv.ThailandEF210930EF211025[10]
L. pterodontaL. pterodonta (DC.) Sch. Bip. ex Oliv.ThailandEF210929EF211024[10]
Schlechtendalia luzulifoliaSchlechtendalia luzulifoliaAustraliaKF989506KF989612[46]
Barnadesia caryophyllaBarnadesia caryophyllaAustraliaAY504686AY504768[46]
Elephantopus scaberElephantopus scaber L.Hainan, ChinaKP052671KP052687This research

