Article

Potential Effects of Awn Length Variation on Seed Yield and Components, Seed Dispersal and Germination Performance in Siberian Wildrye (Elymus sibiricus L.)

1
State Key Laboratory of Grassland Agro-Ecosystems, Key Laboratory of Grassland Livestock Industry Innovation, Ministry of Agriculture, College of Pastoral Agriculture Science and Technology, Lanzhou University, Lanzhou 730020, China
2
Sichuan Academy of Grassland Science, Chengdu 611731, China
*
Author to whom correspondence should be addressed.
Submission received: 22 October 2019 / Revised: 23 November 2019 / Accepted: 27 November 2019 / Published: 1 December 2019
(This article belongs to the Section Plant Ecology)

Abstract

:
Awns, needle-like structures formed on the distal of the lemmas in the florets, are of interest because of their essential roles in seed dispersal, germination and photosynthesis. Previous research has reported the potential benefits of awns in major cereal grasses, yet reports on the agronomic and economic implications of awn length variation in forage grasses remain scarce. This study investigated the variation of awn length among 20 Siberian wildrye populations and the effect of awn length on seed yield and yield components. This work then studied the impact of awn length on seed dispersal and germination. The analyses indicated a high level of awn length variation among populations. Awn length showed a significant influence on harvested seed yield per plant (p < 0.05) mostly driven by interactions between awn length and the majority of seed yield components. Principal component analysis clearly revealed that the final impact of awn length on seed yield depends on the balance of its positive and negative effects on traits determining seed yield. Furthermore, awn length tended to increase seed dispersal distance, although little diversity in the nature of this progression was observed in some populations. Awn length exhibited a significant relationship (p < 0.05) with germination percentage. It also tended to shorten germination duration, although this interaction was not statistically significant. Collectively, these results provide vital information for breeding and agronomic programs aiming to maintain yield in grasses. This is the first report to demonstrate in Siberian wildrye the agronomic impacts of awn length variation.

1. Introduction

Siberian Wildrye (Elymus sibiricus L.), which belongs to the genus Elymus (Poaceae: Triticeae), is an important perennial, self-pollinating and cool-season bunchgrass. The grass is native to the high altitude regions of western and northern China [1] and widespread in Asia, Europe and North America [2]. This species has erect naked stems with evenly distributed basal leaves, providing good grazing for livestock. The inflorescence of Siberian wildrye is a long, flexuous spike containing about 30 spikelets, in which each spikelet consists of 5–8 florets with outcurving long awns that can repel seed-eating birds and mammals [3]. Unlike domesticated cereal crops, such as rice and wheat, that have awnless species, which facilitate harvesting and processing activities [4], no awnless Siberian wildrye genotype has been reported so far. Siberian wildrye has been widely used in cultivated pastures and natural grasslands because of its high quality and palatable forage with high protein content, as well as excellent stress tolerance [5]. However, the grass is biologically ineffective at producing seeds and there are considerable seed losses even in suitable growing conditions [2]. Fluctuations in seed development and subsequent yield in Siberian wildrye, as in many other grass species, may be influenced by growing conditions, physiological processes underlying assimilates production and partitioning and molecular genetic factors [6,7]. Consequently, forage breeders have mainly focused on increasing biomass yield and enhancing forage quality [8]. Despite this, seed yield remains a decisive factor for a cultivar success in this species and understanding traits determining seed yield potential is imperative [2].
Seed yield in grasses is known to be associated with a number of seed yield components, such as spikelets per inflorescence, seeds per inflorescence, seed size and seed weight and seems impossible to achieve realized seed yields without considering these traits [6,9,10]. A number of considerable works have shown awns are positively associated with larger seed size and thereby increased yield in less favorable conditions [11,12]. Under favorable growing conditions, however, long awns compete with florets for assimilates, which exacerbates assimilate partitioning to florets. As a result, an increase in the number of sterile spikelets and thereby a decrease in harvested seed yield is detected [13]. Hence, the actual benefits of awns on seed yield remain controversial due to the lack of clear relationships between awn characteristics and traits determining seed yield. Studies investigating the photosynthetic role of awns compared to that of culm (mainly flag leaves) have applied several methodologies, such as source-sink manipulation (shading or/and removal of awns), the application of heavy radioactive isotope 14C and stable radioactive isotope 13C and carbon isotope discrimination to assign the contribution of awns to grain filling and harvestable yield but the obtained results varied greatly [14]. This variation seems to be associated with applied protocols and genotype x environment interaction [15] but biases related to sampling methods and phenotyping tools should be taken into account. Perhaps the most feasible approach to understanding the benefits of awns is to evaluate awn length variation and its direct and indirect effects on traits determining seed yield. As awn length is not only variable among species but also within species, individuals of the same population and even among spikelets of the same inflorescence [16,17], precise phenotyping tools from species representing a range of diverse genetic backgrounds could contribute toward understanding the role of awns on yield potential. Awn length variation provides a foundation for the selection and improvement of components of seed yield thereby realizing high seed yields.
Seed dispersal and germination are critical traits with the potential to evaluate the economic and ecological fitness of plant species [18,19]. There is increasing evidence that seed traits are coupled with both seed dispersal and germination performance. It is reported that larger seeds are disadvantageous during dispersal but contain more carbohydrates reserves, which facilitate seed germination and give rise to more vigorous seedlings than smaller ones [20,21]. A number of studies have shown that long and barbed awns assist seed dispersal by adhesion to animal fur [22,23,24]. However, reports on the contribution of awns on germination behavior remain scarce. A previous study indicated long awns could help seeds to rapidly emerge from deeper soil depth [25] but this is also impacted by several factors, including soil characteristics and coleoptile length, a concern appears to reveal the elusive role of awns on seedling emergence [26]. Under natural conditions, awned seeds’ burial depth during dispersal is deeper than that of awnless seeds, promoting initial seed growth especially in high temperature and fire-prone environments [16]. Therefore, seed dispersal and germination as critical stages of the life cycle of plant species could aid to assess the potential ecological and economic implications of awn length in grasses.
In contrast to major cereal crops, the agronomic and economic implications of awns in forage grasses are still poorly understood and specific information on the benefits of awns in Siberian wildrye is lacking. The aims of this study were to evaluate the variation of awn length across 20 Siberian wildrye populations and assess the influence of awn length on seed yield and seed yield components such as spikelets per inflorescence, florets per spikelet, seed set (%), seeds per inflorescence, seed size and thousand-seed weight (TSW). We then studied the impact of awn length variation on seed dispersal and germination performance. Our results provide fundamental information for the selection and future genetic improvement of awn traits in this species.

2. Results

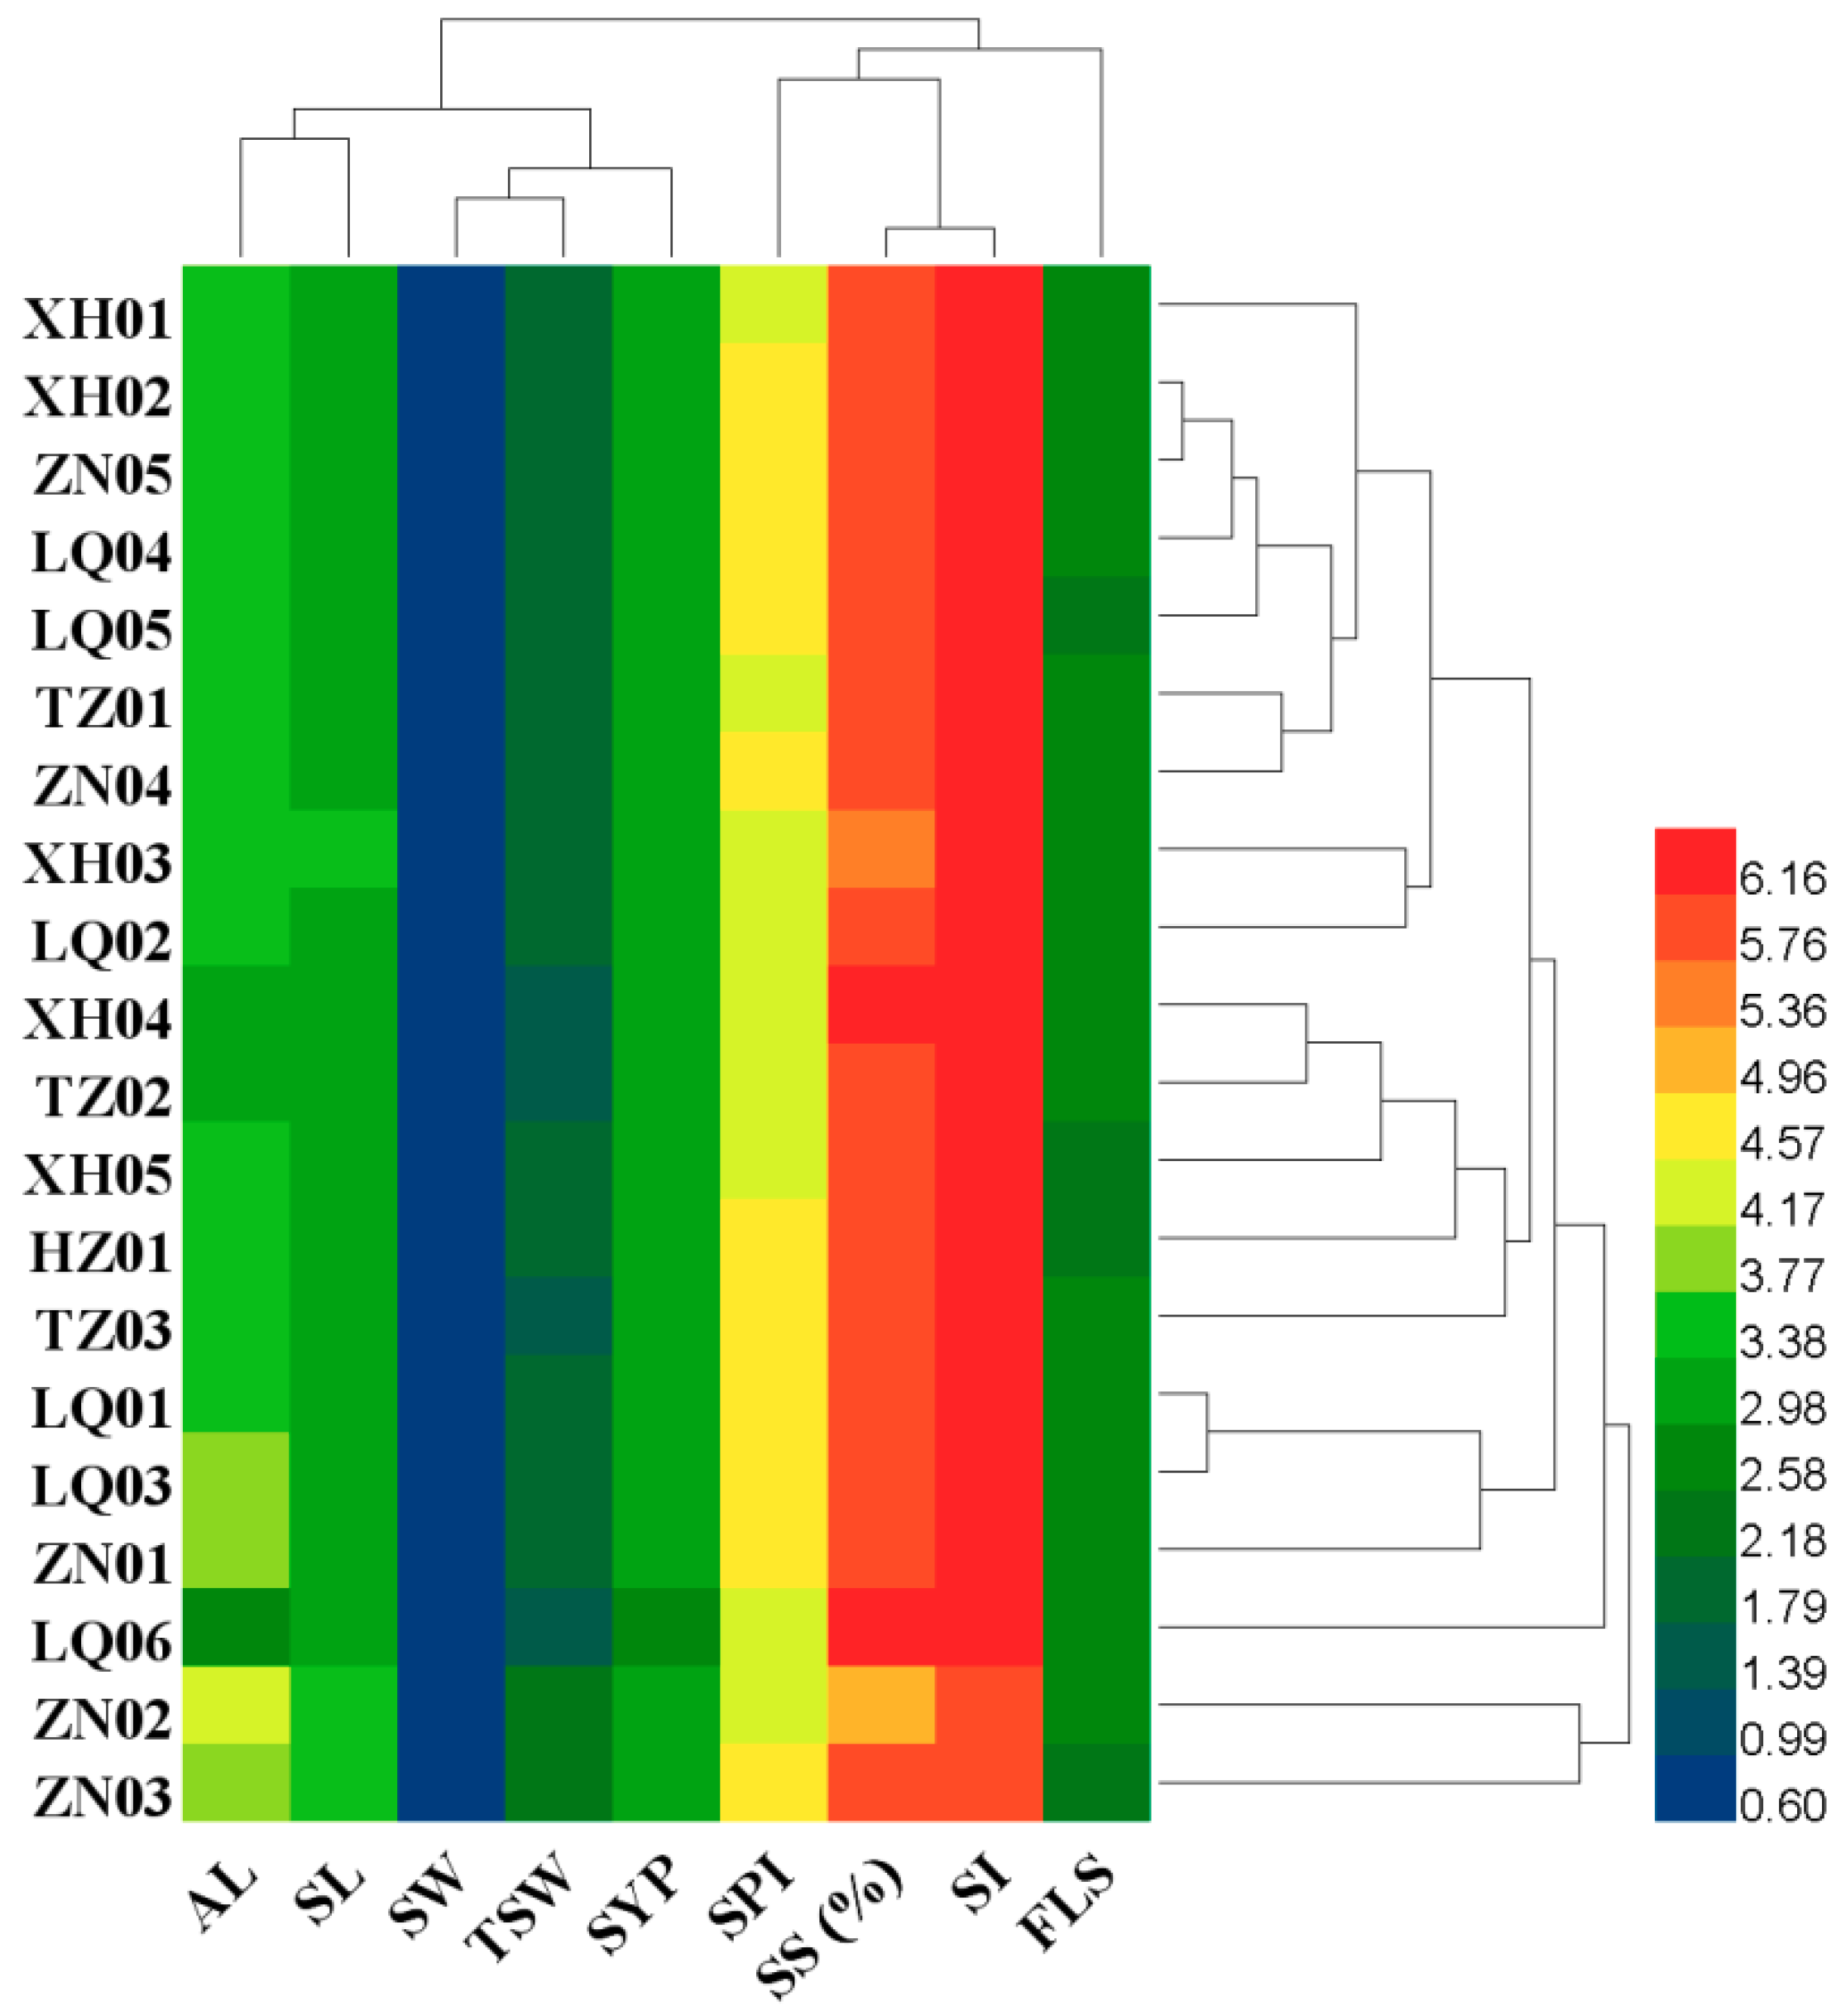
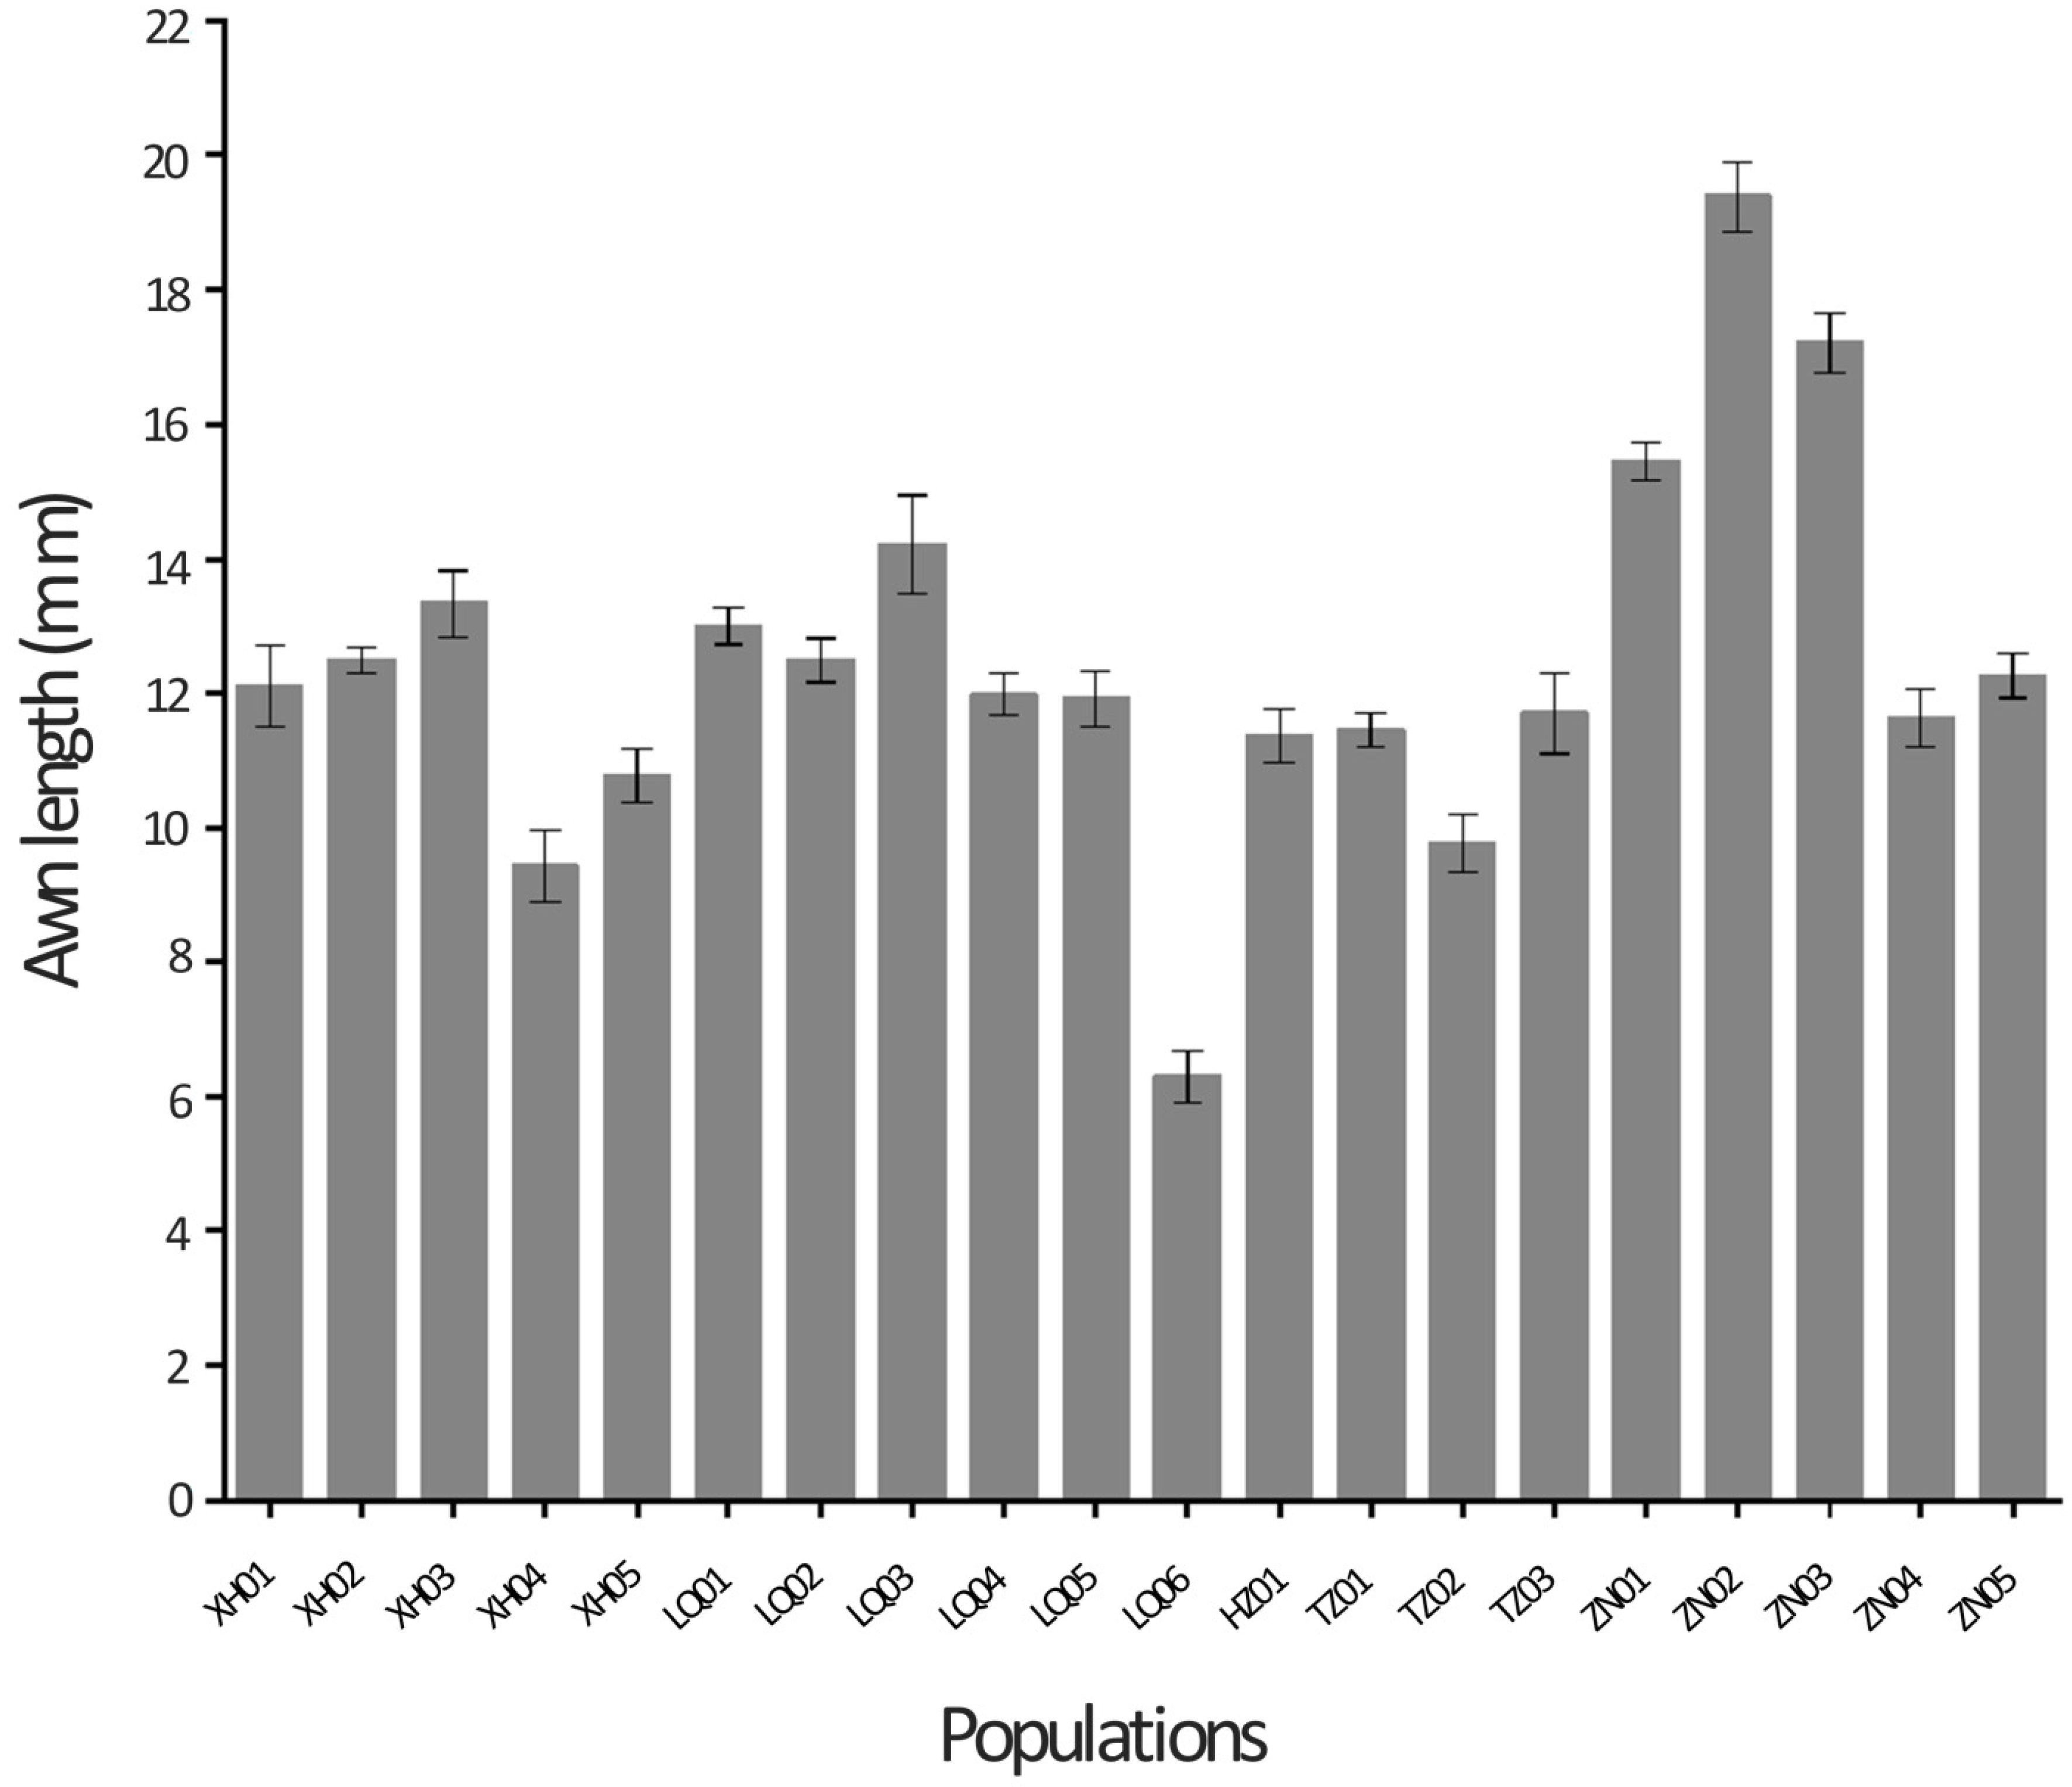
2.1. Variability in Awn Length, Yield Componentsand Seed Yield

The morphological variation for seed traits among 20 Siberian wildrye populations was investigated. Four of nine traits—awn length, seed set (%), seeds per inflorescence and TSW exhibited the coefficient of variation (CV) value higher than 10% (Table 1). The highest morphological variation was found for awn length (CV = 22.26%), while the lowest was found for florets per spikelet (CV = 2.55%). Seed yield per plant exhibited a moderate variation among 20 Siberian wildrye populations with a CV of 6.43%.
Clustering of nine traits formed two groups (Figure 1). The first group included five traits (awn length, seed length, seed width, TSW and seed yield per plant). The remaining four traits were assigned into the second group. Clustering analysis revealed that populations with the same geographical origin and similar phenotypic traits tended to group together. A total of 18 populations were assigned into group one and two populations, ZN02 and ZN03, were assigned in group two. The dendrogram was consistent with variation in seed traits.
To assess the effects of population and spikelet position on awn length, seed yield per plant and yield components, the spike was divided into three equal parts (basal, central and apical) based upon the spike length. Results of the ANOVA revealed differences between populations for awn length and seed width at particular spikelet positions (Table 2). There were significant differences among Siberian wildrye populations for awn length, seed yield per plant and all measured seed yield components (p < 0.05), except for florets per spikelet (Table 3). Awn length across populations ranged from 6.30 mm (LQ06) to 19.39 mm (ZN02), with an average of 12.41 mm (Table 1 and Table 3). Three populations (LQ06, XH04 and TZ02) showed a mean awn length of less than 10 mm (Figure 2).
Seed lengths ranged from 8.37 mm (LQ01) to 10.48 mm (TZ01) (Table 3). The majority of seed lengths (about 75%) were below 10 mm, with the seeds of ZN02 significantly longer than that of LQ01, LQ03, XH04, LQ06 and HZ01. Whereas LQ01 had narrower seeds than any other population tested here, ZN02 showed wider seeds than any other population. Spikelets per inflorescence ranged from 19.34 (ZN02) to 27.77 (ZN01), with minor differences in the number of spikelets observed between short-awned and long-awned populations. Florets per spikelet ranged from 5.80 (HZ01) to 6.47 (XH01), with a narrow difference observed among populations. Analyses across populations showed great variation in seed set (%), ranging from 38.50 (ZN02) to 73.09 (LQ06). Among populations, the highest and lowest frequencies of seeds per inflorescence were 55.25 observed in ZNO2 and 93.86 observed in HZ01, respectively. The mean weight per 1000 seeds was 3.89 g. The heaviest and lightest seeds were found in ZN02 (4.7 g) and LQ06 (3.05 g), respectively. Seed yield per plant ranged from 7.60g (LQ06) to 9.99g (ZN03), with a mean value of 8.76 g (Table 1 and Table 3).

2.2. Relationships Between Awn Length, Yield Componentsand Seed Yield

Correlation analyses indicated a wide range of relationships between awn length and seed yield components and among seed yield components (Table 4). Analyses revealed a significant correlation between awn length and seed length (r = 0.474). Seed set (%) and seeds per inflorescence showed a significant negative relationship with awn length with Pearson correlation coefficients of −0.677 and −0.722, respectively. Seed length and seed width showed a significant positive relationship with TSW with r values of 0.466 and 0.604, respectively. There was a significant relationship between seed set (%) and seeds per inflorescence (r = 0.519). Seed length showed a significant positive correlation with seed width (r = 0.428). However, a significant negative relationship was found between seed length and seed set (%) and seeds per inflorescence with Pearson correlation coefficients of −0.369 and −0.447, respectively (Table 4).
Analyses among populations revealed the contributions of some traits to the final seed yield per plant. Pearson correlation analysis revealed a significant positive relationship between awn length and seed yield per plant (r = 0.544) (Table 4). Spikelets per inflorescence exhibited a significant positive correlation with seed yield (r = 0.371). Whereas seed set (%) showed a significant negative relationship with seed yield (r = −0.231), florets per spikelet and seeds per inflorescence tended to decrease seed yield per plant, although these relationships were not statistically significant. Seed yield was significantly correlated with seed length (r = 0.487) and seed width (r = 0.448). In addition, a significant positive correlation between TSW and seed yield per plant (r = 0.526) revealed an overall positive seed weight- seed yield relationship.
The first three components of the principal component analysis (PCA) showed eigenvalues greater than 1 and explained 72.65% of total phenotypic variation (Table 5). The first component (PC1) had large positive associations with awn length (0.886), TSW (0.832) and seed length (0.706). PC1 also showed larger negative associations with seed number and seed set (%), with coefficients of −0.702 and −0.696, respectively, suggesting that PC1 was mainly involved in the impact of awn length on seed yield and components. While the second component (PC2) mainly revealed the contribution of yield components to seed yield per plant, it showed large positive associations with spikelet per inflorescence (0.773), seed yield per plant (0.593) and seeds per inflorescence (0.491). The third component (PC3) had large positive associations with florets per spikelet (0.841) and spikelets per inflorescence (0.399). It showed higher negative associations with seed set (%) with a coefficient of −0.418. PC3 focused mainly on relationships among seed yield components.

2.3. Impact of Geographical Distribution on Variation of Awn Length, Seed Yield Components and Seed Yield

Pearson correlation analysis was conducted to test the effects of environmental factors such as latitude, longitude and altitude on variation in awn length, seed yield components and seed yield. Analyses across 20 Siberian wildrye populations showed that awn length exhibited a negative correlation with latitude (r = −0.189) and longitude (r = −0.400) but it showed a weak positive correlation with altitude (r = 0.094). Seed length, florets per spikelet, seed set (%) and seeds per inflorescence exhibited a positive correlation with latitude, though no one was significant (Table 4). Seed width, spikelets per inflorescence and TSW showed a negative relationship with latitude. All seed traits, except seed set (%) and seeds per inflorescence, exhibited a negative correlation with longitude with correlation coefficients ranging from −0.127 for spikelets per inflorescence to −0.663 for seed length. Seed width, spikelets per inflorescence and TSW showed a positive, though non-significant, relationship with altitude. In addition, seed length, florets per spikelet, seed set (%) and seed per inflorescence exhibited a negative relationship with altitude, also non-significant (Table 4). Thus, geographical factors (latitude, longitude and altitude) generally showed a negative correlation with seed yield per plant, while seed yield per plant decreased significantly with increasing longitude.

2.4. Pattern of Seed Dispersal Distance and Germination Traits

Seed dispersal distance was measured under a specific wind speed and showed variation across 20 Siberian wildrye populations (Table 6). ANOVA test revealed significant differences among populations for seed dispersal distance (p < 0.05). Seed dispersal distance increased with increasing awn length, although little diversity in the nature of this progression was observed in some populations. The longest and shortest seed dispersal distances were 1.68 m observed for HZ01 and 1.02 m observed for ZN02, respectively.
Under controlled germination experiments, germination traits were measured across Siberian wildrye populations. Results of the ANOVA showed significant differences among populations for germination indices measured here (p < 0.05), except for germination duration. The highest and the lowest germination percentages were 78.00% found for ZNO2 and 97.00% observed for LQ06, respectively (Table 6). Germination index ranged from 2.21 (HZ01) and 3.10 (TZ01), with significant differences documented among several populations. The longest and shortest duration for the completion of the germination process were 5.20 days observed in ZN01 and 3.80 days observed in XH01 and TZ03, respectively. Germination delay ranged from 3 days and 3.80 days and did not differ significantly among many populations.

2.5. Effects of Seed Traits on Seed Dispersal Distance and Germination Behavior

Analyses indicated that awn length tended to increase seed dispersal distance although this interaction was not statistically significant (r = 0.059) (Table 7). All measured traits showed a positive relationship with seed dispersal distance with a Pearson correlation coefficient ranging from 0.034 for seed length to 0.128 for seed width. The analysis showed that germination percentage significantly decreased with increasing awn length with a Pearson correlation coefficient of −0.357 (Table 7). Seed length and seed width exhibited negative relationships with germination percent, indicating that the germination rate decreased with increasing seed size. The TSW showed a significant negative correlation with germination percent (r = −0.241), indicating that populations with heavier seeds exhibited a low germination rate. Seed germination delayed with increasing seed width and TSW with Pearson correlation coefficients of 0.139 and 0.031, respectively.
The PCA among seed traits, germination indices and seed dispersal distance indicated that the first three components showed eigenvalues greater than 1 and explained 61.714% of total variation (Table 8). The first component (PC1) showed large positive associations with TSW (0.858), awn length (0.803), seed width (0.717). PC1 also showed large negative associations with germination percentage (−0.516) and germination index (−0.276), suggesting that this component was mainly involved in the effect of seed traits (TSW, awn length and seed width) on germination rate. The second component (PC2) showed larger positive associations with germination index (0.821) and seed length (0.396) and showed large negative associations with germination delay (−0.644) and germination delay (−0.605), indicating that longer seeds improved germination rate and shortened germination duration. The third component (PC3) showed positive associations with seed dispersal distance (0.672), seed width (0.327) and TSW (0.110). It also showed negative associations with awn length (−0.132) and seed length (−0.043). PC3 focused mainly on the impact of seed traits have on seed dispersal distance.

3. Discussion

3.1. Impact of Awn Length on Seed Yield and Components

A number of yield components, such as spikelets per inflorescence, seeds per inflorescence, seed size and seed weight, have the potential to influence harvested seed yield [27,28,29]. The large influence of awn length on harvested seed yield is due to its interaction with yield determining traits. Notably, our results showed a strong negative correlation between awn length and seeds per inflorescence (Table 4), indicating that seed set (%) and the number of seeds in the florets decreased significantly with increasing awn length. Although awn length increased with a decreasing number of seeds per inflorescence, awn length showed a significant positive correlation with two major seed yield components (seed length and seed width) across populations (Table 4). In addition, PCA results showed a wide variation of the contribution of awn length to seed yield components, indicating both positive and negative associations. Awn length had a great influence on harvested seed yield per plant via indirect causal effects that led to large associations with traits determining potential seed yield (Table 5). This indicates that long-awned plants might contribute to improving seed yield than short-awned plants in Siberian wildrye populations. The significance of awn length variation was previously investigated and was linked with several physiological processes. Otamane Merah et al. [15] used a carbon isotype discrimination approach in wheat and found that ear organs, including awns, contributed more to grain filling than flag leaves. The contribution of awns to kernel filling and grain yield was also supported by Rut Sachez-Bragado et al. [14]. In contrast, awns showed no significant or lower contribution to grain filling and grain yield increment compared to flag leaves when awn removal experiments were performed [30]. These results indicate that the contribution of awns on seed yield depends not only on its direct and indirect interactions with seed yield components but also on morphological features of awns.
While floret fertility is mainly associated with assimilate partitioning to the spikelets [12,28], increasing the number of fertile florets has been believed as a potential alternative to increase yield in grasses [13]. In the current study, floret fertility decreased with increasing awn length to reduce seeds per inflorescence (Table 4 and Table 5). Although long awns reduced seed number in Siberian wildrye, this trade-off showed a minor impact on seed yield per plant. Instead, correlation analyses indicated that seeds per inflorescence exhibited a total negative contribution on seed yield (Table 4). Previously, seed number varied significantly and showed a slight contribution to harvested seed yield in Leymus chinensis [10]. Other studies obtained similar results in wheat [9,12] and Stipa pupurea [31]. Contrarily, in some species, such as rice, reduced grain number by awns decreased harvested grain yield, despite their contribution to grain size increment [32], implying that seed yield increment by long awns depends on a significant increase in seed size that compensates reductions in seed number.
TSW increased with increasing seed size, indicating its great impact on seed yield. Supporting this observation, TSW exhibited a strong association with seed length and seed width when PCA was conducted, suggesting a positive correlated response in these traits which influenced seed yield (Table 5). These results reflect that seed size and seed weight were the most important seed yield components in Siberian wildrye populations. Similarly, the experiments by Hebblethwaite and Ivins [33] and Abel et al. [6] stated TSW contributed to greater harvestable seed yield in ryegrass (Lolium perenne L.). In wheat, awns increased grain size and thereby harvested grain yield [9,34]. As indicated, awns interacted with the majority of measured seed yield components. It is noteworthy that although the increment of assimilates by awns may contribute to floret fertility, the fact that long awns may compete with growing kernels and thereby reduce floret survival, especially under good agronomic conditions, is another consideration [9,12,34]. Thus, seed yield improvement via awn length optimization should be suggested as the breeding strategy.
Our results also showed an association between spikelets per inflorescence and traits determining seed yield potential such as seed size, seeds per inflorescence and TSW. These findings are consistent with a previous study that spikelet number has a significant direct effect on seed yield [6]. Moreover, evidence in wheat [13] and barley [4] suggested no relationship between awn length and spikelet number. Although the results of correlation analysis of the current study across Siberian wildrye populations supported this argument (Table 4), when PCA was performed, spikelets per inflorescence showed negative associations with awn length, though weak (Table 5). This suggests a likely possible interaction between awn length and spikelet number, which should be targeted by further experimental studies. While fluctuation in seed yield and components is common among and within grass species [35], it is thus worth noting that analyses derived from single yield component, individual plant, single plant population or single plant species may lead to misinterpretation of the impact of awn length on seed yield and components. A balance and interaction between different yield components may be the key factors that regulate and affect seed yield. Furthermore, seed yield is affected by the interaction of seed yield components, genetic mechanisms and agronomic and environmental factors [2,6,31]. Analyzing this interaction in different grass species would be a valid method for identifying awns’ impact on seed yield.

3.2. Seed Yield and Components as Affected by Geographical Factors

Geographical factors, such as latitude, longitude and altitude, have been regarded as the major contributors to yield variation in several plant species [36]. It was shown that changes in latitude, longitude and altitude may result in variation in temperature, radiation, moisture and soil fertility, which influence seed yield and components [31,35]. Previous data indicate latitude exhibited a positive correlation with seed traits, whereas longitude and altitude showed a negative correlation with seed yield-related traits in several species [37,38]. The results of the current study differ with this observation, although some seed traits showed a positive correlation with latitude and a negative correlation with longitude and altitude (Table 4). This can result from dramatic changes in seed yield components among Siberian wildrye populations, which accounted for the variation in the interactions among seed yield components and geographical factors. This supported a previous finding that seed yield and components in plant species may differ in adverse conditions across regions [39].
In the current study, Siberian wildrye populations varied spatially and temporally, indicating a wide variation observed in the relationships between geographical factors and seed yield and components. Our analyses revealed that seed yield per plant decreased with increasing latitude, longitude and altitude (Table 4), which reflects the negative interactions among seed yield components and geographical factors. Yield components such as spikelets per inflorescence, TSW and awn length showed a negative relationship with latitude. Awn length and seed set (%) exhibited a positive relationship with longitude. Awn length and TSW exhibited a positive correlation with altitude. Interestingly, other study has found negative correlations between seed mass and geographical factors, such as latitude and longitude, in several species [40]. These findings indicated that geographical factors have multi-lateral impacts and complex interactions with seed yield and components.
It is thus noteworthy that although recent studies attempted to show the relationship between geographical factors and variation in seed yield, studies on the interactions between awn length and geographical factors and their effects on seed yield are scarce. The observation that awn length was negatively correlated with latitude and longitude but positively correlated with altitude (Table 4) reflected that awn length varies with environmental variables across locations. A previous study has obtained a negative correlation between awn length and geographical conditions, such as latitude and altitude [31]. Collectively, the majority of correlations between geographical factors and seed traits observed here were not significant but the observed variation in seed traits across locations indicated that seed yield in Siberian wildrye was impacted by interactions between geographical factors and seed yield components.

3.3. The Impact of Seed Traits on Seed Dispersal Distance

Seed dispersal is critical for plant establishment and survival, especially in wild conditions. This process helps seeds to reach suitable conditions for their germination and development [22]. Recently, several studies have reported the potential relationship between long awns and seed dispersal, in which long awns triggered seed dispersal and thus propelled the seeds into the ground [16,21]. However, only a few studies evaluated the impact of awn length on seed dispersal distance. Li et al. (2015) [27] reported a weak positive relationship between awn length and seed dispersal distance in Stipa pupurea. In the current study, awn length exhibited a positive relationship with seed dispersal distance across Siberian wildrye populations, although this interaction was not statistically different (Table 7). This indicated that awn length interacts with traits affecting seed dispersal in Siberian wildrye. Besides, some studies have demonstrated that environmental factors, such as wind, may affect seed dispersal under the aid of seed appendages, such as awns [23,41], which implies that awns may affect seed dispersal, especially under wild conditions. In our study, seed dispersal distance showed a negative correlation with seed length, indicating that longer seeds are not easily transported by seed dispersal agents. Notably, TSW showed a large positive association with seed dispersal distance (Table 8). This illustrates how larger seed shortens seed dispersal distance, despite being easily shattered. It also explains how the dispersal units of longer and larger seeds are more easily buried into the soil but not easily dispersed. Collectively, these observations suggest that seed dispersal distance may be controlled by several interacting seed traits.

3.4. The Impact of Seed Traits on Germination Indices

Seed germination can be evaluated by many indices, such as germination percentage, germination index, germination duration and germination delay [42]. Testing methods, seed traits, species, genotypes and environmental conditions are important factors influencing seed germination [20]. Seed germination trend is undoubtedly connected with seed traits, such as seed size, rigidity, maturity and presence of seed appendages, such as awns, wings and hairs [33,34]. Johnson and Baruch [16] reported that long awns could improve seed germination and growth, especially under natural growing conditions. Other study indicated the rapid emergence of awned seeds than awnless seeds may be due to their high carbohydrates reserves [25]. A laboratory study reported a negative correlation between awn length and seed germination rate in Stipa pupurea [31]. Our analyses showed a significant negative relationship between awn length and germination percentage among Siberian wildrye populations (Table 7). Since seed traits exhibited high variation among populations (Table 2), our study observed adverse interactions between seed traits and germination indices (Table 7). Given studies investigating the role of awns on seed germination have found inconsistent results, awn length-seed germination interaction remains unclear. Thus, future studies should investigate the interaction between awn features and germination traits under field and greenhouse conditions.

4. Material and Methods
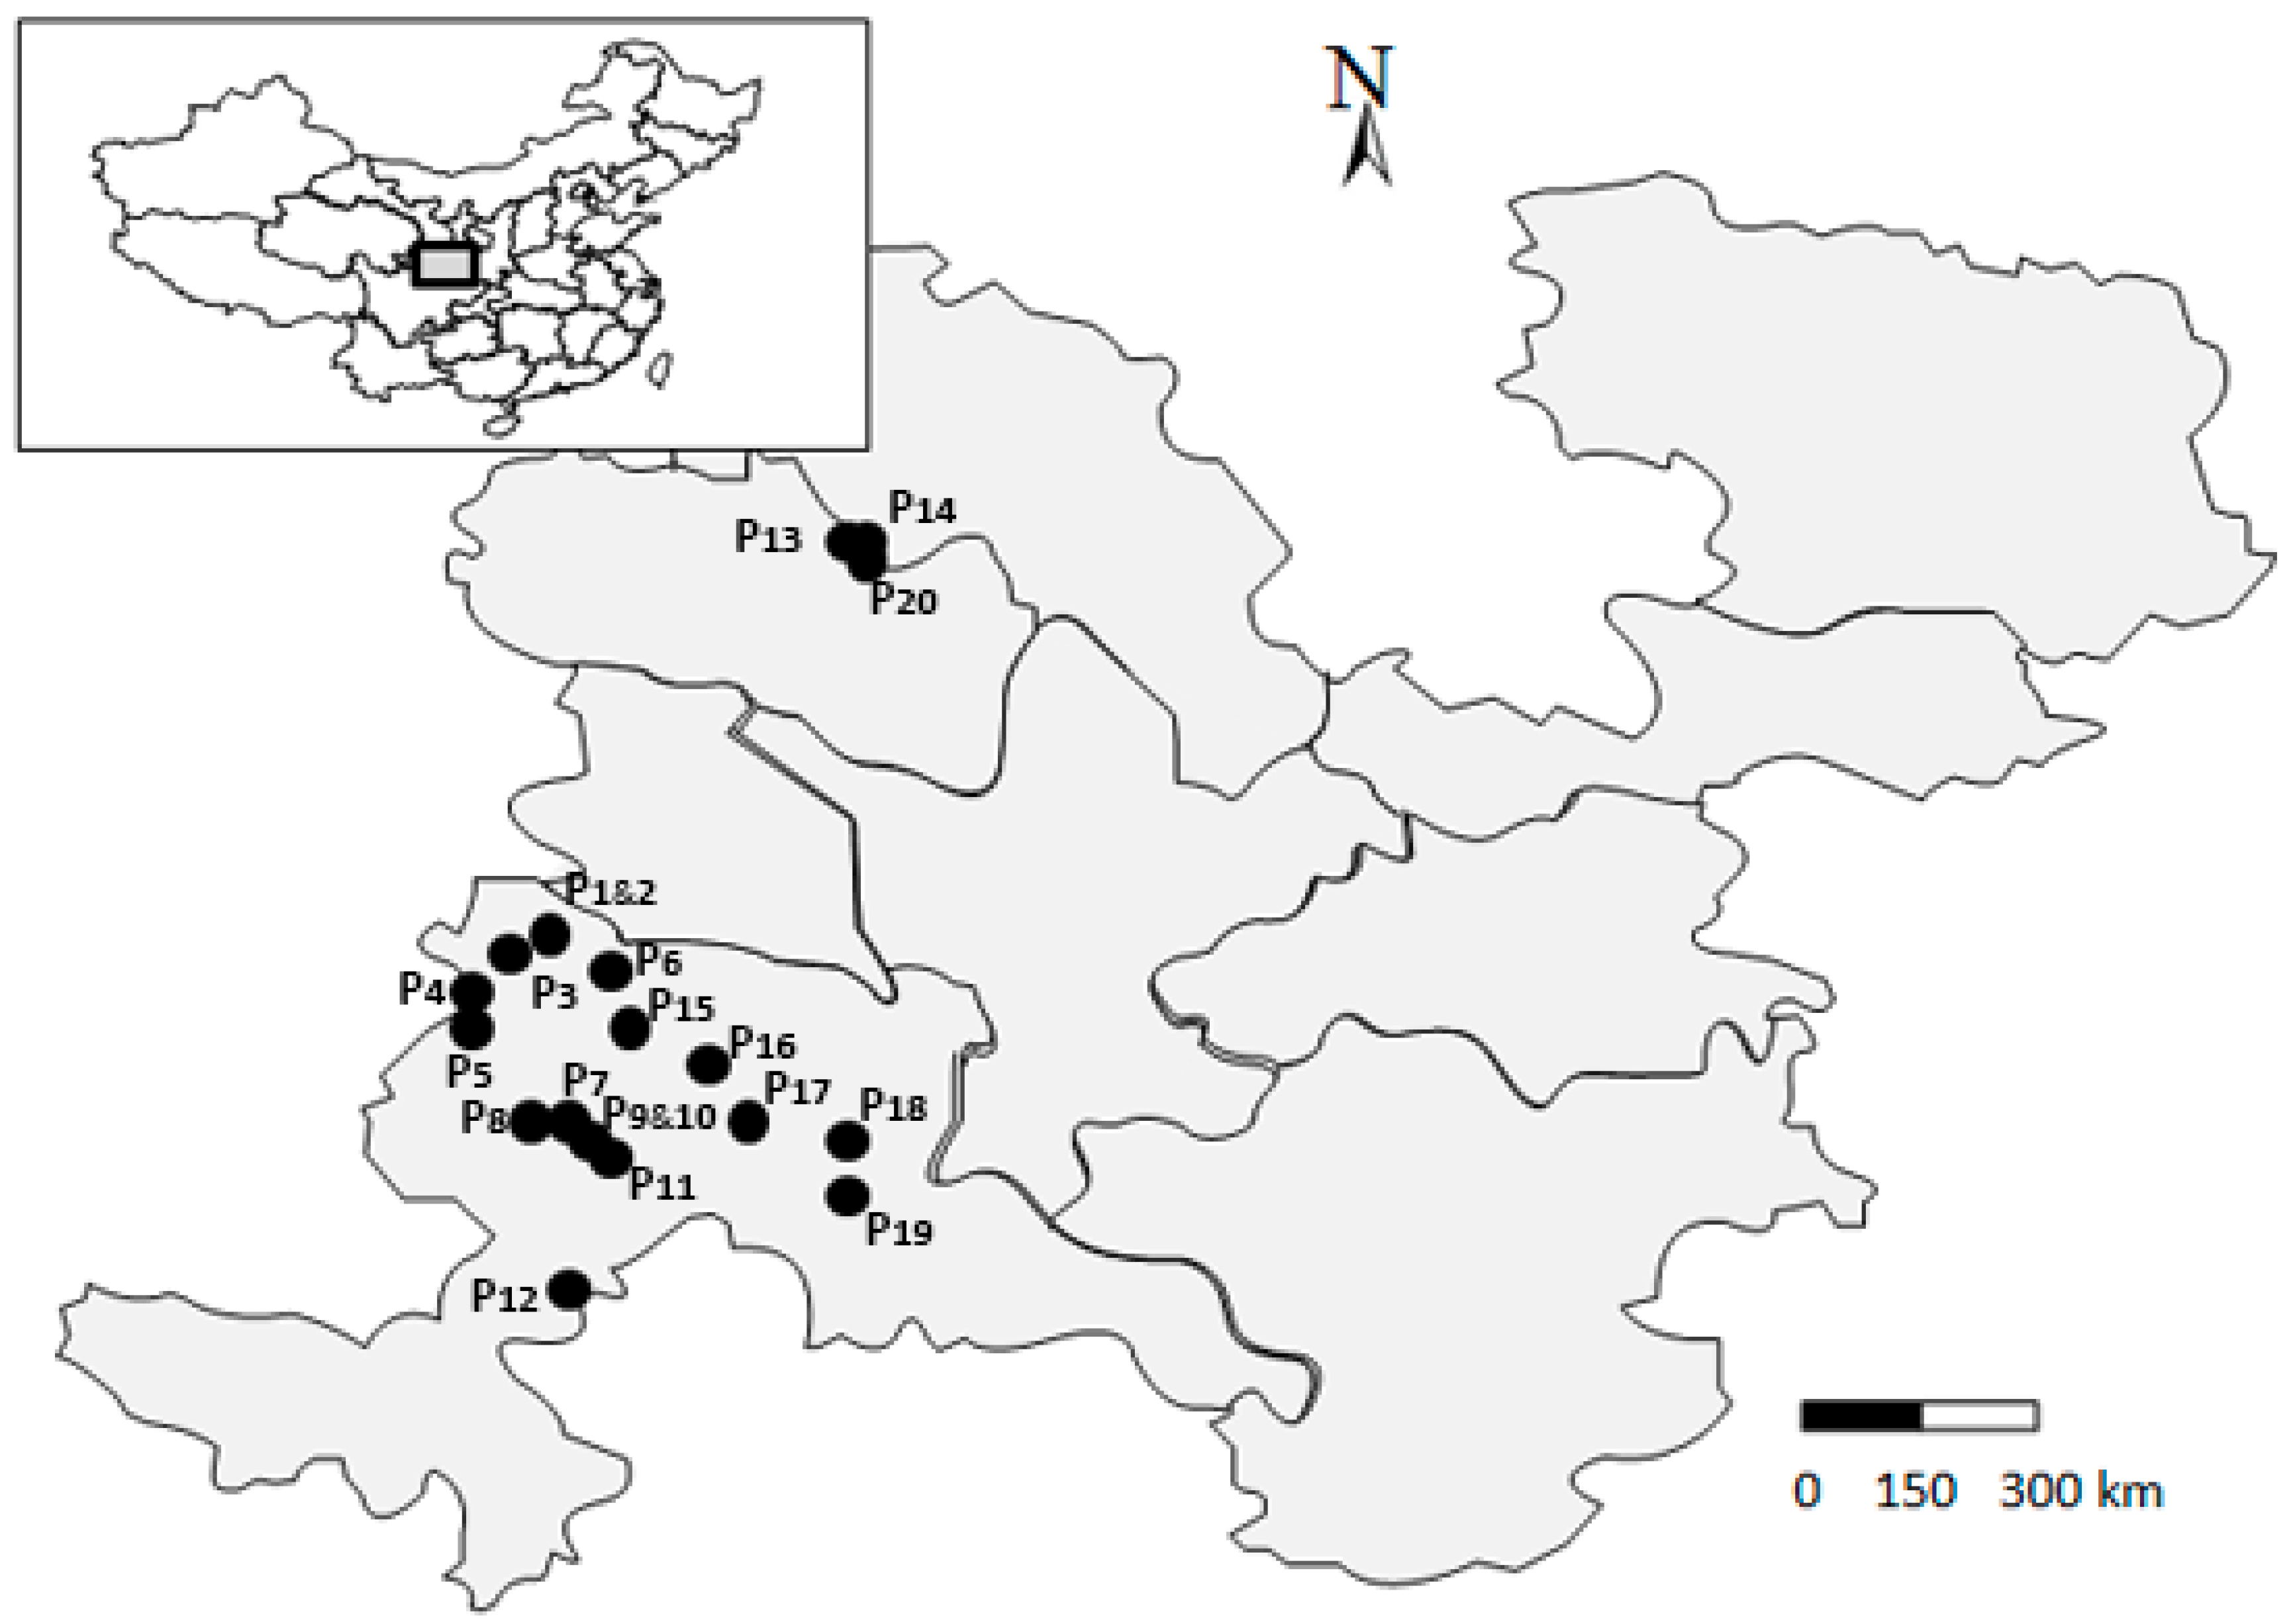
4.1. Study Area

Seeds of 20 Siberian wildrye populations were collected from 18 different sites in South Gansu province, China (Figure 3). The collection sites were located across from 35.22°N to 36.96°N in latitude, from 102.82°E to 103.15°E in longitude and from 2380 m to 3380 m in altitude and all seed samples were collected between August and September in 2018 based on a population-based sampling method [43]. Geo-coordinates (latitude, longitude and altitude) were recorded using a Global Positioning System (GPS) for each population (Table 9).

4.2. Sampling and Measurement

4.2.1. Seed Yield Measurement

In the early of August, when seeds matured, a total of 10 plants of each population were randomly selected and the heads of each plant were carefully hand-cut. Seed samples were taken from the center of each plot to avoid border effects. Because of serious seed shattering reported in this species [1], seeds were harvested when the seed moisture content was approximately 45% [44]. Seeds of each plant were air-dried, carefully threshed, cleaned, weighed and stored in paper bags at 20 °C and 15% relative humidity before subjected to seed yield evaluation and other seed measurements. Seed yield per plant (SYP) measurement and other laboratory analyses were carried out when the seed moisture content was about 10%.

4.2.2. Evaluation of Awn Length and Seed Yield Components

A total of 20 random inflorescences of each individual plant of each population were selected to obtain awn length and seed traits measurement. Spikelets per inflorescence, florets per spikelet, seed setting rate and seeds per inflorescence were determined for each plant. Seed set (%) was determined as the percentage of florets that have filled seeds [2]. For awn length, seed length and seed width, seeds were measured using seeds sampled in the basal, central and distal spikelets; thirty random seeds were chosen in each sample. These seeds were scanned by Epson Perfection V700 Scanner (Seiko Epson Corp., Nagano, Japan) and the images were analyzed using Image J software [45]. To obtain thousand-seed weight (TSW), thirty random inflorescences from each plant were selected and carefully threshed. Three thousand-seed samples from basal, central and distal spikelets were counted and weighed.

4.3. Seed Dispersal Distance Measurement

To measure the seed dispersal distance, we analyzed seed flight distance under stable wind speed generated by an electric fan. A total of 20 random spikes were selected in each individual plant of each population; three samples each composed with thirty dry and filled seeds were randomly selected from basal, central and distal spikelets of each spike. The seeds were identically released at a height of 20 cm above the ground in front of the stable wind speed (4.8 m/s) generated by an electric fan. Prior to the experiment, the fan was tested for stability and accuracy and a wind speed meter was used to determine the speed of the wind generated by the fan. The horizontal distance that the seeds moved until they reached the ground was recorded [31].

4.4. Seed Germination Test

To investigate the relationship between seed traits and germination performance, we performed germination test in climate control chambers in Lanzhou University, Gansu, China, from 15 October 2018 to 15 November 2018. Seeds were sterilized for 5 min in 1% NaClO (w/v), washed 5 times in sterile distilled water and then allowed to dry on filter paper. The sterilized seeds were germinated in plastic boxes containing moistened double layer of blotter paper at 25 °C, 85% relative humidity and a photoperiod of 12 h light—12 h dark. The replicates of fifty seeds chosen from basal, central and distal spikelets were grown in each plastic box. To prevent desiccation, distilled water was daily added to the plastic boxes. Seeds were considered germinated when the seminal root was about 1 mm long and visible. The germinated seeds were noted daily for 30 days. The germination percentage, germination index, germination duration and germination delay were estimated as previously described by Li et al. [31].

4.5. Statistical Analyses

Statistical analyses of seed yield and its components, germination indices and seed dispersal were performed from the data that were first checked for normality and homogeneity of variances and that were log-normalized when necessary. Data were then subjected to analysis of variance (ANOVA) and the significant differences between means were determined by Tukey’s Honest Significant Difference (HSD) test at p < 0.05 level. To analyze the variability of seed yield and components among Siberian wildrye populations, a heatmap was generated with Heatmap Illustrator (HemI, version 1.0.3.7) software. The visualized color matrix was constructed, in which lines and columns represented populations and seed traits, respectively. The average linkage method and the similarity metric with Pearson distance were used to carry out the hierarchical cluster analysis [46]. Principal component analysis (PCA) and correlation analyses were performed. The correlation coefficients (rxy) between awn length and seed yield and components, seed traits and seed dispersal and germination were analyzed with Pearson’s regression analysis (n = 200, that is, total observations of each trait which obtained from 10 plants of each of 20 Siberian wildrye populations). Principal component analysis was performed with the first three principal components, accounting a large amount of total variance retained for further interpretation.All statistical analyses were conducted using SPSS 25.0 software (IBM, Somers, NY, USA).

5. Conclusions

Our study uncovered the relationship between awn length and seed yield and components, seed dispersal and seed germination. Notably, our results showed an increase in awn length leads to a decrease in seeds per floret. Despite this drop off in seed number, awn length contributed to increment in seed yield per plant through larger seed size. The practical implication of these findings is that awns should be targeted for enhancing seed yield in grasses. Despite variation in the relationships between seed traits and seed germination indices, our analyses showed a significant negative correlation between awn length and germination percentage. Awn length also tended to decrease germination duration. These observations indicate that awn length may affect germination indices in grasses. Furthermore, our results suggested a possible link between seed traits and seed dispersal distance. Collectively, there are several factors coupled with plant emergence, development and performance and the present data can only provide information on the impact of seed traits variation on seed yield and their role in seed dispersal and germination. Despite certain limitations, these results provide comprehensive insights to breeding and agronomic programs targeting to maintain seed yield and they add useful scientific information for future seed dispersal and germination studies. Future studies should focus on the interactions between awn length, genetics and environment and their potential impacts on population dynamics and seed yields in grasses.

Author Contributions

F.N. and W.X. conceived the idea and designed the study. W.X., J.Z., Z.Z., N.W. and J.Y. managed and collected research materials. F.N. and B.X. carried out the experiments and analyzed the data. F.N. and W.X. wrote the manuscript. All the authors revised the manuscript.

Funding

This research was funded by National Key Research and Development Project (SQ2019YFC050025-02), Chinese National Natural Science Foundation (No. 31971751), and the Fundamental Research Funds for the Central Universities (LZUJBKY-2019-37).

Acknowledgments

The authors thank the reviewers for their insightful comments on an earlier version of the paper.

Conflicts of Interest

The authors declare no conflict of interest.

References

  1. Zhang, Z.-Y.; Xie, W.-G.; Zhang, J.-C.; Zhao, X.-D.; Zhao, Y.-Q.; Wang, Y.-R. Phenotype-and SSR-Based Estimates of Genetic Variation between and within Two Important Elymus Species in Western and Northern China. Genes 2018, 9, 147. [Google Scholar] [CrossRef] [PubMed]
  2. Wang, M.-Y.; Hou, L.-Y.; Zhu, Y.-Q.; Zhang, Q.; Wang, H.; Xia, F.-S.; Chen, L.-L.; Mao, P.-S.; Hannaway, D.B. Siberian wildrye seed yield limited by assimilate source. Field Crop. Res. 2018, 218, 18–23. [Google Scholar] [CrossRef]
  3. Barkworth, M.E.; Campbell, J.J.N.; Salomon, B. Elymus. In Flora of North America North of Mexico; Flora of North America Editorial Committee, Ed.; Oxford University Press: New York, NY, USA, 2007; Volume 24, pp. 288–342. [Google Scholar]
  4. Yuo, T.; Yamashita, Y.; Kanamori, H.; Matsumoto, T.; Lundqvist, U.; Sato, K.; Ichii, M.; Jobling, S.A.; Taketa, S. A Short Internodes (SHI) family transcription factor gene regulates awn elongation and pistil morphology in barley. J. Exp. Bot. 2012, 63, 5223–5232. [Google Scholar] [CrossRef] [PubMed]
  5. Xie, W.-G.; Zhang, J.-C.; Zhao, X.-H.; Zhang, Z.-Y.; Wang, Y.-R. Transcriptome profiling of Elymus sibiricus, an important forage grass in Qinghai-Tibet plateau, reveals novel insights into candidate genes that potentially connected to seed shattering. BMC Plant Biol. 2017, 17, 78. [Google Scholar] [CrossRef] [PubMed]
  6. Abel, S.; Gislum, R.; Boelt, B. Path and correlation analysis of perennial ryegrass (Lolium perenne L.) seed yield components. J. Agron. Crop Sci. 2017, 203, 338–344. [Google Scholar] [CrossRef]
  7. Guo, Z.; Schnurbusch, T. Variation of floret fertility in hexaploid wheat revealed by tiller removal. J. Exp. Bot. 2015, 66, 5945–5958. [Google Scholar] [CrossRef]
  8. Capstaff, N.M.; Miller, A.J. Improving the yield and nutritional quality of forage crops. Front. Plant Sci. 2018, 9, 535. [Google Scholar] [CrossRef]
  9. Rebetzke, G.; Bonnett, D.; Reynolds, M. Awns reduce grain number to increase grain size and harvestable yield in irrigated and rainfed spring wheat. J. Exp. Bot. 2016, 67, 2573–2586. [Google Scholar] [CrossRef]
  10. Wang, J.; Xie, J.; Zhang, Y.; Gao, S.; Zhang, J.; Mu, C. Methods to improve seed yield of Leymus chinensis based on nitrogen application and precipitation analysis. Agron. J. 2010, 102, 277–281. [Google Scholar] [CrossRef]
  11. Liller, C.B.; Walla, A.; Boer, M.P.; Hedley, P.; Macaulay, M.; Effgen, S.; von Korff, M.; van Esse, G.W.; Koornneef, M. Fine mapping of a major QTL for awn length in barley using a multiparent mapping population. Theor. Appl. Genet. 2017, 130, 269–281. [Google Scholar] [CrossRef]
  12. Motzo, R.; Giunta, F. Awnedness affects grain yield and kernel weight in near-isogenic lines of durum wheat. Aust. J. Agric. Res. 2002, 53, 1285–1293. [Google Scholar] [CrossRef]
  13. Guo, Z.; Schnurbusch, T. Costs and benefits of awns. J. Exp. Bot. 2016, 67, 2533. [Google Scholar] [CrossRef] [PubMed]
  14. Sanchez-Bragado, R.; Molero, G.; Reynolds, M.P.; Araus, J.L. Photosynthetic contribution of the ear to grain filling in wheat: A comparison of different methodologies for evaluation. J. Exp. Bot. 2016, 67, 2787–2798. [Google Scholar] [CrossRef] [PubMed]
  15. Merah, O.; Monneveux, P. Contribution of different organs to grain filling in durum wheat under mediterranean conditions I. Contribution of post-anthesis photosynthesis and remobilization. J. Agron. Crop Sci. 2015, 201, 344–352. [Google Scholar] [CrossRef]
  16. Johnson, E.E.; Baruch, Z. Awn length variation and its effect on dispersal unit burial of Trachypogon spicatus (Poaceae). Rev. Biol. Trop. 2014, 62, 319–324. [Google Scholar] [CrossRef]
  17. Yoshioka, M.; Iehisa, J.C.; Ohno, R.; Kimura, T.; Enoki, H.; Nishimura, S.; Nasuda, S.; Takumi, S. Three dominant awnless genes in common wheat: Fine mapping, interaction and contribution to diversity in awn shape and length. PLoS ONE 2017, 12, e0176148. [Google Scholar] [CrossRef]
  18. Yang, W.; Liu, F.; Zhang, S.; An, S. Dispersal and germination syndromes of tree seeds in a seasonal evergreen monsoon rainforest on Hainan Island, China. Seed Sci. Res. 2013, 23, 41–55. [Google Scholar] [CrossRef]
  19. Thapliyal, R.C.; Phartyal, S.S. Dispersal and germination syndromes of tree seeds in a monsoonal forest in northern India. Seed Sci. Res. 2007, 15, 29–42. [Google Scholar] [CrossRef]
  20. Rajjou, L.; Duval, M.; Gallardo, K.; Catusse, J.; Bally, J.; Job, C.; Job, D. Seed germination and vigor. Annu. Rev. Plant Biol. 2012, 63, 507–533. [Google Scholar] [CrossRef]
  21. Martinez, S.A.; Godoy, J.; Huang, M.; Zhang, Z.; Carter, A.H.; Garland Campbell, K.A.; Steber, C.M. Genome-Wide Association Mapping for Tolerance to Preharvest Sprouting and Low Falling Numbers in Wheat. Front. Plant Sci. 2018, 9, 141. [Google Scholar] [CrossRef]
  22. Elbaum, R.; Zaltzman, L.; Burgert, I.; Fratzl, P. The role of wheat awns in the seed dispersal unit. Science 2007, 316, 884–886. [Google Scholar] [CrossRef] [PubMed]
  23. Jung, W.; Kim, W.; Kim, H.-Y. Self-burial mechanics of hygroscopically responsive awns. Integr. Comp. Biol. 2014, 54, 1034–1042. [Google Scholar] [CrossRef] [PubMed]
  24. Vervelde, G. The agricultural value of awns in cereals. Neth. J. Agric. Sci. 1953, 1, 2–10. [Google Scholar]
  25. Chauhan, B.S.; Johnson, D.E. Weedy Rice (Oryza sativa) I. Grain Characteristics and Growth Response to Competition of Weedy Rice Variants from Five Asian Countries. Weed Sci. 2010, 58, 374–380. [Google Scholar] [CrossRef]
  26. Singh, P.; Ibrahim, H.M.; Flury, M.; Schillinger, W.F.; Knappenberger, T. Critical water potentials for germination of wheat cultivars in the dryland Northwest USA. Seed Sci. Res. 2013, 23, 189–198. [Google Scholar] [CrossRef]
  27. Hosseini, S.M.; Poustini, K.; Siddique, K.H.; Palta, J.A. Photosynthesis of barley awns does not play a significant role in grain yield under terminal drought. Crop Pasture Sci. 2012, 63, 489–499. [Google Scholar] [CrossRef]
  28. Li, X.-J.; Wang, H.-G.; Li, H.-B.; Zhang, L.-Y.; Teng, N.-J.; Lin, Q.-Q.; Wang, J.; Kuang, T.-Y.; Li, Z.-S.; Li, B.; et al. Awns play a dominant role in carbohydrate production during the grain-filling stages in wheat (Triticum aestivum). Physiol. Plant. 2006, 127, 701–709. [Google Scholar] [CrossRef]
  29. Luo, J.-H.; Liu, H.; Zhou, T.-Y.; Gu, B.-G.; Huang, X.-H.; Shangguan, Y.-Y.; Zhu, J.-J.; Li, Y.; Zhao, Y.; Wang, Y.-C.; et al. An-1 encodes a basic helix-loop-helix protein that regulates awn development, grain size, and grain number in rice. Plant Cell 2013, 25, 3360–3376. [Google Scholar] [CrossRef]
  30. Merah, O.; Evon, P.; Monneveux, P. Participation of Green Organs to Grain Filling in Triticum turgidum var durum Grown under Mediterranean Conditions. Int. J. Mol. Sci. 2017, 19, 56. [Google Scholar] [CrossRef]
  31. Li, X.; Yin, X.; Yang, S.-H.; Yang, Y.-Q.; Qian, M.; Zhou, Y.-L.; Zhang, C.; Du, Y.; Yang, Y.-P. Variations in seed characteristics among and within Stipa purpurea populations on the Qinghai—Tibet Plateau. Botany 2015, 93, 651–662. [Google Scholar] [CrossRef]
  32. Furuta, T.; Komeda, N.; Asano, K.; Uehara, K.; Gamuyao, R.; Angeles-Shim, R.B.; Nagai, K.; Doi, K.; Wang, D.R.; Yasui, H.; et al. Convergent loss of awn in two cultivated rice species Oryza sativa and Oryza glaberrima is caused by mutations in different loci. G3 Genes Genomes Genet. 2015, 5, 2267–2274. [Google Scholar] [CrossRef]
  33. Hebblethwaite, P.D.; Ivins, J.D. Nitrogen studies in Lolium perenne grown for seed I. Level of application. Grass Forage Sci. 1977, 32, 195–204. [Google Scholar] [CrossRef]
  34. Maydup, M.L.; Antonietta, M.; Graciano, C.; Guiamet, J.J.; Tambussi, E.A. The contribution of the awns of bread wheat (Triticum aestivum L.) to grain filling: Responses to water deficit and the effects of awns on ear temperature and hydraulic conductance. Field Crop. Res. 2014, 167, 102–111. [Google Scholar] [CrossRef]
  35. Li, Z.-Q.; Lu, W.; Yang, L.; Kong, X.-H.; Deng, X.-W. Seed weight and germination behavior of the submerged plant Potamogeton pectinatus in the arid zone of northwest China. Ecol. Evol. 2015, 5, 1504–1512. [Google Scholar] [CrossRef]
  36. Assefa, Y.; Bajjalieh, N.; Archontoulis, S.; Casteel, S.; Davidson, D.; Kovács, P.; Naeve, S.; Ciampitti, I.A. Spatial Characterization of Soybean Yield and Quality (Amino Acids, Oil, and Protein) for United States. Sci. Rep. 2018, 8, 14653. [Google Scholar] [CrossRef] [Green Version]
  37. Garnier, L.K.; Dajoz, I. Evolutionary significance of awn length variation in a clonal grass of fire-prone savannas. Ecology 2001, 82, 1720–1733. [Google Scholar] [CrossRef]
  38. Steinbrecher, T.; Leubner-Metzger, G. The biomechanics of seed germination. J. Exp. Bot. 2016, 68, 765–783. [Google Scholar] [CrossRef]
  39. Fahad, S.; Bajwa, A.A.; Nazir, U.; Anjum, S.A.; Farooq, A.; Zohaib, A.; Sadia, S.; Nasim, W.; Adkins, S.; Saud, S. Crop production under drought and heat stress: Plant responses and management options. Front. Plant Sci. 2017, 8, 1147. [Google Scholar] [CrossRef] [Green Version]
  40. Liu, J.; Bai, Y.; Lamb, E.G.; Simpson, D.; Liu, G.; Wei, Y.; Wang, D.; McKenney, D.W.; Papadopol, P. Patterns of cross-continental variation in tree seed mass in the Canadian boreal forest. PLoS ONE 2013, 8, e61060. [Google Scholar] [CrossRef]
  41. Fuller, D.Q.; Allaby, R. Seed dispersal and crop domestication: Shattering, germination and seasonality in evolution under cultivation. Annu. Plant Rev. Fruit Dev. Seed Dispersal 2009, 38, 238–295. [Google Scholar]
  42. Javaid, M.M.; Florentine, S.; Ali, H.H.; Weller, S. Effect of environmental factors on the germination and emergence of Salvia verbenaca L. cultivars (verbenaca and vernalis): An invasive species in semi-arid and arid rangeland regions. PLoS ONE 2018, 13, e0194319. [Google Scholar] [CrossRef]
  43. Zhao, R.; Cheng, Z.; Lu, W.-F.; Lu, B.-R. Estimating genetic diversity and sampling strategy for a wild soybean (Glycine soja) population based on different molecular markers. Sci. Bull. 2006, 51, 1219–1227. [Google Scholar] [CrossRef]
  44. Wang, M.-Y.; Hou, L.Y.; Zhang, Q.; Yu, X.-N.; Zhao, L.; Lu, J.-X.; Mao, P.-S.; Hannaway, D.B. Influence of Row Spacing and P and N Applications on Seed Yield Components and Seed Yield of Siberian Wildrye (Elymus sibiricus L.). Crop Sci. 2017, 57, 2205–2212. [Google Scholar] [CrossRef]
  45. Schneider, C.A.; Rasband, W.S.; Eliceiri, K.W. NIH Image to ImageJ: 25 years of image analysis. Nat. Methods 2012, 9, 671. [Google Scholar] [CrossRef]
  46. Deng, W.-K.; Wang, Y.-B.; Liu, Z.-X.; Cheng, H.; Xue, Y. HemI: A toolkit for illustrating heatmaps. PLoS ONE 2014, 9, e111988. [Google Scholar] [CrossRef]
Figure 1. Heatmap and clustering analysis of 20 Siberian wildrye populations using seed traits. Names of populations are represented on the left side of the heatmap. Lines indicate populations, whereas columns represent seed traits. The color scale ranged from 0.57 to 6.16 (green to red). AL, awn length; SL, seed length; SW, seed width; TSW, thousand-seed weight; SYP, seed yield per plant; SPI, spikelets per inflorescence; SS (%), seed set percentage; SI; seeds per inflorescence; FLS, florets per spikelet.
Plants 08 00561 g001
Figure 2. Awn length of 20 Siberian wildrye populations collected in several parts of southern Gansu during 2018. Bars denote the mean values ± standard deviation.
Plants 08 00561 g002
Figure 3. Location of lands of southern Gansu where samples were collected. Dots on the map represent collection sites of Siberian wildrye populations used in the study.
Plants 08 00561 g003
Table 1. Morphological variation of awn length, seed yield components and seed yield per plant among 20 Siberian wildrye populations.
TraitsMinimumMaximumMeanSDCV (%)
AL (mm)6.3019.3912.412.7622.26
SL (mm)8.3710.489.400.697.32
SW (mm)1.511.761.620.074.42
SPI19.3427.7723.822.239.35
FLS5.806.476.100.162.55
SS (%)38.5073.0960.768.0413.24
SI55.2593.8686.7610.4111.99
TSW (g)3.054.703.890.4310.95
SYP (g)7.609.998.760.566.43
AL, awn length; SL, seed length; SW, seed width; SPI, spikelets per inflorescence; FLS, florets per spikelet; SS (%), seed set percentage; SI, seeds per inflorescence; TSW, thousand-seed weight; SD, standard deviation; CV, coefficient of variation.
Table 2. Variance analysis of awn length, seed yield per plant and yield components as affected by population and spikelet position.
Source of VariancedfALSLSWSPIFLSSS (%)SITSWSYP
Population (P)19************ns************
Spikelet position (Sp)2**ns*nsnsnsnsnsns
P × Sp38***ns**nsnsnsnsnsns
AL, awn length; SL, seed length; SW, seed width; SPI, spikelets per inflorescence; FLS, florets per spikelet; SS (%), seed set percentage; SI, seeds per inflorescence; TSW, thousand-seed weight; SYP, seed yield per plant. ns: not significant. *, ** and ***: significant at 0.05, 0.01, 0.001 probability level.
Table 3. Means and results of the ANOVA of awn length, seed yield components and seed yield per plant of 20 Siberian wildrye populations.
PopulationsAL (mm)SL (mm)SW (mm)SPIFLSSS (%)SITSW (g)SYP (g)
XH0112.05ef9.73a–e1.65a–e22.69e–h6.47a58.19b–e86.44ab4.00a–e8.96bc
XH0212.51ef9.78a–d1.70a–d25.73a–d6.16a58.07c–e92.28a4.01a–d9.50b
XH0313.33c–e10.41ab1.66a–e20.64hi6.34a53.36e72.56c4.03a–e8.25fg
XH049.43h8.61fg1.57b–e21.45g–i6.02a72.74ab90.00a3.32ef7.96c–f
XH0510.78f–h8.97d–g1.56b–e22.25f–h5.88a71.24a–c92.71a3.51c–f8.67b–e
LQ0113.00ef8.37g1.59a–e26.83a–c6.08a56.65de91.83a3.91b–e8.80gh
LQ0212.49ef9.00d–g1.54de21.70g–i6.14a55.06de84.80ab3.82b–e7.88bc
LQ0314.20cd8.47fg1.65a–e27.26ab6.16a55.83de93.19a4.12a–d9.13b–d
LQ0411.98d–g9.04c–g1.55c–e24.74b–f6.16a60.87a–e92.54a3.83b–e8.82b–d
LQ0511.92d–g9.28c–g1.61a–e24.61b–f5.84a64.39a–e92.03a3.84b–e8.91h
LQ066.30i8.62fg1.60a–e22.48f–h6.06a73.09a92.30a3.05f7.60b–d
HZ0111.37e–h8.75e–g1.67a–e25.02a–f5.80a68.34a–d93.86a4.21a–c8.85e–g
TZ0111.45e–h9.41b–f1.51e23.63d–g6.12a63.99a–e92.14a3.94b–e8.27d–g
TZ029.76gh8.87d–g1.56b–e22.28f–h6.16a66.36a–e90.14a3.37d–f8.38bc
TZ0311.70e–h10.07a–c1.59a–e24.16c–g6.10a63.11a–e91.87a3.29ef9.06bcd
ZN0115.45bc10.04a–c1.76a27.77a6.18a53.94e77.57bc4.41ab8.96bc
ZN0219.39a10.48a1.72a–c19.34i6.12a38.50f55.25d4.70a9.26b
ZN0317.20ab10.41ab1.73ab24.53b–f5.96a56.30de68.09c4.57ab9.99a
ZN0411.62e–h9.79a–d1.56b–e23.99d–g6.14a63.18a–e92.76a3.83b–e8.99bc
ZN0512.26ef9.82a–d1.69a–e25.31a–e6.02a60.90a–e92.92a3.96a–e9.22b
AL, awn length; SL, seed length; SW, seed width; SPI, spikelets per inflorescence; FLS, florets per spikelet; SS (%), seed set percentage; SI, seeds per inflorescence; TSW, thousand-seed weight; SYP, seed yield per plant. Means followed by different letters within the same column are significantly different at p < 0.05 probability level.
Table 4. Correlation coefficients among location, seed yield components and seed yield per plant among 20 Siberian wildrye populations.
TraitsLatLongAlt (m)SL (mm)SW (mm)SPIFLSSS (%)SITSW (g)SYP (g)AL (mm)
SL (mm)0.047 ns−0.663 **−0.344 ns1.000
SW (mm)−0.196 ns−0.331 ns0.074 ns0.428 **1.000
SPI−0.056 ns−0.127 ns0.087 ns−0.106 ns0.111 ns1.000
FLS0.196 ns−0.135 ns−0.364 ns0.144 *0.132 ns−0.011 ns1.000
SS (%)0.121 ns0.299 ns−0.061 ns−0.369 **−0.206 **0.011 ns−0.473 **1.000
SI0.167 ns0.403 ns−0.076 ns−0.447 **−0.278 **0.312 **−0.062 ns0.519 **1.000
TSW (g)−0.182 ns−0.385 ns0.041 ns0.466 **0.604 **0.094 ns0.059 ns−0.418 **−0.493 **1.000
SYP (g)−0.128 ns−0.487 *−0.161 ns0.487 **0.448 **0.371 **−0.025 ns−0.231 **−0.117 ns0.526 **1.000
AL (mm)−0.189 ns−0.400 ns0.094 ns0.474 **0.345 **0.069 ns0.054 ns−0.677 **−0.722 **0.721 **0.544 **1.000
SL, seed length; SW, seed width; SPI, spikelets per inflorescence; FLS, florets per spikelet; SS (%), seed set percentage; SI, seeds per inflorescence; TSW, thousand-seed weight; SYP, seed yield per plant; AL, awn length; Lat, latitude; Long, longitude; Alt, altitude. ns Non-significant; * p < 0.05; ** p < 0.01.
Table 5. The first three principal components of awn length, yield components and seed yield per plant by analyses across 20 populations of Siberian wildrye.
EigenanalysisCharacteristicPrincipal components
PC1PC2PC3
Variation explainedEigenvalue3.8141.5541.170
Contribution rate (%)42.37917.27012.999
Cumulative rate (%)42.37959.64872.648
EigenvectorsTraits
AL (mm)0.886−0.059−0.099
TSW (g)0.8320.169−0.134
SL0.706−0.031−0.113
SI−0.7020.4910.295
SS (%)−0.6960.364−0418
SYP (g)0.6410.593−0.002
SW (mm)0.6300.298−0.025
SPI0.0510.7730.399
FLS0.227−0.3310.841
AL, awn length; TSW, thousand-seed weight; SL, seed length; SI, seeds per inflorescence; SS (%), seed set percentage; SYP, seed yield per plant; SW, seed width; SPI, spikelets per inflorescence; FLS, florets per spikelet.
Table 6. Means and results of the ANOVA of seed dispersal distance and germination indices of 20 Siberian wildrye populations.
PopulationsSDD (m)GP (%)GIGDU (days)GDE (days)
XH011.33a–c90.00ab2.98ab3.80a3.00c
XH021.36a–c92.00a3.02ab4.00a3.00c
XH031.23bc85.00ab2.75a–d4.00a3.30a–c
XH041.06c95.00a2.71a–d4.30a3.00c
XH051.34a–c96.00a2.48b–d4.80a3.10bc
LQ011.23bc96.00a2.46b–d4.70a3.40a–c
LQ021.28bc96.00a2.49b–d4.90a3.20bc
LQ031.47ab94.00a2.34cd4.40a3.30a–c
LQ041.23bc90.00ab2.84a–c4.20a3.00c
LQ051.24bc86.00ab2.47b–d5.10a3.20bc
LQ061.23bc97.00a2.24d4.20a3.80a
HZ011.68a95.00a2.21d5.00a3.60ab
TZ011.30a–c90.00ab3.10a4.20a3.00c
TZ021.07c95.00a2.87a–c4.00a3.00c
TZ031.40a–c93.00a3.01ab3.80a3.20bc
ZN011.35a–c93.00a2.50b–d5.20a3.20bc
ZN021.02c78.00b2.36cd5.00a3.30a–c
ZN031.51ab87.00ab2.48b–d4.40a3.00c
ZN041.20bc86.00ab2.57a–d5.00a3.10bc
ZN051.24bc95.00a2.95ab4.70a3.00c
SDD, seed dispersal distance; GP, germination percentage; GI, germination index; GDU, germination duration; GDE, germination delay. Means followed by different letters within the same column are significantly different at p < 0.05 probability level.
Table 7. Results of correlation analyses between seed characteristics, germination indices and seed dispersal distance.
Seed TraitsGP (%)GIGDU (days)GDE (days)SDD (m)
AL (mm)−0.357 **−0.080 ns0.075 ns−0.057 ns0.059 ns
SL (mm)−0.313 **0.132 ns−0.059 ns−0.105 ns0.034 ns
SW (mm)−0.140 *−0.241 **0.050 ns0.139 *0.121 ns
TSW (g)−0.241 **−0.084 ns0.088 ns0.031 ns0.108 ns
AL, awn length, SL, seed length; SW, seed width; TSW, thousand-seed weight; GP, germination percentage; GI, germination index; GDU, germination duration; GDE, germination delay; SDD, seed dispersal distance. ns Non-significant; * p < 0.05; ** p < 0.01.
Table 8. The first three principal components of seed traits, germination indices and seed dispersal distance.
EigenanalysisCharacteristicPrincipal Components
PC1PC2PC3
Variation explainedEigenvalue2.7621.691.102
Contribution rate (%)30.68518.7812.249
Cumulative rate (%)30.68549.46661.714
EigenvectorsTraits
TSW (g)0.8580.1180.110
AL (mm)0.8030.174−0.132
SW (mm)0.717−0.0690.327
SL (mm)0.6820.396−0.043
GP (%)−0.5160.1360.479
GI−0.2760.8210.059
GDE (days)0.072−0.6440.358
GDU (days)0.168−0.605−0.390
SDD (m)0.161−0.1040.672
TSW, thousand-seed weight; AL, awn length; SW, seed width; SL, seed length; GP, germination percentage; GI, germination index; GDU, germination duration; GDE, germination delay; SDD, seed dispersal distance.
Table 9. Wildrye populations used in the study and their geographic information.
CodePopulationsLocationLatitude (N)Longitude (E)Altitude (m)
P1XH01Xiahe, Gansu, China35°13.267′102°49.067′2550
P2XH02Xiahe, Gansu, China35°13.267′102°49.067′2550
P3XH03Xiahe, Gansu, China35°12.392′102°40.479′2770
P4XH04Xiahe, Gansu, China35°11.270′102°30.313′2960
P5XH05Xiahe, Gansu, China35°04.138′102°22.895′3140
P6LQ01Lintan, Gansu, China35°06.351′102°24.655′3080
P7LQ02Lintan, Gansu, China34°35.167′102°29.535′3110
P8LQ03Lintan, Gansu, China34°33.793′102°34.437′3080
P9LQ04Lintan, Gansu, China34°32.108′102°37.887′3050
P10LQ05Lintan, Gansu, China34°32.108′102°37.887′3050
P11LQ06Lintan, Gansu, China34°29.782′102°40.725′3010
P12HZ01Hezuo, Gansu, China34°05.662′102°37.927′3380
P13TZ01Tianzhu, Gansu, China36°57.456′103°07.778′2370
P14TZ02Tianzhu, Gansu, China36°57.703′103°08.896′2430
P15TZ03Tianzhu, Gansu, China34°56.489′102°54.985′2960
P16ZN01Zhuoni, Gansu, China34°50.216′103°09.503′3200
P17ZN02Zhuoni, Gansu, China34°41.015′103°14.835′3160
P18ZN03Zhuoni, Gansu, China34°34.037′103°31.393′2530
P19ZN04Zhuoni, Gansu, China34°25.071′103°35.153′2540
P20ZN05Zhuoni, Gansu, China36°57.357′103°08.708′2380

