RNA-Seq Time Series of Vitis vinifera Bud Development Reveals Correlation of Expression Patterns with the Local Temperature Profile

 ,
,  , ,
, ,  and
and 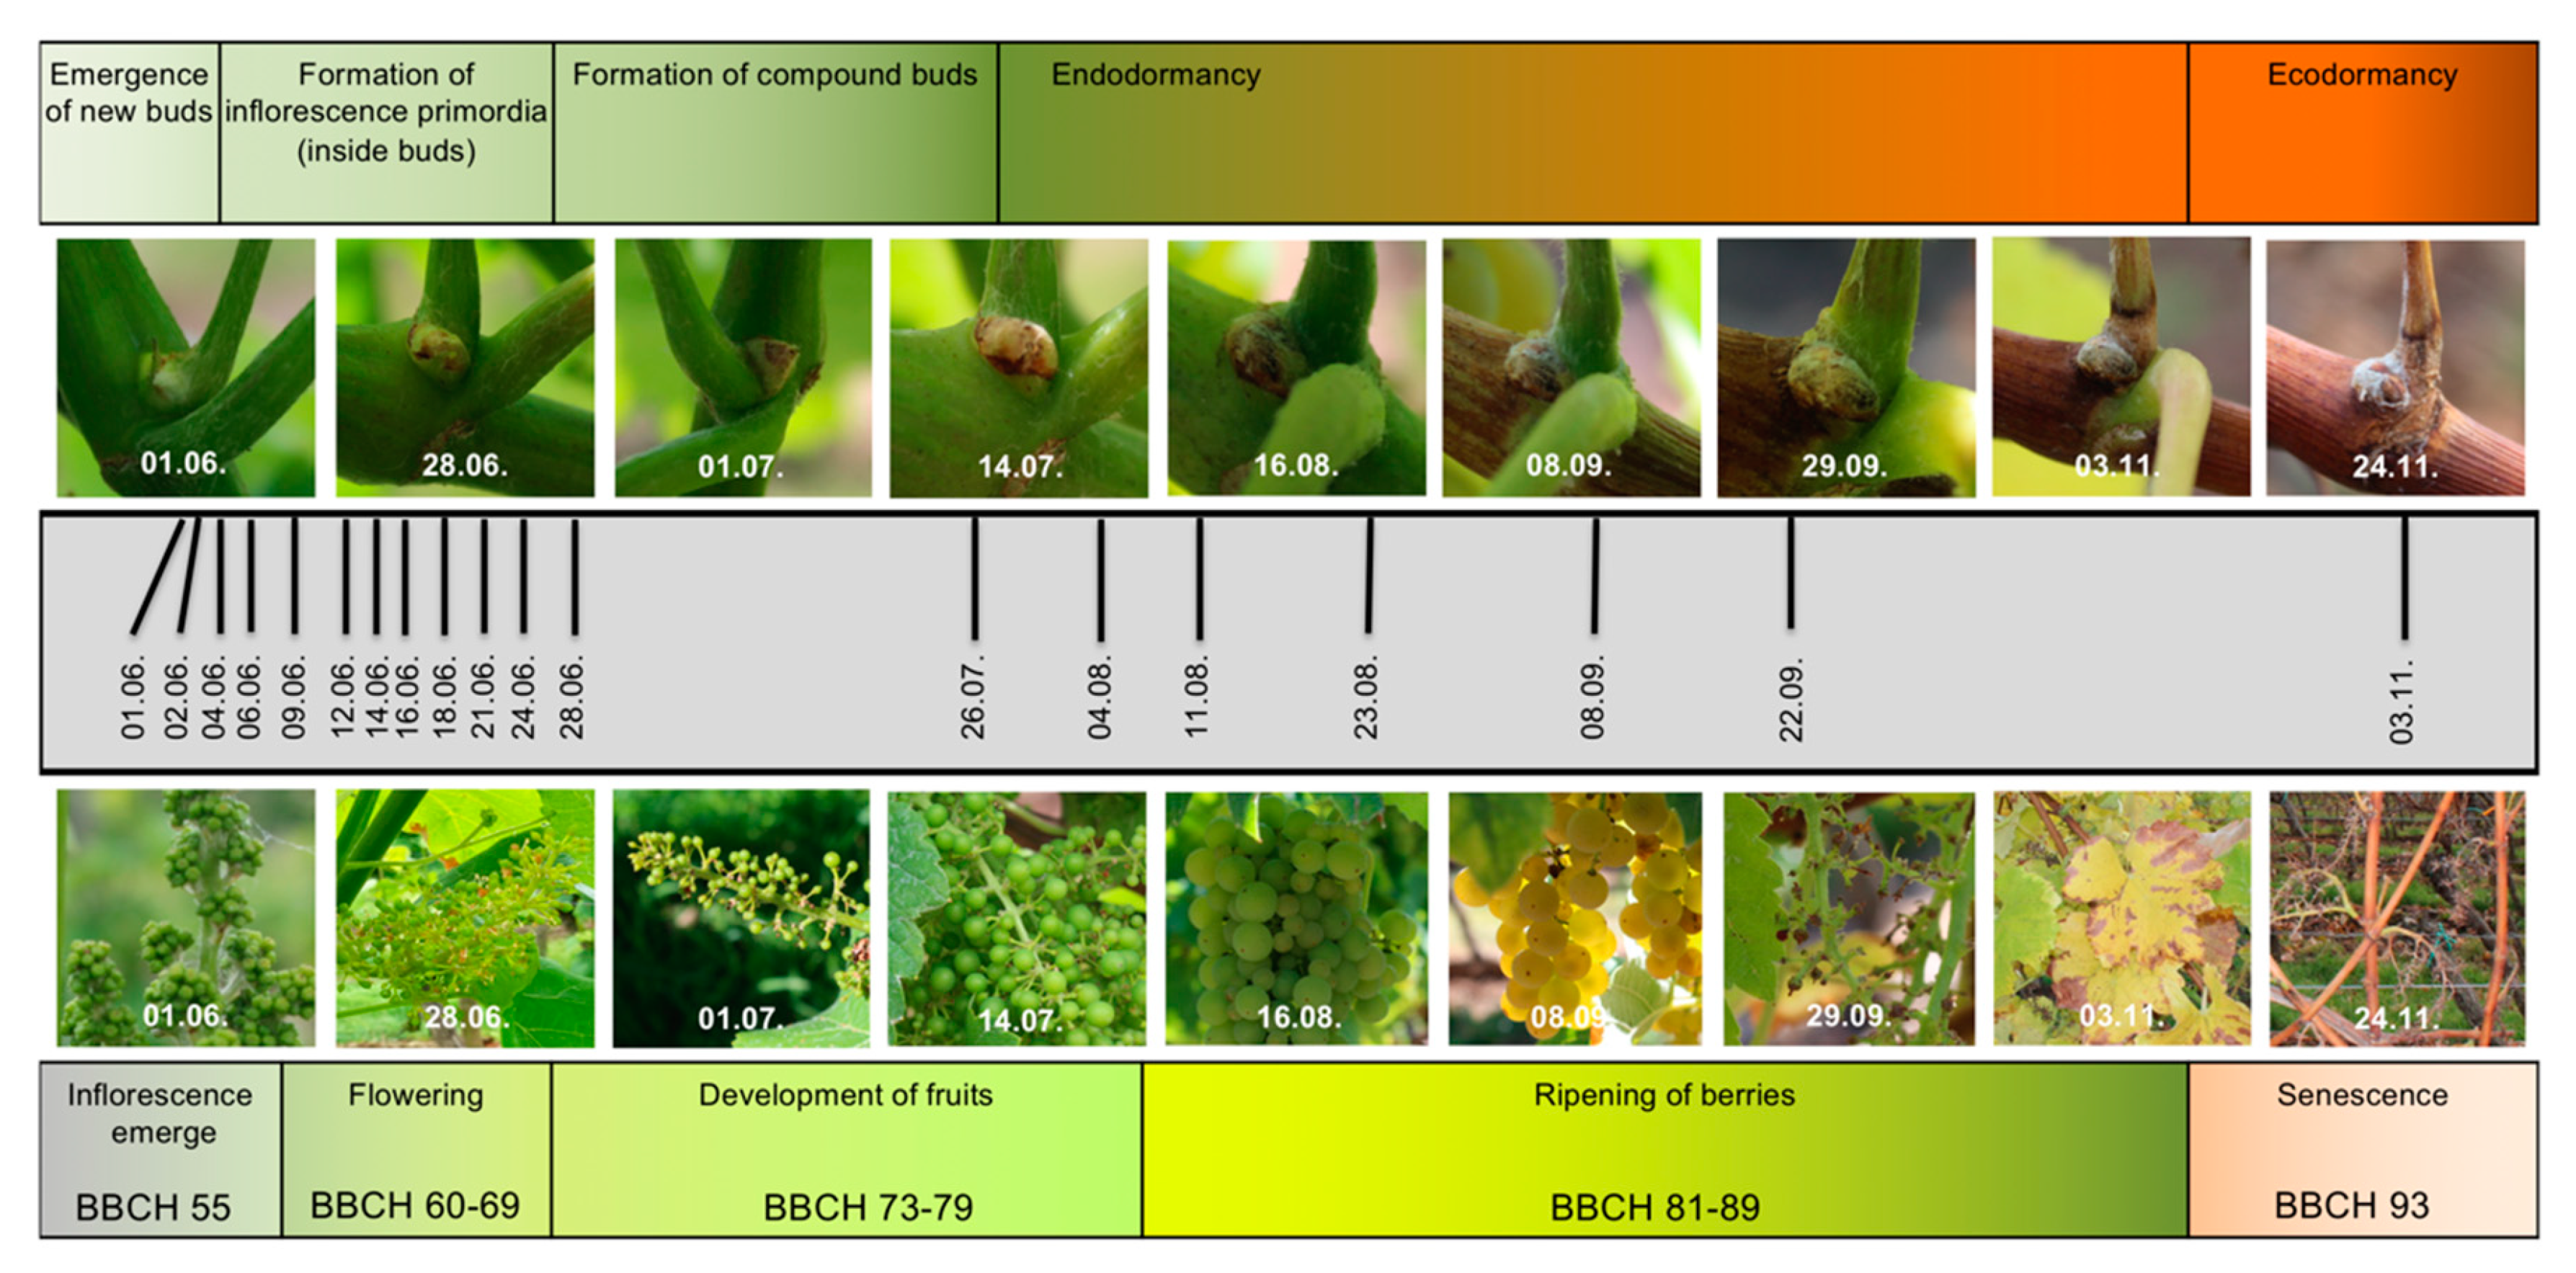
Abstract
:1. Introduction
2. Results
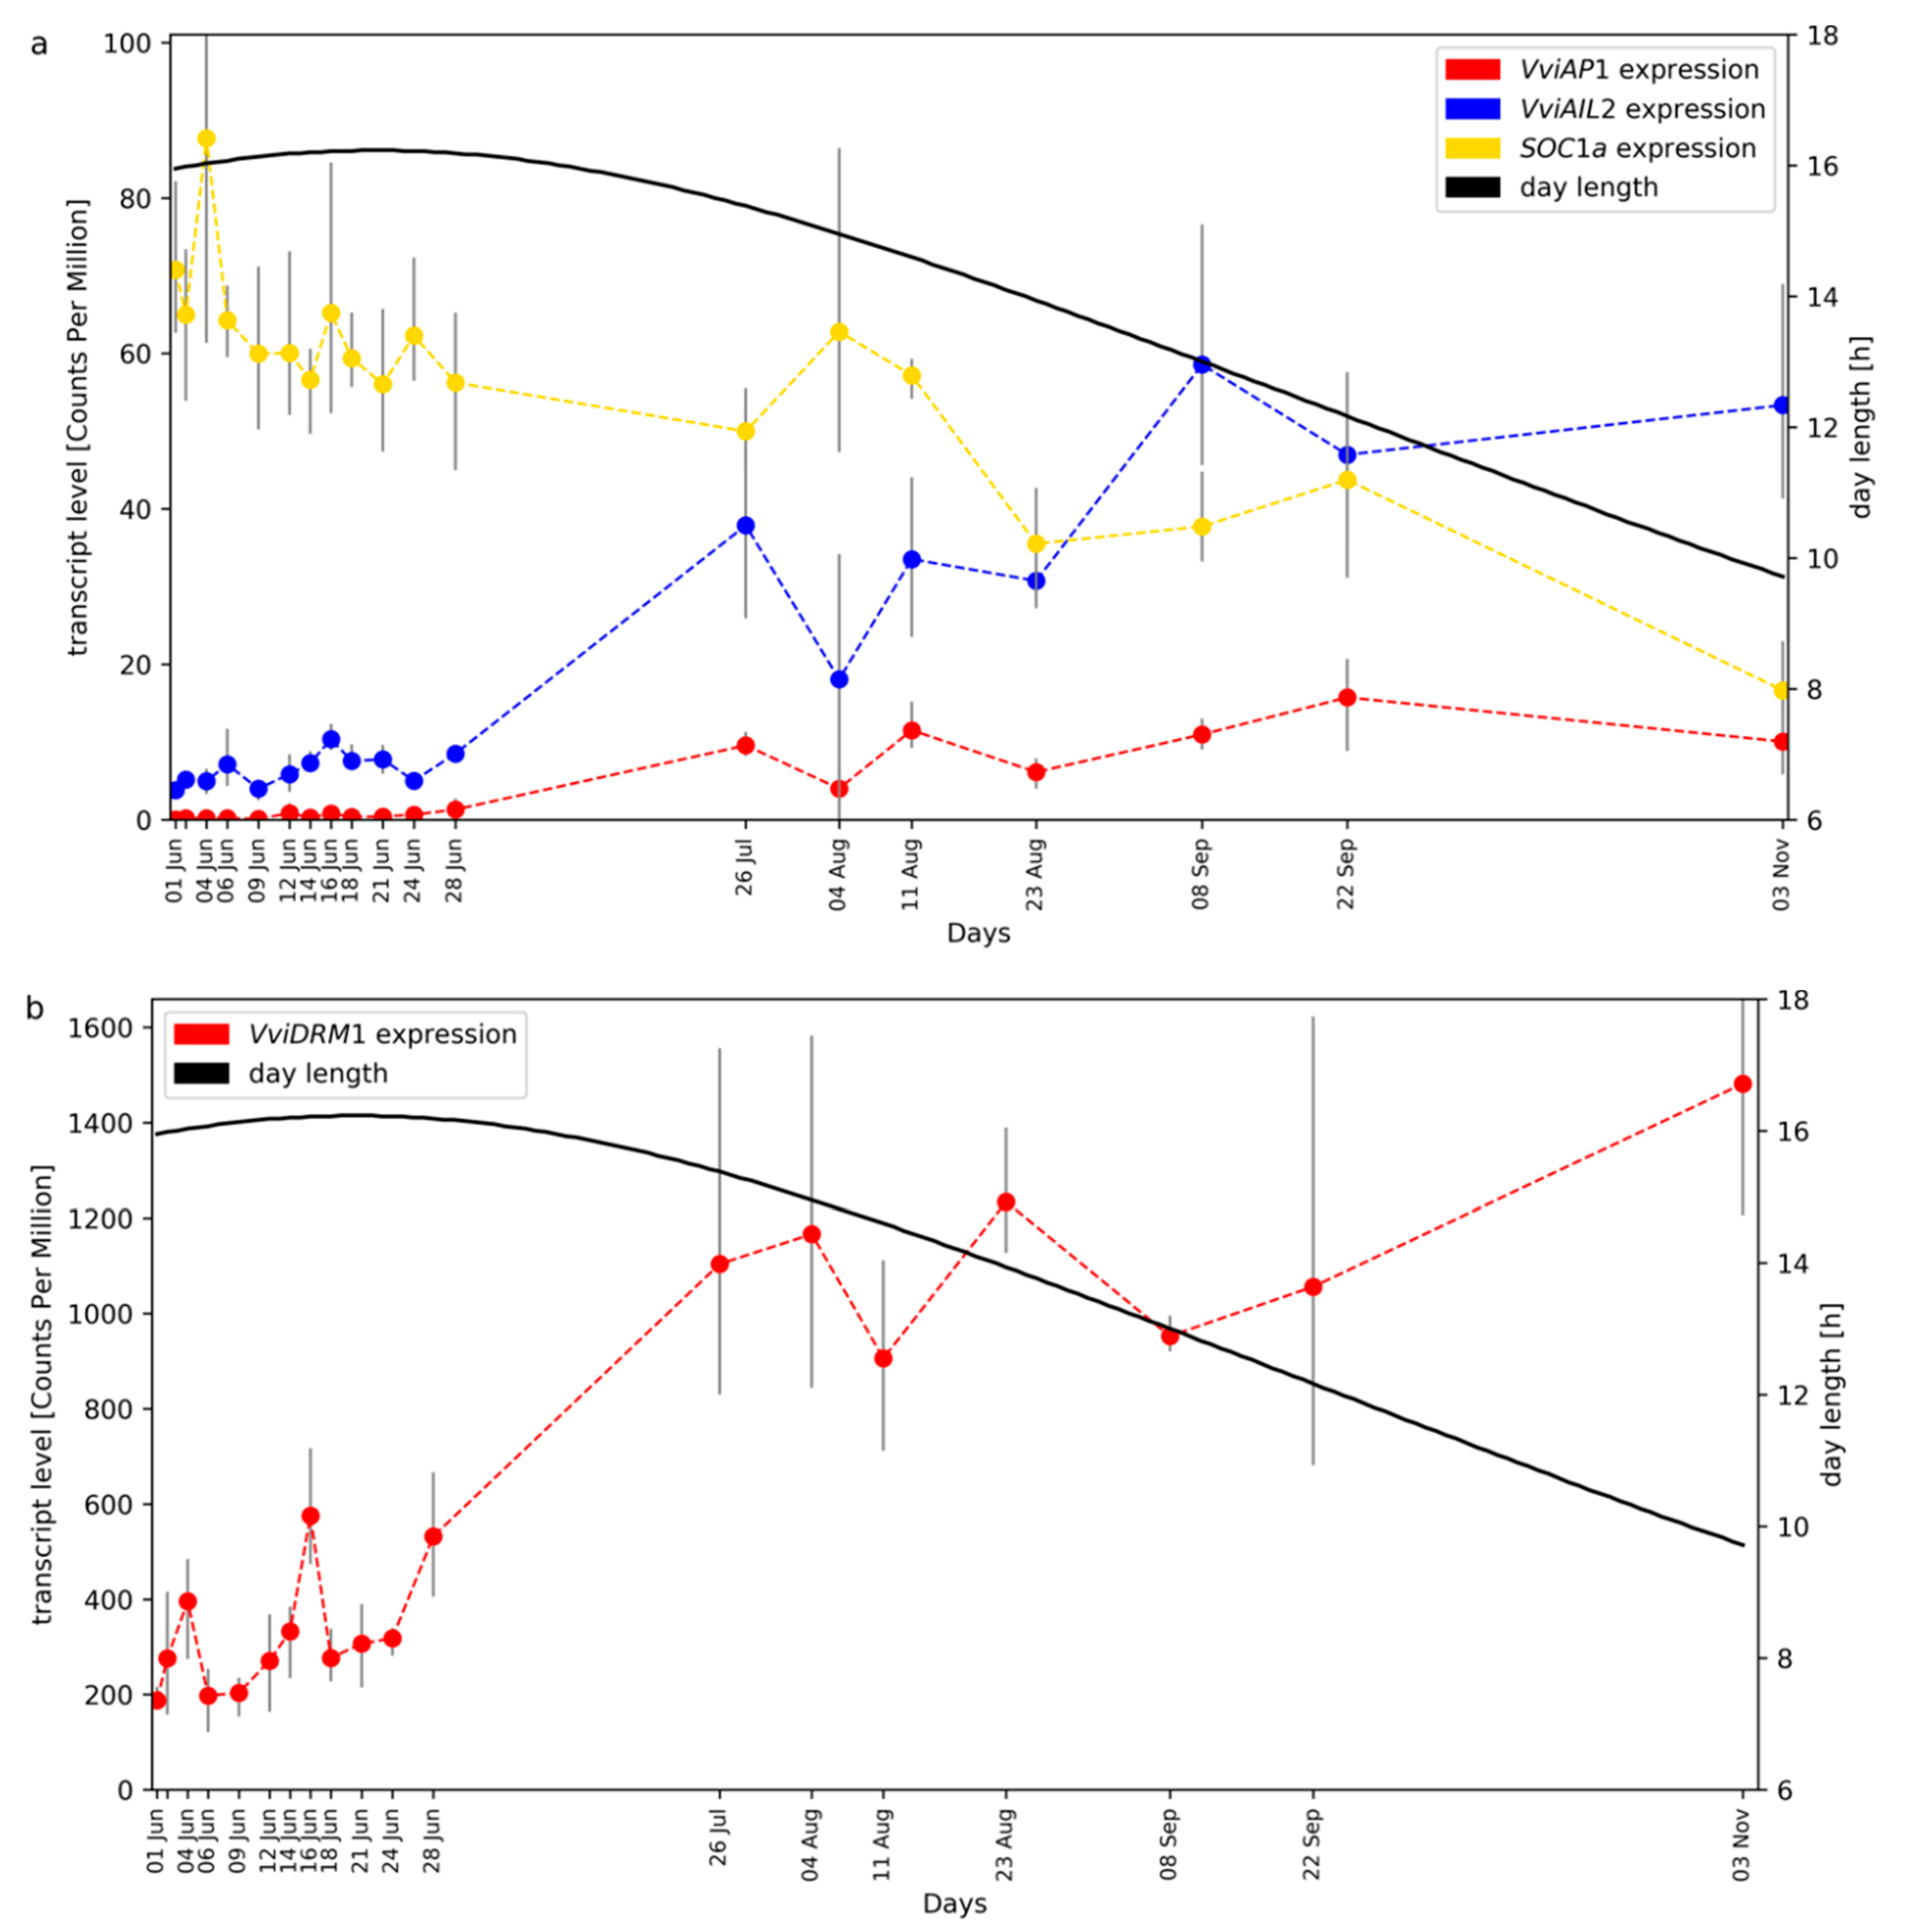
2.1. RNA-Seq Time Series of Early Bud Development and Transcript Accumulation Patterns of Selected Marker Genes
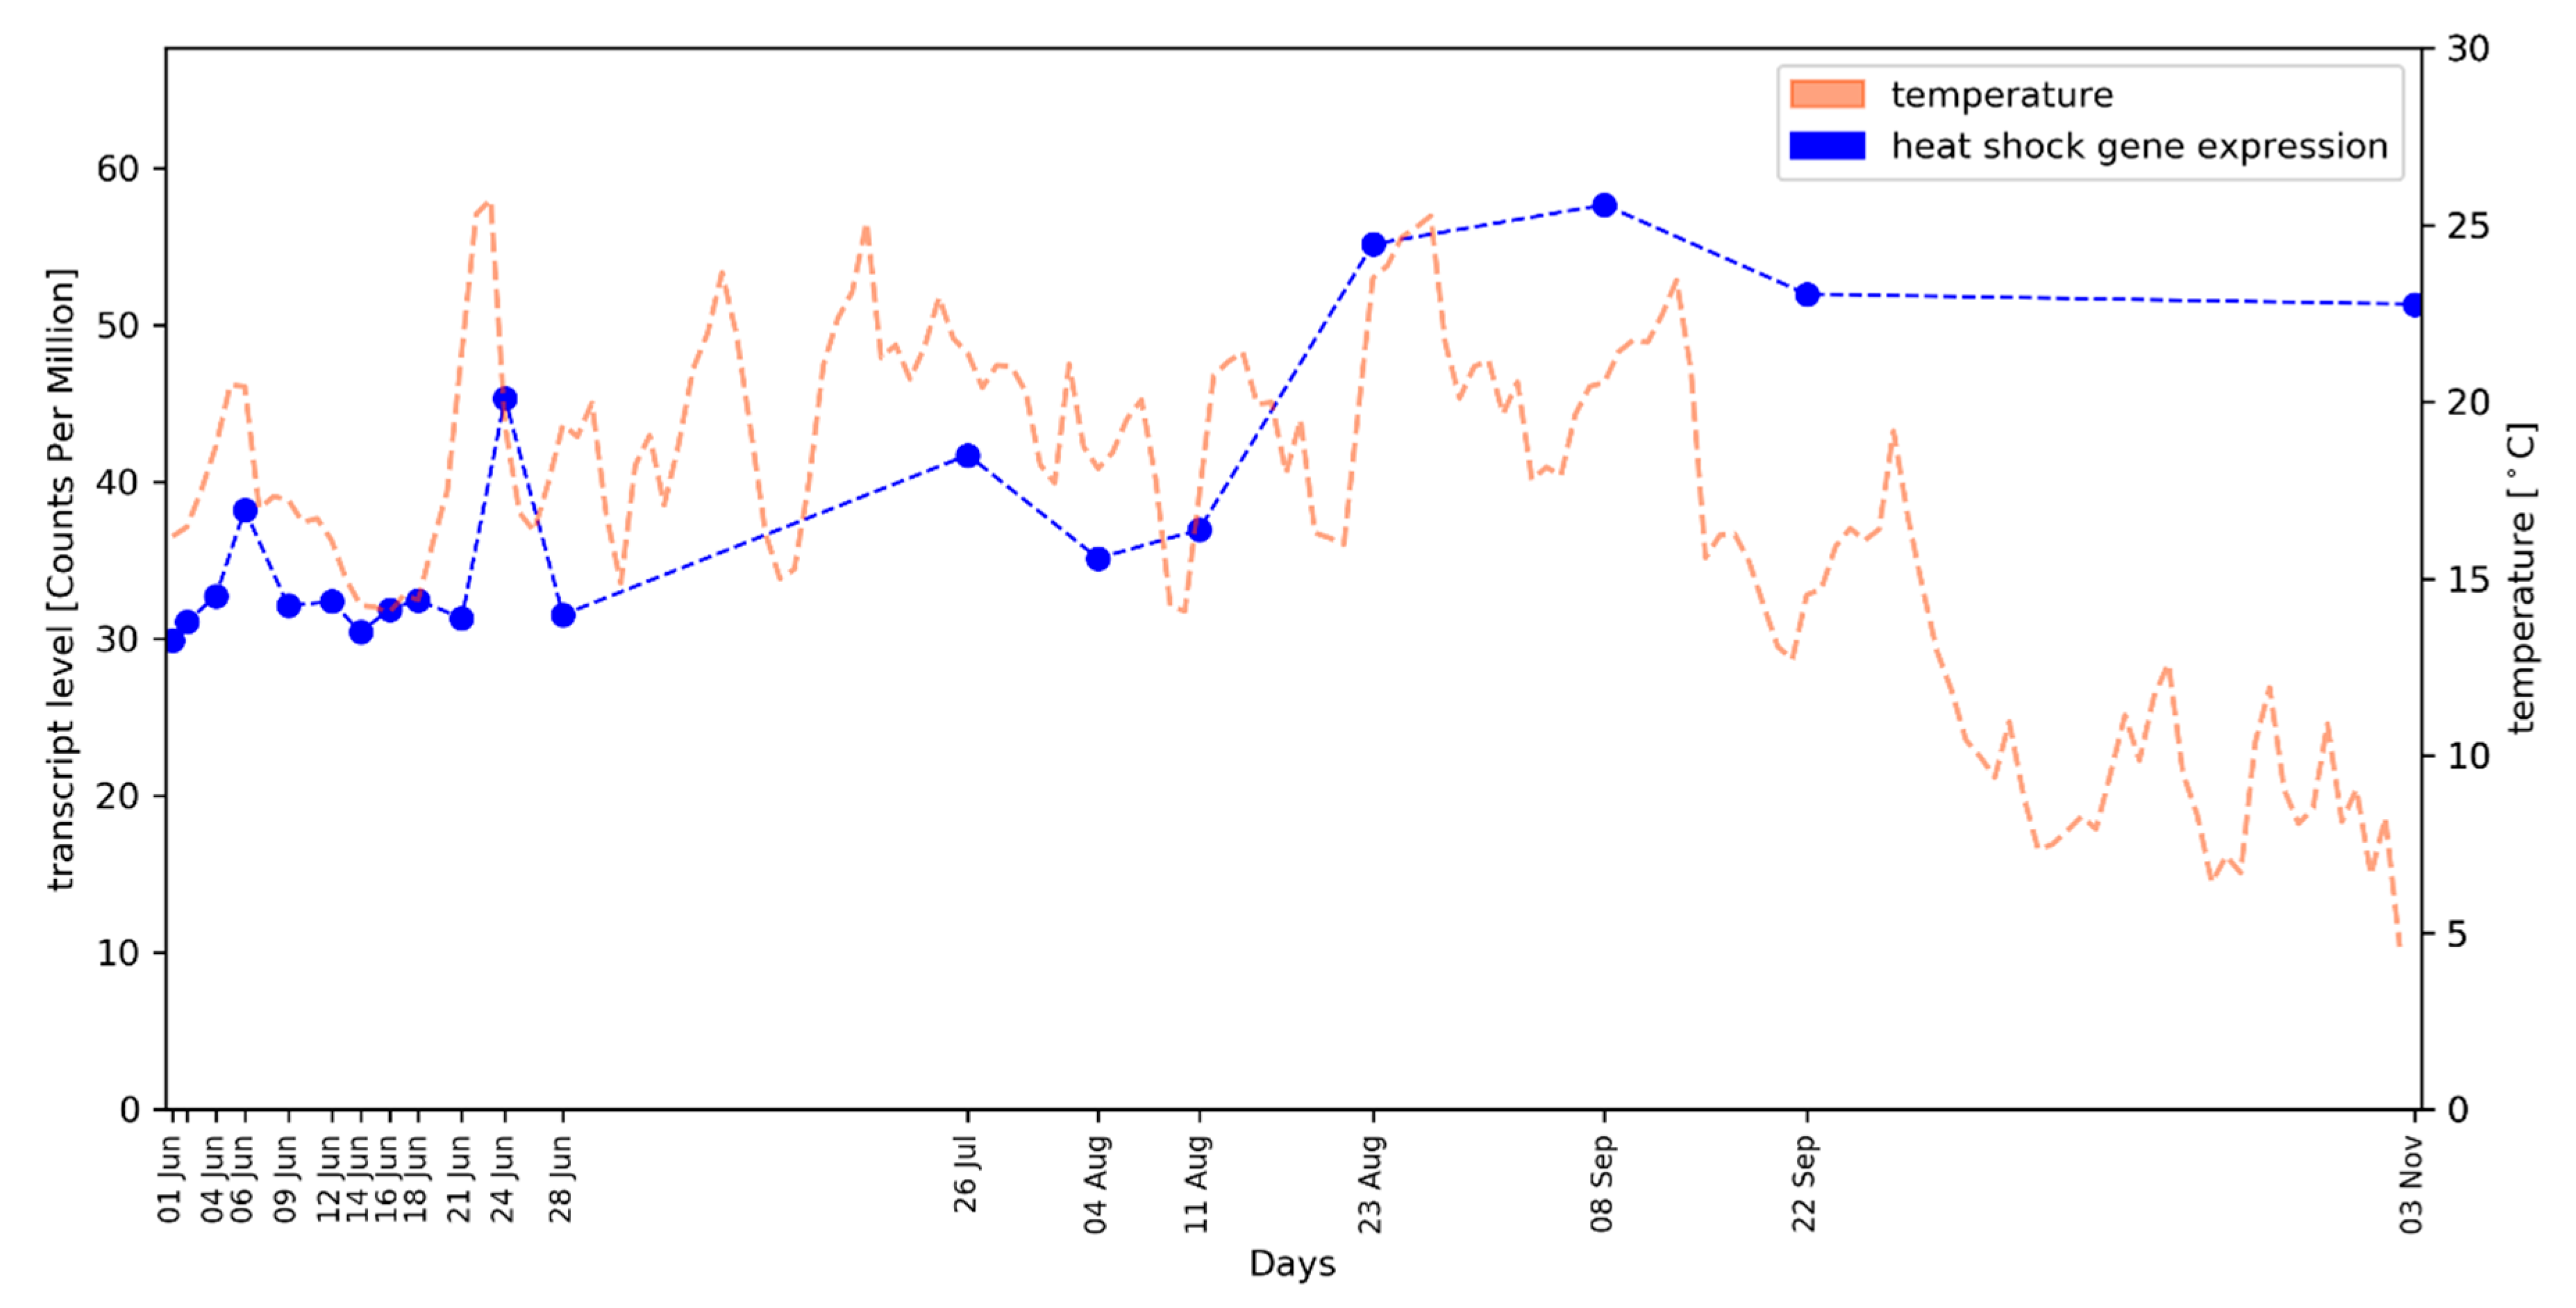
2.2. Average Gene Expression Values of HSP Genes Reflect the Local Temperature Profile
2.3. Investigation of Transcription Factor Gene Families: WKRY, MADS-Box, and R2R3-MYBs
2.4. Identification of qRT-PCR Reference Genes
3. Discussion
4. Materials and Methods
4.1. Biological Material
4.2. RNA Extraction, Library Preparation, and Sequencing
4.3. Bioinformatic Analysis of RNA-Seq Data
Supplementary Materials
Author Contributions
Funding
Acknowledgments
Conflicts of Interest
References
- Bokszczanin, K.L.; Solanaceae Pollen Thermotolerance Initial Training Network Consortium; Fragkostefanakis, S. Perspectives on deciphering mechanisms underlying plant heat stress response and thermotolerance. Front. Plant Sci. 2013, 4, 315. [Google Scholar] [CrossRef] [PubMed]
- Basu, S.; Ramegowda, V.; Kumar, A.; Pereira, A. Plant adaptation to drought stress. F1000Research 2016, 5, 1554. [Google Scholar] [CrossRef] [PubMed]
- Caretto, S.; Linsalata, V.; Colella, G.; Mita, G.; Lattanzio, V. Carbon Fluxes between Primary Metabolism and Phenolic Pathway in Plant Tissues under Stress. Int. J. Mol. Sci. 2015, 16, 26378–26394. [Google Scholar] [CrossRef] [PubMed] [Green Version]
- Yang, L.; Wen, K.S.; Ruan, X.; Zhao, Y.X.; Wei, F.; Wang, Q. Response of Plant Secondary Metabolites to Environmental Factors. Molecules 2018, 23, 762. [Google Scholar] [CrossRef] [PubMed] [Green Version]
- Carmona, M.J.; Chaïb, J.; Martínez-Zapater, J.M.; Thomas, M.R. A molecular genetic perspective of reproductive development in grapevine. J. Exp. Bot. 2008, 59, 2579–2596. [Google Scholar] [CrossRef] [PubMed] [Green Version]
- Vasconcelos, C.M.; Greven, M.; Winefield, C.S.; Trought, M.C.T.; Raw, V. The Flowering Process of Vitis vinifera: A Review. Am. J. Enol. Vitic. 2009, 60, 411–434. [Google Scholar]
- May, P. From bud to berry, with special reference to inflorescence and bunch morphology in Vitis vinifera L. Aust. J. Grape Wine Res. 2000, 6, 82–98. [Google Scholar] [CrossRef]
- Diaz-Riquelme, J.; Grimplet, J.; Martínez-Zapater, J.M.; Carmona, M.J. Transcriptome variation along bud development in grapevine (Vitis vinifera L.). BMC Plant Biol. 2012, 12, 181. [Google Scholar] [CrossRef] [Green Version]
- Tarancon, C.; Gonzalez-Grandio, E.; Oliveros, J.C.; Nicolas, M.; Cubas, P. A Conserved Carbon Starvation Response Underlies Bud Dormancy in Woody and Herbaceous Species. Front. Plant Sci. 2017, 8, 788. [Google Scholar] [CrossRef] [Green Version]
- Maurya, J.P.; Bhalerao, R.P. Photoperiod- and temperature-mediated control of growth cessation and dormancy in trees: A molecular perspective. Ann. Bot. 2017, 120, 351–360. [Google Scholar] [CrossRef]
- Rustioni, L.; Cola, G.; Fiori, S.; Failla, O.; Bacilieri, R.; Maul, E.; Eiras Dias, J.E.; Brazão, J.; Kocsis, L.; Lorenzini, F.; et al. Application of Standard Methods for the Grapevine (Vitis vinifera L.) Phenotypic Diversity Exploration: Phenological Traits. Acta Hortic. 2014, 1032, 253–260. [Google Scholar] [CrossRef]
- Delrot, S.; Grimplet, J.; Carbonell-Bejerano, P.; Schwandner, A.; Bert, P.-F.; Bavaresco, L.; Costa, L.D.; Di Gaspero, G.; Duchêne, E.; Hausmann, L.; et al. Genetic and Genomic Approaches for Adaptation of Grapevine to Climate Change. In Genomic Designing of Climate-Smart Fruit Crops; Kole, C., Ed.; Springer: Berlin/Heidelberg, Germany, 2020; pp. 157–270. [Google Scholar]
- Barnett, T.; Altschuler, M.; McDaniel, C.N.; Mascarenhas, J.P. Heat shock induced proteins in plant cells. Dev. Genet. 1980, 1, 331–340. [Google Scholar] [CrossRef]
- Feder, M.E.; Hofmann, G.E. Heat-shock proteins, molecular chaperones, and the stress response: Evolutionary and ecological physiology. Annu. Rev. Physiol. 1999, 61, 243–282. [Google Scholar] [CrossRef] [PubMed] [Green Version]
- Gupta, S.C.; Sharma, A.; Mishra, M.; Mishra, R.K.; Chowdhuri, D.K. Heat shock proteins in toxicology: How close and how far? Life Sci. 2010, 86, 377–384. [Google Scholar] [CrossRef]
- Tripp, J.; Mishra, S.K.; Scharf, K.D. Functional dissection of the cytosolic chaperone network in tomato mesophyll protoplasts. Plant Cell Environ. 2009, 32, 123–133. [Google Scholar] [CrossRef]
- Rushton, P.J.; Somssich, I.E.; Ringler, P.; Shen, Q.J. WRKY transcription factors. Trends Plant Sci. 2010, 15, 247–258. [Google Scholar] [CrossRef]
- Wang, M.; Vannozzi, A.; Wang, G.; Liang, Y.H.; Tornielli, G.B.; Zenoni, S.; Cavallini, E.; Pezzotti, M.; Cheng, Z.M. Genome and transcriptome analysis of the grapevine (Vitis vinifera L.) WRKY gene family. Hortic. Res. 2014, 1, 14016. [Google Scholar] [CrossRef] [Green Version]
- Jiang, J.; Ma, S.; Ye, N.; Jiang, M.; Cao, J.; Zhang, J. WRKY transcription factors in plant responses to stresses. J. Integr. Plant Biol. 2017, 59, 86–101. [Google Scholar] [CrossRef]
- Dubos, C.; Stracke, R.; Grotewold, E.; Weisshaar, B.; Martin, C.; Lepiniec, L. MYB transcription factors in Arabidopsis. Trends Plant Sci. 2010, 15, 573–581. [Google Scholar] [CrossRef]
- Matus, J.T.; Aquea, F.; Arce-Johnson, P. Analysis of the grape MYB R2R3 subfamily reveals expanded wine quality-related clades and conserved gene structure organization across Vitis and Arabidopsis genomes. BMC Plant Biol. 2008, 8, 83. [Google Scholar] [CrossRef] [Green Version]
- Baldoni, E.; Genga, A.; Cominelli, E. Plant MYB Transcription Factors: Their Role in Drought Response Mechanisms. Int. J. Mol. Sci. 2015, 16, 15811–15851. [Google Scholar] [CrossRef] [PubMed] [Green Version]
- Masiero, S.; Colombo, L.; Grini, P.E.; Schnittger, A.; Kater, M.M. The emerging importance of type I MADS box transcription factors for plant reproduction. Plant Cell 2011, 23, 865–872. [Google Scholar] [CrossRef] [PubMed] [Green Version]
- Horvath, D.P. Dormancy-Associated MADS-BOX Genes: A Review. In Advances in Plant Dormancy; Anderson, J.V., Ed.; Springer: Berlin/Heidelberg, Germany, 2015; pp. 137–146. [Google Scholar]
- Grimplet, J.; Martínez-Zapater, J.M.; Carmona, M.J. Structural and functional annotation of the MADS-box transcription factor family in grapevine. BMC Genom. 2016, 17, 80. [Google Scholar] [CrossRef] [PubMed] [Green Version]
- Wagner, D.; Sablowski, R.W.; Meyerowitz, E.M. Transcriptional activation of APETALA1 by LEAFY. Science 1999, 285, 582–584. [Google Scholar] [CrossRef]
- Kaufmann, K.; Wellmer, F.; Muino, J.M.; Ferrier, T.; Wuest, S.E.; Kumar, V.; Serrano-Mislata, A.; Madueno, F.; Krajewski, P.; Meyerowitz, E.M.; et al. Orchestration of floral initiation by APETALA1. Science 2010, 328, 85–89. [Google Scholar] [CrossRef] [Green Version]
- Vergara, R.; Noriega, X.; Parada, F.; Dantas, D.; Perez, F.J. Relationship between endodormancy, FLOWERING LOCUS T and cell cycle genes in Vitis vinifera. Planta 2016, 243, 411–419. [Google Scholar] [CrossRef]
- Stafstrom, J.P.; Ripley, B.D.; Devitt, M.L.; Drake, B. Dormancy-associated gene expression in pea axillary buds. Cloning and expression of PsDRM1 and PsDRM2. Planta 1998, 205, 547–552. [Google Scholar] [CrossRef]
- Zhu, Y.; Wagner, D. Plant Inflorescence Architecture: The Formation, Activity, and Fate of Axillary Meristems. Cold Spring Harb. Perspect. Biol. 2020, 12, a034652. [Google Scholar] [CrossRef]
- Quint, M.; Drost, H.G.; Gabel, A.; Ullrich, K.K.; Bönn, M.; Grosse, I. A transcriptomic hourglass in plant embryogenesis. Nature 2012, 490, 98–101. [Google Scholar] [CrossRef]
- Drost, H.G.; Bellstädt, J.; Ó’Maoiléidigh, D.S.; Silva, A.T.; Gabel, A.; Weinholdt, C.; Ryan, P.T.; Dekkers, B.J.; Bentsink, L.; Hilhorst, H.W.; et al. Post-embryonic Hourglass Patterns Mark Ontogenetic Transitions in Plant Development. Mol. Biol. Evol. 2016, 33, 1158–1163. [Google Scholar] [CrossRef] [Green Version]
- Drost, H.G.; Janitza, P.; Grosse, I.; Quint, M. Cross-kingdom comparison of the developmental hourglass. Curr. Opin. Genet. Dev. 2017, 45, 69–75. [Google Scholar] [CrossRef] [PubMed]
- Dudziak, K.; Sozoniuk, M.; Szczerba, H.; Kuzdralinski, A.; Kowalczyk, K.; Borner, A.; Nowak, M. Identification of stable reference genes for qPCR studies in common wheat (Triticum aestivum L.) seedlings under short-term drought stress. Plant Methods 2020, 16, 58. [Google Scholar] [CrossRef] [PubMed] [Green Version]
- Lee, J.; Lee, I. Regulation and function of SOC1, a flowering pathway integrator. J. Exp. Bot. 2010, 61, 2247–2254. [Google Scholar] [CrossRef] [PubMed] [Green Version]
- Carmona, M.J.; Cubas, P.; Martínez-Zapater, J.M. VFL, the grapevine FLORICAULA/LEAFY ortholog, is expressed in meristematic regions independently of their fate. Plant Physiol. 2002, 130, 68–77. [Google Scholar] [CrossRef] [PubMed] [Green Version]
- Li-Mallet, A.; Rabot, A.; Geny, L. Factors controlling inflorescence primordia formation of grapevine: Their role in latent bud fruitfulness? A review. Botany 2016, 94, 147–163. [Google Scholar] [CrossRef]
- Daminato, M.; Masiero, S.; Resentini, F.; Lovisetto, A.; Casadoro, G. Characterization of TM8, a MADS-box gene expressed in tomato flowers. BMC Plant Biol. 2014, 14, 319. [Google Scholar] [CrossRef] [Green Version]
- Bogs, J.; Jaffe, F.W.; Takos, A.M.; Walker, A.R.; Robinson, S.P. The grapevine transcription factor VvMYBPA1 regulates proanthocyanidin synthesis during fruit development. Plant Physiol. 2007, 143, 1347–1361. [Google Scholar] [CrossRef] [Green Version]
- Koyama, K.; Numata, M.; Nakajima, I.; Goto-Yamamoto, N.; Matsumura, H.; Tanaka, N. Functional characterization of a new grapevine MYB transcription factor and regulation of proanthocyanidin biosynthesis in grapes. J. Exp. Bot. 2014, 65, 4433–4449. [Google Scholar] [CrossRef] [Green Version]
- Wong, D.C.J.; Schlechter, R.; Vannozzi, A.; Holl, J.; Hmmam, I.; Bogs, J.; Tornielli, G.B.; Castellarin, S.D.; Matus, J.T. A systems-oriented analysis of the grapevine R2R3-MYB transcription factor family uncovers new insights into the regulation of stilbene accumulation. DNA Res. 2016, 23, 451–466. [Google Scholar] [CrossRef]
- Vannozzi, A.; Wong, D.C.J.; Holl, J.; Hmmam, I.; Matus, J.T.; Bogs, J.; Ziegler, T.; Dry, I.; Barcaccia, G.; Lucchin, M. Combinatorial Regulation of Stilbene Synthase Genes by WRKY and MYB Transcription Factors in Grapevine (Vitis vinifera L.). Plant Cell Physiol. 2018, 59, 1043–1059. [Google Scholar] [CrossRef]
- Parage, C.; Tavares, R.; Rety, S.; Baltenweck-Guyot, R.; Poutaraud, A.; Renault, L.; Heintz, D.; Lugan, R.; Marais, G.A.; Aubourg, S.; et al. Structural, functional, and evolutionary analysis of the unusually large stilbene synthase gene family in grapevine. Plant Physiol. 2012, 160, 1407–1419. [Google Scholar] [CrossRef] [PubMed] [Green Version]
- Yang, Y.; Zhang, L.; Chen, P.; Liang, T.; Li, X.; Liu, H. UV-B photoreceptor UVR8 interacts with MYB73/MYB77 to regulate auxin responses and lateral root development. EMBO J. 2019, 39, e101928. [Google Scholar] [CrossRef] [PubMed]
- Chen, J.; Nolan, T.M.; Ye, H.; Zhang, M.; Tong, H.; Xin, P.; Chu, J.; Chu, C.; Li, Z.; Yin, Y. Arabidopsis WRKY46, WRKY54, and WRKY70 Transcription Factors Are Involved in Brassinosteroid-Regulated Plant Growth and Drought Responses. Plant Cell 2017, 29, 1425–1439. [Google Scholar] [CrossRef] [PubMed]
- Hernandez, L.D.; Vierling, E. Expression of Low Molecular Weight Heat-Shock Proteins under Field Conditions. Plant Physiol. 1993, 101, 1209–1216. [Google Scholar] [CrossRef] [Green Version]
- Lindquist, S. The heat-shock response. Annu. Rev. Biochem. 1986, 55, 1151–1191. [Google Scholar] [CrossRef]
- Burke, J.J.; Hatfield, J.L.; Klein, R.R.; Mullet, J.E. Accumulation of heat shock proteins in field-grown cotton. Plant Physiol. 1985, 78, 394–398. [Google Scholar] [CrossRef] [Green Version]
- Hu, W.; Hu, G.; Han, B. Genome-wide survey and expression profiling of heat shock proteins and heat shock factors revealed overlapped and stress specific response under abiotic stresses in rice. Plant Sci. 2009, 176, 583–590. [Google Scholar] [CrossRef]
- Swindell, W.R.; Huebner, M.; Weber, A.P. Transcriptional profiling of Arabidopsis heat shock proteins and transcription factors reveals extensive overlap between heat and non-heat stress response pathways. BMC Genom. 2007, 8, 125. [Google Scholar] [CrossRef] [Green Version]
- Lorenz, D.H.; Eichhorn, K.W.; Bleiholder, H.; Klose, R.; Meier, U.; Weber, E. Phenological growth stages of the grapevine (Vitis vinifera L. ssp. vinifera)—Codes and descrptions according to the extended BBCH scale. Aust. J. Grape Wine Res. 1995, 1, 100–103. [Google Scholar] [CrossRef]
- Jaillon, O.; Aury, J.M.; Noel, B.; Policriti, A.; Clepet, C.; Casagrande, A.; Choisne, N.; Aubourg, S.; Vitulo, N.; Jubin, C.; et al. The grapevine genome sequence suggests ancestral hexaploidization in major angiosperm phyla. Nature 2007, 449, 463–467. [Google Scholar] [CrossRef]
- Dobin, A.; Davis, C.A.; Schlesinger, F.; Drenkow, J.; Zaleski, C.; Jha, S.; Batut, P.; Chaisson, M.; Gingeras, T.R. STAR: Ultrafast universal RNA-seq aligner. Bioinformatics 2013, 29, 15–21. [Google Scholar] [CrossRef] [PubMed]
- Haak, M.; Vinke, S.; Keller, W.; Droste, J.; Rückert, C.; Kalinowski, J.; Pucker, B. High Quality de Novo Transcriptome Assembly of Croton tiglium. Front. Mol. Biosci. 2018, 5, 62. [Google Scholar] [CrossRef] [PubMed]
- Liao, Y.; Smyth, G.K.; Shi, W. featureCounts: An efficient general purpose program for assigning sequence reads to genomic features. Bioinformatics 2014, 30, 923–930. [Google Scholar] [CrossRef] [PubMed] [Green Version]
- Vitulo, N.; Forcato, C.; Carpinelli, E.C.; Telatin, A.; Campagna, D.; D’Angelo, M.; Zimbello, R.; Corso, M.; Vannozzi, A.; Bonghi, C.; et al. A deep survey of alternative splicing in grape reveals changes in the splicing machinery related to tissue, stress condition and genotype. BMC Plant Biol. 2014, 14, 99. [Google Scholar] [CrossRef] [PubMed] [Green Version]
- Cheng, C.Y.; Krishnakumar, V.; Chan, A.; Thibaud-Nissen, F.; Schobel, S.; Town, C.D. Araport11: A complete reannotation of the Arabidopsis thaliana reference genome. Plant J. 2017, 89, 789–804. [Google Scholar] [CrossRef] [Green Version]
- Barrett, P.; Hunter, J.; Miller, J.T.; Hsu, J.-C.; Greenfield, P. Matplotlib—A Portable Python Plotting Package. In Astronomical Data Analysis Software and Systems XIV ASP Conference Series, Proceedings of the Conference, Pasadena, CA, USA, 24–27 October 2004; Shopbell, P., Britton, M., Ebert, R., Eds.; Astronomical Society of the Pacific: San Francisco, CA, USA, 2005; Volume 347, pp. 91–95. [Google Scholar]
- Virtanen, P.; Gommers, R.; Oliphant, T.E.; Haberland, M.; Reddy, T.; Cournapeau, D.; Burovski, E.; Peterson, P.; Weckesser, W.; Bright, J.; et al. SciPy 1.0: Fundamental algorithms for scientific computing in Python. Nat. Methods 2020, 17, 261–272. [Google Scholar] [CrossRef] [PubMed] [Green Version]
- Guo, C.; Guo, R.; Xu, X.; Gao, M.; Li, X.; Song, J.; Zheng, Y.; Wang, X. Evolution and expression analysis of the grape (Vitis vinifera L.) WRKY gene family. J. Exp. Bot. 2014, 65, 1513–1528. [Google Scholar] [CrossRef]


Publisher’s Note: MDPI stays neutral with regard to jurisdictional claims in published maps and institutional affiliations. |
© 2020 by the authors. Licensee MDPI, Basel, Switzerland. This article is an open access article distributed under the terms and conditions of the Creative Commons Attribution (CC BY) license (http://creativecommons.org/licenses/by/4.0/).
Share and Cite
Pucker, B.; Schwandner, A.; Becker, S.; Hausmann, L.; Viehöver, P.; Töpfer, R.; Weisshaar, B.; Holtgräwe, D. RNA-Seq Time Series of Vitis vinifera Bud Development Reveals Correlation of Expression Patterns with the Local Temperature Profile. Plants 2020, 9, 1548. https://0-doi-org.brum.beds.ac.uk/10.3390/plants9111548
Pucker B, Schwandner A, Becker S, Hausmann L, Viehöver P, Töpfer R, Weisshaar B, Holtgräwe D. RNA-Seq Time Series of Vitis vinifera Bud Development Reveals Correlation of Expression Patterns with the Local Temperature Profile. Plants. 2020; 9(11):1548. https://0-doi-org.brum.beds.ac.uk/10.3390/plants9111548
Chicago/Turabian StylePucker, Boas, Anna Schwandner, Sarah Becker, Ludger Hausmann, Prisca Viehöver, Reinhard Töpfer, Bernd Weisshaar, and Daniela Holtgräwe. 2020. "RNA-Seq Time Series of Vitis vinifera Bud Development Reveals Correlation of Expression Patterns with the Local Temperature Profile" Plants 9, no. 11: 1548. https://0-doi-org.brum.beds.ac.uk/10.3390/plants9111548