Article

Integrated Computational Model of Intracellular Signaling and microRNA Regulation Predicts the Network Balances and Timing Constraints Critical to the Hepatic Stellate Cell Activation Process

by
Lakshmi Kuttippurathu
,
Austin Parrish
and
Rajanikanth Vadigepalli
*
Daniel Baugh Institute for Functional Genomics and Computational Biology, Department of Pathology, Anatomy and Cell Biology, Sidney Kimmel Medical College, Thomas Jefferson University, Philadelphia, PA 19107, USA
*
Author to whom correspondence should be addressed.
These authors contributed equally to this work.
Submission received: 29 August 2014 / Revised: 26 September 2014 / Accepted: 8 October 2014 / Published: 17 October 2014
(This article belongs to the Special Issue Modeling and Analysis of Signal Transduction Networks)

Abstract

:
Activation and deactivation of hepatic stellate cells (HSCs) is an important mechanism contributing to both healthy liver function and development of liver diseases, which relies on the interplay between numerous signaling pathways. There is accumulating evidence for the regulatory role of microRNAs that are downstream from these pathways in HSC activation. However, the relative contribution of these pathways and interacting microRNA regulators to the activation process is unknown. We pursued a computational modeling approach to explore the timing and regulatory balances that are critical to HSC activation and quiescence. We developed an integrated model incorporating three signaling pathways with crosstalk (NF-κB, STAT3 and TGF-β) and two microRNAs (miR-146a, miR-21) that are differentially regulated by these pathways. Simulations demonstrated that TGF-β-mediated regulation of microRNAs is critical to drive the HSC phenotypic switch from quiescence (miR-146ahigh miR-21low) to an activated state (miR-146alow miR-21high). We found that the relative timing between peak NF-κB and STAT3 activation plays a key role driving the initial dynamics of miR-146a. We observed re-quiescence from the activated HSC state upon termination of cytokine stimuli. Our integrated model of signaling and microRNA regulation provides a new computational platform for investigating the mechanisms driving HSC molecular state phenotypes in normal and pathological liver physiology.

Graphical Abstract

1. Introduction

Hepatic stellate cells (HSC), although important for many aspects of liver function in healthy tissue, are primary drivers of liver diseases such as fibrosis and cirrhosis [1,2]. In healthy livers, the main role of HSCs appears to be storage and transport of retinoids as well as modulating the innate immune response [3,4,5]. Activation of HSCs occurs in response to numerous stimuli, including induction of activating factors or loss of repressive signals due to genetic or post-transcriptional regulation. During liver regeneration induced by chemical injury (e.g., CCl4 exposure) or partial hepatectomy, HSCs activate and secrete several pro-regenerative proteins, including hepatocyte growth factor (HGF) and epidermal growth factor (EGF) [6,7,8]. During diseases associated with chronic inflammation, HSCs alter their gene and protein expression profiles, change their morphology, and deposit fibrous extracellular matrix (ECM), causing scarring and leading to fibrosis and cirrhosis [1].
The process of HSC activation during chronic inflammation is governed by autocrine and paracrine signaling factors from other non-parenchymal and parenchymal cells and is likely highly dependent on the local microenvironment [2,9]. It is known that the initial changes in HSCs in response to injury could be a result of paracrine stimulation from other non-parenchymal cells. Several transcription factors play a role in HSC activation. To initiate HSC activation, inflammatory molecules such as IL-1, IL-6, and TGF-β bind to receptors on the stellate cell membrane [10]. The presence of constitutive NF-κB activating inflammatory pathways has been reported in HSCs [11]. A recent study found IL-1 driven NF-κB inducing multiple MMPs provoking HSC activation [12]. IL-6 stimulation of STAT3 increases collagen production in HSCs leading to acceleration of fibrosis. STAT3 directly up-regulates TGF-β expression in HSCs [10]. TGF-β initiates a signaling cascade that results in the phosphorylation of SMAD2 (pSMAD2) and further upregulates SMAD7 expression. SMAD7 acts as an anti-fibrogenic factor through an auto-inhibitory feedback loop by inhibiting TGF-β mediated phosphorylation of SMAD2. This feedback loop leads to a restriction of the intensity and duration of TGF-β signaling [13]. pSMAD2 forms a complex with SMAD4 and the complex translocates to the nucleus, after which they interact with other factors to regulate gene expression of collagen and other fibrogenic factors [10,14]. Interaction between SMAD, NF-κB and STAT3 pathways providing positive and negative feedback modulates HSC activation [4,10,11,12,14,15]. Increased TGF-β expression, lead to increased ECM production by stellate cells and altered ECM composition, with higher fraction of fibrous collagens and lower fractions of basement membrane collagens Activation of HSCs also results in increased levels of growth factors (PDGF, EGF, FGF-2, and others), which induce HSC proliferation, and increased levels of chemotactic proteins (PDGF, MCP-1, CXCR3), which attract HSCs to an activation site [16]. Increased proliferation, chemotaxis, and production of activating signals by active HSCs act as positive feedbacks to amplify HSC activation once it has begun to occur in a subset of cells [2,8].
MicroRNAs are small, non-coding RNAs approximately 21 nucleotides in length which are involved in the regulation of multiple cellular processes [17]. Recently, the role of microRNAs governing the activation and function of HSCs has begun to be appreciated. Knockdown of miR-27a and miR-27b in activated HSCs was shown to allow reversion to a quiescent phenotype [18]. miR-15b and miR-16 are known to be downregulated during the activation of HSCs [19]. Recent studies have revealed the role of miR-29b in HSC activation [20]. Another microRNA, miR-146a, has emerged as a potential modulator of HSC activation. miR-146a expression is shown to be downregulated during rat HSC activation [21]. A recent in vitro study reported miR-146a expression to be decreased by almost 17-fold in activated HSCs [22]. In contrast, when miR-146a was overexpressed in activated HSCs in vitro, the cells appear to take on an anti-fibrotic phenotype, expressing low mRNA levels of IL-6, high mRNA levels of basement collagen (Col1a1), and lower levels of NF-κB binding activity (a mediator of inflammatory response). miR-21 is one of the well-studied microRNAs that modulates cell cycle progression and proliferation during liver regeneration. The role of miR-21 in hepatic stellate cell activation has also been studied [23]. Higher expression of miR-21 and the existence of an auto-feedback loop connecting miR-21 to TGF-β pathway activation in activated HSCs have been reported [24]. In contrast to miR-146a, miR-21 has been associated with increased cardiac fibrosis in vivo and increased ECM deposition in vitro [25]. In HSCs activated in vitro, miR-21 expression increased by over five-fold indicating that miR-21 may play a role modulating fibrosis in HSCs [22]. Several other papers have reported such a differential activation of microRNAs miR-21 and miR-146a in the context of liver and other diseases [26,27,28]. Alterations in the relative balance between this pair of microRNAs, here termed “microRNA switch”, can therefore act a marker for HSC activation state. Activated HSCs have a relatively high expression of miR-21 to miR-146a, whereas quiescent HSCs have a low miR-21 to miR-146a ratio of expression. In summary, the opposing expression and regulation of these microRNAs and their interaction with the cytokine induced signaling pathways are associated with HSC activation. Therefore, we used these two microRNAs as representative markers of HSC phenotype in our model and formulated our analysis based on their differential regulation.
Although the microRNAs miR-146a and miR-21 appear to be useful as biomarkers for HSC activation state, their role in HSC activation remains unclear. The dynamics of miR-21 and miR-146a during HSC activation have not been fully characterized. Several feed forward and feedback interactions between these microRNAs and signaling pathways have been demonstrated in multiple studies [23,25,29,30]. The known interactions between signaling pathways and these microRNAs lead to multiple possibilities for how these microRNA biomarkers likely vary during the early stages of HSC activation. We pursued a computational model based approach to explore these possibilities. Based on an array of in vitro and in vivo literature, we developed a novel computational model of HSC activation through IL-1β, IL-6, and TGF-β signaling with feedback from miR-21 and miR-146a. We utilized this model to identify the network balances and timing constraints that may be critical to altering the dynamic switch between miR-21 and miR-146a during HSC activation.
Activation of HSCs is an inherently dynamic multi-scale process due to cell–cell interactions and the tissue microenvironment regulating paracrine signaling and activating intracellular pathways. For the present purpose, we approximated the multi-scale nature of the regulation by considering microRNA based molecular markers as indicators of the HSC cellular state at physiological scales. This approximation constrains our model formulation to focus on key pathway components regulating the switch between microRNAs. By creating an integrated model based on observed molecular and phenotypic states, we are able to study how changes at the molecular level likely translate to changes at the cellular level.

2. Methods

The integrated signaling pathways and microRNA regulation model were developed as a Petri net system [31]. Petri nets are weighted directed graphs that make use of graph theoretical methods, which can efficiently simulate biological signal transduction, metabolic and gene networks. In Petri nets, molecular components are represented as place nodes and biochemical reactions are considered transition nodes. To better represent the complexity of our biological system, we modeled the network as a stochastic Petri net, where stochasticity was introduced as an exponentially distributed firing rate for each of the components (i.e., the likelihood of the waiting times of the nodes to activate had an exponential distribution). The Petri net model was implemented using the software Snoopy (version 1.13, Brandenburg University of Technology, Cottbus, Germany, 2014), which provided a graphical platform for model construction, computational modeling and simulation of the network [32]. Transition nodes were modeled to operate by either mass action or Michaelis-Menten kinetics. The kinetic parameters were manually tuned through an iterative process. Initial value ranges were selected from several sources—TGF-β-receptor binding values were estimated from [33], activation of STAT3 and inhibition by SOCS3 from [34], and downstream SMAD/SMURF signaling in the TGF-β pathway from [35]. A total of 250 Monte Carlo simulations were run using the Gillespie algorithm for each analysis scenario. In the case of transient signaling, cytokine inputs were modeled as pulse functions using pre-scheduled transitions. For persistent signaling, the initial step input signals were held throughout the simulation.

3. Results and Discussion

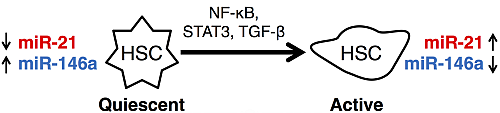
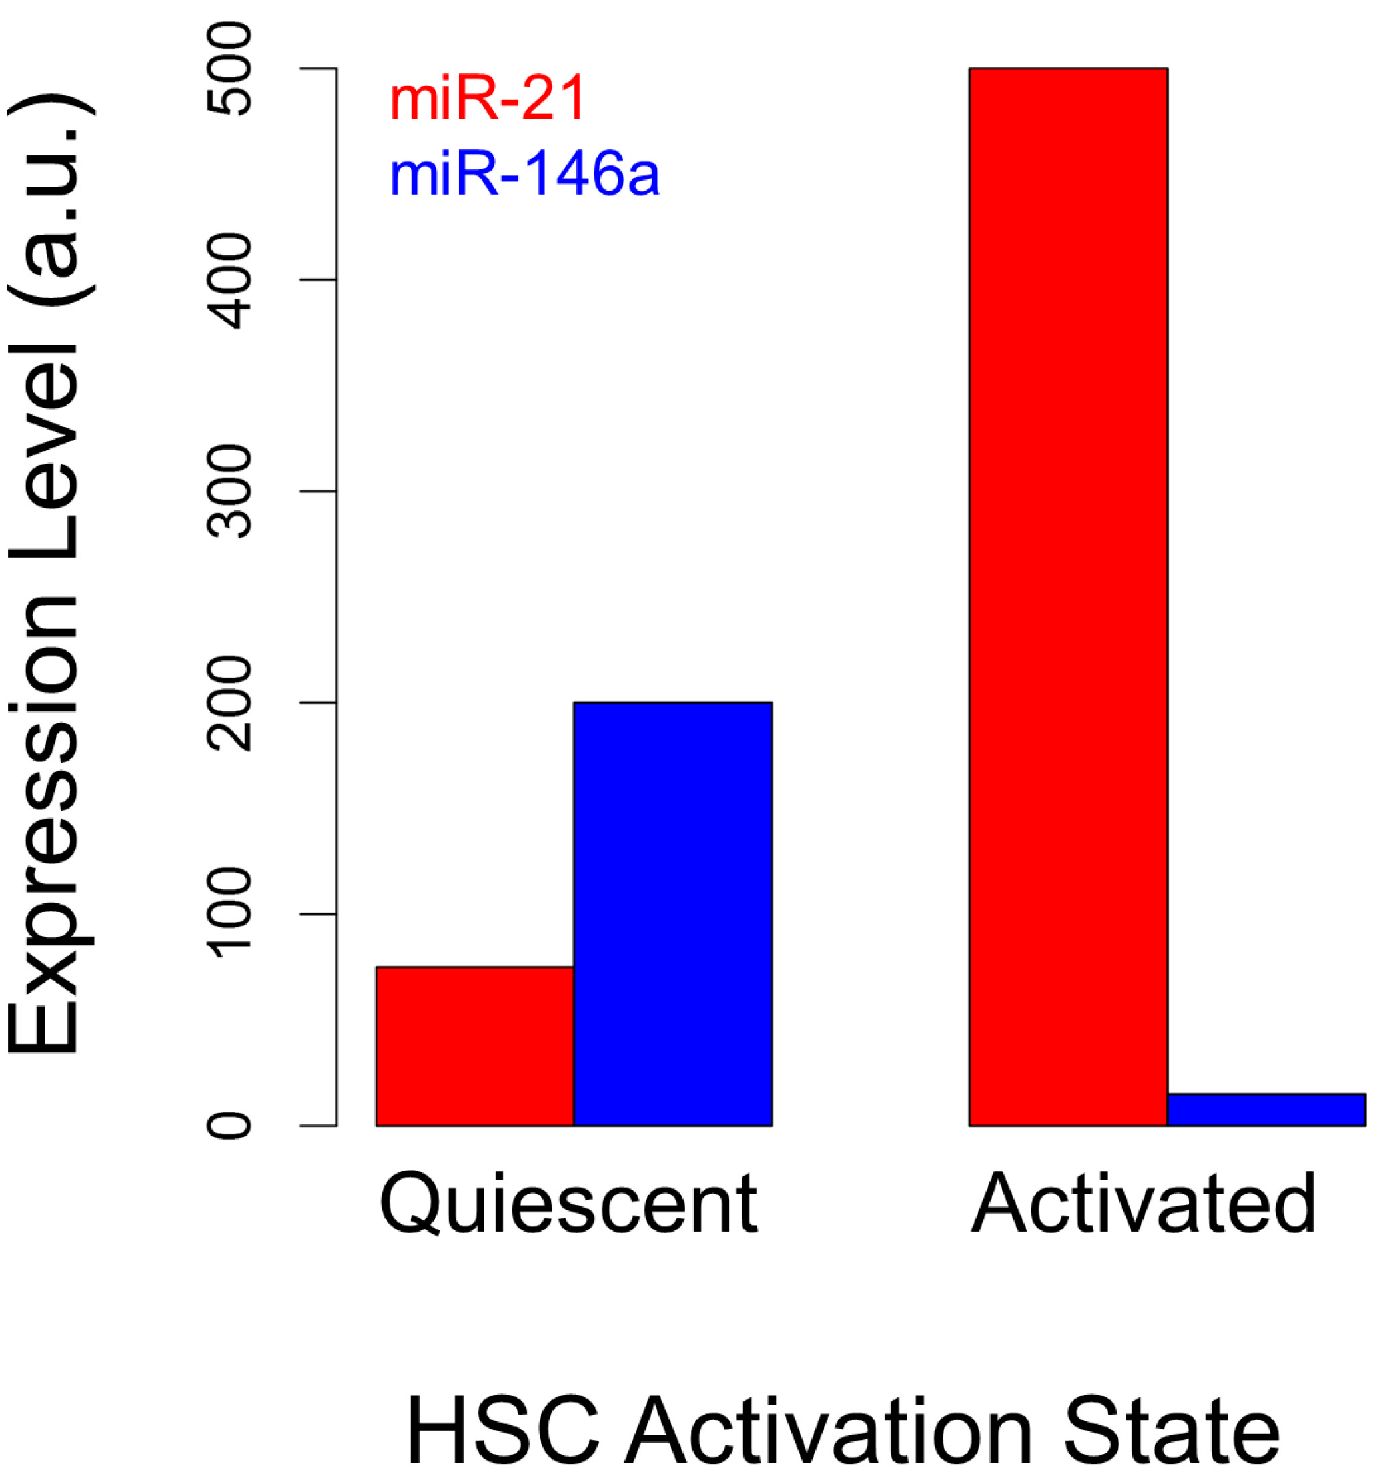
3.1. microRNAs as Markers of Hepatic Stellate Cell Molecular Phenotypes

Activated stellate cells play a major role in the development of liver fibrosis by contributing to the pro-fibrogenic pathways and other signaling pathways leading to ECM production. It has been shown that autoregulatory feedback loops between these pathways and microRNAs influence the fate of the activated stellate cells. Altered microRNA expression levels have been previously reported in activated HSCs [22,23]. In particular, miR-21 has been shown to be upregulated in both activated HSCs and regenerating livers, and is known to be over expressed in certain cancer types [22,36]. In contrast, miR-146a was shown to be significantly down regulated during HSC activation (~17-fold decrease in expression levels) [22]. We analyzed the intensity values obtained from the microarray data for quiescent and activated hepatic stellate cells to generate relative microRNA levels [22]. The expression level of these microRNAs varied in opposite fashion during HSC activation (Figure 1). Based on these findings, we postulated that anti-correlation between these two microRNAs and their relative expression levels may be playing a role in regulating the central signaling pathways in activated HSCs and may be used as representative markers of the HSC activation state. Our approach is the first step towards addressing the testable hypothesis that the microRNA behavior based kinetics may contribute to the cellular phenotypic changes leading to HSC activation.
Figure 1. Changes in microRNA expression levels between quiescent and activated hepatic stellate cells. Data are derived from published microarray data on microRNA expression in primary hepatic stellate cells collected from Wistar rats (Gene Expression Omnibus accession GSE19462) [22].
Processes 02 00773 g001

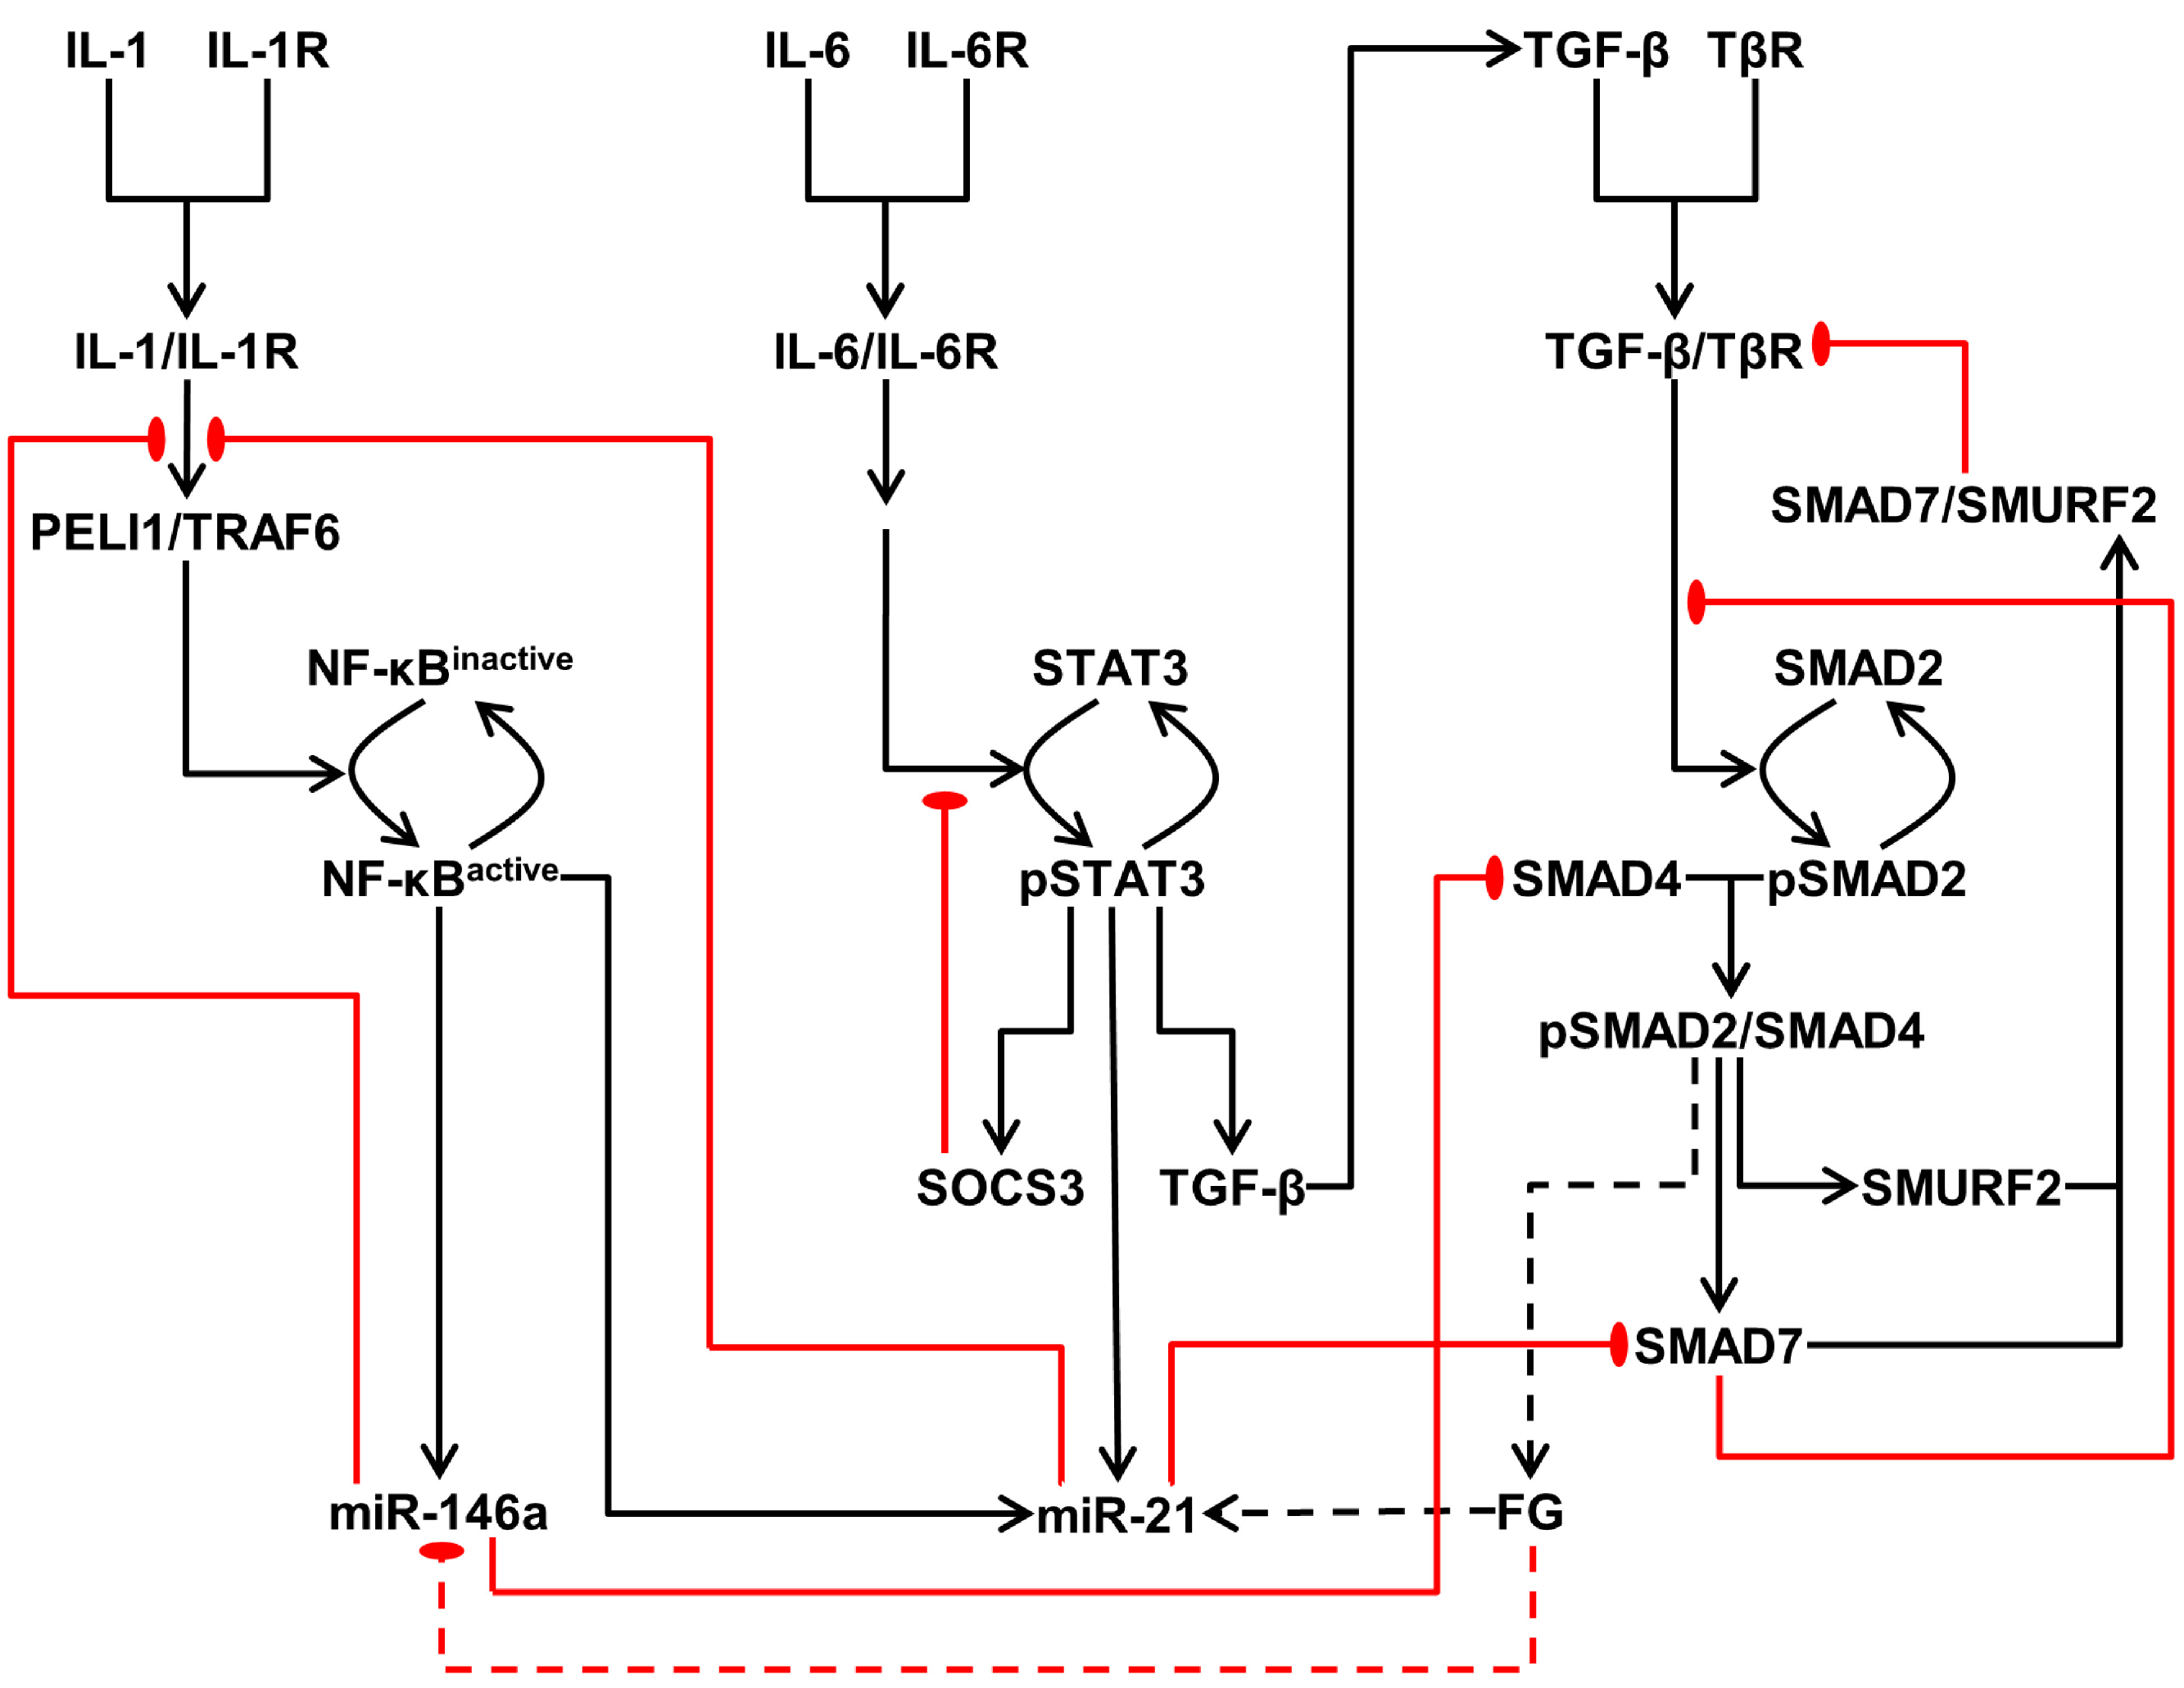
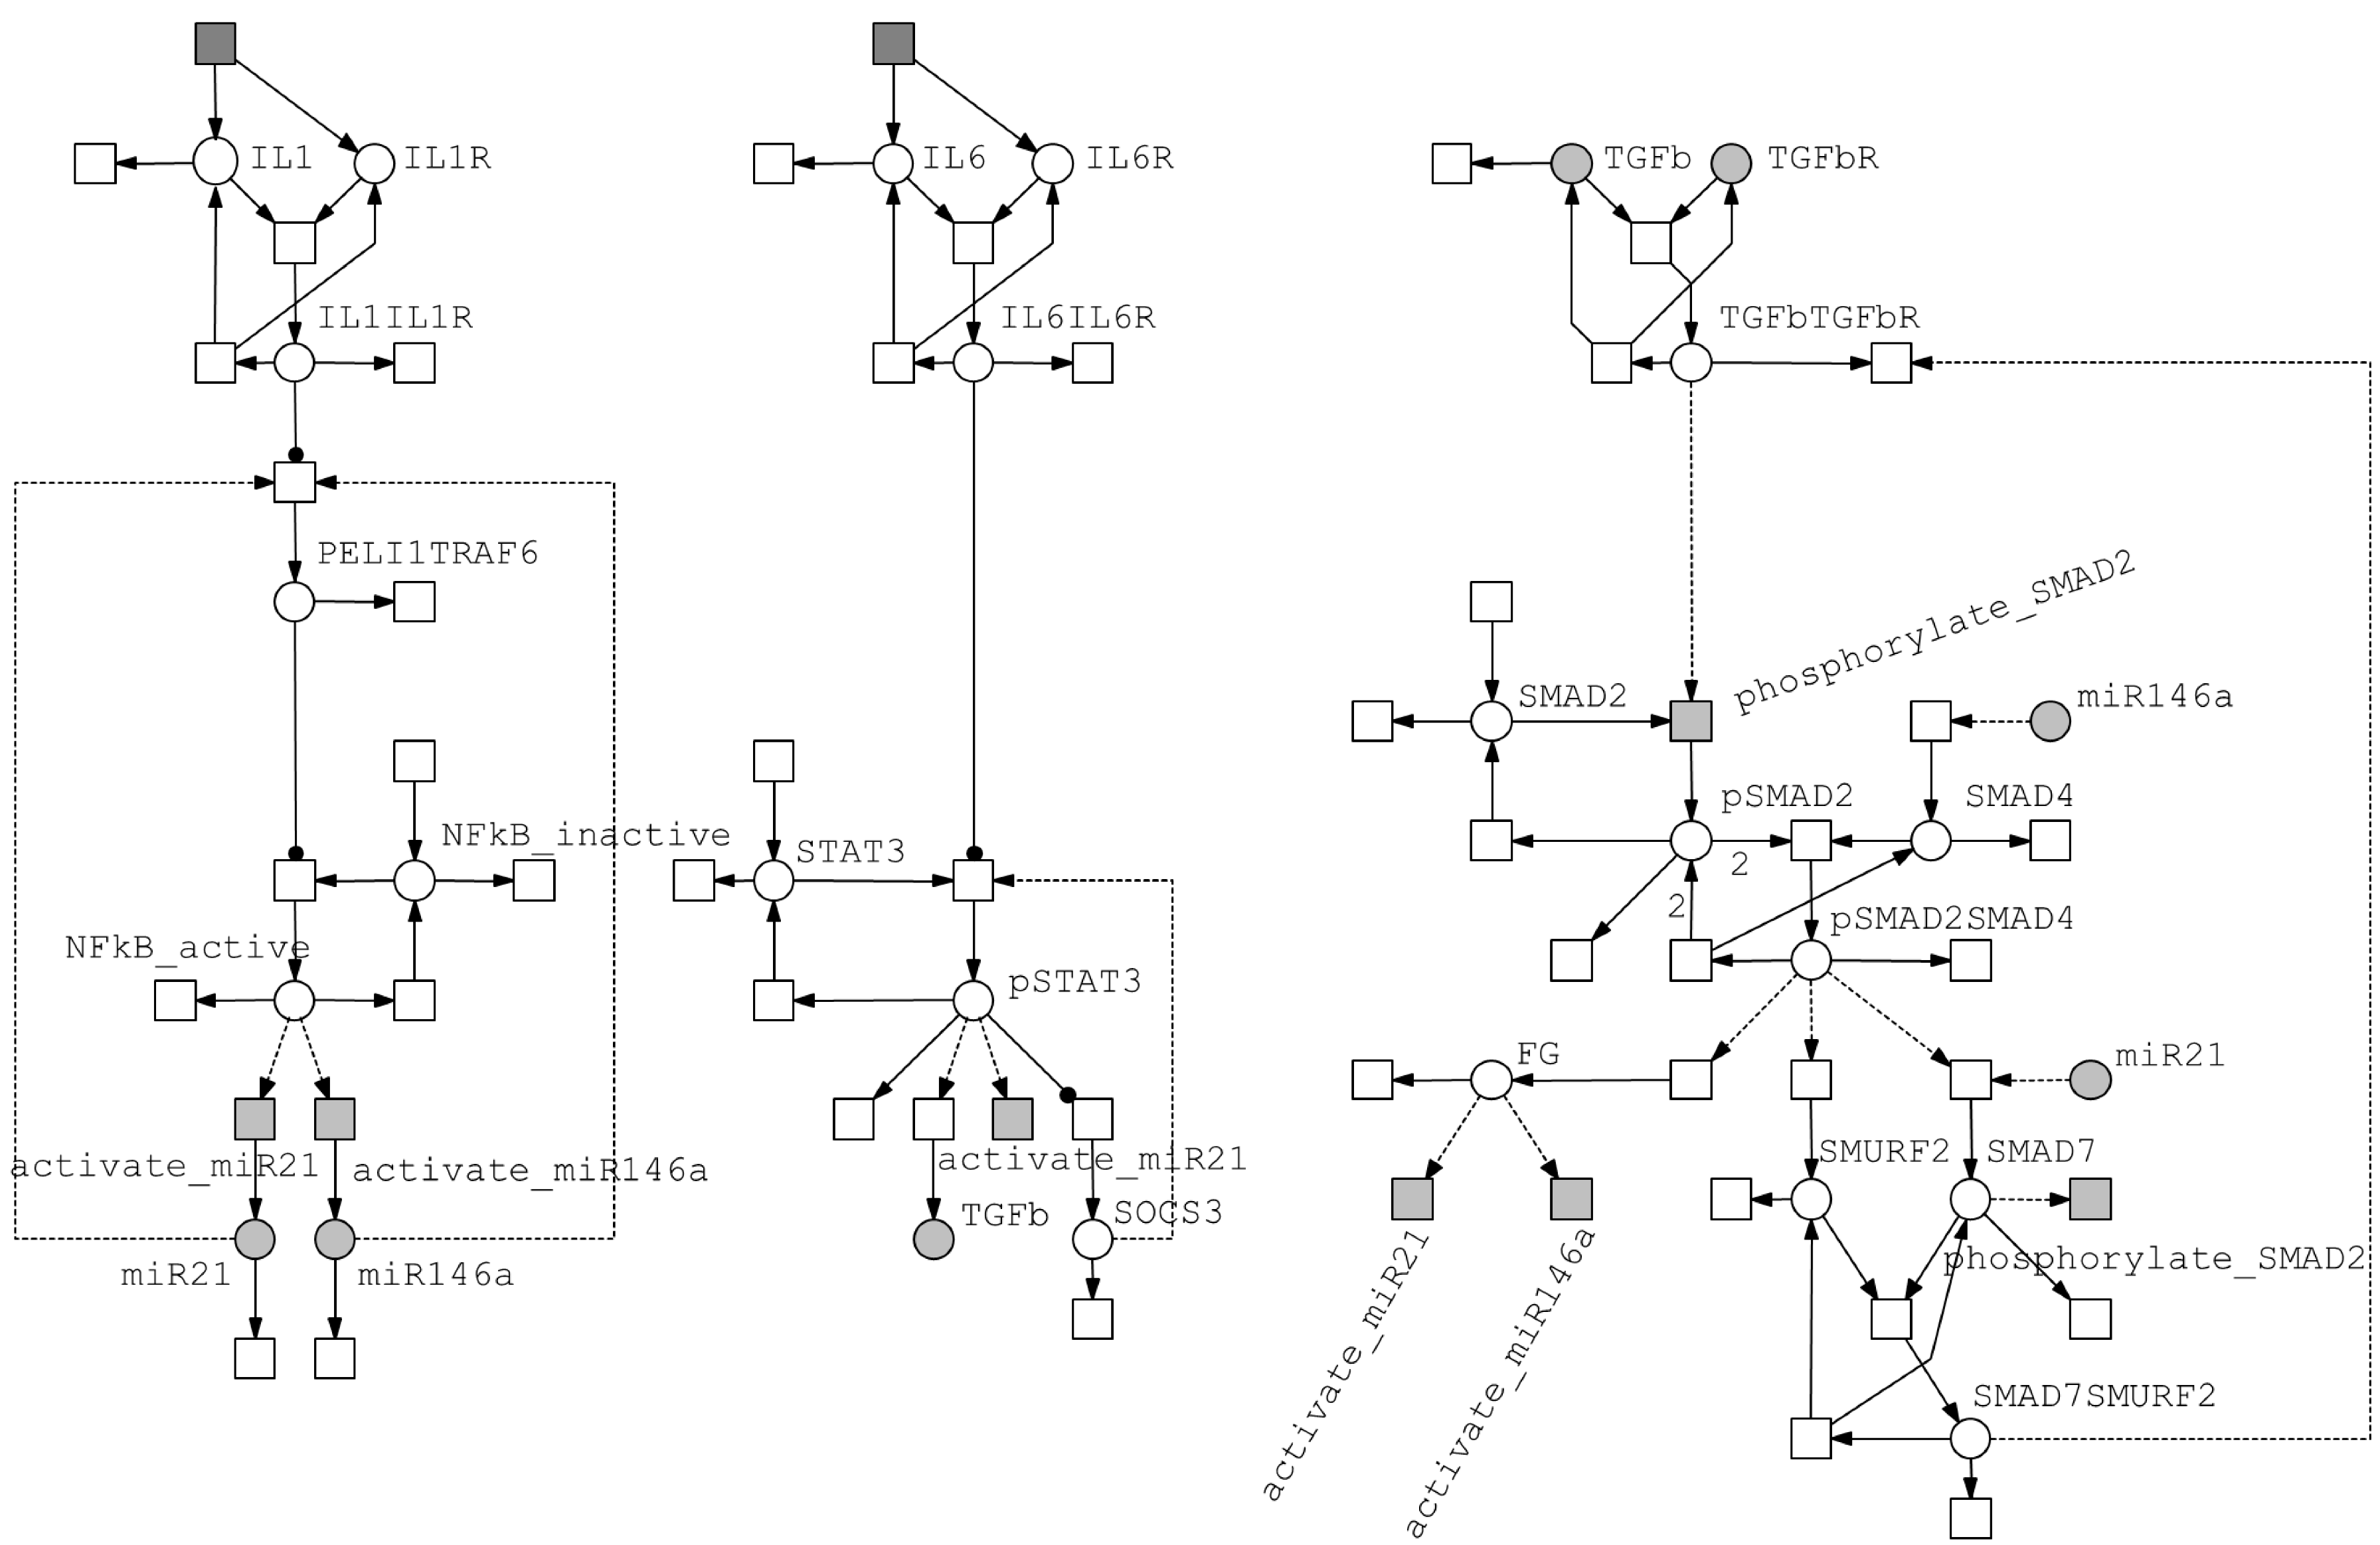
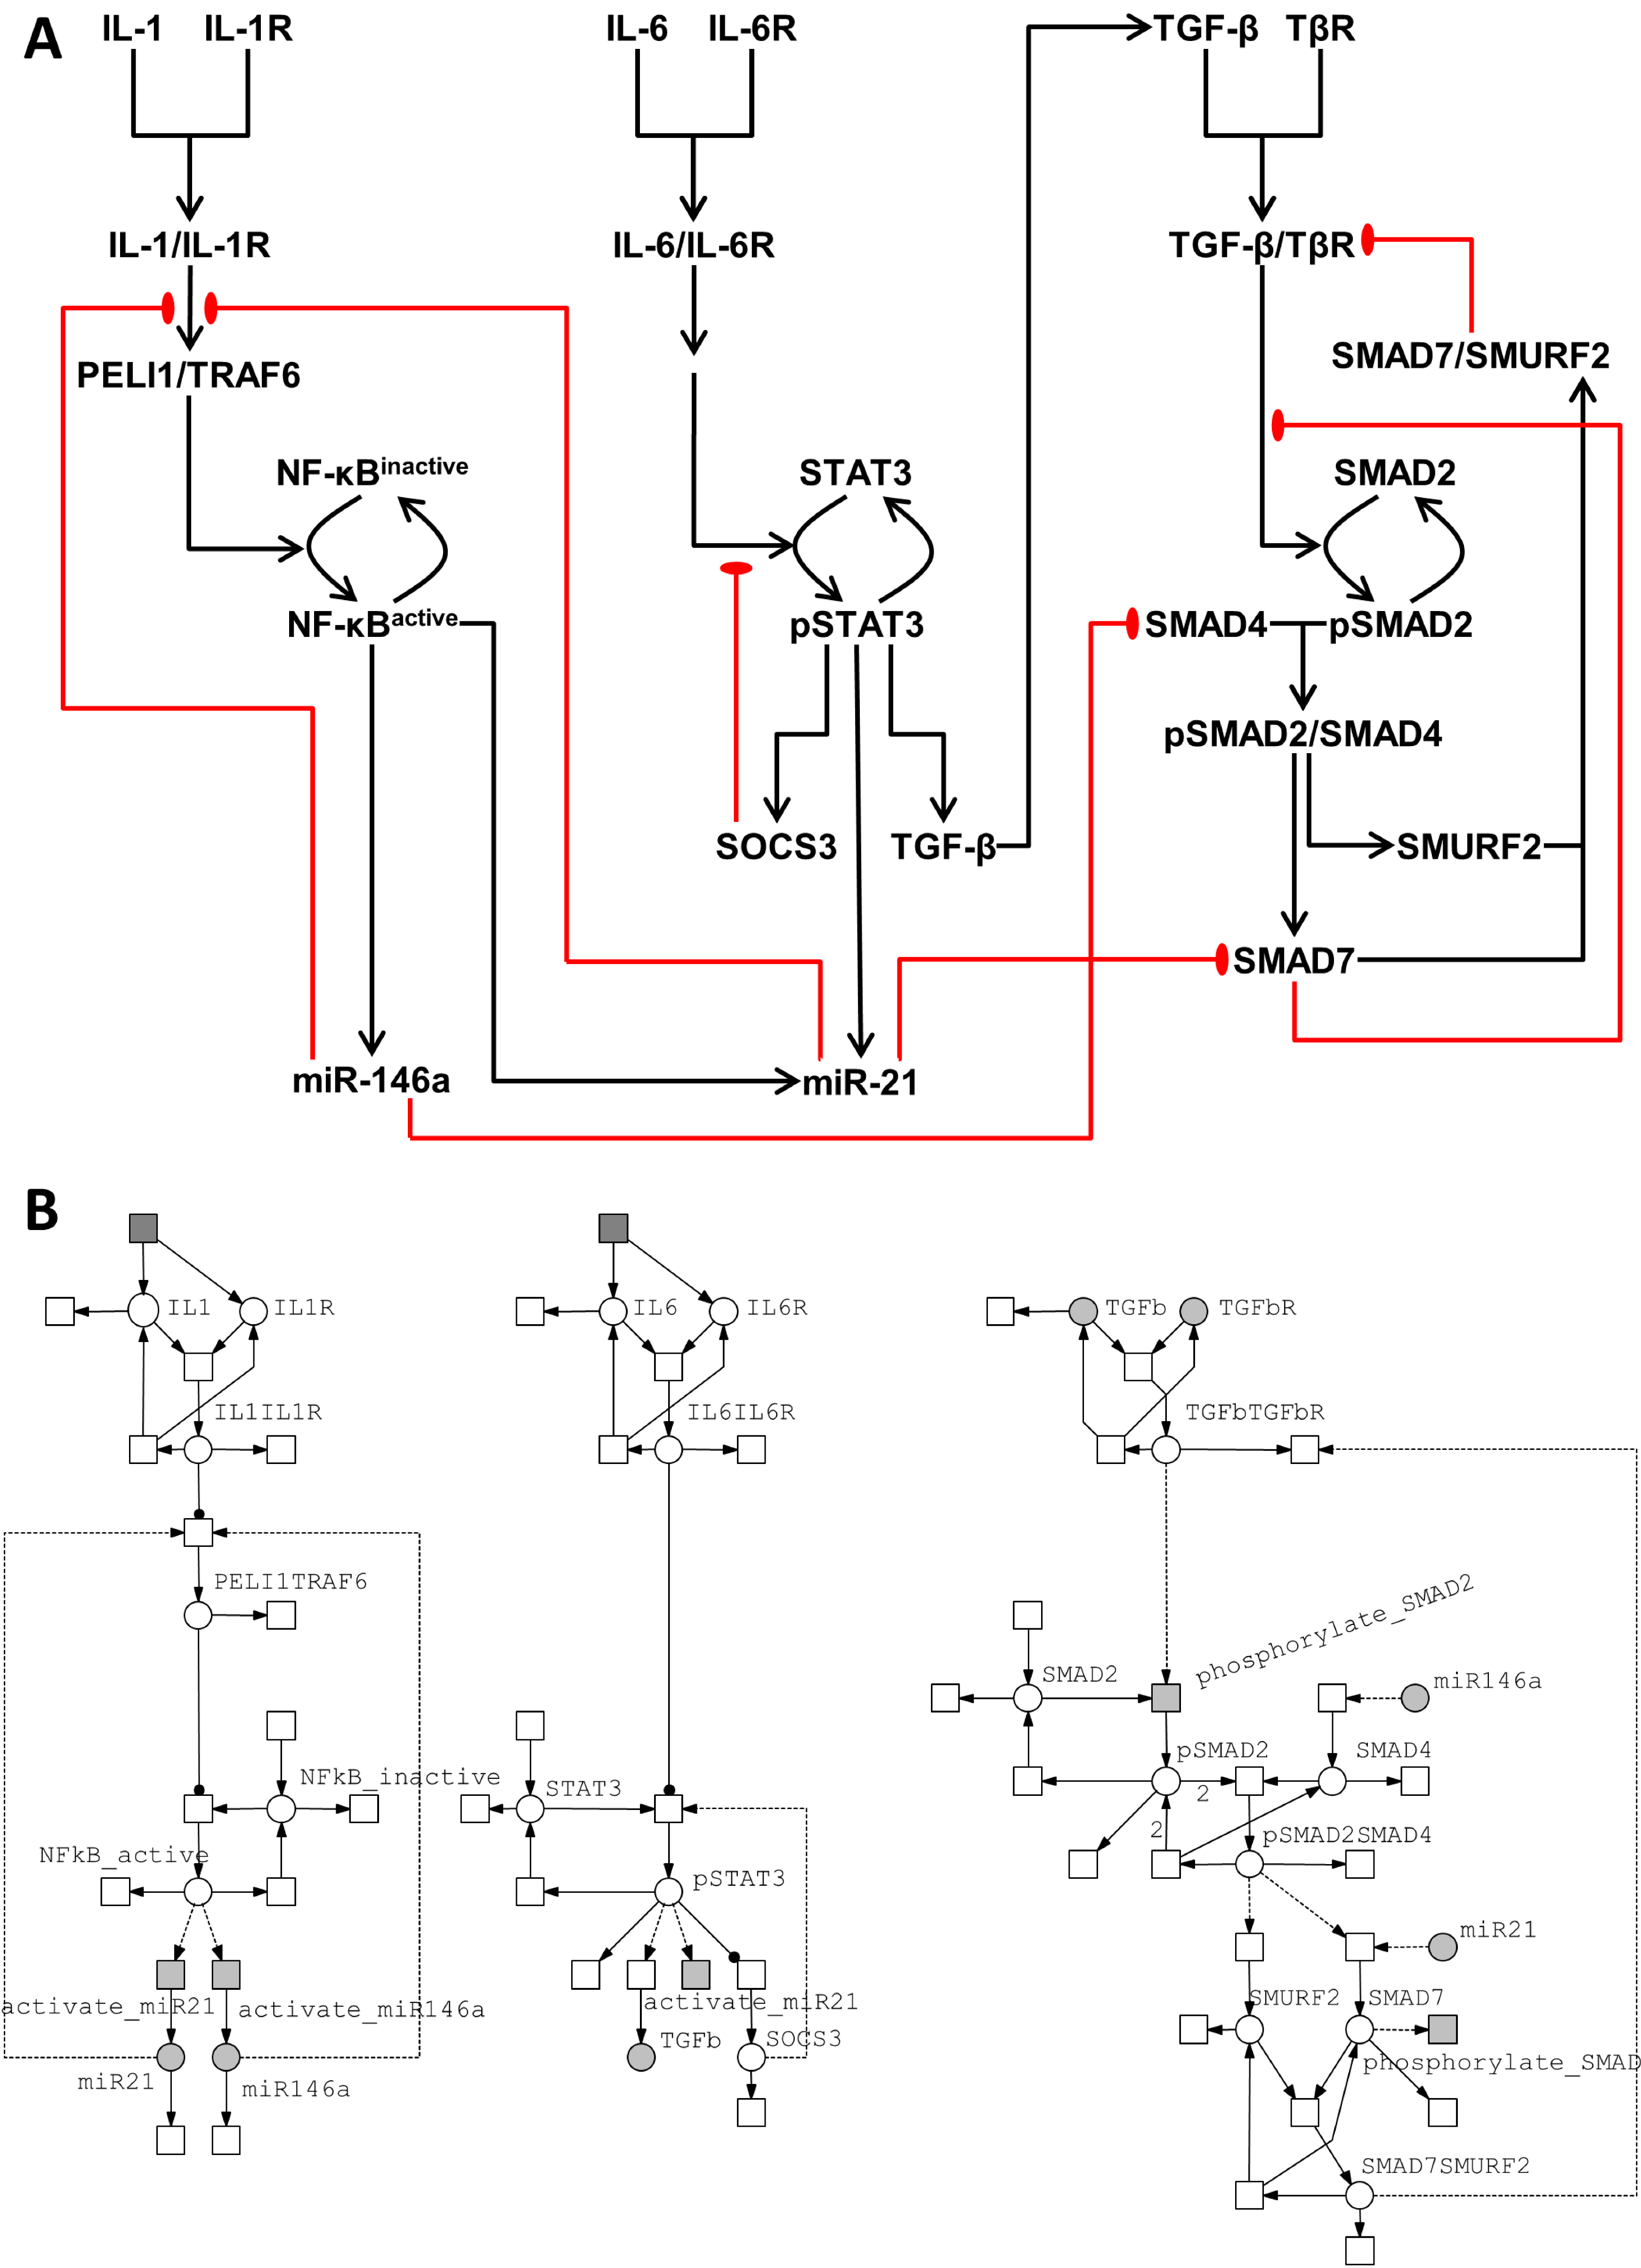
3.2. Integrated Model of Signaling and microRNA Regulation

An overview of the modeled signaling pathways and components is shown in Figure 2. Activation or inhibition arrows ending on species nodes represent influences on production or degradation, respectively. The arrows ending on other arrows represent modification of the corresponding reaction/interaction. For example, PEL1/TRAF6 levels positively influence the transformation of NF-κB inactive into NF-κB active form. NF-κBactive species lead to higher production of miR-146a and miR-21. Similarly, miR-146a levels negatively influence the activation of PEL1/TRAF6 complex, and also reduce levels of SMAD4. In order to explore the dynamics of these microRNAs leading to an activated HSC phenotype, we developed a stochastic Petri net model incorporating several well-characterized pathways that have been shown to play a role in the activation of HSCs and stimulation of liver fibrogenesis.
A Petri net implementation of the integrated network is shown in Figure 3. Our model includes IL-1/NF-κB, IL-6/STAT3, and TGF-β/SMAD signaling pathways interacting with miR-146a and miR-21. We explored the contributions of individual pathways to the differential regulation of microRNAs to identify necessary and sufficient regulatory relationships to account for the microRNA switch during HSC activation. We started with the IL-1/NF-κB pathway alone and continued to sequentially expand our model to include IL-6/STAT3 and TGF-β/SMAD pathways.
Figure 2. Schematic view of the integrated network model of signaling pathways and microRNA regulatory interactions. Black lines represent activating interactions, while red lines represent inhibitory interactions. Hypothesized interactions are represented by dashed lines.
Processes 02 00773 g002
Figure 3. Graphical representation of the Petri net model. Light gray nodes represent “logical” elements that allow for crosstalk; dark gray nodes represent input stimuli. Edges with arrows correspond to mass flux. Edges with round ends (“read edges”) correspond to influences without affecting the levels of the source nodes. Dashed edges (“modifier edges”) correspond to inhibitory influences.
Processes 02 00773 g003

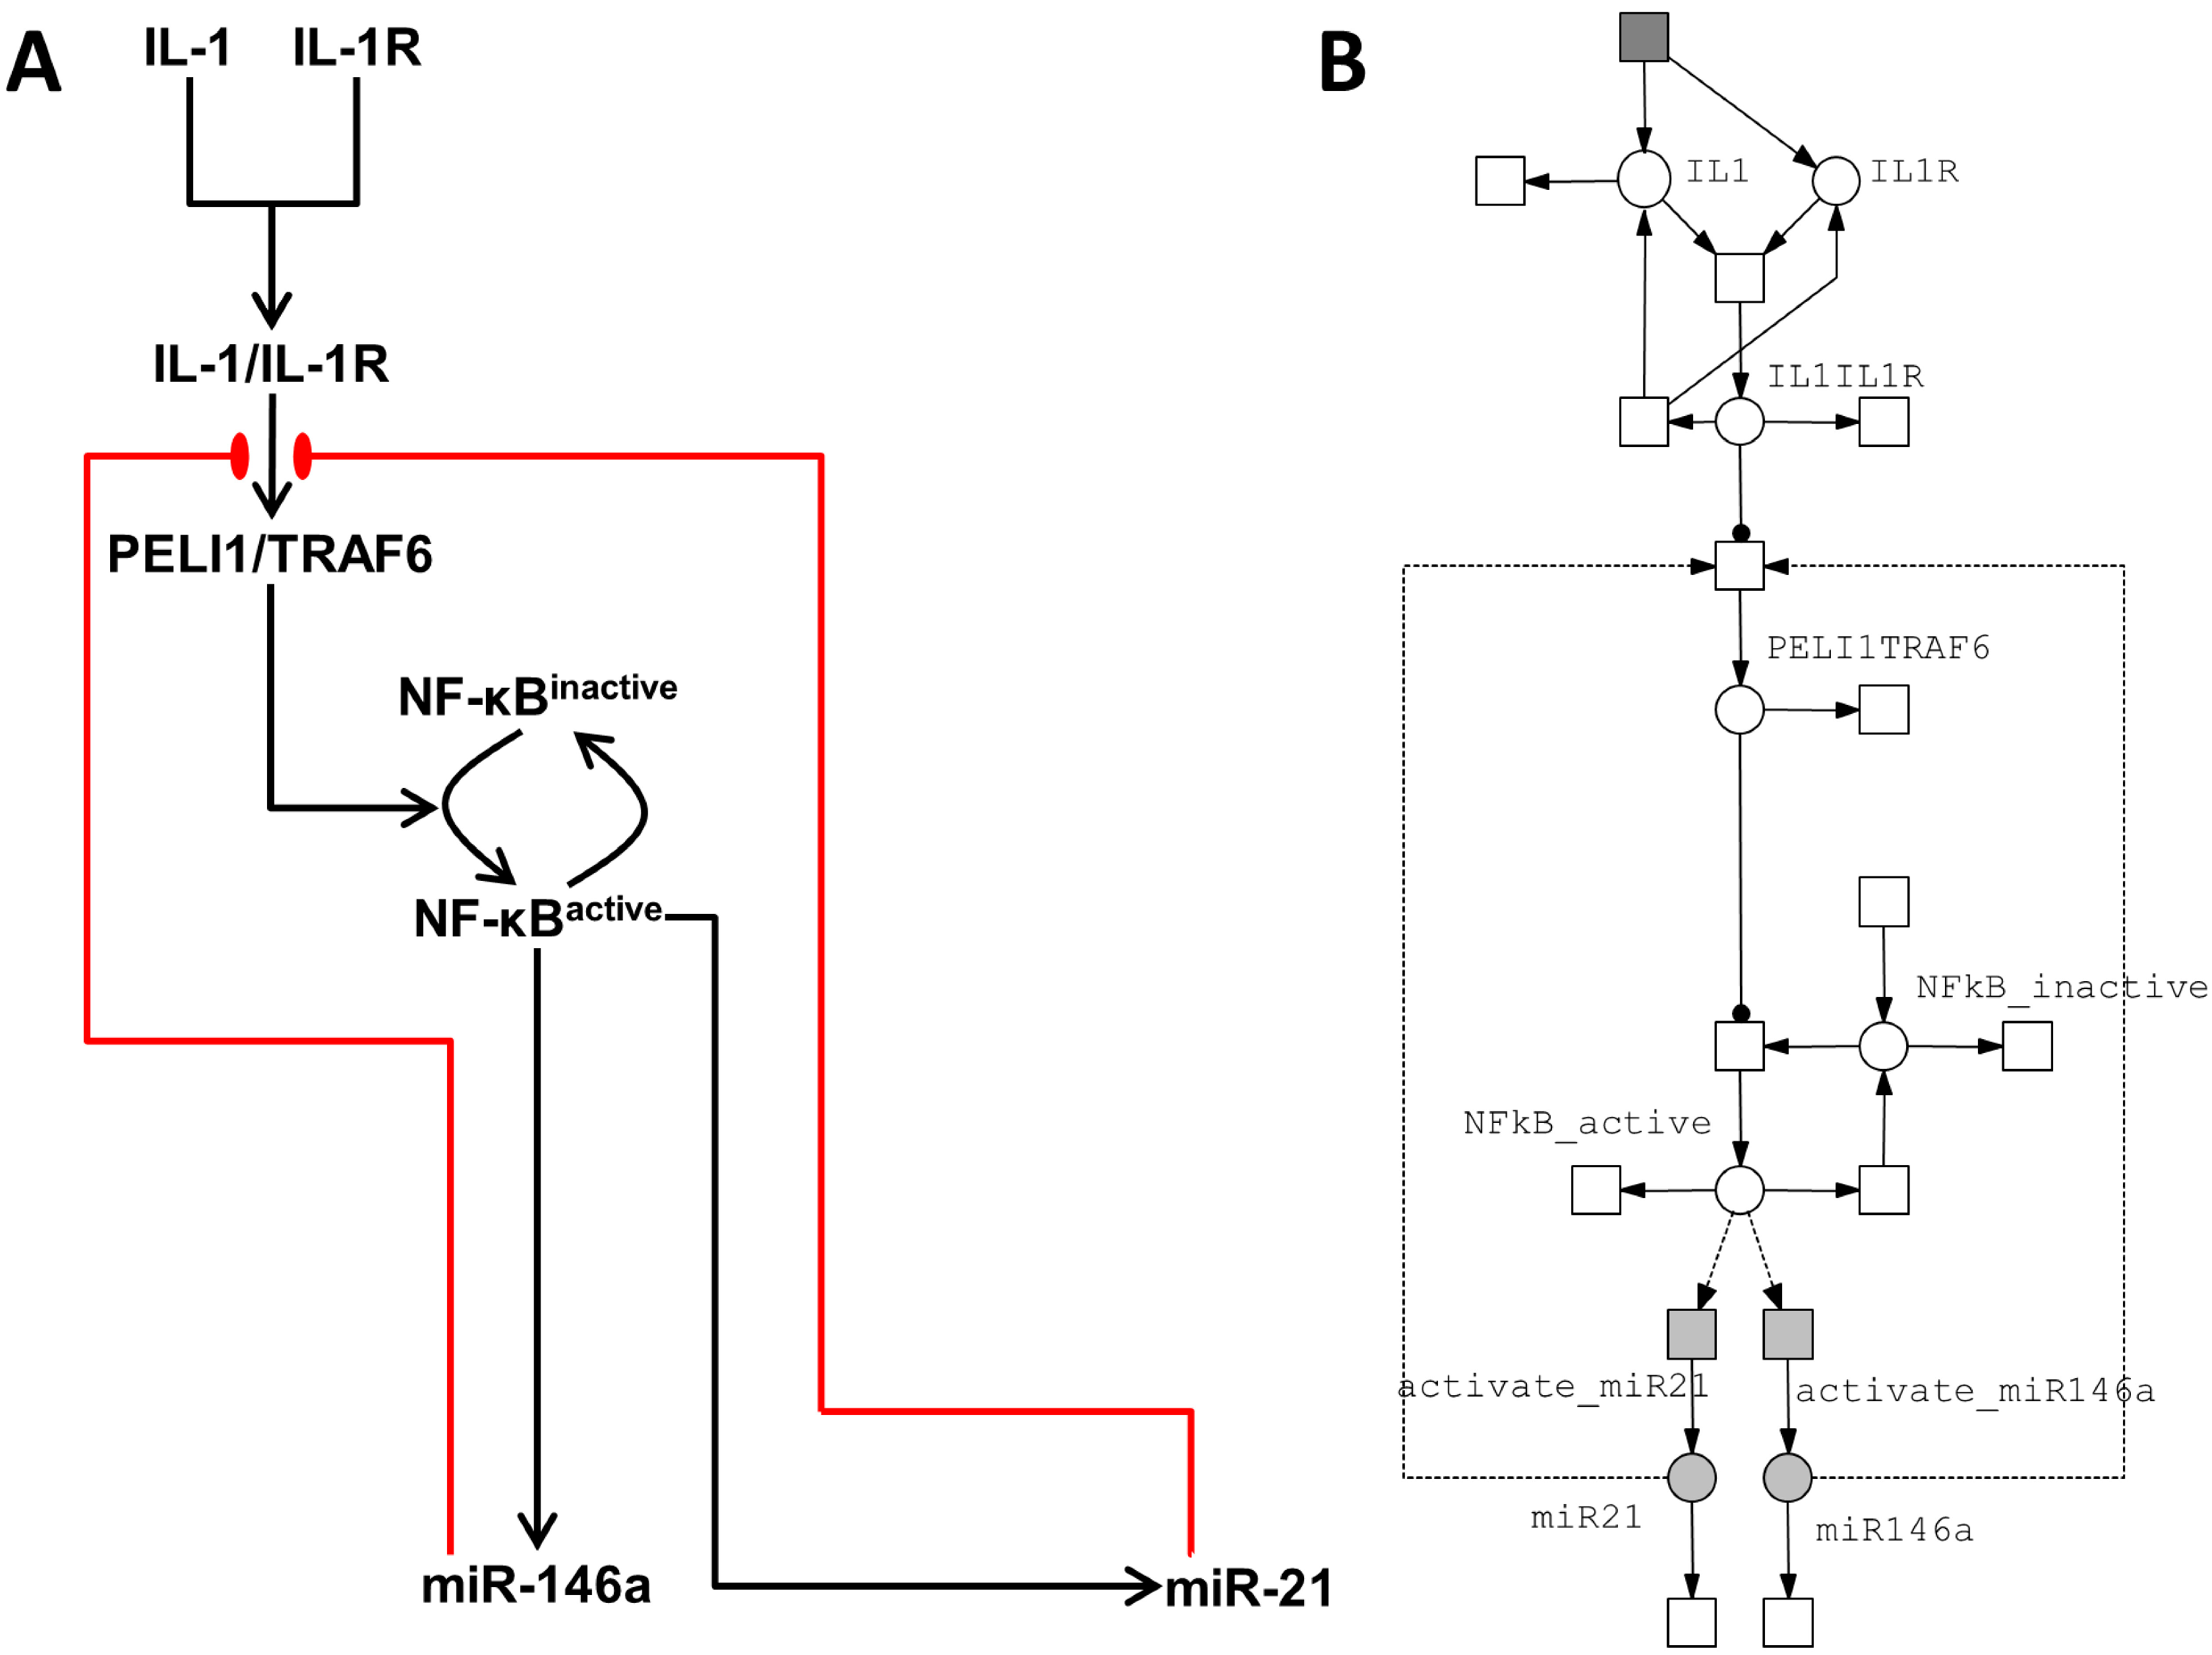
3.2.1. Model of the IL-1/NF-κB Pathway

Constitutive activity of the transcription factor nuclear factor-κB (NF-κB) has been strongly implicated in the promotion of liver fibrogenesis and HSC activation [37,38]. In our model, the proinflammatory cytokine IL-1 activates the NF-κB pathway (Figure A1). The production of IL-1 and IL-1R leads to the formation of an IL-1/IL-1R complex in a concentration-dependent manner. This complex can either dissociate into its individual components or proceed to the activation of the next component in the pathway via signal transduction [39]. During persistent signal transduction IL-1/IL-1R activates the PELI1/TRAF6 (Pellino 1/tumor necrosis factor receptor-associated factor 6) complex. NF-κB is represented in the model as distributed across two likely states: an inactive species that is activated by PELI1/TRAF6 complex, and an active species that is capable of upregulating its target genes. The balance between the production and degradation maintains the steady state levels of the inactive species. In the presence of active PELI1/TRAF6 complex, the transition from inactive to active form of NF-κB is modeled using mass action kinetics. The activation of NF-κB is modeled as a reversible reaction approximately accounting for shuttling between cytoplasm and nucleus that is not explicitly represented in the model. In biological systems, the PELI1/TRAF6 complex is the result of interactions between several other proteins, such as IL-1 receptor-associated kinases (IRAK1/IRAK4), and causes activation of NF-κB by mediating its release from inhibitory protein IκB [39]. Our model approximates these intermediary reactions as a single reaction with apparent kinetic parameter values yielding an NF-κB activation profile similar to experimental observations.
Once activated, NF-κB increases expression of miR-21 and miR-146a [29,30]. In the model, microRNA production by activated NF-κB is governed by mass action kinetics. Previous experimental studies have shown that miR-21 targets Peli1, thereby creating a potential negative feedback targeting NF-κB signaling [29]. miR-146a has been shown to modulate the IL-1 signaling pathway by targeting IRAK1 and TRAF6 to induce their down regulation [29,30]. Based on these observations, miR-21 and miR-146a was modeled as inhibiting the PELI1/TRAF6 complex. This results in a negative feedback loop between the microRNAs and NF-κB activation.
We tested whether activation of NF-κB pathway is sufficient to lead to the experimentally observed switch between miR-21 and miR-146a levels. Simulations showed that both miR-21 and miR-146a levels closely followed the profile of active NF-κB (Figure 4A). Both microRNAs exhibited an initial increase in their levels, followed by a drop-off to steady state levels higher than baseline. Despite the presence of inhibitory feedback, there was no phenotypic switch from a miR-21low miR-146ahigh state to a miR-21high miR-146alow state. Based on the network structure in which NF-κB serves as an activator of both microRNAs, the switch from a miR-21low miR-146ahigh state to a miR-21high miR-146alow state can occur only with differential rates of activation of the two microRNAs. The model was expanded to include additional signaling pathways in order to accomplish such differential microRNA regulation.
It is known that NF-κB acts primarily as a mediator of immune and inflammatory responses in liver cells [37]. However, NF-κB in has been shown to function as an anti-apoptotic factor and promote the expression of numerous growth factors and cytokines, including IL-6, in HSCs [2,40]. IL-6 plays a key role in activating the transcription factor STAT3, which has recently been found to be a necessary factor in liver fibrosis [10,40]. In addition, STAT3 has been shown to induce miR-21 expression in a cancer context to inhibit tumor suppressor pathways [41]. We tested whether the addition of the IL-6/STAT3 pathway to our model was sufficient to yield a microRNA switch.
Figure 4. Dynamics of microRNA and transcription factor expression levels during HSC activation. (A) Expression levels considering the IL-1/NF-κB signaling pathway alone; (B) Expression levels considering IL-1/NF-κB and IL-6/STAT3 signaling pathways regulating the microRNAs. Solid arrowheads mark the start of input cytokine stimuli.
Processes 02 00773 g004

3.2.2. Model of the IL-6/STAT3 Pathway

STAT3 activation in liver non-parenchymal cells, such as HSCs, occurs in response to IL-6 signaling, among other cytokines [42]. IL-6 binds to its receptor, IL-6R, to form the IL-6/IL-6R complex (Figure A2). Binding of ligand-receptor complex IL-6/IL-6R and its dissociation are modeled using mass action kinetics. The IL-6/IL-6R complex leads to activation of STAT3. Our model approximates an intermediate step whereby IL-6/IL-6R activates the protein Janus kinase (JAK), causing STAT3 phosphorylation [42]. Once activated, phosphorylated STAT3 (pSTAT3) is able to upregulate the expression of its target genes. Suppressor of cytokine signaling 3 (SOCS3), activated by pSTAT3, targets the signaling intermediary gp130 protein to inhibit STAT3 activation [42]. The kinetics of this negative feedback were modeled using Michaelis-Menten formalism with SOCS3 acting as a competitive inhibitor that reduces STAT3 activation. STAT3 activation in HSCs increases miR-21 expression significantly [43]. Our model approximates the upregulation of miR-21 by pSTAT3 using mass action kinetics.
Simultaneous activation of NF-κB and STAT3 pathways led to higher levels of miR-21 and a modest increase in steady state miR-146a levels (Figure 4B). However, miR-146a levels remained high, contrary to experimental observations [8], indicating that the activation of these pathways is insufficient to induce the microRNA switch. These results indicated the requirement for negative regulation of one or both of the microRNAs to account for the switch during HSC activation.
Previous experimental studies have shown that STAT3 promotes production of TGF-β, a key factor in driving HSC-mediated fibrogenesis [10]. Based on these results, the STAT3 pathway was modified as leading to production of TGF-β. Additionally, crosstalk between TGF-β pathway and microRNAs in liver has been well studied [44,45]. Based on these findings we expanded the model to include a TGF-β-mediated pathway leading to activation of genes driving fibrogenesis and likely regulate miR-21 and miR-146a expression.

3.2.3. Model of the TGF-β/SMAD Pathway

Active TGF-β binds to TGF-β receptor I (TβRI), forming TGF-β:TβRI complex (Figure A3). The ligand receptor complex is then able to dissociate, or promote the activation of SMAD2. This activation step accounts for the ligand-receptor complex-mediated phosphorylation of SMAD2 [33,46]. Inactive SMAD2 is present at a steady state level balanced by its constitutive production and degradation. The active, phosphorylated SMAD2 species (pSMAD2) is able to bind to another protein, SMAD4, with a 2:1 stoichiometry of SMAD2 vs. SMAD4. This complex, termed pSMAD2/SMAD4 in the model, leads to increase in expression of SMURF2 and SMAD7, which act as negative regulators of TGF-β signaling. The translocation of pSMAD2/SMAD4 into the nucleus has been approximated in the activation rates specified in the model. SMAD7 exerts its influence by blocking SMAD2 phosphorylation and is also able to form a complex with SMURF2 to promote degradation of TβRI [47,48]. miR-146a is involved in the inhibition of TGF-β-induced HSC proliferation and activation by decreasing SMAD4 protein expression [45]. miR-21 is known to directly target and inhibit SMAD7, thereby creating as a positive feedback to the pro-fibrogenic TGF-β pathway [44,45].
Simulations of the expanded model did not impact the dynamic profiles of microRNAs due to the lack of regulation by the TGF-β pathway. This led us to hypothesize that the shift in balance of the microRNAs is driven by the pro-fibrotic target genes of the TGF-β pathway. Previous studies identified the activation of fibrotic genes by the TGF-β pathway [10]. Experimental studies in tissues other than liver have demonstrated an opposing influence of the TGF-β pathway on miR-21 and miR-146a expression [45,49]. However, downstream effectors of the TGF-β/SMAD pathway on these microRNAs in HSCs are presently unknown. Based on this phenomenological relationship, we introduced an empirical pro-fibrotic gene (FG) as a downstream target of the TGF-β/SMAD pathway. In our model, activation of FG modulates microRNA expression by upregulating miR-21 and downregulating miR-146a via mass action kinetics.

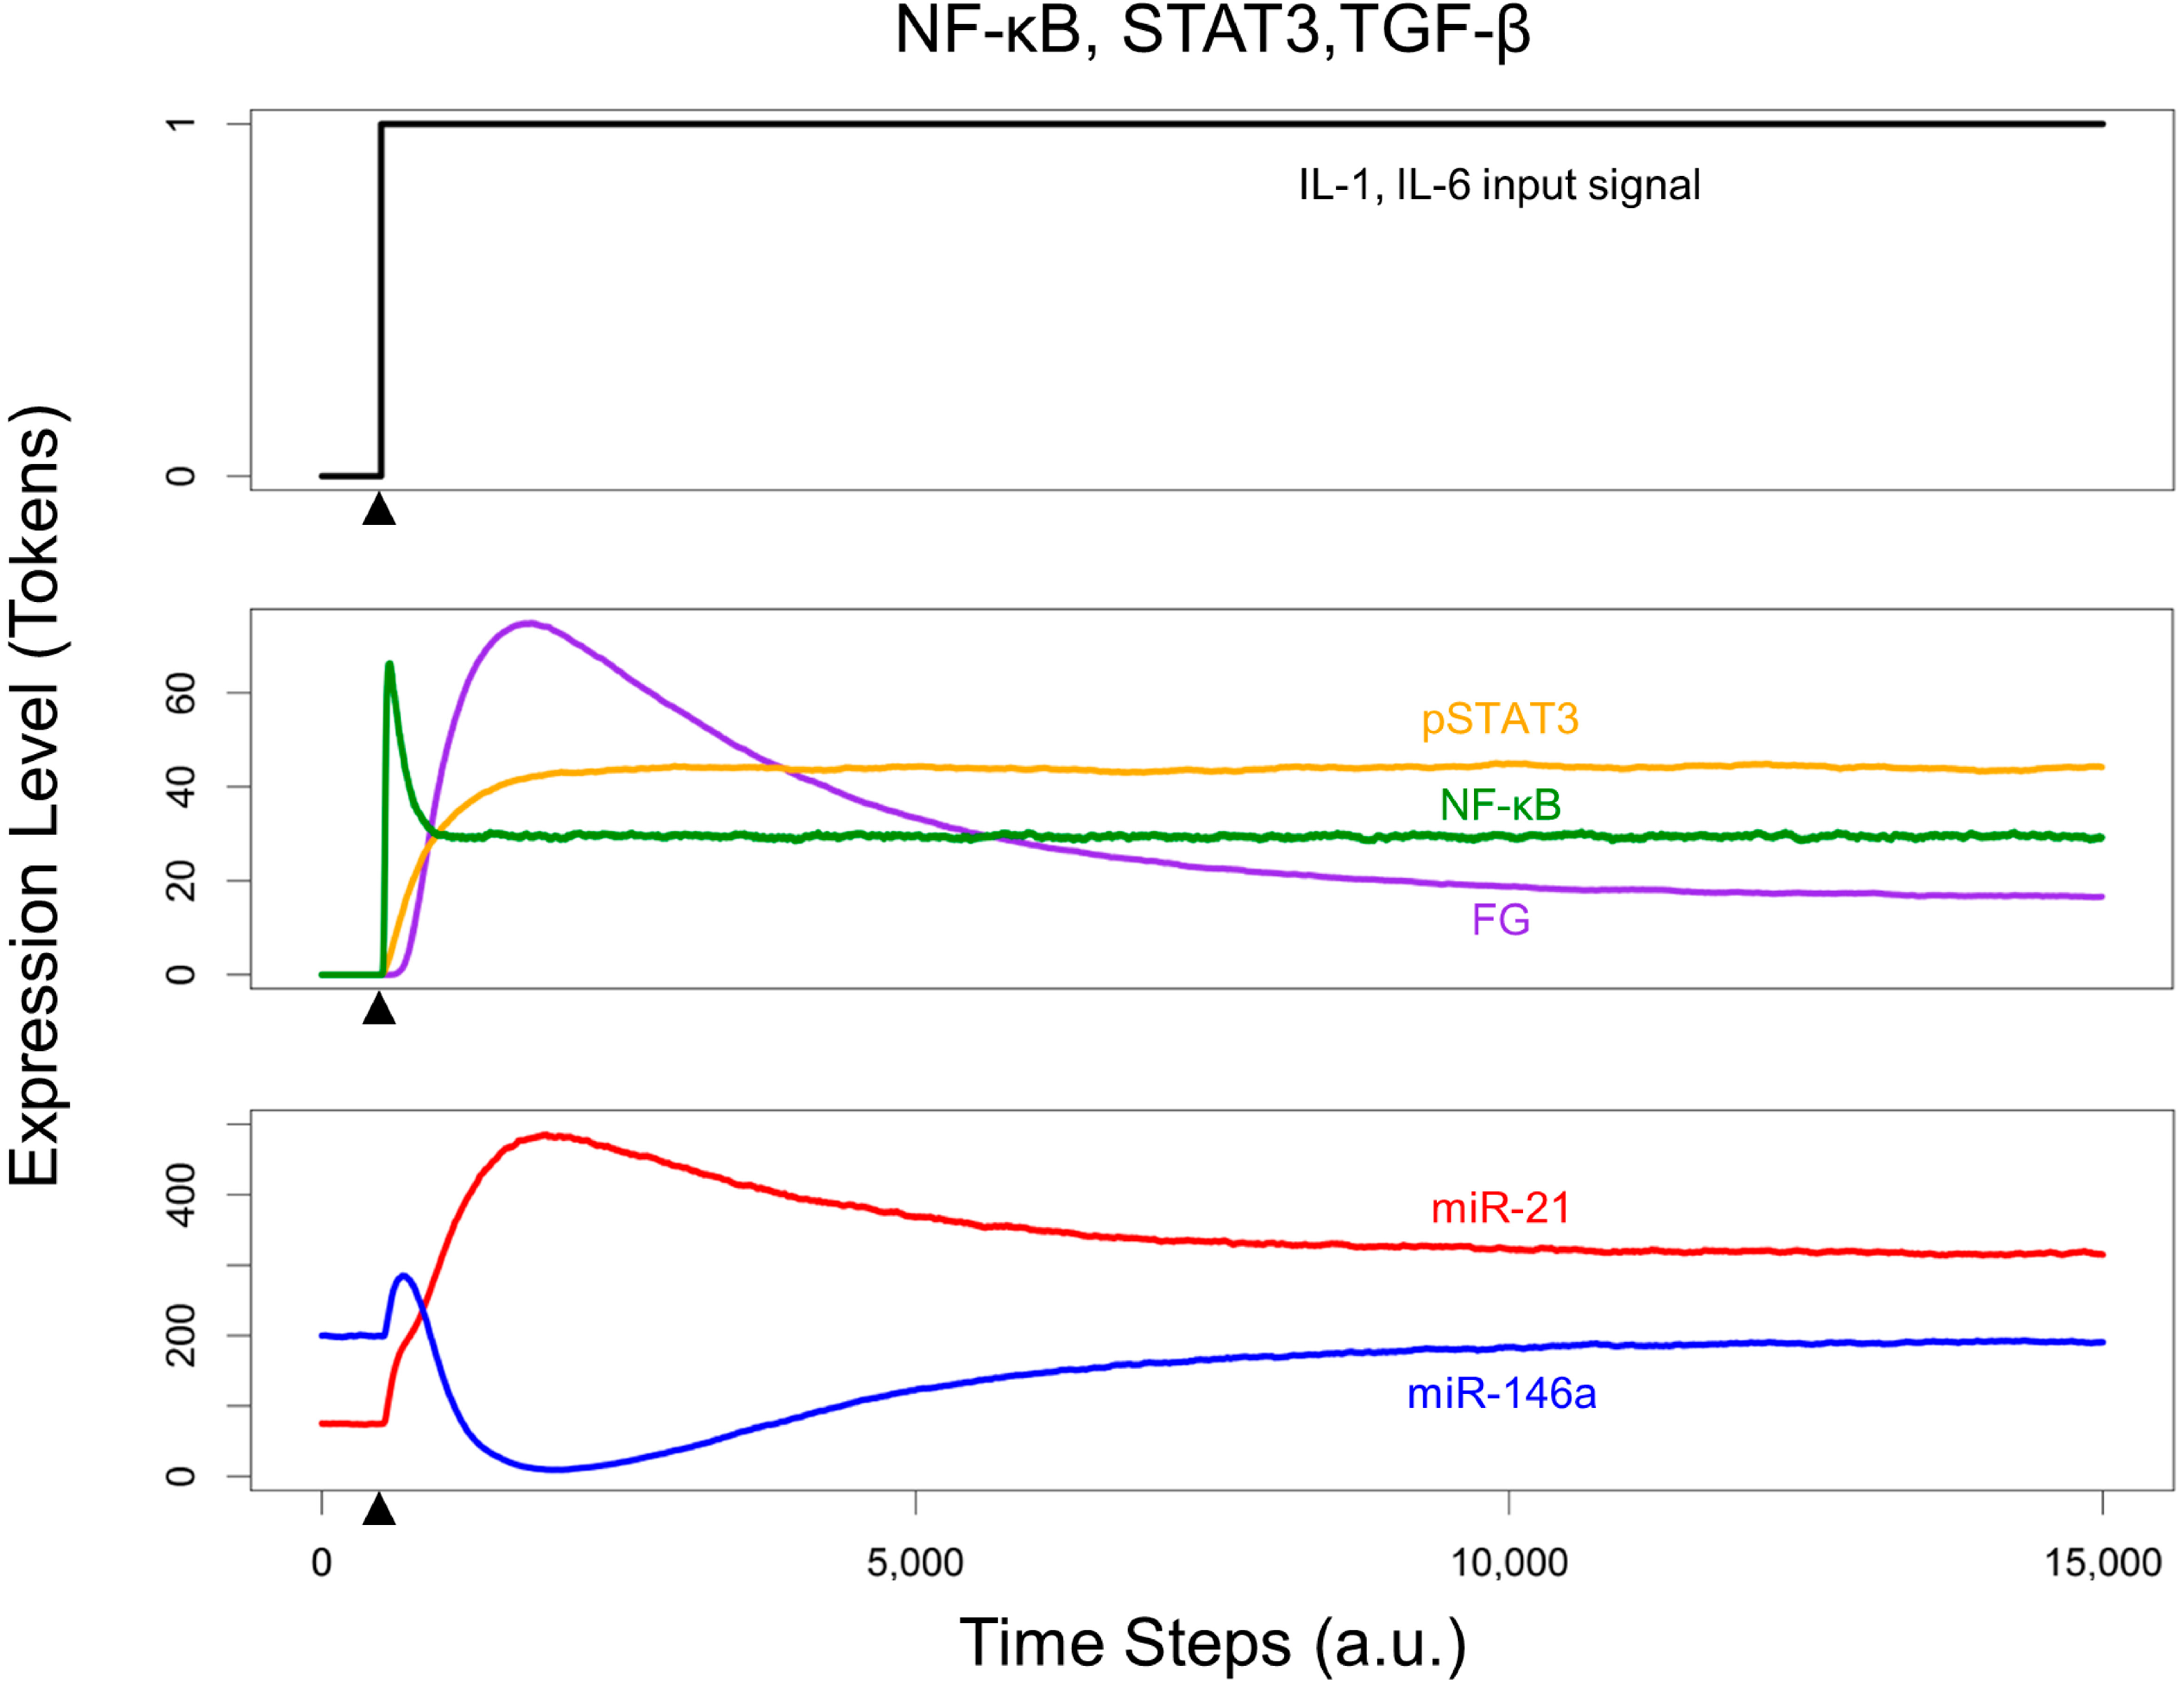
3.3. Crosstalk between Signaling Pathways and Effect on microRNA Levels

Simulations of the integrated network with crosstalk between STAT3 and TGF-β pathway as well as the microRNAs were able to reproduce the expected phenotypic switch of microRNA levels (Figure 5). Our results were consistent with the experimentally observed dynamics of microRNA levels. miR-21 levels showed robust increase upon cytokine stimuli. Following the peak expression, miR-21 levels approached a steady state and were maintained well above baseline expression. However, the initial upregulation of miR-146a due to NF-κB activation was followed by a decline due to the negative regulation mediated by increase in FG levels. Over the course of the simulation, miR-146a expression increased steadily to below baseline levels, closely mimicking the in vitro experimental data on HSC activation [22]. These results emphasized the role of crosstalk between the TGF-β pathway and microRNAs to lead to a pro-fibrogenic activated HSC phenotype.
Our results highlight the relative dynamic contribution of exogenous signaling molecules such as cytokines IL-1 and IL-6 produced by other liver cells, as well as endogenous molecules such as TGF-β produced by HSCs, to the microRNA switch underlying HSC activation.
Figure 5. Dynamics of microRNA and transcription factor expression levels of the integrated model with all three signaling pathways.
Processes 02 00773 g005

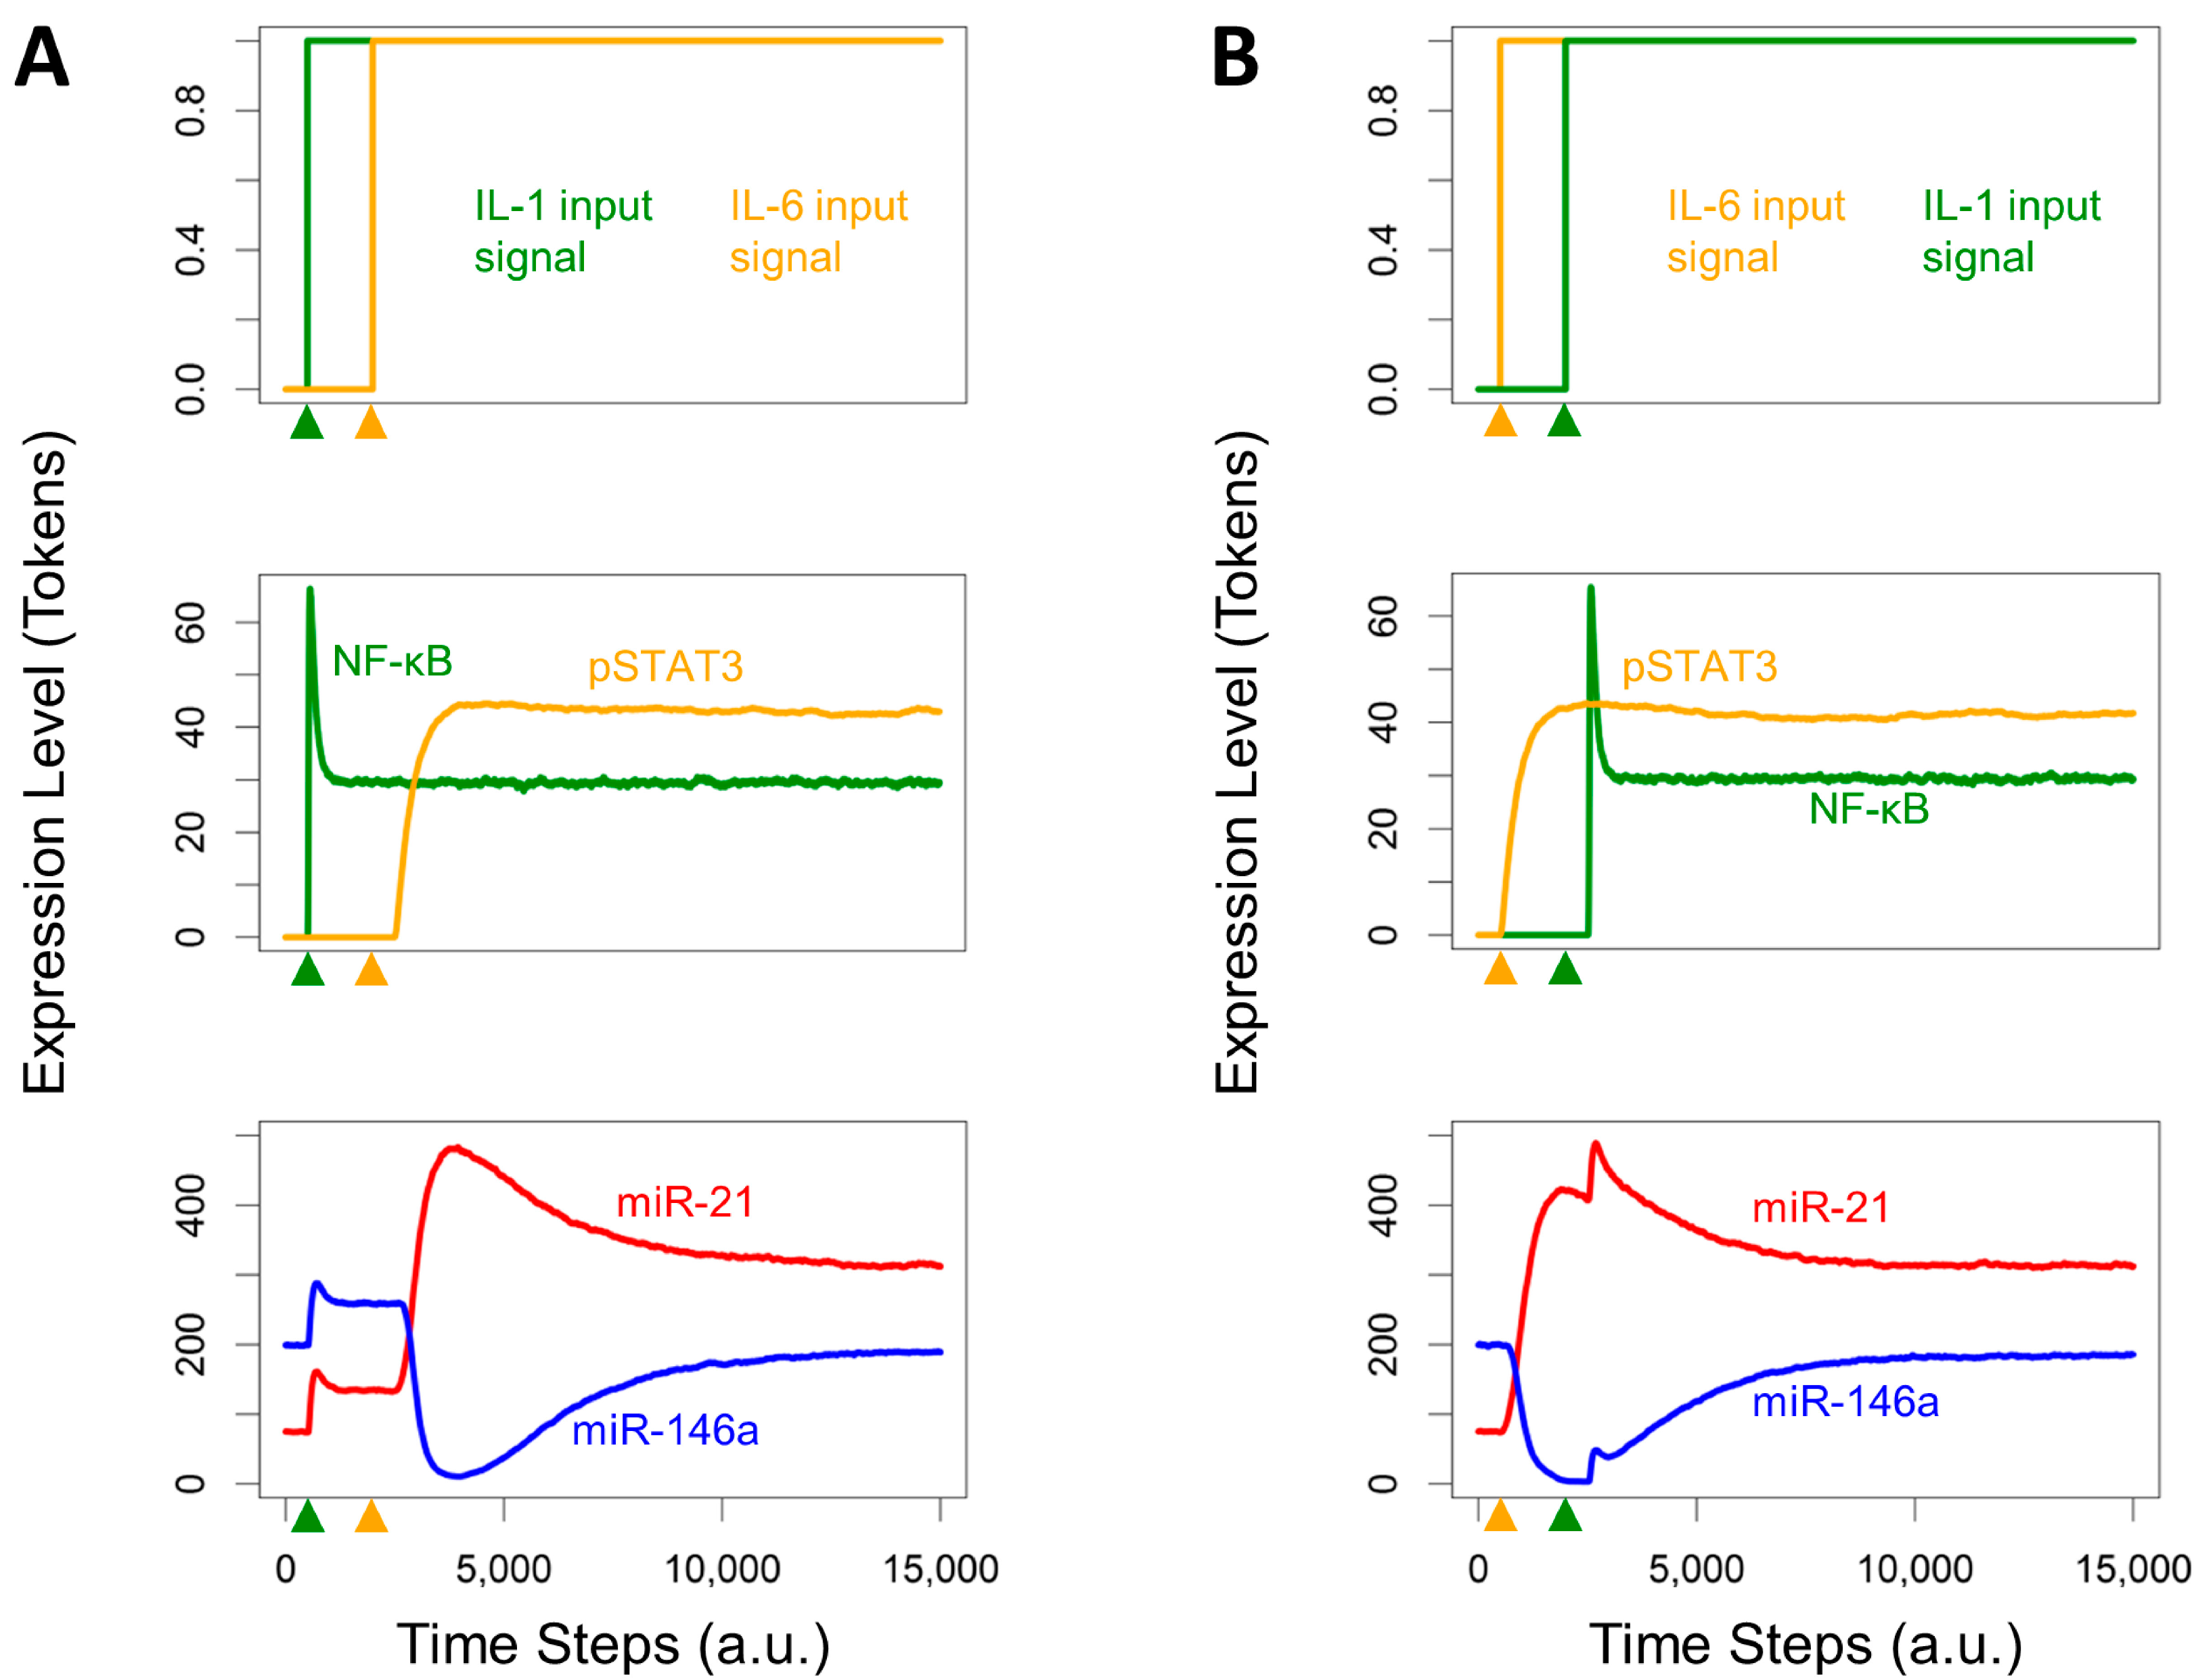
3.4. Effects of Timing Differences in NF-κB and STAT3 Activation

We examined the effect of differential timing in activation of NF-κB and STAT3 pathways on the dynamic regulation of microRNAs. Previous experimental results indicated that NF-κB activation occurs earlier, with activity spiking rapidly before decreasing to a lower steady state, whereas peak STAT3 activation occurs later followed by a steady decline [50]. However, we considered an alternative scenario in which peak NF-κB activation occurred after that of STAT3, which is likely to happen in the case of altered cell–cell signaling interactions, to evaluate the effects on downstream microRNA expression. Our simulation results revealed that earlier NF-κB peak activity than that of STAT3 resulted in an initial transient increase of both miR-146a and miR-21 expression along with a delayed microRNA switch (Figure 6A). Upon STAT3 activation, miR-21 expression levels further increased and miR-146a levels decreased before both reached a steady state. The alternative case of later NF-κB peak activity led to an initial monotonic decrease in miR-146a levels to levels below the baseline expression, and a persistent increase in miR-21 levels (Figure 6B). Both microRNAs showed a slight increase in expression levels upon NF-κB activation, eventually reaching the same steady state levels as the first scenario. These results suggest that the timing of cytokine stimuli is responsible for controlling the initial dynamics of microRNA expression, but does not significantly alter the overall expression profile or steady state levels. Experimental validation of initial microRNA dynamics could provide insight into the physiological relevance of differential cytokine signaling.
Figure 6. Dynamics of microRNA expression levels in response to differential timing of cytokine stimuli. (A) Expression levels with synchronized cytokine production; (B) Expression levels with staggered cytokine production (IL-6 produced before IL-1). Solid arrowheads denote the introduction of input cytokine signals.
Processes 02 00773 g006

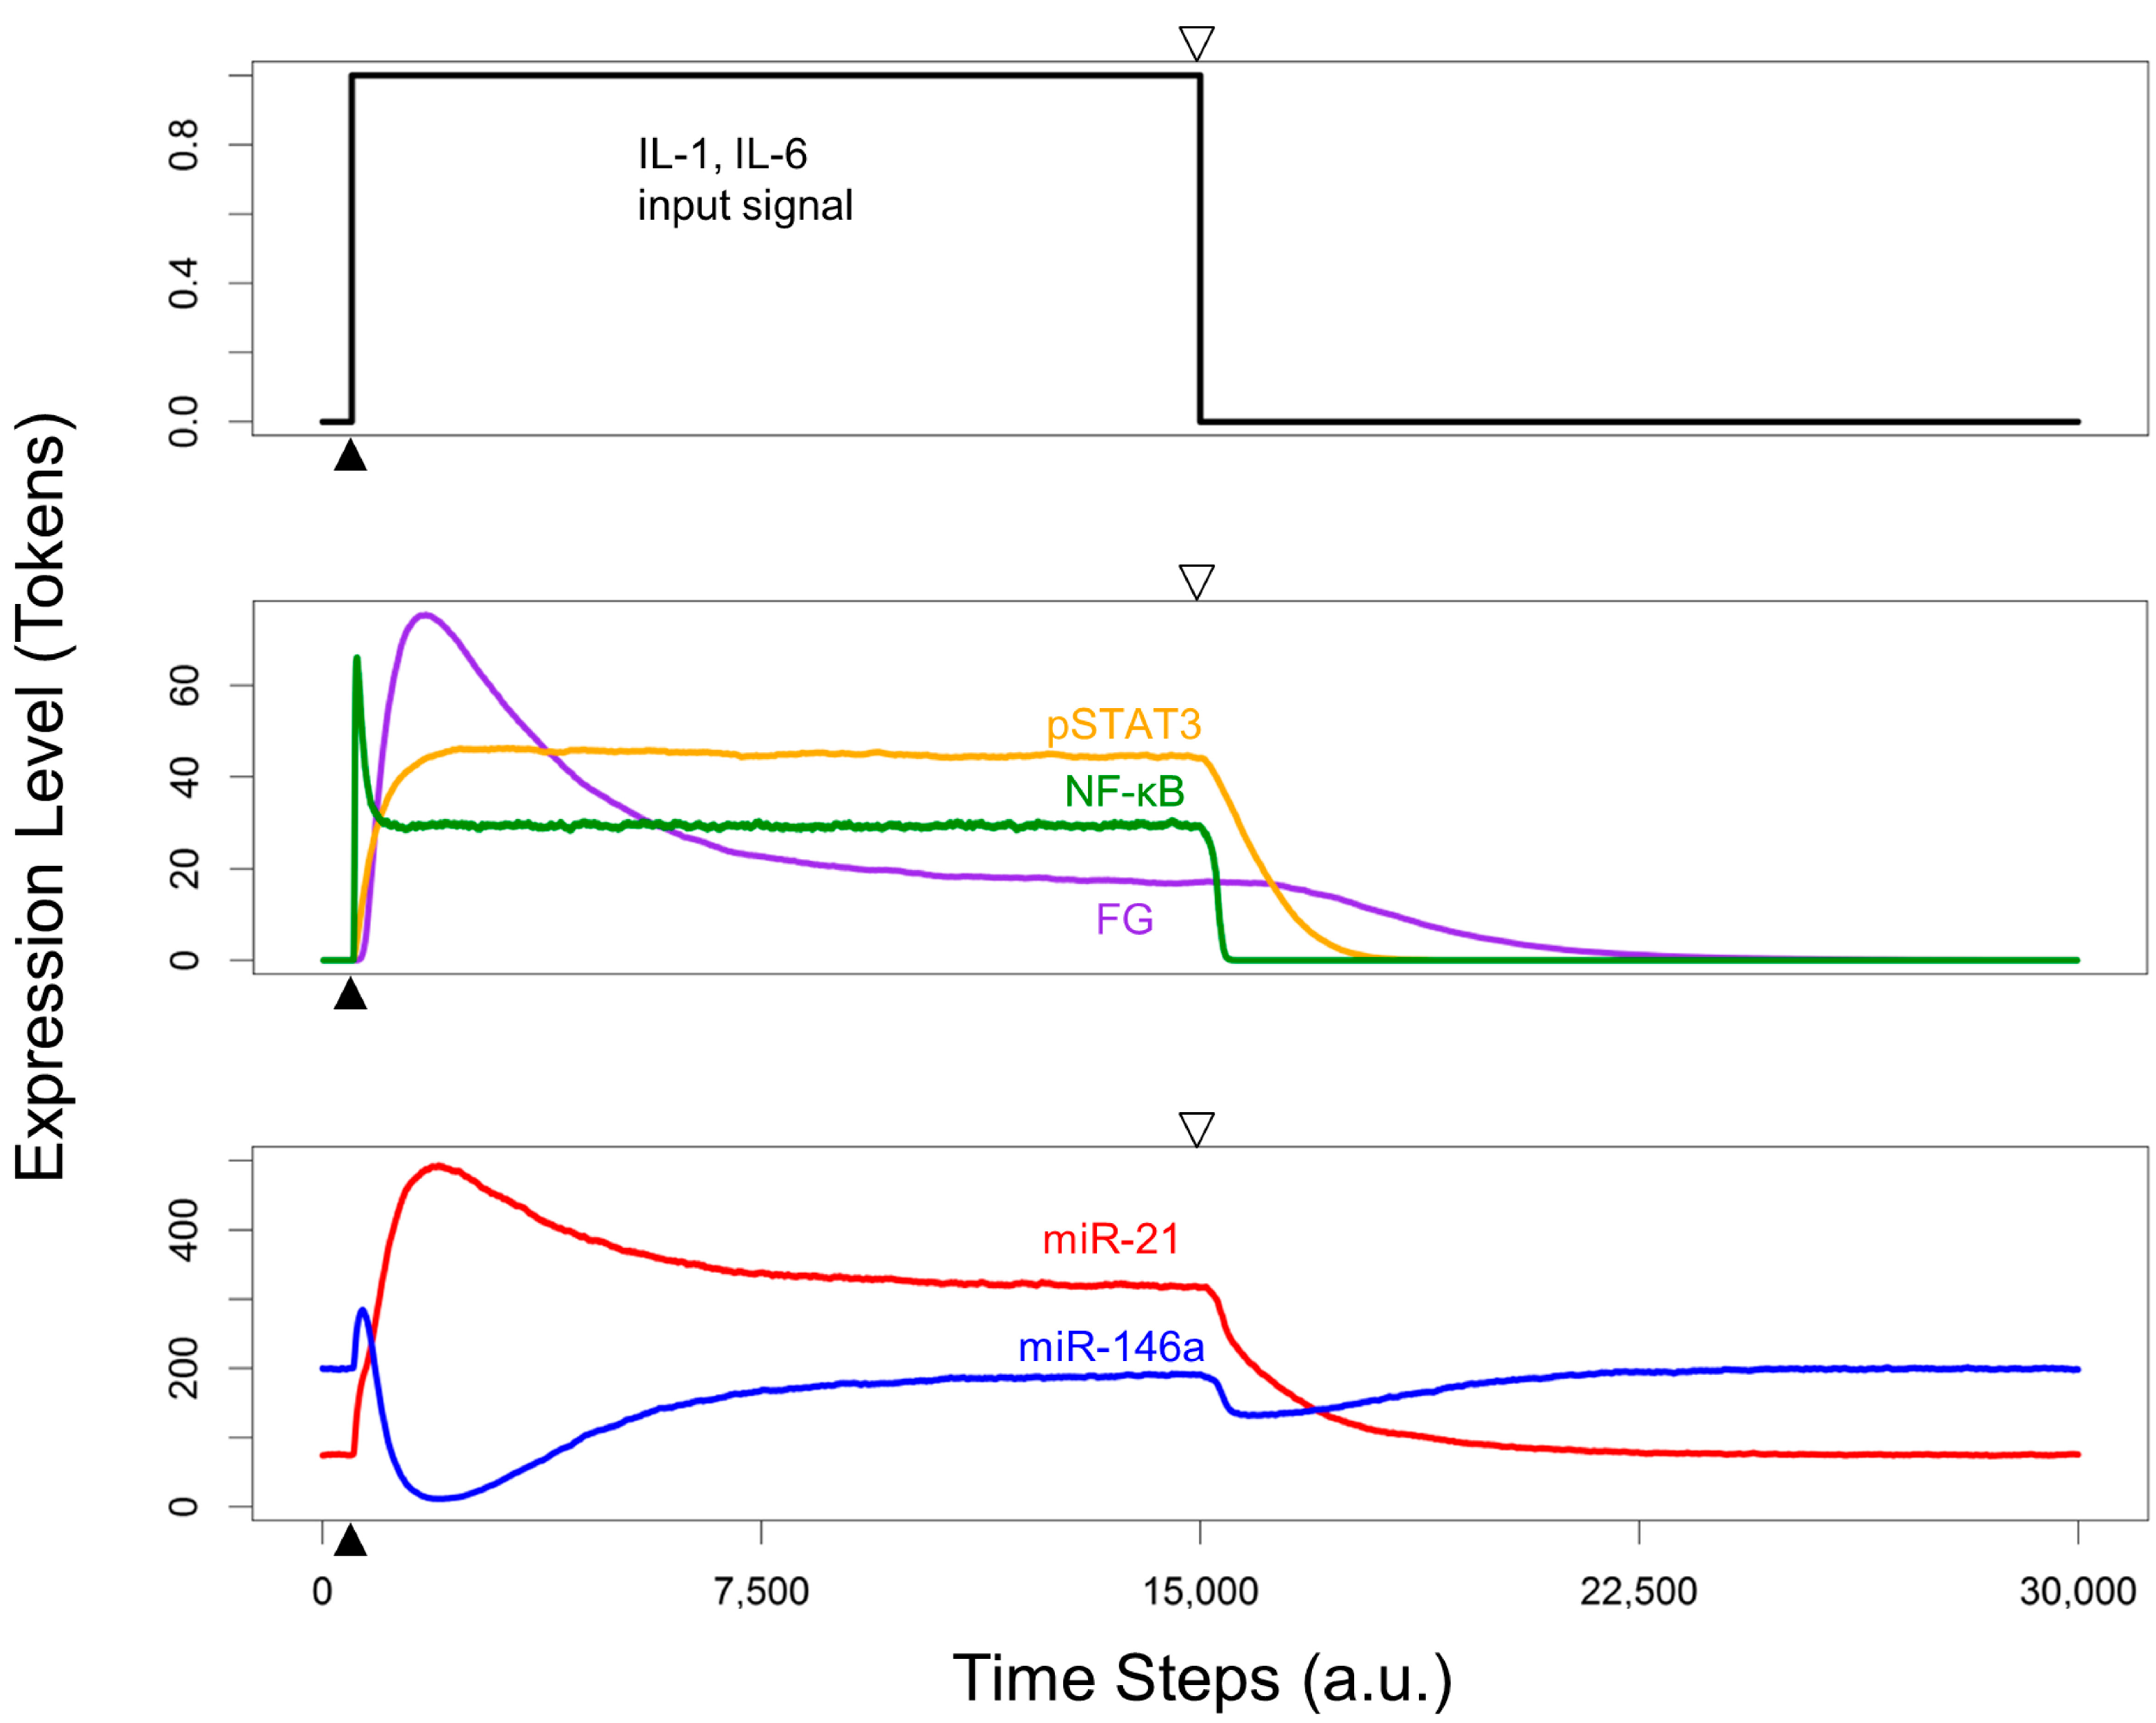
3.5. Re-Quiescence from the Activated HSC State

Finally, we explored the dynamics of microRNAs as the system returned from an activated to a quiescent phenotype. The simulation was allowed to reach an activated state phenotype followed by the termination of cytokine stimuli. During re-quiescence, both miR-146a and miR-21 levels decreased initially due to the rapid decline of NF-κB and STAT3 activity (Figure 7). Unlike miR-21, which steadily decreased to baseline levels as STAT3 and FG activity declines, miR-146a recovered from the drop in expression and eventually returned to baseline levels. Although the miR-146a expression level patterns were similar to those previously observed in vitro by Maubach et al., the return of miR-146a to baseline levels is insufficient to completely restore a quiescent HSC phenotype [22]. This indicates the involvement of additional factors participating in the complex biological process of re-quiescence. Therefore, accounting for additional microRNAs and other pathways regulating the gene expression might be necessary to capture the multi-scale regulation of HSC phenotypes leading to re-quiescence.
Figure 7. Dynamics of microRNA and transcription factor expression levels during re-quiescence. Solid arrowheads denote the introduction of input cytokine signals. Hollow arrowheads denote the cessation of cytokine signals.
Processes 02 00773 g007

4. Conclusions

Activation of HSCs, which relies on a variety of interconnected signaling pathways, plays a critical role in the development of liver fibrosis. There is increasing evidence for the role of microRNAs in regulating the transformation of quiescent into activated HSCs [23]. Although many of the fibrogenic pathways have been previously studied, further investigation is required to better understand the role of crosstalk between pathways and their regulation mediated by the microRNAs. To address this gap in knowledge, we developed a Petri net system-based model to study regulatory interactions between the microRNAs miR-21 and miR-146a that may occur through as yet unknown direct or indirect mechanisms [22,36].
We performed model simulations to test whether known interactions between signaling and microRNAs can explain the differential regulation of miR-21 and miR-146a. Our results indicate that NF-κB and STAT3 signaling pathways are not sufficient to account for the anti-parallel regulation of these microRNAs. Activation of the TGF-β/SMAD pathway by STAT3 also appears to be insufficient to mimic the measured phenotype. Therefore, we introduced a phenomenological relationship between downstream fibrotic genes (FG) and microRNAs into our model as an additional component that upregulated miR-21 expression and downregulated miR-146a expression. The introduction of TGF-β/SMAD pathway-mediated differential microRNA regulation was necessary to induce a switch between microRNA levels. Upon termination of the cytokine stimuli, the system returned to its quiescent state. This ability of HSCs to switch between activated and quiescent states is critical for maintaining proper liver function, and dysregulation of this process can play a role in the development of liver fibrosis.
Timing of the activation of cytokines plays a significant role in the activation of inflammatory markers during liver regeneration. It is known that timing of cytokine signaling in HSCs is dependent on the type of damage. NF-κB and STAT3 pathways are likely to be activated simultaneously in the case of damage due to infection or alcohol intake. In contrast, in the case of drug-induced liver injury and liver regeneration, IL-1 stimulus is known to precede the IL-6-dependent activation of STAT3 pathway [51]. Cytokine signaling in HSCs is the result of paracrine factors from other cells, and the timing of cell communication can determine HSC response to injury. In order to determine how differential activation of cytokine stimuli influences the dynamics of microRNA expression, we analyzed two possible scenarios. These are primarily applicable to the whole liver tissue, however testing these possibilities for HSCs using our model can lead to predictions reconciling the potential difference in temporal relationships between the activation of NF-κB and STAT3 pathways in in vivo vs. in vitro conditions. Our results show that the relative timing between cytokine stimuli in HSCs alters the initial dynamics of microRNA expression. Earlier activation of NF-κB resulted in an initial transient increase in expression of both microRNAs, whereas later activation of NF-κB versus STAT3 resulted in an initial monotonic decrease in miR-146a while miR-21 gradually increased and reach steady state levels.
There is a paucity of evidence in the literature regarding the kinetics of HSC activation. We have used empirical kinetic approximations in order to bridge this gap in knowledge. For parameters, we relied on a range of values obtained from previous modeling studies. However, most of our kinetic parameters were derived through an iterative process. This approach provided us with responses that qualitatively matched the expected kinetics. However, a formal global sensitivity analysis will enable us to fine-tune the model parameters to develop more accurate HSC specific predictions [52]. We believe that such a model based on the HSC specific biology can lead to testable hypothesis on HSC activation that can be validated by experiments. For example, the use of exogenous cytokines for in vitro studies has been previously reported for HSCs, and could be easily adapted to investigate the possible role of cell–cell communication in microRNA expression dynamics using HSC cultures [53]. Briefly, the cells would be pre-treated with IL-1 or IL-6, followed by addition of the alternate cytokine at a later time point, and microRNA levels would be quantified over this time series. Upregulation of microRNAs can be accomplished by addition of a precursor for the microRNA of interest, and could help determine, for example, the effect of miR-146a overexpression on re-quiescence [43]. In addition to overexpression, knockout studies can be utilized both in vitro and in vivo to investigate the role of key components in HSC activation. For example, transfection of cultured HSCs with anti-miR sequences or siRNA against a gene can be used to investigate the relative importance of specific microRNAs and genes in HSC activation, as well as the consequences of their removal. This could be used to determine whether or not, for instance, TGF-β or miR-21 is necessary for HSC activation. These studies can be expanded to include transgenic knockout models, in the case of gene targets, or with the introduction of anti-miR pharmacological compounds, e.g., Vivo-Morpholino [43]. In order to study the effects of these changes in activated HSCs, it is important to ensure that the cells achieve total differentiation from the quiescent state. To this end, it has been reported that HSCs require a stiff culture environment in order to undergo activation [54]. However, it is not entirely clear how the biomechanical aspects specifically regulate signaling pathways and microRNAs considered in the present model.
Our model accounts for a representative marker of HSC activation representing the switch in miR-21 and miR-146a levels, and can be expanded to consider additional mechanisms of microRNA regulation of target genes, e.g., transcriptional degradation versus translational repression. Further avenues for model expansion include incorporation of co-regulated microRNAs as well as signaling and metabolic pathways involved in HSC activation and re-quiescence [2,22]. Our model provides a new computational platform for studying HSC activation and the mechanisms where microRNAs act as fine-tuning markers modulating the system behavior, thereby contributing to potential therapeutic approaches.

Acknowledgments

Financial support for this study was provided by National Institutes of Health grants from National Institute on Alcohol Abuse and Alcoholism R01 AA018873, R21 AA022417, T32 AA007463. L.K. and A.P. acknowledge Daniel Cook for help in formulating the Introduction and Hiren Makadia for helpful discussion on model development.

Author Contributions

Lakshmi Kuttippurathu constructed the model and contributed to model implementation, analysis, and discussion; Austin Parrish implemented the model, and contributed to the analysis and discussion; Rajanikanth Vadigepalli designed the study and initial model, contributed to manuscript writing, and oversaw all aspects of the research.

Appendix

A detailed list of the equations used in our Petri net model, as well as graphical views of the simulated pathways, are presented here.
Table A1. Table of all reactions modeled in the Petri net system using either mass action or Michaelis-Menten kinetics, along with their respective parameters.
ReactionEquationParameters
IL-1/IL-1R associationk1[IL1][IL1R]k1 = 0.001
IL-1/IL-1R dissociation Processes 02 00773 i001 Processes 02 00773 i002
IL-1 degradationk2[IL1]k2 = 0.001
IL-1/IL-1R degradationk3[IL1/IL1R]k3 = 0.01
PELI1/TRAF6 activationk4[IL1/IL1R] − k5[miR21] − k6[miR146a]k4 = 0.5
k5 = 0.01
k6 = 0.01
PELI1/TRAF6 degradationk7[PELI1/TRAF6]k7 = 0.1
NF-κBinactive productionk8k8 = 0.3
NF-κB activation Processes 02 00773 i003v1 = 0.5
k9 = 100
NF-κBinactive degradationk10[NFκBinactive]k10 = 0.003
NF-κBactive inactivationk11[NFκBactive]k11 = 0.1
NF-κBactive degradationk12[NFκBactive]k12 = 0.01
IL-6/IL-6R associationk13[IL6][IL6R]k13 = 0.001
IL-6/IL-6R dissociation Processes 02 00773 i004 Processes 02 00773 i005
IL-6 degradationk14[IL6]k14 = 0.001
IL-6/IL-6R degradationk15[IL6/IL6R]k15 = 0.01
STAT3 phosphorylation Processes 02 00773 i006v2 = 0.008
k16 = 50
k17 = 3
STAT3 productionk18k18 = 0.08
STAT3 degradationk19[STAT3]k19 = 0.0008
pSTAT3 degradation Processes 02 00773 i007v3 = 0.025
k20 = 0.00007
SOCS3 production Processes 02 00773 i008v4 = 0.1
k21 = 0.00007
SOCS3 degradationk22[SOCS3]k22 = 0.001
TGF-β productionk23[pSTAT3]k23 = 0.04
TGF-β degradationk24[TGFβ]k24 = 0.001
TGF-β/TβR1 association k25[TGFβ][TβRI] k25 = 0.001
TGF-β/TβR1 dissociation Processes 02 00773 i009 Processes 02 00773 i010
TGF-β/TβR1 degradation k26[TGFβ/TβRI] + k27[SMAD7/SMURF2] k26 = 0.01
k27 = 0.1
SMAD2 productionk28k28 = 0.01
SMAD2 degradationk29[SMAD2]k29 = 0.0001
SMAD2 phosphorylation Processes 02 00773 i011v5 = 10
k30 = 5000
k31 = 0.01
SMAD2 dephosphorylation Processes 02 00773 i012v6 = 0.001
k32 = 5000
pSMAD2 degradationk33[pSMAD2]k33 = 0.0005
SMAD4 productionk34k35[miR146a]k34 = 0.024
k35 = 0.00008
SMAD4 degradationk36[SMAD4]k36 = 0.0001
pSMAD2/SMAD4 associationk37[pSMAD2]2[SMAD4]k37 = 0.0005
pSMAD2/SMAD4 dissociation Processes 02 00773 i013 Processes 02 00773 i014
pSMAD2/SMAD4 degradationk38[pSMAD2/SMAD4]k38 = 0.01
SMAD7 productionk39 + k40[pSMAD2/SMAD4] − k41[miR21]k39 = 0.057
k40 = 0.003
k41 = 0.0001
SMAD7 degradationk42[SMAD7]k42 = 0.001
SMURF2 productionk43 + k44[pSMAD2/SMAD4]k43 = 0.05
k44 = 0.003
SMURF2 degradationk45[SMURF2]k45 = 0.001
SMAD7/SMURF2 associationk46[SMAD7][SMURF2]k46 = 2.9
SMAD7/SMURF2 dissociation Processes 02 00773 i015 Processes 02 00773 i016
SMAD7/SMURF2 degradationk47[SMAD7/SMURF2]k47 = 0.008
FG productionk48[pSMAD2/SMAD4]k48 = 0.03
FG degradationk49[FG]k49 = 0.0005
miR-21 activationk50 + k51[NFκBactive ] + k52[pSTAT3] + k53[FG]k50 = 0.75
k51 = 0.02
k52 = 0.03
k53 = 0.03
miR-146a activationk54 + k55[NFκBactive ] − k56[FG]k54 = 2
k55 = 0.02
k56 = 0.04
miR-21 degradationk57[miR21]k57 = 0.01
miR-146a degradationk58[miR146a]k58 = 0.01
Figure A1. Schematic (A) and Petri net (B) representations of the IL-1/NF-κB network simulated in Figure 4A.
Processes 02 00773 g008
Figure A2. Schematic (A) and Petri net (B) representations of the IL-1/NF-κB and IL-6/STAT3 network simulated in Figure 4B.
Processes 02 00773 g009
Figure A3. Schematic (A) and Petri net (B) representations of the model simulated in Figure 5, excluding the fibrotic gene (FG) node.
Processes 02 00773 g010

Conflicts of Interest

The authors declare no conflict of interest.

References

  1. Bataller, R.; Brenner, D. Liver fibrosis. J. Clin. Investig. 2005, 115, 209–218. [Google Scholar] [CrossRef]
  2. Friedman, S. Hepatic stellate cells: Protean, multifunctional, and enigmatic cells of the liver. Physiol. Rev. 2008, 88, 125–172. [Google Scholar] [CrossRef]
  3. Hendriks, H.; Verhoofstad, W. Perisinusoidal fat-storing cells are the main vitamin A storage sites in rat liver. Exp. Cell Res. 1985, 160, 138–149. [Google Scholar] [CrossRef]
  4. Paik, Y.-H.; Lee, K.S.; Lee, H.J.; Yang, K.M.; Lee, S.J.; Lee, D.K.; Han, K.-H.; Chon, C.Y.; Lee, S.I.; Moon, Y.M.; Brenner, D.A. Hepatic stellate cells primed with cytokines upregulate inflammation in response to peptidoglycan or lipoteichoic acid. Lab. Invest. 2006, 86, 676–686. [Google Scholar] [CrossRef]
  5. Paik, Y.-H.; Schwabe, R.F.; Bataller, R.; Russo, M.P.; Jobin, C.; Brenner, D.A. Toll-like receptor 4 mediates inflammatory signaling by bacterial lipopolysaccharide in human hepatic stellate cells. Hepatology 2003, 37, 1043–1055. [Google Scholar] [CrossRef]
  6. Maher, J.J. Cell-specific expression of hepatocyte growth factor in liver. J. Clin. Invest. 1993, 91, 2244–2252. [Google Scholar] [CrossRef]
  7. Malik, R.; Selden, C.; Hodgson, H. The role of non-parenchymal cells in liver growth. Semin. Cell Dev. Biol. 2002, 13, 425–431. [Google Scholar] [CrossRef]
  8. Mullhaupt, B.; Feren, A.; Fodor, E.; Jones, A. Liver expression of epidermal growth factor RNA. Rapid increases in immediate-early phase of liver regeneration. J. Biol. Chem. 1994, 2883, 19667–19670. [Google Scholar]
  9. Yin, C.; Evason, K.J.; Asahina, K.; Stainier, D.Y.R. Hepatic stellate cells in liver development, regeneration, and cancer. J. Clin. Invest. 2013, 123, 1902–1910. [Google Scholar] [CrossRef]
  10. Xu, M.-Y.; Hu, J.-J.; Shen, J.; Wang, M.-L.; Zhang, Q.-Q.; Qu, Y.; Lu, L.-G. Stat3 signaling activation crosslinking of TGF-β1 in hepatic stellate cell exacerbates liver injury and fibrosis. Biochim. Biophys. Acta 2014, 1842, 2237–2245. [Google Scholar] [CrossRef]
  11. Hellerbrand, C.; Jobin, C.; Licato, L.L.; Sartor, R.B.; Brenner, D.A. Cytokines induce NF-κB in activated but not in quiescent rat hepatic stellate cells. Am. J. Physiol. 1998, 275, G269–G278. [Google Scholar]
  12. Gieling, R.G.; Wallace, K.; Han, Y.-P. Interleukin-1 participates in the progression from liver injury to fibrosis. Am. J. Physiol. Gastrointest. Liver Physiol. 2009, 296, G1324–G1331. [Google Scholar] [CrossRef]
  13. Yoshida, K.; Matsuzaki, K. Differential regulation ofTGF-β/Smad signaling in hepatic stellate cells between acute and chronic liver injuries. Front. Physiol. 2012, 3, 1–7. [Google Scholar] [CrossRef]
  14. Tahashi, Y.; Matsuzaki, K.; Date, M.; Yoshida, K.; Furukawa, F.; Sugano, Y.; Matsushita, M.; Himeno, Y.; Inagaki, Y.; Inoue, K. Differential regulation of TGF-beta signal in hepatic stellate cells between acute and chronic rat liver injury. Hepatology 2002, 35, 49–61. [Google Scholar] [CrossRef]
  15. Shigekawa, M.; Takehara, T.; Kodama, T.; Hikita, H.; Shimizu, S.; Li, W.; Miyagi, T.; Hosui, A.; Tatsumi, T.; Ishida, H.; et al. Involvement of STAT3-regulated hepatic soluble factors in attenuation of stellate cell activity and liver fibrogenesis in mice. Biochem. Biophys. Res. Commun. 2011, 406, 614–620. [Google Scholar] [CrossRef]
  16. Tsukamoto, H. Cytokine regulation of hepatic stellate cells in liver fibrosis. Alcohol. Clin. Exp. Res. 1999, 23, 911–916. [Google Scholar] [CrossRef]
  17. Kerr, T.A.; Korenblat, K.M.; Davidson, N.O. MicroRNAs and liver disease. Transl. Res. 2011, 157, 241–252. [Google Scholar] [CrossRef]
  18. Ji, J.; Zhang, J.; Huang, G.; Qian, J.; Wang, X.; Mei, S. Over-expressed microRNA-27a and 27b influence fat accumulation and cell proliferation during rat hepatic stellate cell activation. FEBS Lett. 2009, 583, 759–766. [Google Scholar] [CrossRef]
  19. Guo, C.-J.; Pan, Q.; Li, D.-G.; Sun, H.; Liu, B.-W. miR-15b and miR-16 are implicated in activation of the rat hepatic stellate cell: An essential role for apoptosis. J. Hepatol. 2009, 50, 766–778. [Google Scholar] [CrossRef]
  20. Sekiya, Y.; Ogawa, T.; Yoshizato, K.; Ikeda, K.; Kawada, N. Suppression of hepatic stellate cell activation by microRNA-29b. Biochem. Biophys. Res. Commun. 2011, 412, 74–79. [Google Scholar] [CrossRef]
  21. Guo, C.J.; Pan, Q.; Cheng, T.; Jiang, B.; Chen, G.Y.; Li, D.G. Changes in microRNAs associated with hepatic stellate cell activation status identify signaling pathways. FEBS J. 2009, 276, 5163–5176. [Google Scholar] [CrossRef]
  22. Maubach, G.; Chin, M.; Lim, C.; Chen, J.; Yang, H.; Zhuo, L. miRNA studies in in vitro and in vivo activated hepatic stellate cells. World J. Gastroenterol. 2011, 17, 2748–2773. [Google Scholar]
  23. Huang, J.; Yu, X.; Fries, J.W.U.; Zhang, L.; Odenthal, M. MicroRNA function in the profibrogenic interplay upon chronic liver disease. Int. J. Mol. Sci. 2014, 15, 9360–9371. [Google Scholar] [CrossRef]
  24. Zhang, Z.; Zha, Y.; Hu, W.; Huang, Z.; Gao, Z.; Zang, Y.; Chen, J.; Dong, L.; Zhang, J. The autoregulatory feedback loop of MicroRNA-21/programmed cell death protein 4/Activation protein-1 (MiR-21/PDCD4/AP-1) as a driving force for hepatic fibrosis development. J. Biol. Chem. 2013, 288, 37082–37093. [Google Scholar] [CrossRef]
  25. Jiang, X.; Tsitsiou, E.; Herrick, S.E.; Lindsay, M.A. MicroRNAs and the regulation of fibrosis. FEBS J. 2010, 277, 2015–2021. [Google Scholar] [CrossRef]
  26. Liang, G.; Li, G.; Wang, Y.; Lei, W.; Xiao, Z. Aberrant miRNA expression response to UV irradiation in human liver cancer cells. Mol. Med. Rep. 2014, 9, 904–910. [Google Scholar]
  27. Karakatsanis, A.; Papaconstantinou, I.; Gazouli, M.; Lyberopoulou, A.; Polymeneas, G.; Voros, D. Expression of microRNAs, miR-21, miR-31, miR-122, miR-145, miR-146a, miR-200c, miR-221, miR-222, and miR-223 in patients with hepatocellular carcinoma or intrahepatic cholangiocarcinoma and its prognostic significance. Mol. Carcinog. 2013, 52, 297–303. [Google Scholar] [CrossRef]
  28. Rosato, P.; Anastasiadou, E.; Garg, N.; Lenze, D.; Boccellato, F.; Vincenti, S.; Severa, M.; Coccia, E.M.; Bigi, R.; Cirone, M.; et al. Differential regulation of miR-21 and miR-146a by Epstein-Barr virus-encoded EBNA2. Leukemia 2012, 26, 2343–2352. [Google Scholar] [CrossRef]
  29. Marquez, R.T.; Wendlandt, E.; Galle, C.S.; Keck, K.; Mccaffrey, A.P. MicroRNA-21 is upregulated during the proliferative phase of liver regeneration, targets Pellino-1, and inhibits NF-κB signaling. Am. J. Physiol. Gastrointest. Liver Physiol. 2010, 298, 535–541. [Google Scholar] [CrossRef]
  30. Taganov, K.; Boldin, M. NF-κB-dependent induction of microRNA miR-146, an inhibitor targeted to signaling proteins of innate immune responses. Proc. Natl. Acad. Sci. USA 2006, 103, 12481–12486. [Google Scholar] [CrossRef]
  31. Petri, C. Kommunikation mit Automaten; Technische Universität Darmstadt: Darmstadt, Germany, 1962; p. 128. [Google Scholar]
  32. Rohr, C.; Marwan, W.; Heiner, M. Snoopy—A unifying Petri net framework to investigate biomolecular networks. Bioinformatics 2010, 26, 974–975. [Google Scholar] [CrossRef]
  33. Chung, S.-W.; Miles, F.L.; Sikes, R.A.; Cooper, C.R.; Farach-Carson, M.C.; Ogunnaike, B.A. Quantitative modeling and analysis of the transforming growth factor beta signaling pathway. Biophys. J. 2009, 96, 1733–1750. [Google Scholar] [CrossRef]
  34. Furchtgott, L.A.; Chow, C.C.; Periwal, V. A model of liver regeneration. Biophys. J. 2009, 96, 3926–3935. [Google Scholar] [CrossRef]
  35. Wegner, K.; Bachmann, A.; Schad, J.-U.; Lucarelli, P.; Sahle, S.; Nickel, P.; Meyer, C.; Klingmüller, U.; Dooley, S.; Kummer, U. Dynamics and feedback loops in the transforming growth factor β signaling pathway. Biophys. Chem. 2012, 162, 22–34. [Google Scholar] [CrossRef]
  36. Dippold, R.P.; Vadigepalli, R.; Gonye, G.E.; Hoek, J.B. Chronic ethanol feeding enhances miR-21 induction during liver regeneration while inhibiting proliferation in rats. Am. J. Physiol. Gastrointest. Liver Physiol. 2012, 303, G733–G743. [Google Scholar] [CrossRef]
  37. Elsharkawy, A.M.; Mann, D.A. Nuclear factor-κB and the hepatic inflammation-fibrosis-cancer axis. Hepatology 2007, 46, 590–597. [Google Scholar] [CrossRef]
  38. Lee, K.S.; Buck, M.; Houglum, K.; Chojkier, M. Activation of Hepatic Stellate Cells by TGFa and Collagen Type I Is Mediated by Oxidative Stress Through c-myb Expression. J. Clin. Invest. 1995, 96, 2461–2468. [Google Scholar] [CrossRef]
  39. Jiang, Z.; Johnson, H.J.; Nie, H.; Qin, J.; Bird, T.A.; Li, X. Pellino 1 is required for interleukin-1 (IL-1)-mediated signaling through its interaction with the IL-1 receptor-associated kinase 4 (IRAK4)-IRAK-tumor necrosis factor receptor-associated factor 6 (TRAF6) complex. J. Biol. Chem. 2003, 278, 10952–10956. [Google Scholar] [CrossRef]
  40. He, G.; Karin, M. NF-κB and STAT3—Key players in liver inflammation and cancer. Cell Res. 2011, 21, 159–168. [Google Scholar] [CrossRef]
  41. Iliopoulos, D.; Jaeger, S.A.; Hirsch, H.A.; Bulyk, M.L.; Struhl, K. STAT3 activation of miR-21 and miR-181b-1 via PTEN and CYLD are part of the epigenetic switch linking inflammation to cancer. Mol. Cell 2010, 39, 493–506. [Google Scholar] [CrossRef]
  42. Wang, H.; Lafdil, F.; Kong, X.; Gao, B. Signal transducer and activator of transcription 3 in liver diseases: A novel therapeutic target. Int. J. Biol. Sci. 2011, 7, 536–550. [Google Scholar] [CrossRef]
  43. Francis, H.; McDaniel, K.; Han, Y.; Liu, X.; Kennedy, L.; Yang, F.; McCarra, J.; Zhou, T.; Glaser, S.; Venter, J.; et al. Regulation of the extrinsic apoptotic pathway by microRNA-21 in alcoholic liver injury. J. Biol. Chem. 2014. [Google Scholar] [CrossRef]
  44. Marquez, R.T.; Bandyopadhyay, S.; Wendlandt, E.B.; Keck, K.; Hoffer, B.A.; Icardi, M.S.; Christensen, R.N.; Schmidt, W.N.; McCaffrey, A.P. Correlation between microRNA expression levels and clinical parameters associated with chronic hepatitis C viral infection in humans. Lab. Invest. 2010, 90, 1727–1736. [Google Scholar] [CrossRef]
  45. He, Y.; Huang, C.; Sun, X.; Long, X.; Lv, X.; Li, J. MicroRNA-146a modulates TGF-beta1-induced hepatic stellate cell proliferation by targeting SMAD4. Cell. Signal. 2012, 24, 1923–1930. [Google Scholar] [CrossRef]
  46. Yoshida, K.; Murata, M.; Yamaguchi, T.; Matsuzaki, K. TGF-β/Smad signaling during hepatic fibro-carcinogenesis (Review). Int. J. Oncol. 2014, 45, 1363–1371. [Google Scholar]
  47. Hayashi, H.; Abdollah, S.; Qiu, Y.; Cai, J.; Xu, Y.Y.; Grinnell, B.W.; Richardson, M.A.; Topper, J.N.; Gimbrone, M.A.; Wrana, J.L.; et al. The MAD-related protein Smad7 associates with the TGFbeta receptor and functions as an antagonist of TGFbeta signaling. Cell 1997, 89, 1165–1173. [Google Scholar] [CrossRef]
  48. Yan, X.; Liu, Z.; Chen, Y. Regulation of TGF- b signaling by Smad7 Overview of TGF-b Signaling Pathways. Acta Biochim. Biophys. Sin. (Shanghai) 2009, 41, 263–272. [Google Scholar] [CrossRef]
  49. Davis, B.N.; Hilyard, A.C.; Lagna, G.; Hata, A. SMAD proteins control DROSHA-mediated microRNA maturation. Nature 2008, 454, 56–61. [Google Scholar] [CrossRef]
  50. Salazar-Montes, A.; Ruiz-Corro, L.; Sandoval-Rodriguez, A.; Lopez-Reyes, A.; Armendariz-Borunda, J. Increased DNA binding activity of NF-kappaB, STAT-3, SMAD3 and AP-1 in acutely damaged liver. World J. Gastroenterol. 2006, 12, 5995–6001. [Google Scholar]
  51. Kurinna, S.; Barton, M.C. Cascades of transcription regulation during liver regeneration. Int. J. Biochem. Cell Biol. 2011, 43, 189–197. [Google Scholar] [CrossRef]
  52. Miller, G.M.; Ogunnaike, B.A.; Schwaber, J.S.; Vadigepalli, R. Robust dynamic balance of AP-1 transcription factors in a neuronal gene regulatory network. BMC Syst. Biol. 2010, 4, 171. [Google Scholar] [CrossRef]
  53. Kong, X.; Feng, D.; Wang, H.; Hong, F.; Bertola, A.; Wang, F.-S.; Gao, B. Interleukin-22 induces hepatic stellate cell senescence and restricts liver fibrosis in mice. Hepatology 2012, 56, 1150–1159. [Google Scholar] [CrossRef]
  54. Olsen, A.L.; Bloomer, S.A.; Chan, E.P.; Gaça, M.D.A.; Georges, P.C.; Sackey, B.; Uemura, M.; Janmey, P.A.; Wells, R.G. Hepatic stellate cells require a stiff environment for myofibroblastic differentiation. Am. J. Physiol. Gastrointest. Liver Physiol. 2011, 301, G110–G118. [Google Scholar] [CrossRef]

