The Impact of Hurricane Maria on the Vegetation of Dominica and Puerto Rico Using Multispectral Remote Sensing


1
Zhejiang Provincial Key Laboratory of Urban Wetlands and Regional Change, Hangzhou Normal University, Hangzhou 311121, China
2
Department of Geology and Geophysics, Yale University, New Haven, CT 06520, USA
*
Author to whom correspondence should be addressed.
Remote Sens. 2018, 10(6), 827; https://0-doi-org.brum.beds.ac.uk/10.3390/rs10060827
Submission received: 24 April 2018
/
Revised: 17 May 2018
/
Accepted: 23 May 2018
/
Published: 25 May 2018
(This article belongs to the Section Remote Sensing in Agriculture and Vegetation)
Abstract
:As the worst natural disaster on record in Dominica and Puerto Rico, Hurricane Maria in September 2017 had a large impact on the vegetation of these islands. In this paper, multitemporal Landsat 8 OLI and Sentinel-2 data are used to investigate vegetation damage on Dominica and Puerto Rico by Hurricane Maria, and related influencing factors are analyzed. Moreover, the changes in the normalized difference vegetation index (NDVI) in the year 2017 are compared to reference years (2015 and 2016). The results show that (1) there is a sudden drop in NDVI values after Hurricane Maria’s landfall (decreased about 0.2) which returns to near normal vegetation after 1.5 months; (2) different land cover types have different sensitivities to Hurricane Maria, whereby forest is the most sensitive type, then followed by wetland, built-up, and natural grassland; and (3) for Puerto Rico, the vegetation damage is highly correlated with distance from the storm center and elevation. For Dominica, where the whole island is within Hurricane Maria’s radius of maximum wind, the vegetation damage has no obvious relationship to elevation or distance. The study provides insight into the sensitivity and recovery of vegetation after a major land-falling hurricane, and may lead to improved vegetation protection strategies.
1. Introduction
Tropical cyclones are extreme weather events of varying magnitude and moderate frequency. These powerful and hazardous meteorological phenomena cause damage to natural and man-made features all around the subtropical world [1,2,3,4]. Hurricane Maria in September 2017 caused catastrophic damage and loss of life in Dominica, the Dominican Republic, Guadeloupe, Haiti, Puerto Rico, and the United States Virgin Islands [5]. It was regarded as the worst natural disaster on record in Dominica and Puerto Rico, and eye-witnesses reported extensive defoliation [6]. The combination of these hurricane events, including the high wind speeds, storm surge, and heavy precipitation, most likely had an adverse effect on the local vegetation, yet the extent and magnitude of the vegetation damage within the region has not been fully investigated [7].
It is essential to assess the overall impact of tropical cyclones to support effective post-hurricane management approaches. However, it is time-consuming and expensive to investigate the full extent and magnitude of landscape and property damage using traditional field survey approaches [8,9]. This is because tropical cyclones disrupt communication systems and restrict travel, due to flooding and damaged transport networks [10,11]. Compared with field surveys, remote sensing is a cost-effective tool for monitoring large-scale forest destruction after hazardous events. Accordingly, remote sensing can provide useful information to facilitate the relief process and managing infrastructure, communities, and natural resources in disaster management [12]. Ramsey et al. [13] developed an empirical model based on NOAA AVHRR and Landsat TM data, then it was used to relate forest type and hurricane-impact distribution with wind speed and duration to explain the variation of hurricane damage among forest types. Staben and Evans [14] used very high resolution QuickBird satellite data to estimate the tree canopy loss after Cyclone Monica in the Magela Creek catchment, northern Australia. Villa et al. [15] analyzed the spatial patterns and temporal trajectories of vegetation damage and recovery using a multisensor multitemporal remote sensing dataset. Zhang et al. [9] used remote sensing to assess forest damage by Typhoon Saomai and its related factors at landscape scale. Negron-Juarez et al. [16] used the MODIS and Landsat data to study the observed patterns of forest disturbance associated with tropical cyclones at different spatial scales. Hoque et al. [8] develop an object-based image classification and post-classification change detection approach for mapping tropical cyclone multiple impacts in Bangladesh using SPOT5 image. Feng et al. [17] focused on a rapid assessment of Hurricane Maria’s impact on Puerto Rico’s forests, and they calculated the change in the non-photosynthetic vegetation map to illustrate significant spatial variability in disturbance and estimated that Hurricane Maria may have caused mortality and severe damage to 23–31 million trees.
Increasingly, scientists are recognizing that natural disturbances, such as hurricanes, mudslides and floods, play an important role in the distribution of tropical vegetation, and that many assumptions concerning the relative importance of natural disasters warrant re-examination [18,19,20,21]. Vegetation indices (VI) derived from satellite images have long been used in remote sensing for monitoring vegetation changes and other related changes in land use. Moreover, vegetation indices are widely used to indicate the extent of vegetation destruction and provide information on damage severity [22,23]. The main vegetation indices include the normalized difference vegetation index (NDVI) and enhanced vegetation index (EVI). Ramsey et al. [24] used NDVI derived from AVHRR imagery to identify hurricane damage in a forested wetland of Louisiana. Ayala-Silva et al. [18] found that there is a statistically significant relationship between distance to the location affected by the hurricane and the extent of changes in Albedo and NDVI. Rodgers et al. [7] analyzed the impact of Hurricane Katrina on the coastal vegetation of the Weeks Bay Reserve, Alabama from NDVI data. Brun and Barros [2] used EVI of MODIS data to assess the ecohydrological impact of hurricanes and tropical cyclones in the southeastern United States.
In this study, multitemporal remote sensing images are used to evaluate the impact of Hurricane Maria on the vegetation of Dominica and Puerto Rico. The objectives of this study are (1) to analyze short-term impacts to vegetation and recovery using vegetation indices derived from Landsat 8 OLI and Sentinel-2 images; (2) to evaluate the damage effects on different land cover types and sort the severity of damage; (3) to investigate the spatial distributions of vegetation damage in relation with terrain elevation and distance to hurricane path; and (4) to compare the differences of vegetation damage by Hurricane Maria between Dominica and Puerto Rico. These results provide insight into the sensitivity and recovery of vegetation after a major land-falling hurricane. Understanding the changes in vegetation health following a major hurricane may lead to improved management strategies.
2. Background
2.1. Hurricane Maria Descriptions
Originating from a tropical wave, Hurricane Maria became a tropical storm on 16 September 2017, east of the Lesser Antilles. Highly favorable environmental conditions allowed the storm to undergo explosive intensification as it approached the island arc. The hurricane reached Category 5 strength on September 18 upon making landfall on Dominica, producing extreme winds across the entire island. Afterwards, Hurricane Maria achieved its peak intensity over the eastern Caribbean with maximum sustained winds of 175 mph (280 km/h). Hurricane Maria struck Puerto Rico as a high-end Category 4 hurricane on September 20. Interaction with land further weakened the hurricane, though it regained some strength as it moved northeast of The Bahamas. Moving slowly to the north, Hurricane Maria gradually degraded and weakened to a tropical storm on September 28. Embedded in the westerlies, Hurricane Maria accelerated toward the east, and later, east-northeast over the open Atlantic, becoming extratropical on September 30 and dissipating by October 3 [6,25].
Hurricane Maria caused catastrophic damage in Dominica, with the majority of structures seriously damaged or destroyed, and most trees and vegetation were downed and/or defoliated. In Puerto Rico, the death toll is highly uncertain, which includes an unknown number of indirect deaths. It should be noted that hundreds of additional indirect deaths in Puerto Rico may eventually be attributed to Hurricane Maria’s aftermath, pending the results of an official government review [26]. The detail quantification of the damage caused by Hurricane Maria is shown in Table 1.
2.2. Study Area
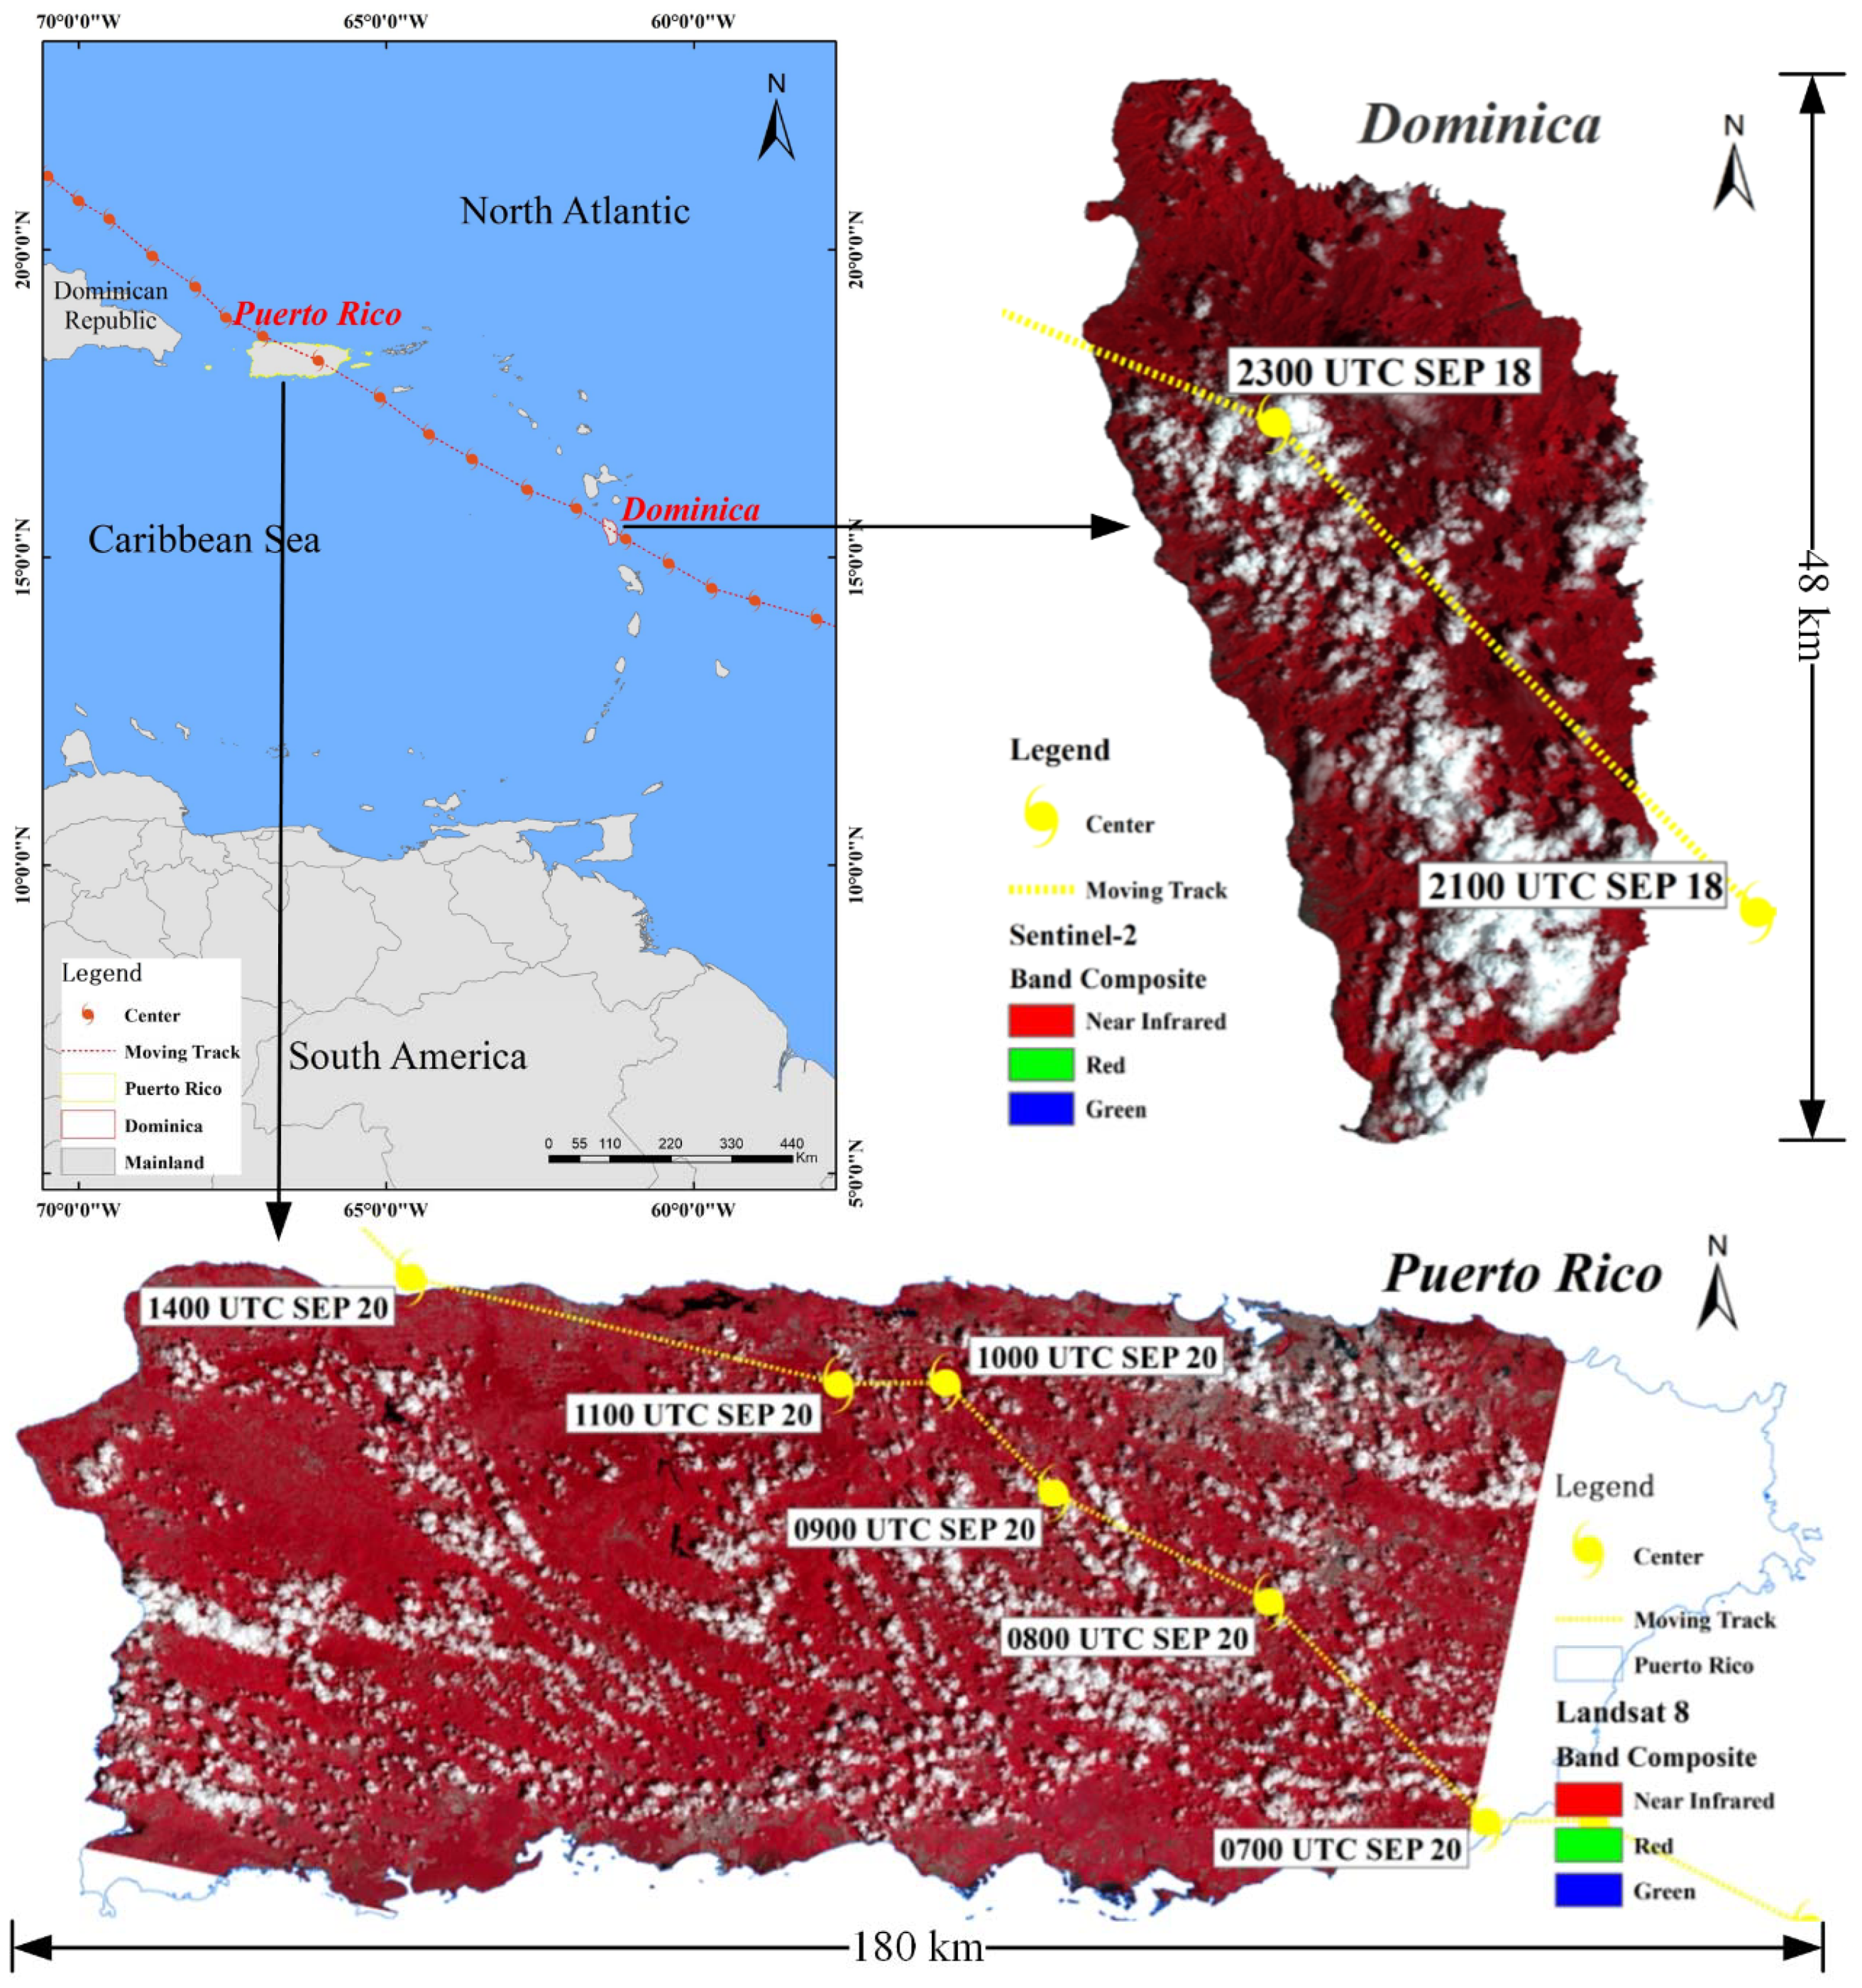
In this study, we selected two representative islands located in the Caribbean Sea: Dominica and Puerto Rico (Figure 1). Hurricane Maria made landfall in Dominica on September 18 and Puerto Rico on September 20, respectively. It caused catastrophic damage and loss of life on both islands [5].
Dominica (15°25′N, 61°21′W) lies in the eastern Caribbean in the Lesser Antilles chain of volcanic islands (Figure 1). The island terrain forms a simple north–south ridge, but with higher peaks in the north and south (e.g., Morne Diablotins, 1447 m and Morne Trois Pitons, 1424 m). Its area is 750 km2 and the dimensions of the island are about 17 km in the east–west direction by 45 km north–south. Vegetation on the island is graded from tropical rain forest on the east coast, to dry grasslands on the west coast. The island is known for its waterfalls, rushing rivers, and flash floods. About half of the electrical energy for 72,000 inhabitants comes from hydropower [27,28,29]. In recent years, Dominica has been hit by Hurricanes David in 1979, Dean in 2007 [30], and Erika in 2015 [31]. In contrast to these, Hurricane Maria, in 2017, wrought more catastrophic damage to the entirety of Dominica, which suffered an island-wide communication blackout. Much of the housing stock and infrastructure were left beyond repair, while the island’s lush vegetation had been practically defoliated.
Puerto Rico (18°12′N, 66°30′W) is located at the eastern end of the Greater Antilles, 1700 km southeast of Miami, Florida (Figure 1). Its area is 8950 km2 with dimensions 160 km long and 56 km wide. It is made of a highland interior of hills and plateau, which are surrounded by a coastal plains area; around 75% of the land surface is either hilly or mountainous, and it occurs in the path of the easterly trade winds and hurricane routes. Tropical moist forests dominate the island, while wet forests are limited in the central cordillera and dry forests in the south [18,32].
2.3. Datasets
Two types of data were used in this study: satellite images and geospatial ancillary datasets.
The primary remote sensing data used for the study were Landsat 8 OLI and Sentinel-2 imagery. The image selection takes into consideration the amount of cloud and cloud shadow, haze, and the Hurricane Maria’s landfall date. The geometrically corrected images were downloaded from the United States Geological Survey (USGS) Global Visualization Viewer (http://glovis.usgs.gov/). Cloud-free images in Dominica and Puerto Rico were difficult to acquire because the diurnal heating of the islands produced dense cumulus clouds. After visual examination, 25 images with cloud cover less than 50% were collected between August to December, spanning the September landfall date. Table 2 lists the acquisition dates and image quality in terms of cloud contamination of all images used for the study areas.
A group of ancillary geospatial datasets were collected and processed for this study: (1) digital elevation model (DEM) data with 30 m spatial resolution were obtained from Geospatial Data Cloud site (http://www.gscloud.cn/); (2) the surface wind field and past track of Hurricane Maria with 1 h intervals were obtained from National Hurricane Center (NHC) (http://www.nhc.noaa.gov/); and (3) 2000 Dominica and Puerto Rico land cover and forest formations maps were downloaded free from USGS website (https://lca.usgs.gov/carland/dataproducts.php). The land cover maps have a spatial resolution of 30 m × 30 m, and they were produced by Landsat Enhanced Thematic Mapper Plus (ETM+) and SPOT imagery.
3. Methods
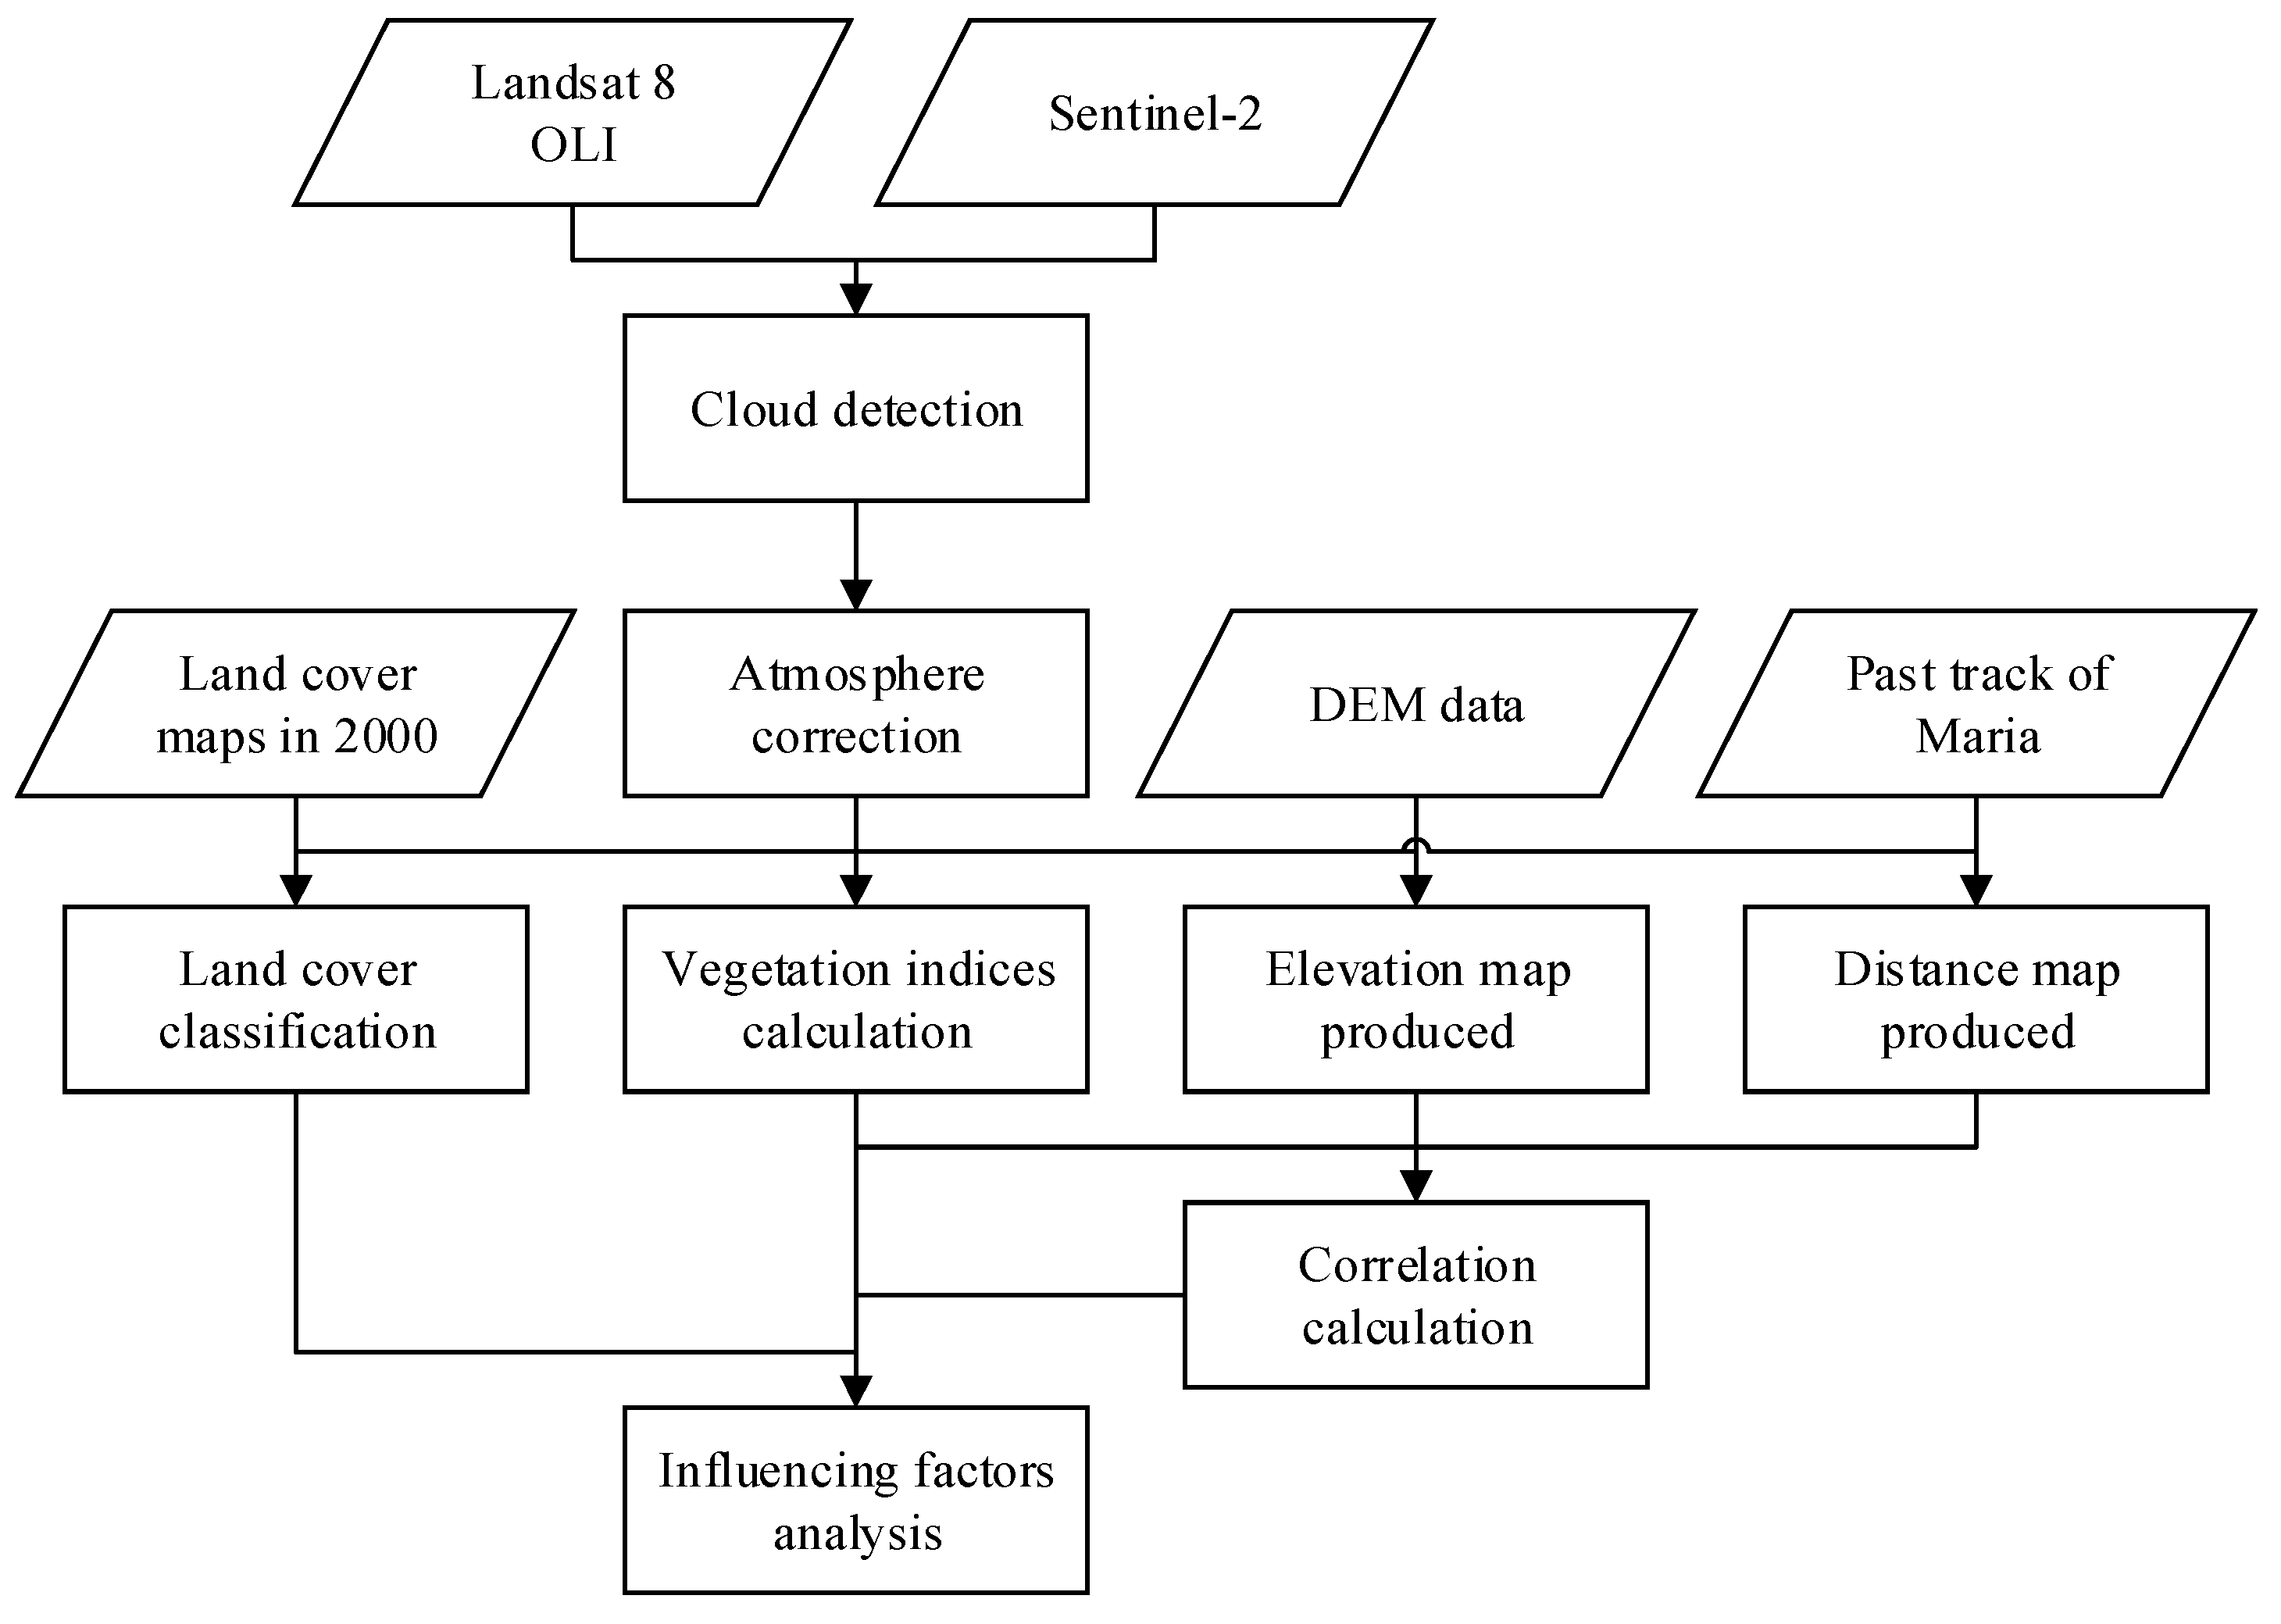
The approach includes four main steps (Figure 2): (1) data pre-processing, including cloud detection, atmosphere correction, geometric correction, resampling, and mosaicking; (2) calculate vegetation indices, including NDVI, ΔNDVI, and NDVI%; (3) producing different kinds of influencing factors, including land cover, elevation, and distance; and (4) analysis of influencing factors of Hurricane Maria, using correlation coefficient and linear regression model. All steps are further described below.
3.1. Cloud Detection and Atmosphere Correction
Clouds and cloud shadows significantly degrade image data quality on these subtropical Caribbean islands. As shown in Table 2, all images are contaminated by clouds. Therefore, it is important to detect clouds and cloud shadows in the satellite images, and screen them accurately before any kind of remote sensing activity is performed. Zhu et al. [33,34] proposed a new method called Fmask (function of mask) for cloud and cloud shadow detection in Landsat imagery in 2012, and then they improved and expanded the Fmask algorithm for Landsats 4–7, 8, and Sentinel 2 images in 2015. The Fmask algorithm has been embedded in the ENVI (Version 5.4.1) image analysis software.
We detected all clouds and their shadows within the Landsat 8 OLI and Sentinel-2 images using the Fmask method. The key parameters used in the Calculate Cloud Mask Using Fmask Algorithm tool are selected as follows: the value of kernel size is 7 (to create a 7 × 7 array), the value of cloud probability threshold is 22.5, and the thermal and cirrus bands are selected to improve the accuracy of the cloud mask results. When processing is complete, the masked cloud pixels are set to values of Nodata in the displayed image, and it will automatically calibrate the multispectral and cirrus band to top-of-atmosphere reflectance. Then, we corrected for atmospheric effects next by the QUick Atmospheric Correction (QUAC) tool. QUAC is an atmospheric correction method for multispectral and hyperspectral imagery that works with the visible and near-infrared through shortwave infrared wavelength range [35,36].
Optical remotely-sensed images in mountainous areas are subject to radiometric distortions induced by topographic effects, which need to be corrected before quantitative applications [37]. As shown in Table 2 and DEM data, the sun elevation angle is higher than most of the terrain slopes, and does not vary greatly over the study period. Therefore, the topography effect on vegetation detection is small. All images were coregistered to one another, with a spatial uncertainty of less than one 30 m pixel. The spatial resolution of the Sentinel-2 image was resampled to 30 m. These processed cloud-free images were then mosaicked and clipped by Dominica and Puerto Rico boundary to form a mapping unit.
3.2. Land Cover Classification
The Caribbean is one of the world’s centers of biodiversity and endemism. Many of its islands have complex topography, climate, and soils, and ecological zones change over small areas [38]. The Nature Conservancy (TNC) organized a Caribbean Vegetation Mapping Workshop with a group of Caribbean ecologists to develop a standardized vegetation classification system for the Insular Caribbean. They mapped 2000 Dominica and Puerto Rico land cover and forest formations maps, which in all cases, represented substantial improvements over previous maps and vegetation characterizations. The researchers developed a rapid, computer-assisted field verification methodology, which utilizes state of the art computer, software, and GPS technology applications for vegetation classification. Methodology consists of the following five phases. Phase One: Image acquisition and preprocessing. Imagery will be classified using unsupervised classification methods, resulting in draft vector maps to be used in field data collection efforts. Phase Two: Fieldwork. Collect data for verification of preliminary classification and to use as training data for subsequent decision tree modeling. Phase Three: Development of vector polygon land cover map. Following fieldwork, and assisted by expert consultations, a draft vector map of vegetation polygons will be developed. Phase Four: Decision tree modeling. A decision tree model will be developed to characterize vegetation assemblages on each island. Phase Five: Integration of polygon map with decision tree modeled output for final product development [39].
Starting with 2000 USGS Dominica and Puerto Rico land cover and forest formations maps, we updated the land cover maps using 2017 Landsat 8 OLI and Sentinel-2 images. The land cover classification scheme relates closely to that described by Helmer et al. [38] and 9 land cover types are classified as shown in Table 3.
The 2017 Dominica and Puerto Rico land cover maps are produced by the following steps: (1) First, because all images have cloud coverage, we chose the image which contain the least clouds in 2017 as a base image, and used additional images (2015–2017) to fill the masked-out areas, in order to generate a final nearly cloud-free image for Dominica and Puerto Rico. (2) Next, training samples were selected using nearly cloud-free images and 2000 land cover maps. A minimum of 30 training samples were chosen for each class, with some exceptions for classes which only covered a small proportion of the scene. A non-parametric nearest neighbor (k-NN) classifier was used to place image into defined classification system. This iterative process involved selecting training samples, comparing sample attributes, and refining training samples until a very good accuracy result was achieved. The nearest neighbor classifier is advantageous when image data are composed of spectrally similar classes that are not well separated using a few features or just one feature, and also, when training sample sizes may be uneven [40]. After the k-NN method runs, each pixel is assigned the class with the highest class confidence value. (3) Finally, integration of 2000 land cover maps with k-NN classifier output for final updated product development. The final products from the 2000 land cover maps and k-NN analyses were integrated to produce 2017 land cover maps. In addition, the reference data included over 100 points for Dominica and Puerto Rico were selected using a random sampling procedure, respectively. Then, they were classified using manual interpretation techniques based on Google Earth imagery. Accuracy was assessed based on the confusion matrix and associated statistics, namely, overall accuracy.
3.3. Vegetation Indices Calculation
The normalized difference vegetation index (NDVI) is used here to assess the state of live green vegetation. NDVI is less affected by topographical factors and illumination than other vegetation indices, and it also indicates a level of photosynthetic activity [9].
The NDVI is calculated from these individual measurements as follows:
where RED and NIR stand for the spectral reflectance measurements acquired in the red (visible) and near-infrared regions, respectively. For Landsat 8 OLI, RED and NIR are the fourth and fifth bands. For Sentinel-2, RED and NIR are the fourth and eighth bands. In general, the range of NDVI value is between −1.0 and +1.0. Moreover, the vegetated areas range from 0.0 to +1.0, and a negative value often represents water and snow. In this study, we mainly measured the vegetation land covers, and we simply set the negative values to 0.0, and then the range of NDVI value is between 0.0 and +1.0.
After the above processing, the areas of change can be identified through the subtraction of the NDVI image for one date from that of another [41]. The pre-hurricane NDVI image was subtracted from post-hurricane image by using map algebra, which is a cell-by-cell process. The difference in NDVI (ΔNDVI) is regarded as forest damage caused by hurricane. The difference in NDVI is calculated by the following equation:
where NDVIpre represents for the NDVI image before hurricane landfall, and NDVIpost represents for the NDVI image after hurricane landfall. Two Sentinel-2 images obtained on 9 September 2017 before the hurricane landfall, and one Landsat 8 OLI image acquired on 21 September 2017 after the landfall, were selected to calculate ΔNDVI of Dominica. Moreover, one Landsat 8 OLI image acquired on 17 September 2017 before the hurricane landfall, and the other acquired on 3 October 2017 after the landfall, were selected to calculate ΔNDVI of Puerto Rico.
The impact of vegetation damage was estimated from the NDVIpre and NDVIpost. The relative change in vegetation activity after the hurricane is quantified by the NDVI ratio [42]:
A higher NDVI% represents more serious hurricane damage.
3.4. Elevation and Distance Map Produced
Elevation maps were divided using a natural breaks method based on DEM data. Natural break classes are based on natural groupings inherent in the data. Class breaks are identified that best group similar values, and that maximize the differences between classes. The features are divided into classes whose boundaries are set where there are relatively big differences in the data values [43]. The DEM surface of Dominica and Puerto Rico are divided into 10 classes using natural breaks method, respectively.
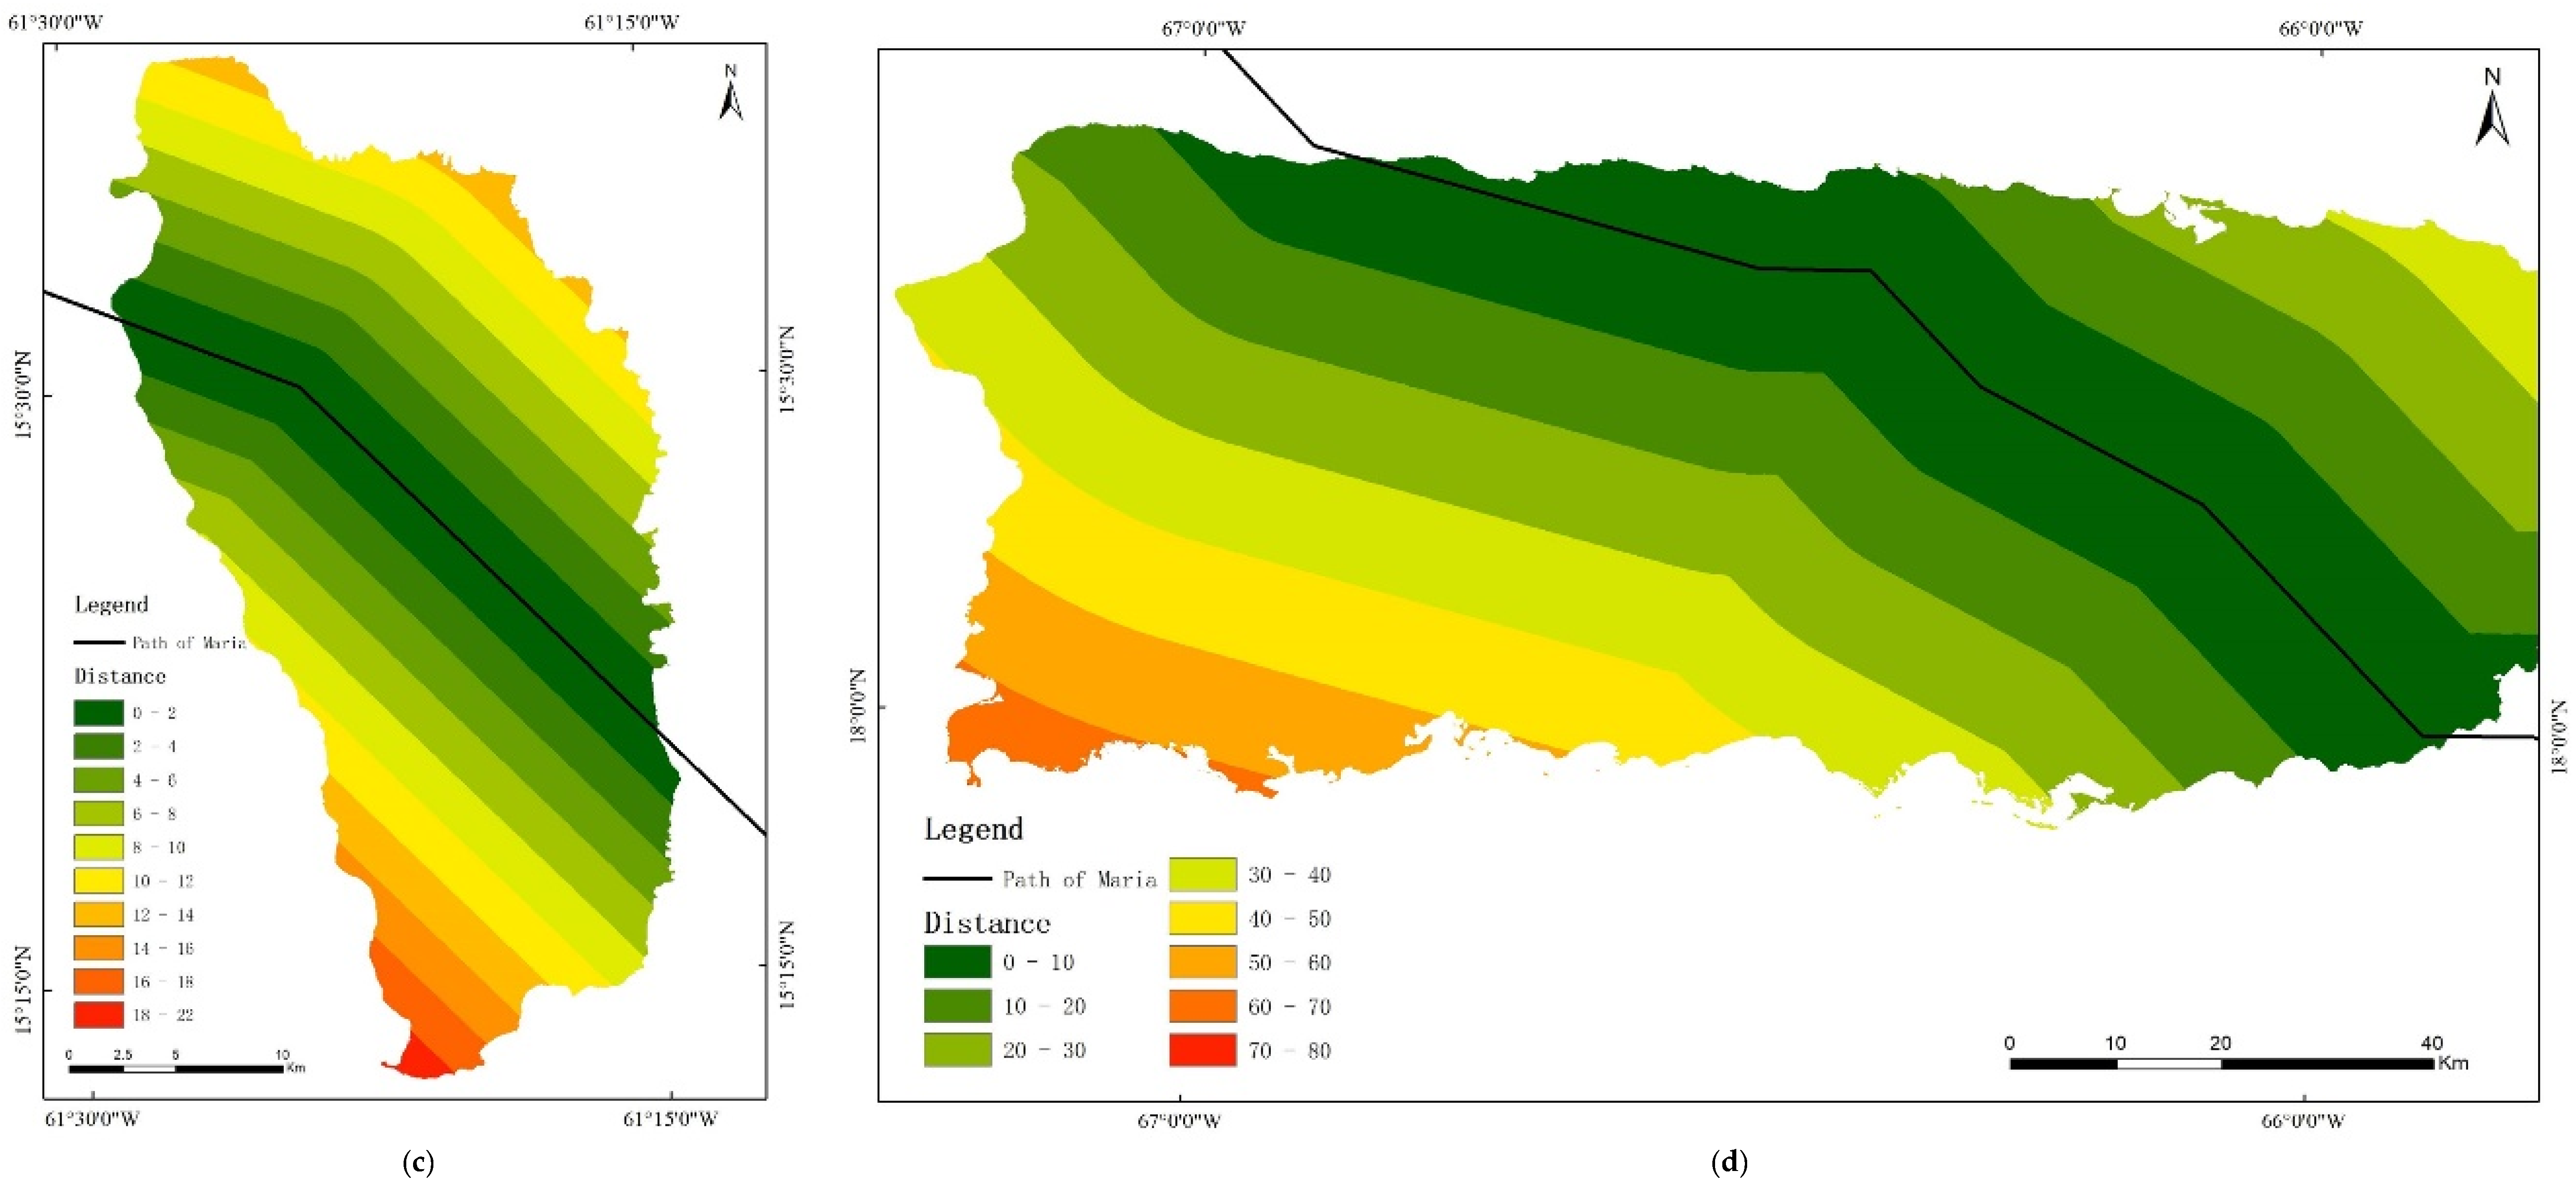
The distance map is produced based on the best track of Hurricane Maria using multiple ring buffer method [44]. We create 10 multiple buffers at specified distances from the best track line. Considering the area of islands, the specified distances value of Dominica and Puerto Rico are set to 2 km and 10 km, respectively.
3.5. Correlation Analysis
The usual Pearson correlation coefficient is used here to show the statistical relationship between different variables. In addition, a simple linear regression method is used to measure the relationship between the vegetation damage by Hurricane Maria and its influencing factors. In statistics, simple linear regression is the least squares estimator of a linear regression model with a single explanatory variable [9].
4. Results
4.1. Vegetation Indices Results
According to Equation (1), time-series NDVI images are calculated from Landsat 8 OLI and Sentinel-2 images. Due to variable cloud contamination, the cloud-free areas of each remote sensing image are inconsistent. We used an intersection operation to achieve time-series NDVI images with the same extent for Dominica and Puerto Rico, respectively. Next, the mean NDVIs of each intersected NDVI image are calculated, and the results are shown in Table 4 and Table 5.
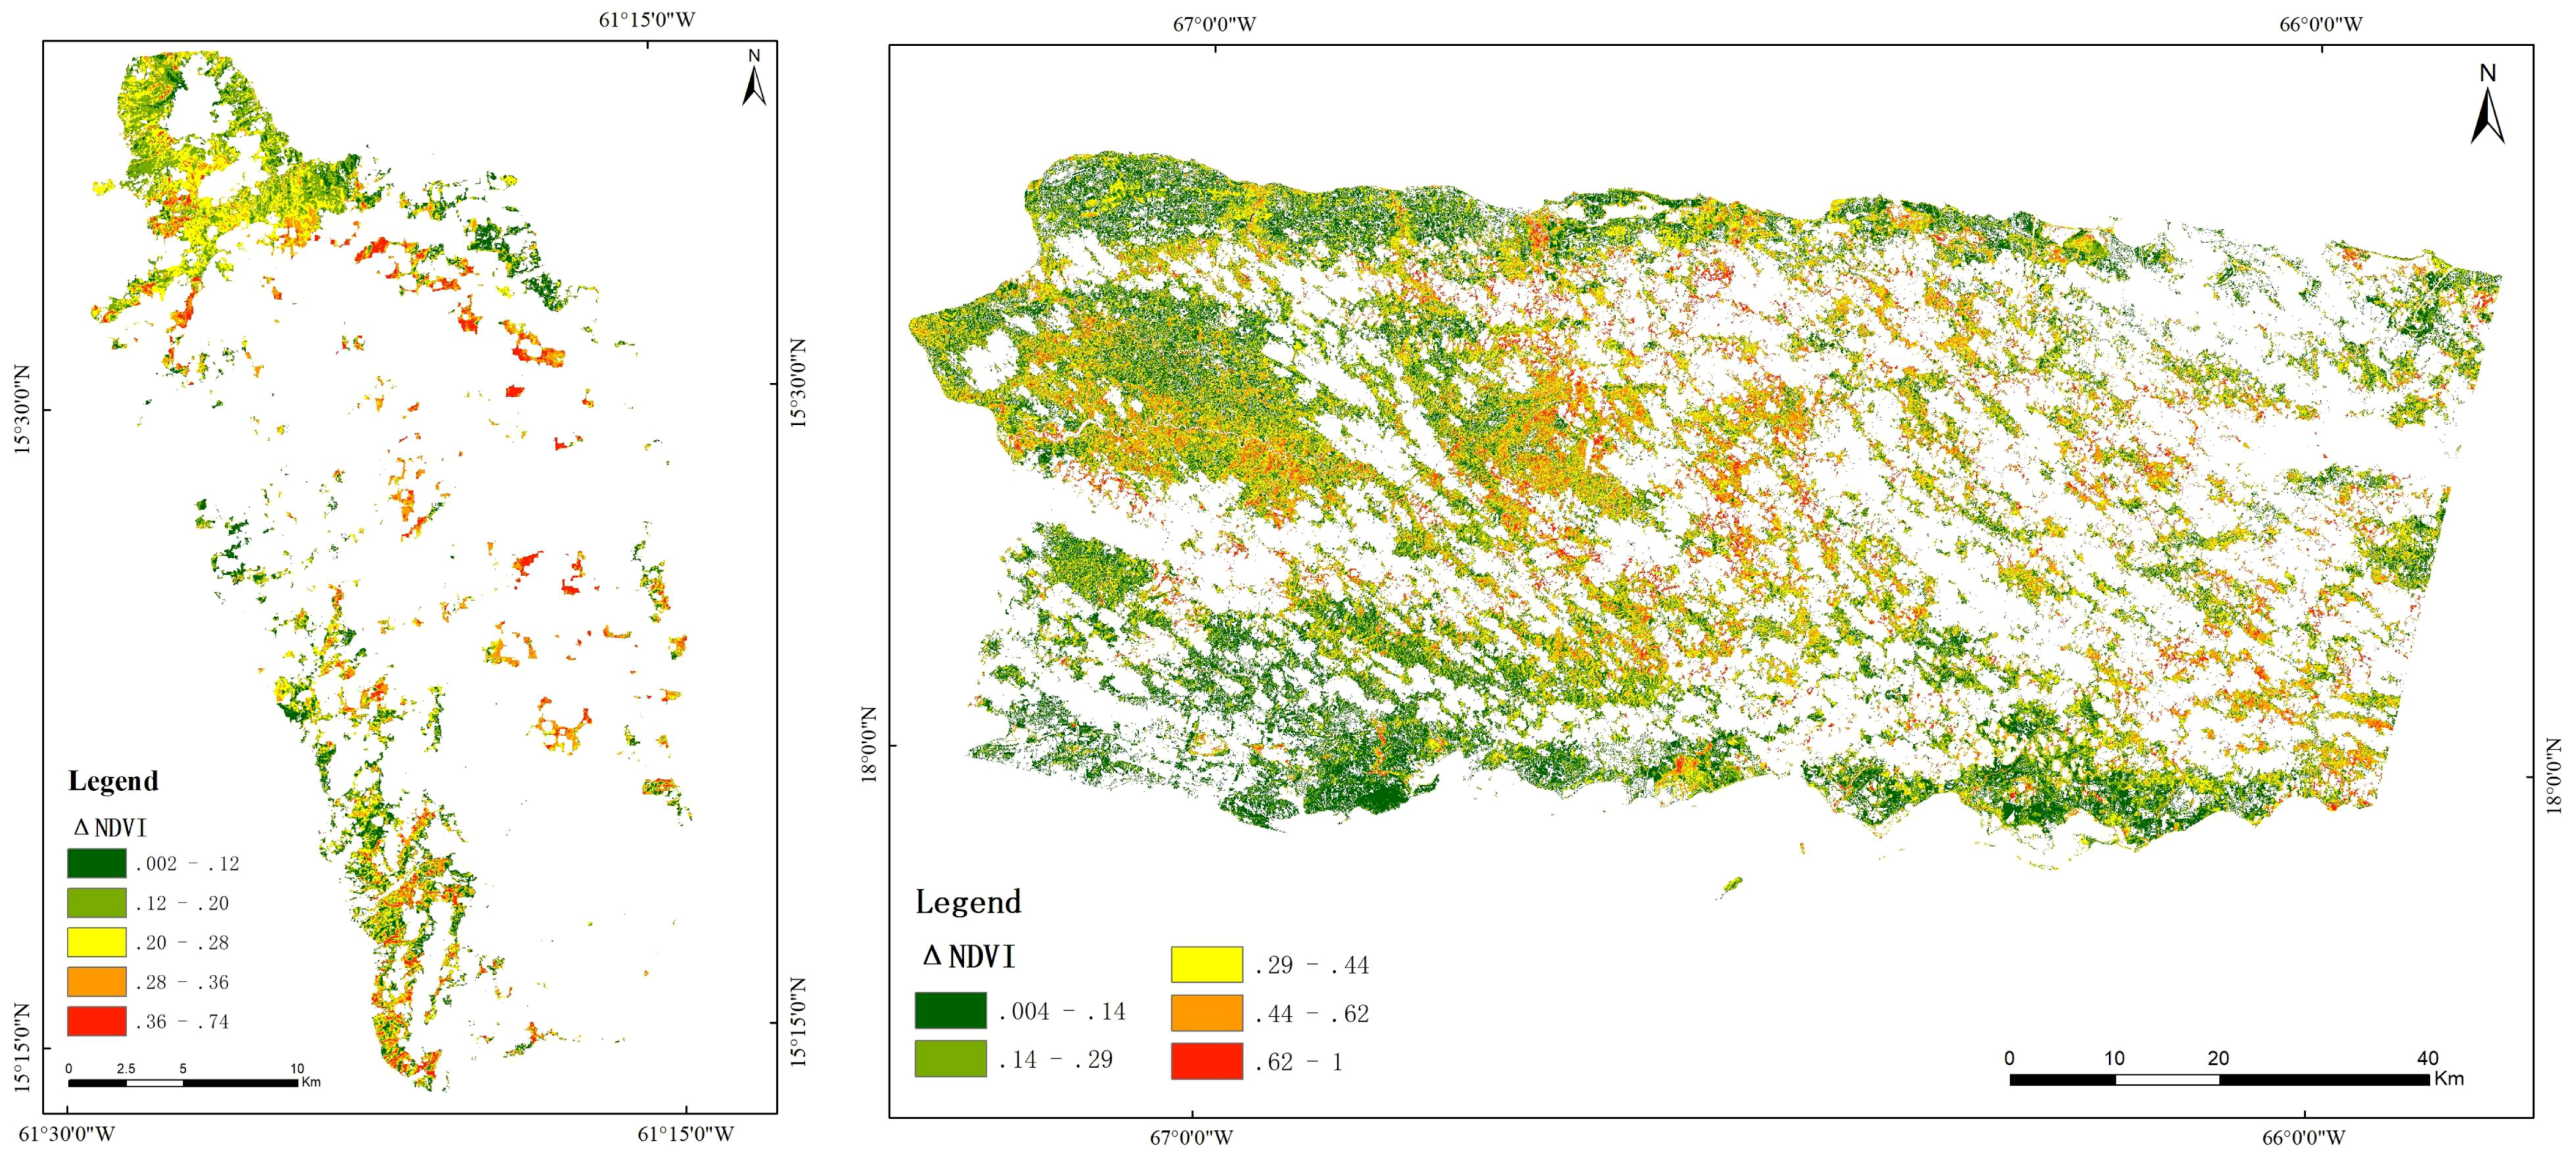
The spatial distribution of ΔNDVI is illustrated in Figure 3. The most distinct feature of abrupt canopy modification detectable by optical remote sensing is the loss of green leaves, detected by a decrease in NDVI [9]. Both of the post-hurricane images are obtained within one or two weeks after the landfall, and the vegetation damaged by Hurricane Maria has not recovered. As shown in Figure 3, the decreased NDVI pixels are distributed throughout the study area, which indicates that the whole islands are influenced by Hurricane Maria.
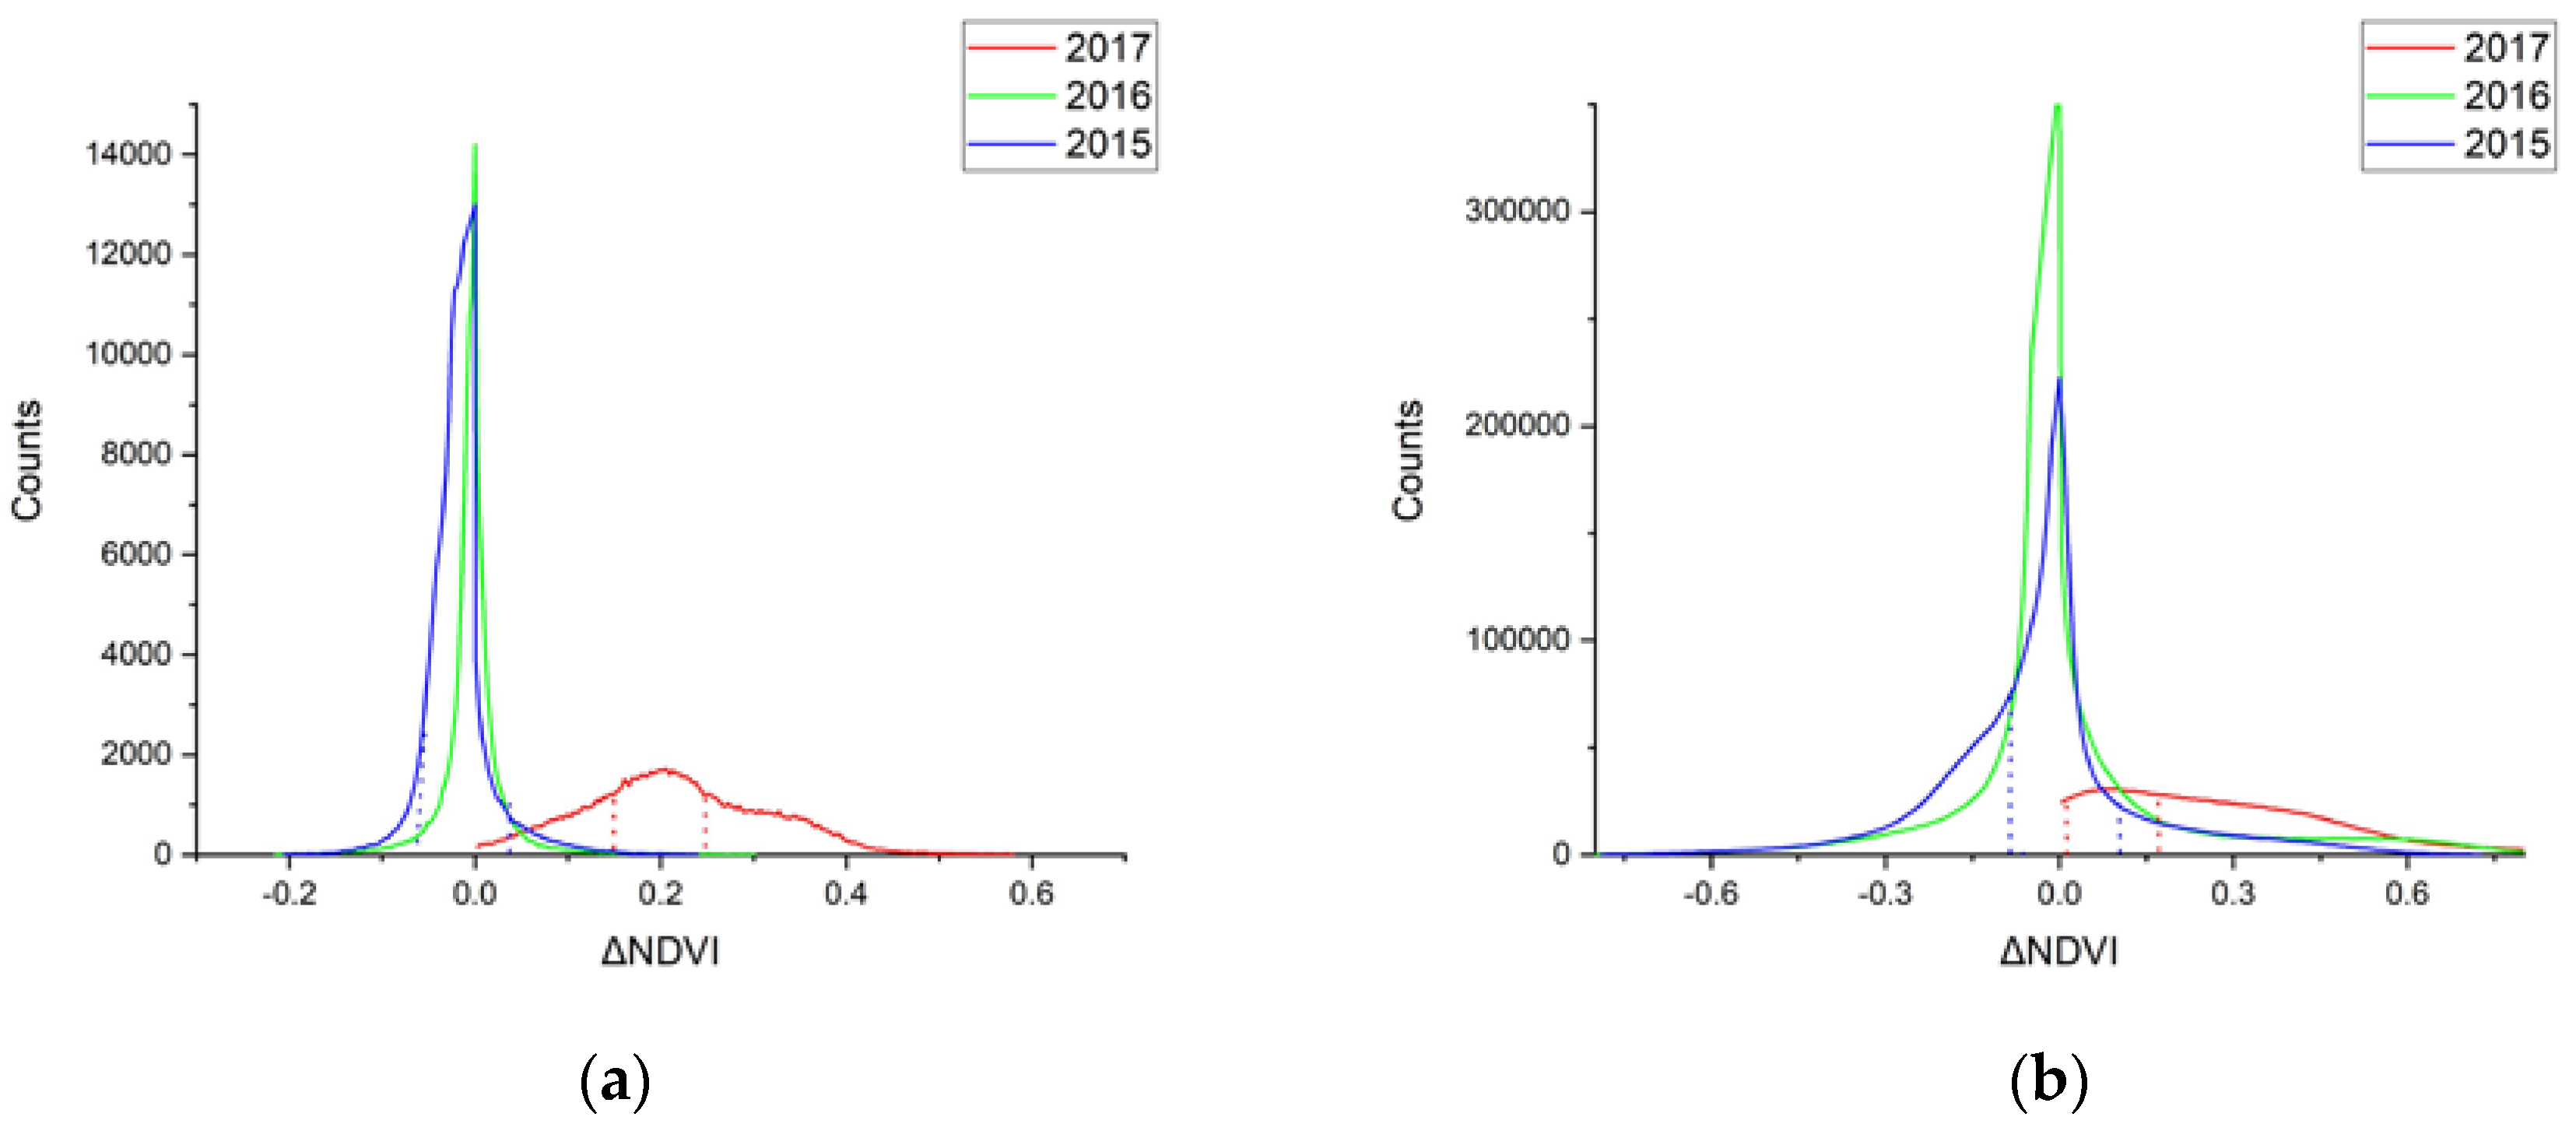
The histogram of ΔNDVI in Figure 4 shows the number of pixels with increased or decreased NDVI. For Dominica, the dominant values of ΔNDVI (2017) range from 0.15 to 0.26, and for Puerto Rico, from 0.04 to 0.16. These values show more damage in Dominica than in Puerto Rico. The main reason is that all of Dominica fell within the radius of maximum wind. No point on Dominica was sufficiently far from the storm track to avoid damage. Even the southern tip of Dominica is only 22 km from the storm track. By contrast, the dominant values of ΔNDVI for the reference years (2015 and 2016) lie between −0.1 and 0.1 for both Dominica and Puerto Rico. Thus, while individual pixels may have changed in those years, there was little overall NDVI shift in September and October.
4.2. Land Cover Spatial Distribution of Dominica and Puerto Rico
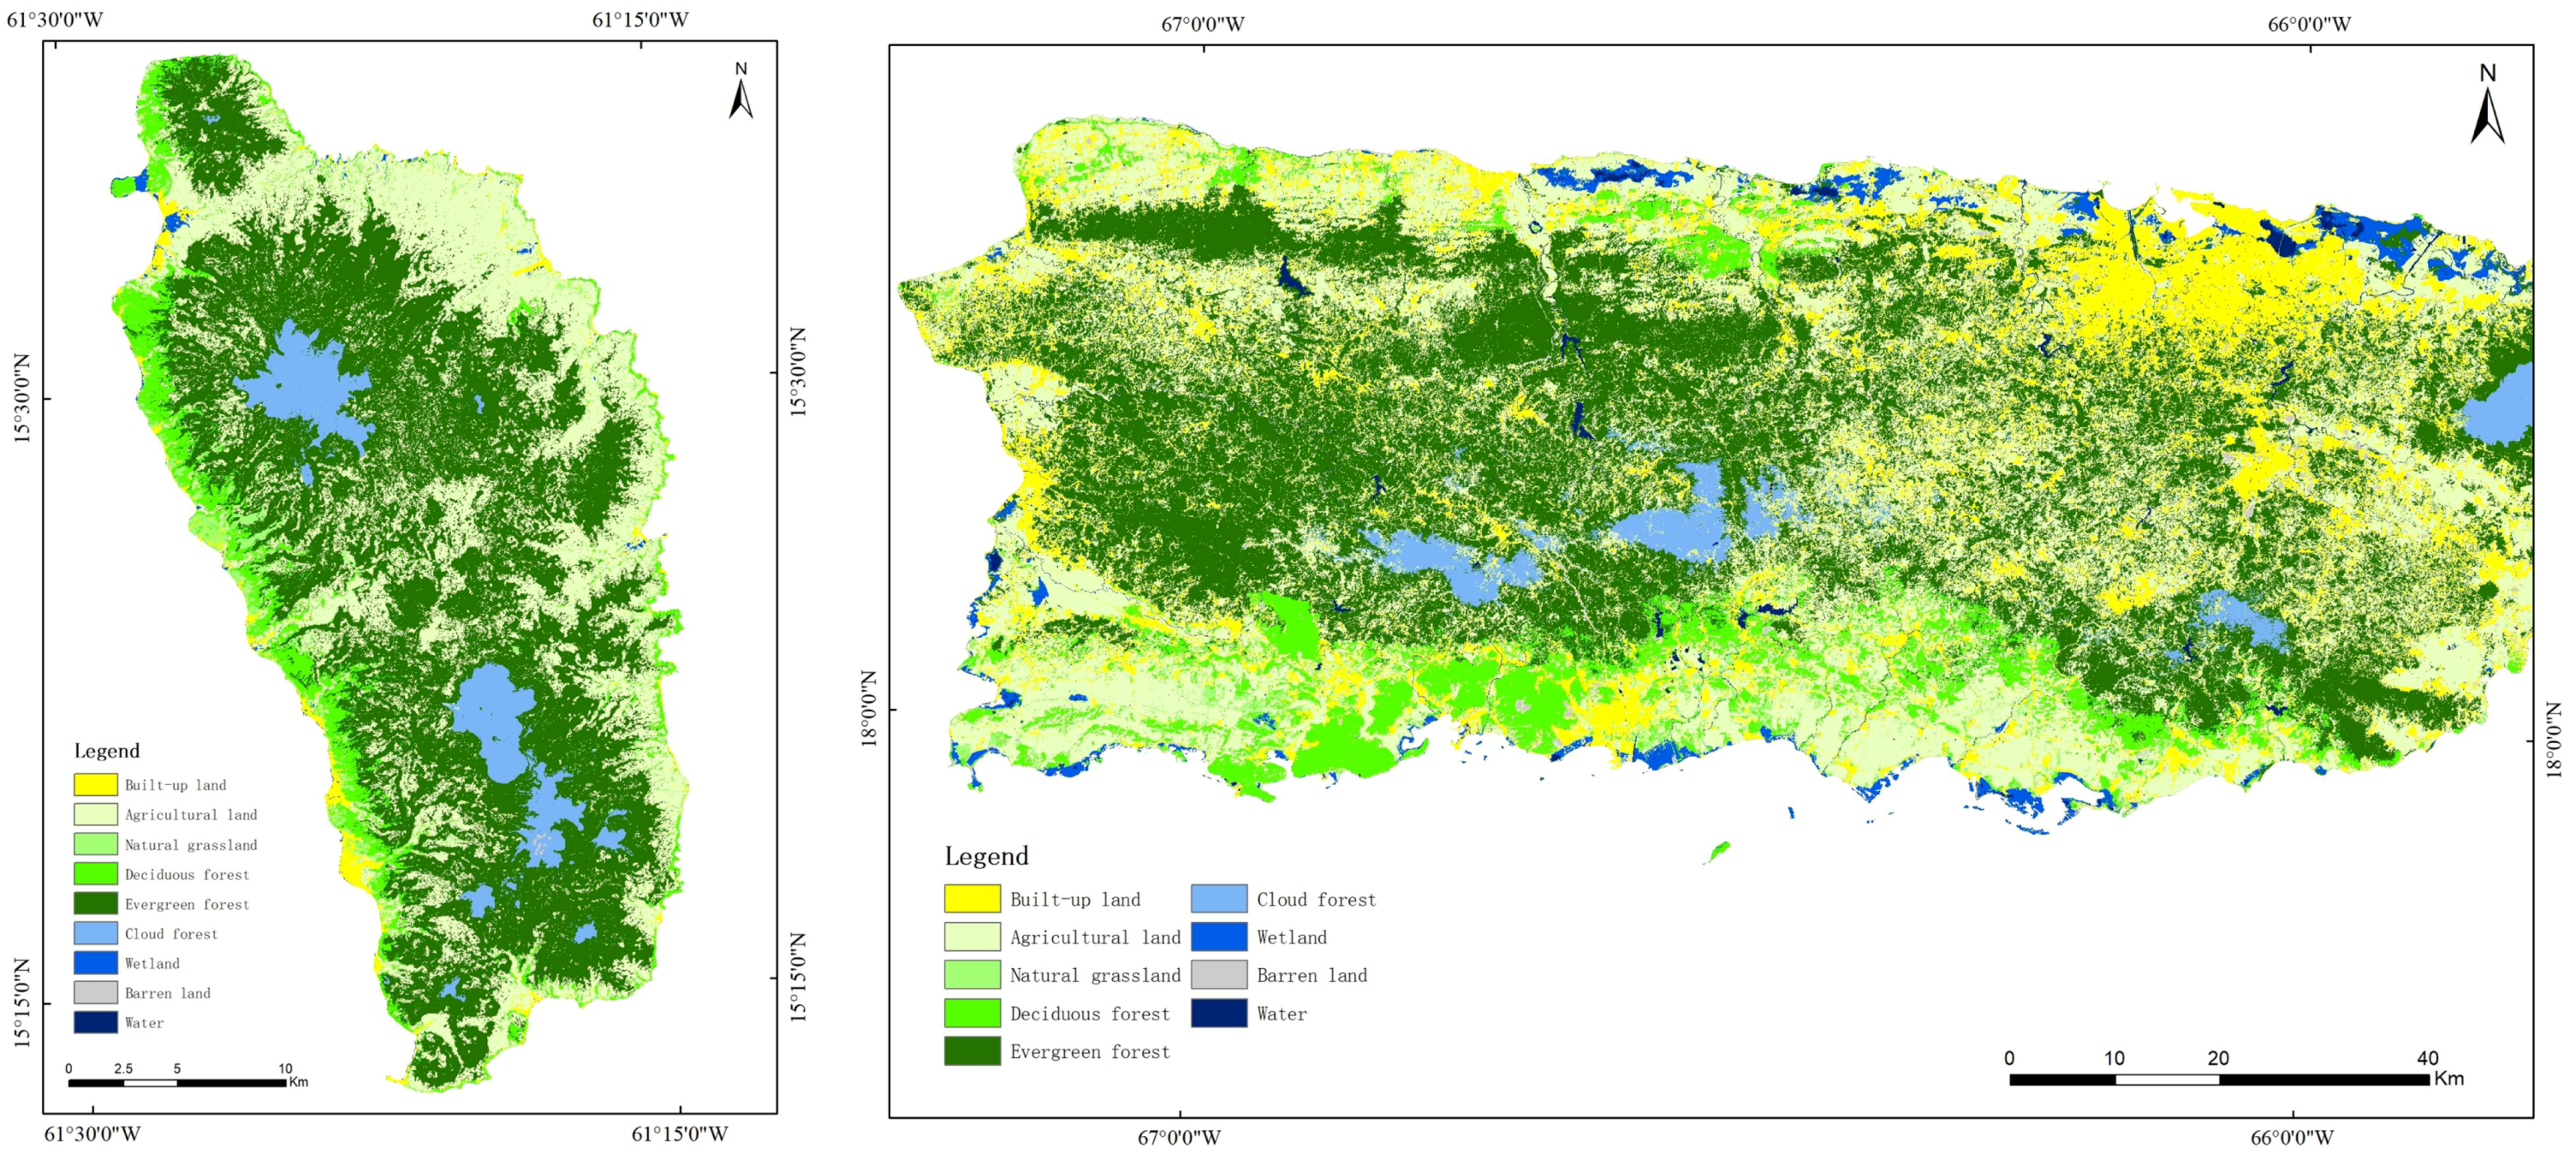
Nine land cover classes, including built-up land, agricultural land, natural grassland, deciduous forest, evergreen forest, cloud forest, wetland, barren land, and water, were effectively distinguished and updated (Figure 5). A quantitative accuracy assessment was conducted for evaluating the accuracies of the 2017 land cover maps. Over 100 random samples were selected and classified using manual interpretation techniques based on Google Earth imagery of 2017. The overall accuracies for Dominica and Puerto Rico image classification were 92.49% and 89.92%, which indicating a strong agreement or accuracy between the classified images and reference data.
Based on the results of vegetation indices (ΔNDVI and NDVI%) and land cover spatial distribution, the mean ΔNDVI and mean NDVI% are calculated for different land cover classes (the cloud contamination pixels are excluded). The vegetation indices statistics of different land cover classes for Dominica and Puerto Rico are shown in Table 6.
4.3. Elevation and Distance Maps
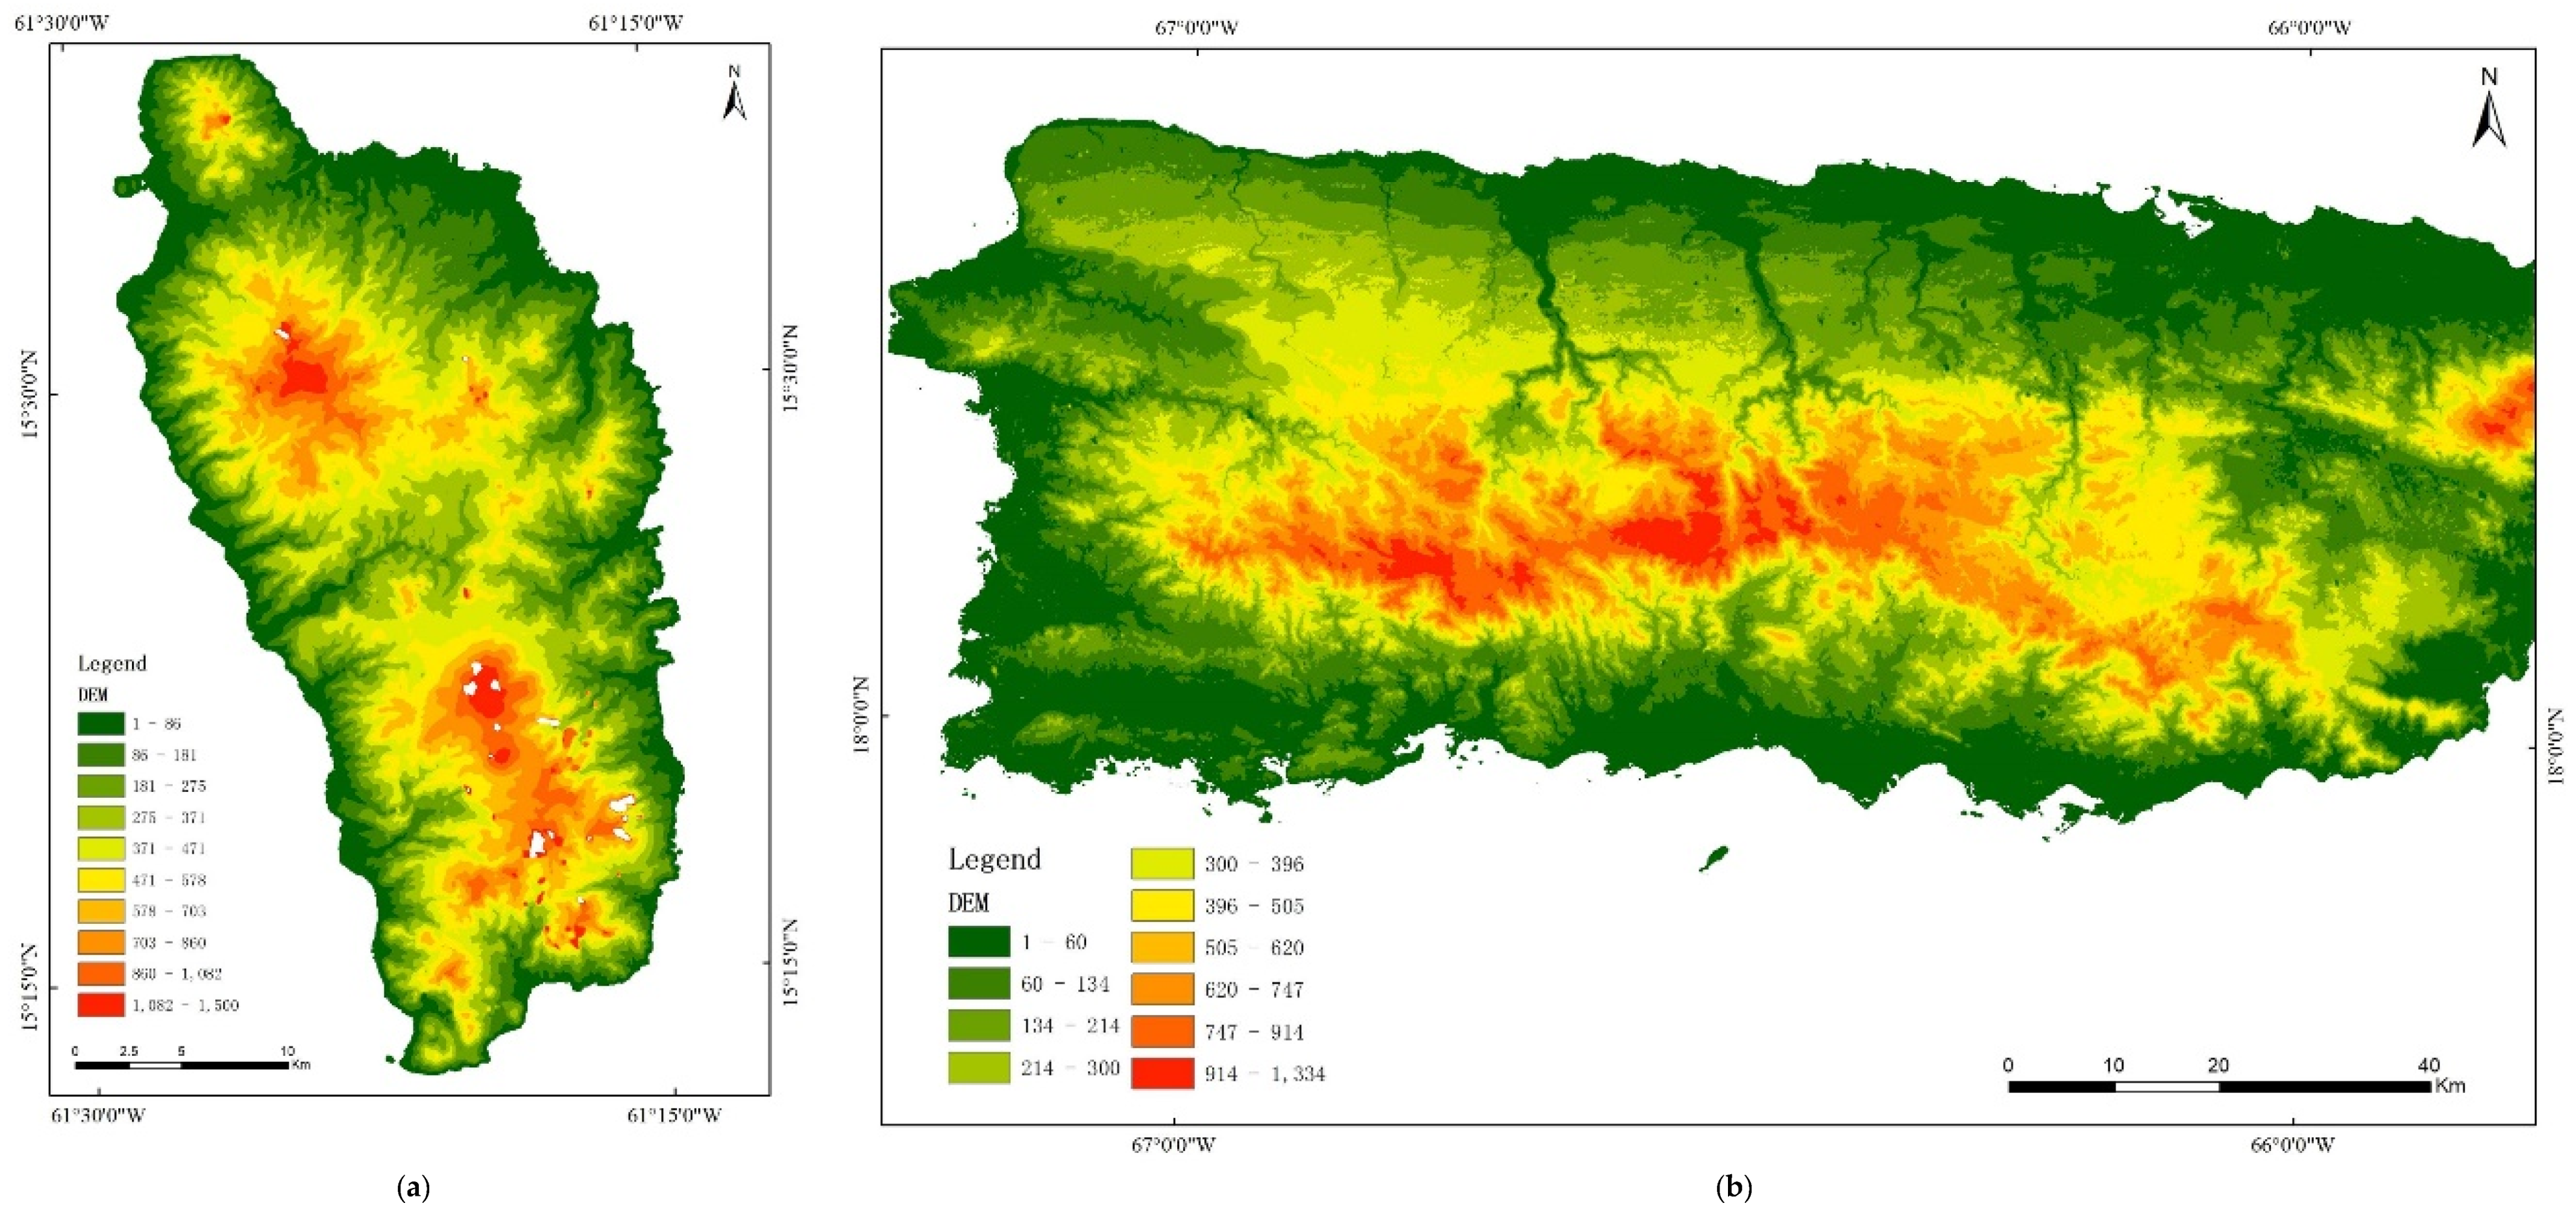
The elevation and distance to hurricane path maps of Dominica and Puerto Rico are shown in Figure 6. For Dominica, the surface elevation is divided into 10 classes using the natural breaks method, and the distance to path is divided into 9 classes using multiple buffers. Similarly, for Puerto Rico, surface elevation is divided into 10 classes, and the distance is divided into 7 classes. We anticipate that vegetation on higher terrain might be more exposed to strong hurricane winds than vegetation in valleys. Regarding the distance from the hurricane track, we anticipate that this factor will be more important for Puerto Rico because of its larger area.
Based on the results of vegetation indices (ΔNDVI and NDVI%), elevation and distance maps, the mean ΔNDVI and mean NDVI% are calculated for different elevation and distance (the cloud contamination pixels are excluded), respectively. The vegetation indices statistics of different elevation for Dominica and Puerto Rico are shown in Table 7, and the vegetation index statistics of different distance for Dominica and Puerto Rico are shown in Table 8.
5. Discussion
5.1. The Changes in NDVI
5.1.1. Short-Term Impacts to Vegetation and Recovery
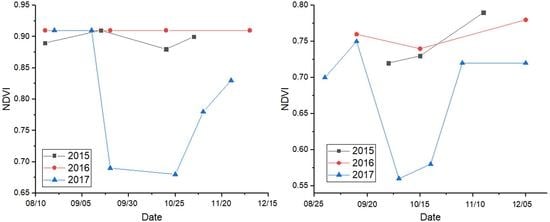
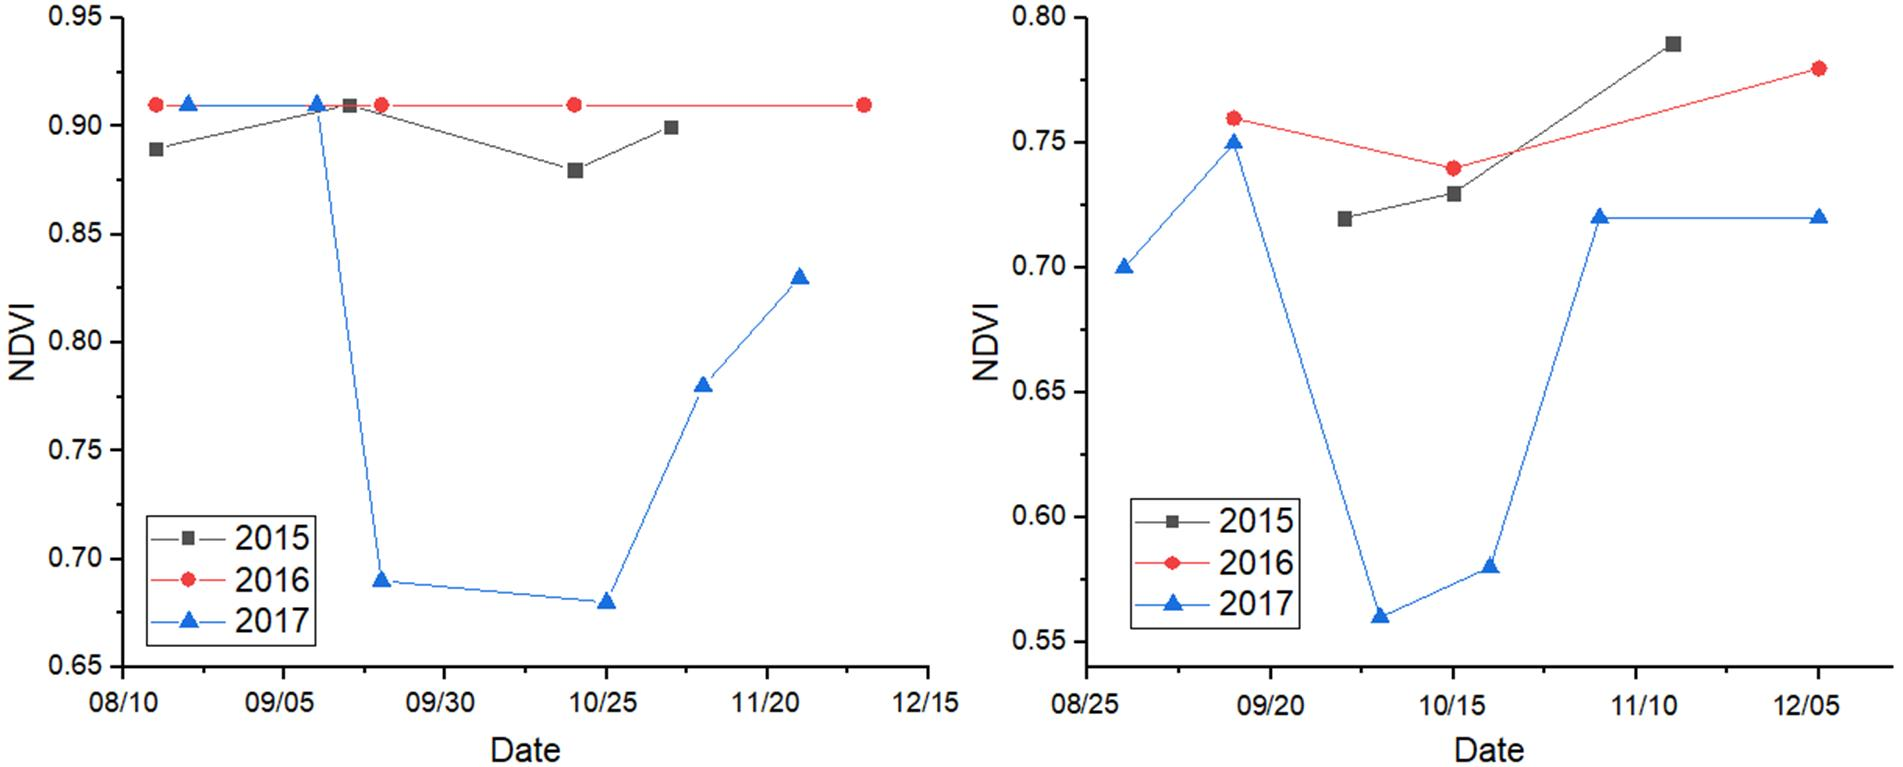
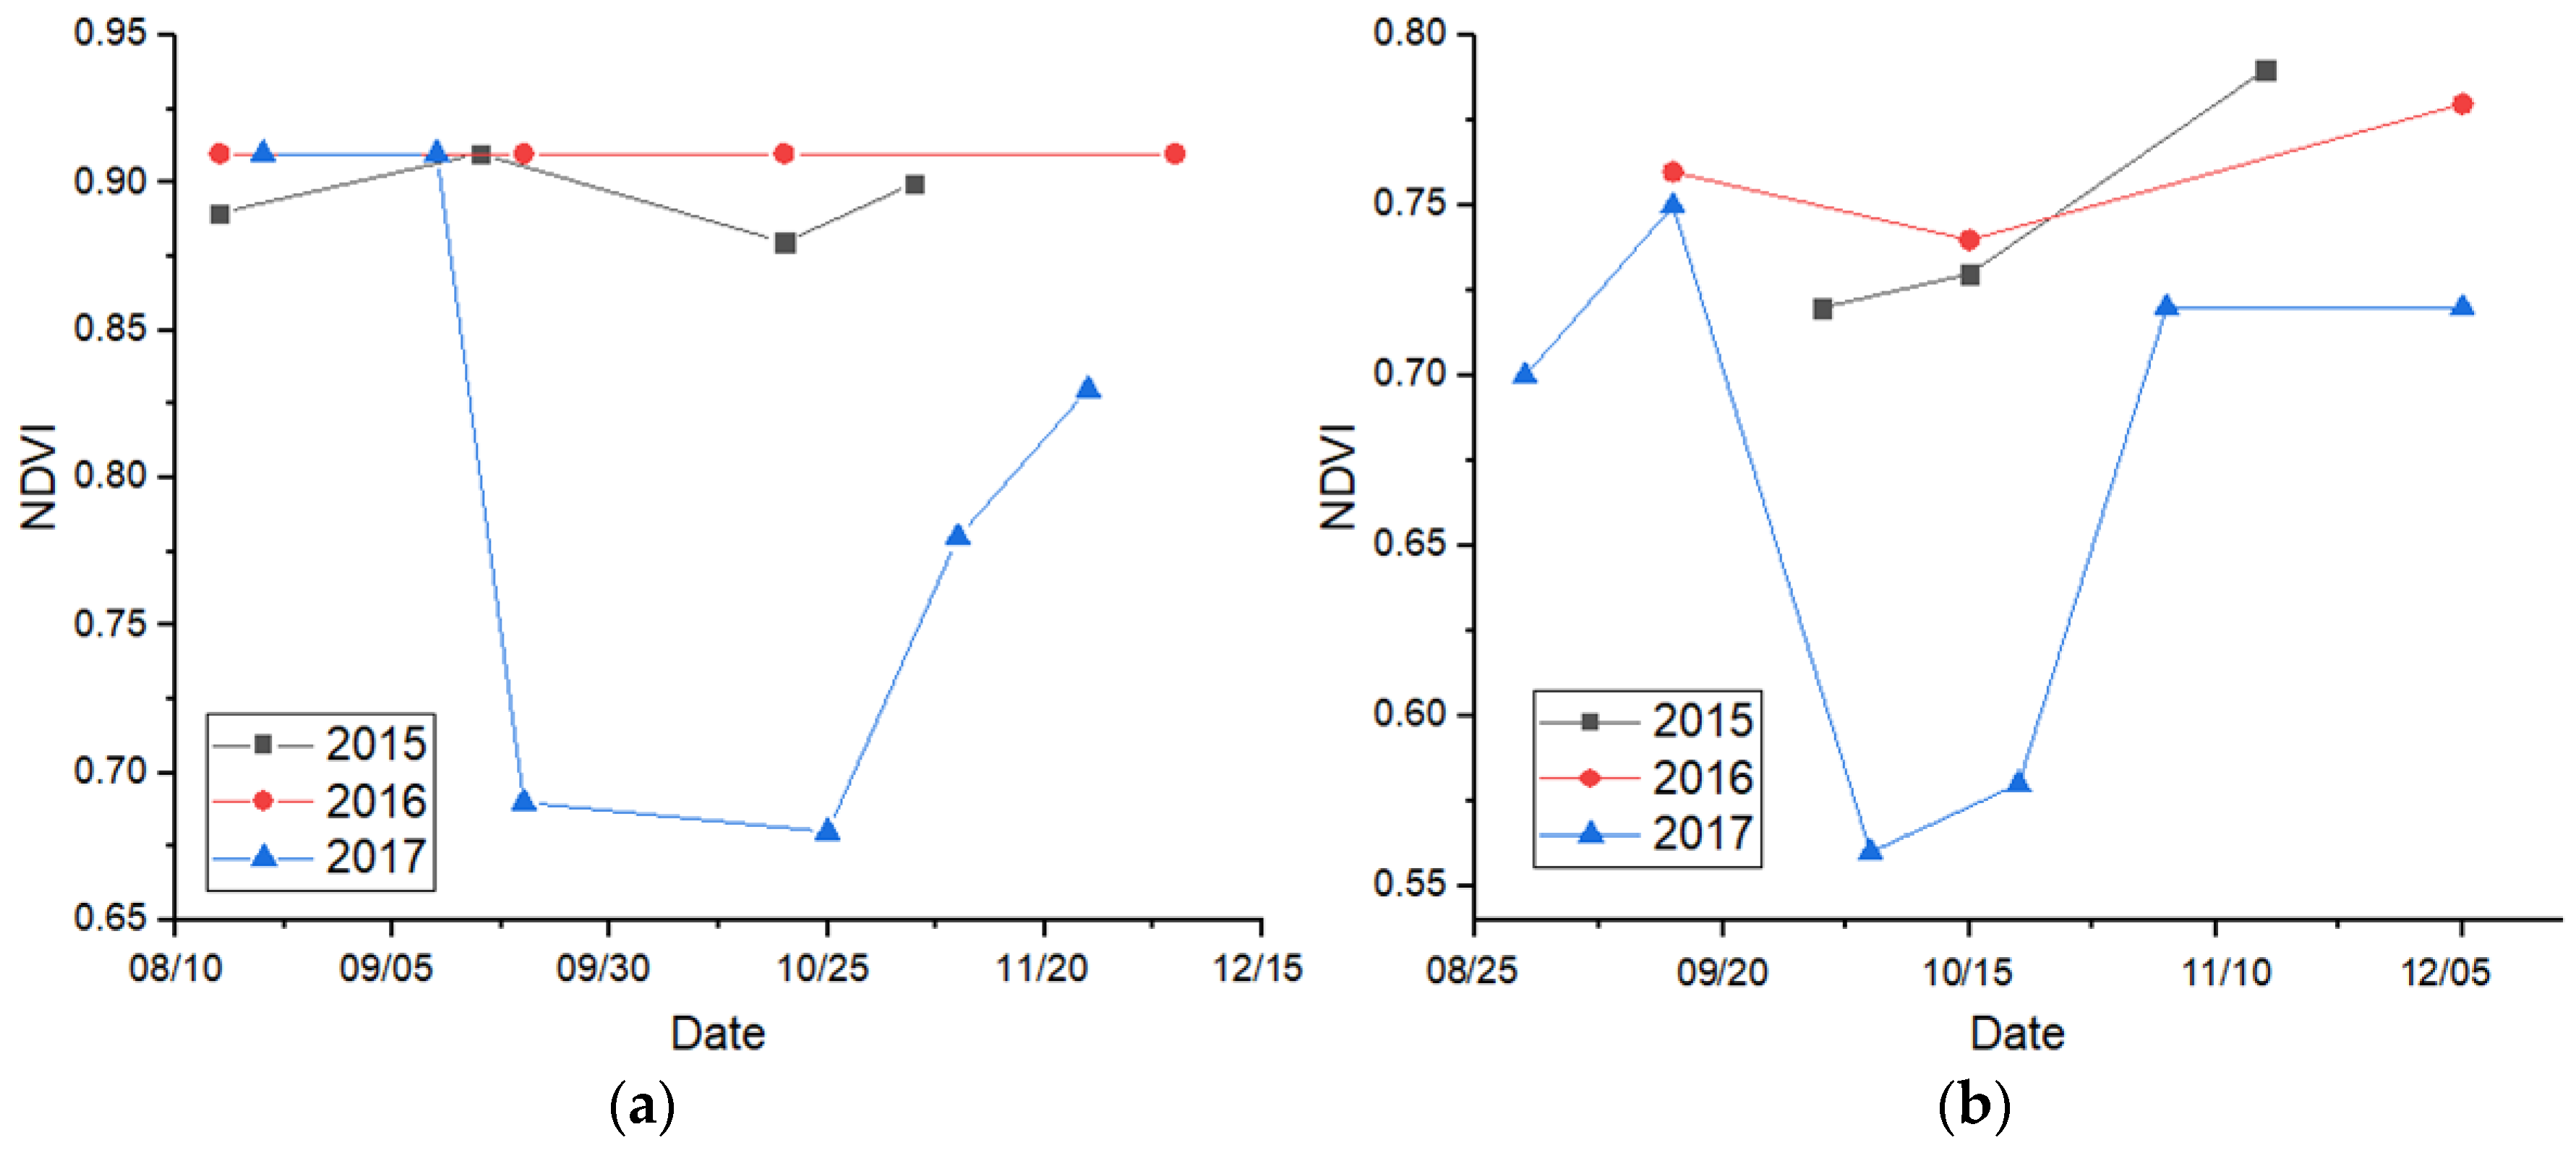
The mean NDVI curves from August to December 2017 are shown in Figure 7. We evaluated short-term impacts and natural recovery trends in NDVI two months after the Hurricane Maria. For Dominica, the mean NDVI value is 0.91 on 9 September 2017, and the mean NDVI decreased to 0.70 on 21 September 2017, three days after landfall. The mean NDVI value is still 0.68 on 23 October 2017, indicating little recovery after one month. By 8 and 24 November 2017, however, the mean NDVI increased to 0.78 and 0.83, indicating significant vegetation recovery after 1.5 months.
Similarly, for Puerto Rico, the mean NDVI value is 0.75 on 17 September 2017, and after Hurricane Maria’s landfall, the mean NDVI decreased to 0.56 on 3 October 2017 (two weeks after landfall). One month after landfall on 19 October 2017, the mean NDVI value is still 0.58. After 1.5 months, the mean NDVI increased to 0.72, indicating significant recovery.
Mean NDVI curves are similar for shape in Dominica and Puerto Rico. Therefore, the NDVI are nearly identical from before and after the hurricane, even though the beginning and ending absolute magnitudes differed for both Dominica and Puerto Rico. The sudden drop in NDVI is shown after hurricane passage, and the slight decrease to rapid rise in NDVI results from the abnormal new leaf bloom in the fall (November). Moreover, supported by the mean NDVI, we found that the majority of damage and natural recovery dynamics occurred within 1.5 months after the hurricane passage.
5.1.2. Comparing to Reference Years: 2015 and 2016
To prove that the NDVI changes in 2017 were caused by hurricane damage rather than seasonal variation, NDVI images from reference years 2015 to 2017 are analyzed (Figure 7). For Dominica, the mean NDVI changed a little from August to November in 2015 and 2016. However, in 2017, affected by Hurricane Maria, the mean NDVI decreased significantly in September and October. It indicates that the decreased NDVI in 2017 is hurricane related. Moreover, the mean NDVI value is 0.83 on 24 November 2017, which is lower than 2015 and 2016 (by about 0.08), it shows that the vegetation has not fully recovered from hurricane damage.
For Puerto Rico, affected by the tropical storm Erika in August 2015, the mean NDVI values in September and October were 0.72 and 0.73, and then the NDVI value increased to 0.79 rapidly from the abnormal bloom in November. The mean NDVI value was around 0.75, and changed a little from August to November in 2016. Affected by Hurricane Maria, the mean NDVI decreased strongly in October 2017, and increased to 0.72 in November and December. However, it is still lower than 2015 and 2016 (by about 0.06), showing that the vegetation has not fully recovered from hurricane damage.
5.2. Effects of Hurricane Maria on Different Land Cover Types
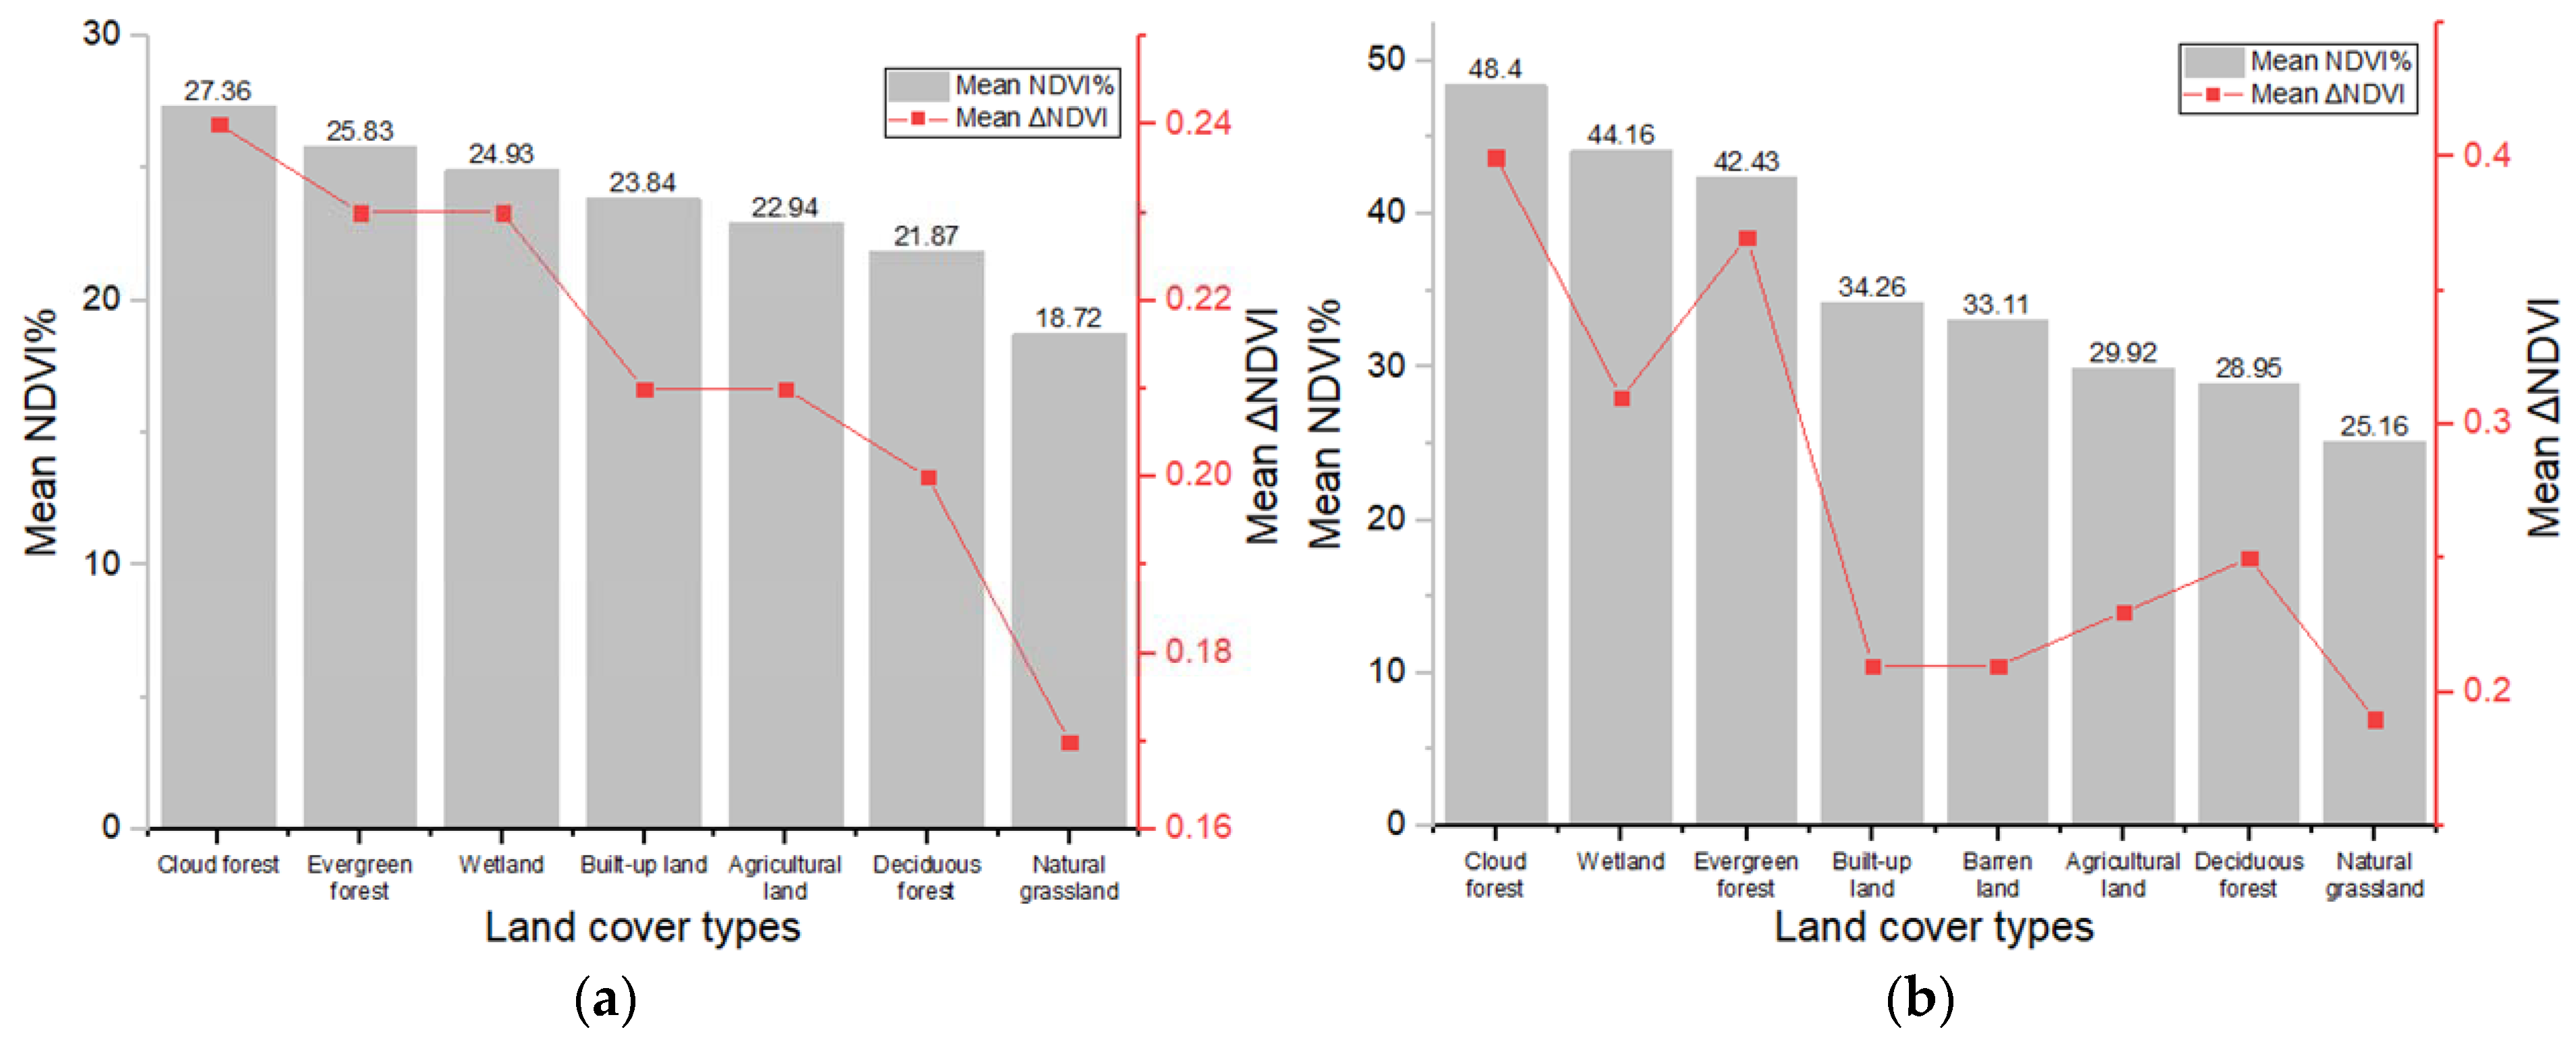
Vegetation is a common landscape cover which is usually affected by the destructive high winds of tropical cyclones [8]. The damage to different land cover types and their rankings are shown in Figure 8. For Dominica, the NDVI% of cloud forest is highest (27.36%), which represents the fact that cloud forest was most affected by Hurricane Maria. This is followed by evergreen forest (25.83%), wetland (24.93%), and built-up land (23.84%). The NDVI% of natural grassland is lowest (18.72%). For Puerto Rico, the NDVI% of cloud forest is highest (48.40%), then followed by wetland (44.16%), evergreen forest (42.43%), and built-up land (34.26%). The NDVI% of natural grassland is lowest (25.16%). Since the cloud forest includes elfin, palm, and tall cloud forests [45], which are much taller than other vegetation, they are much more easily affected by strong winds, and need more time to recover. By contrast, natural grassland is much lower, and not easily and immediately destroyed by hurricanes. A confounding factor is that the taller forests are typically on higher ground, making them more exposed to high winds.
As the effects discussed above, the ranking of NDVI% for different land cover types is similar between Dominica and Puerto Rico. However, the NDVI% of Puerto Rico is higher than Dominica, which indicates that Puerto Rico has heavier damage than Dominica by Hurricane Maria. Since the forest density of Dominica is higher than Puerto Rico, compared with the forest patches, the interior sections of forest patches tend to have less damage, due to interlocking root systems, inter-crown damping during swaying, and the effect of dense crowns reduce wind penetration of the patch [9]. Therefore, with the higher value of vegetation density, the forest is not easily destroyed.
5.3. Influence of Terrain Elevation on Damage
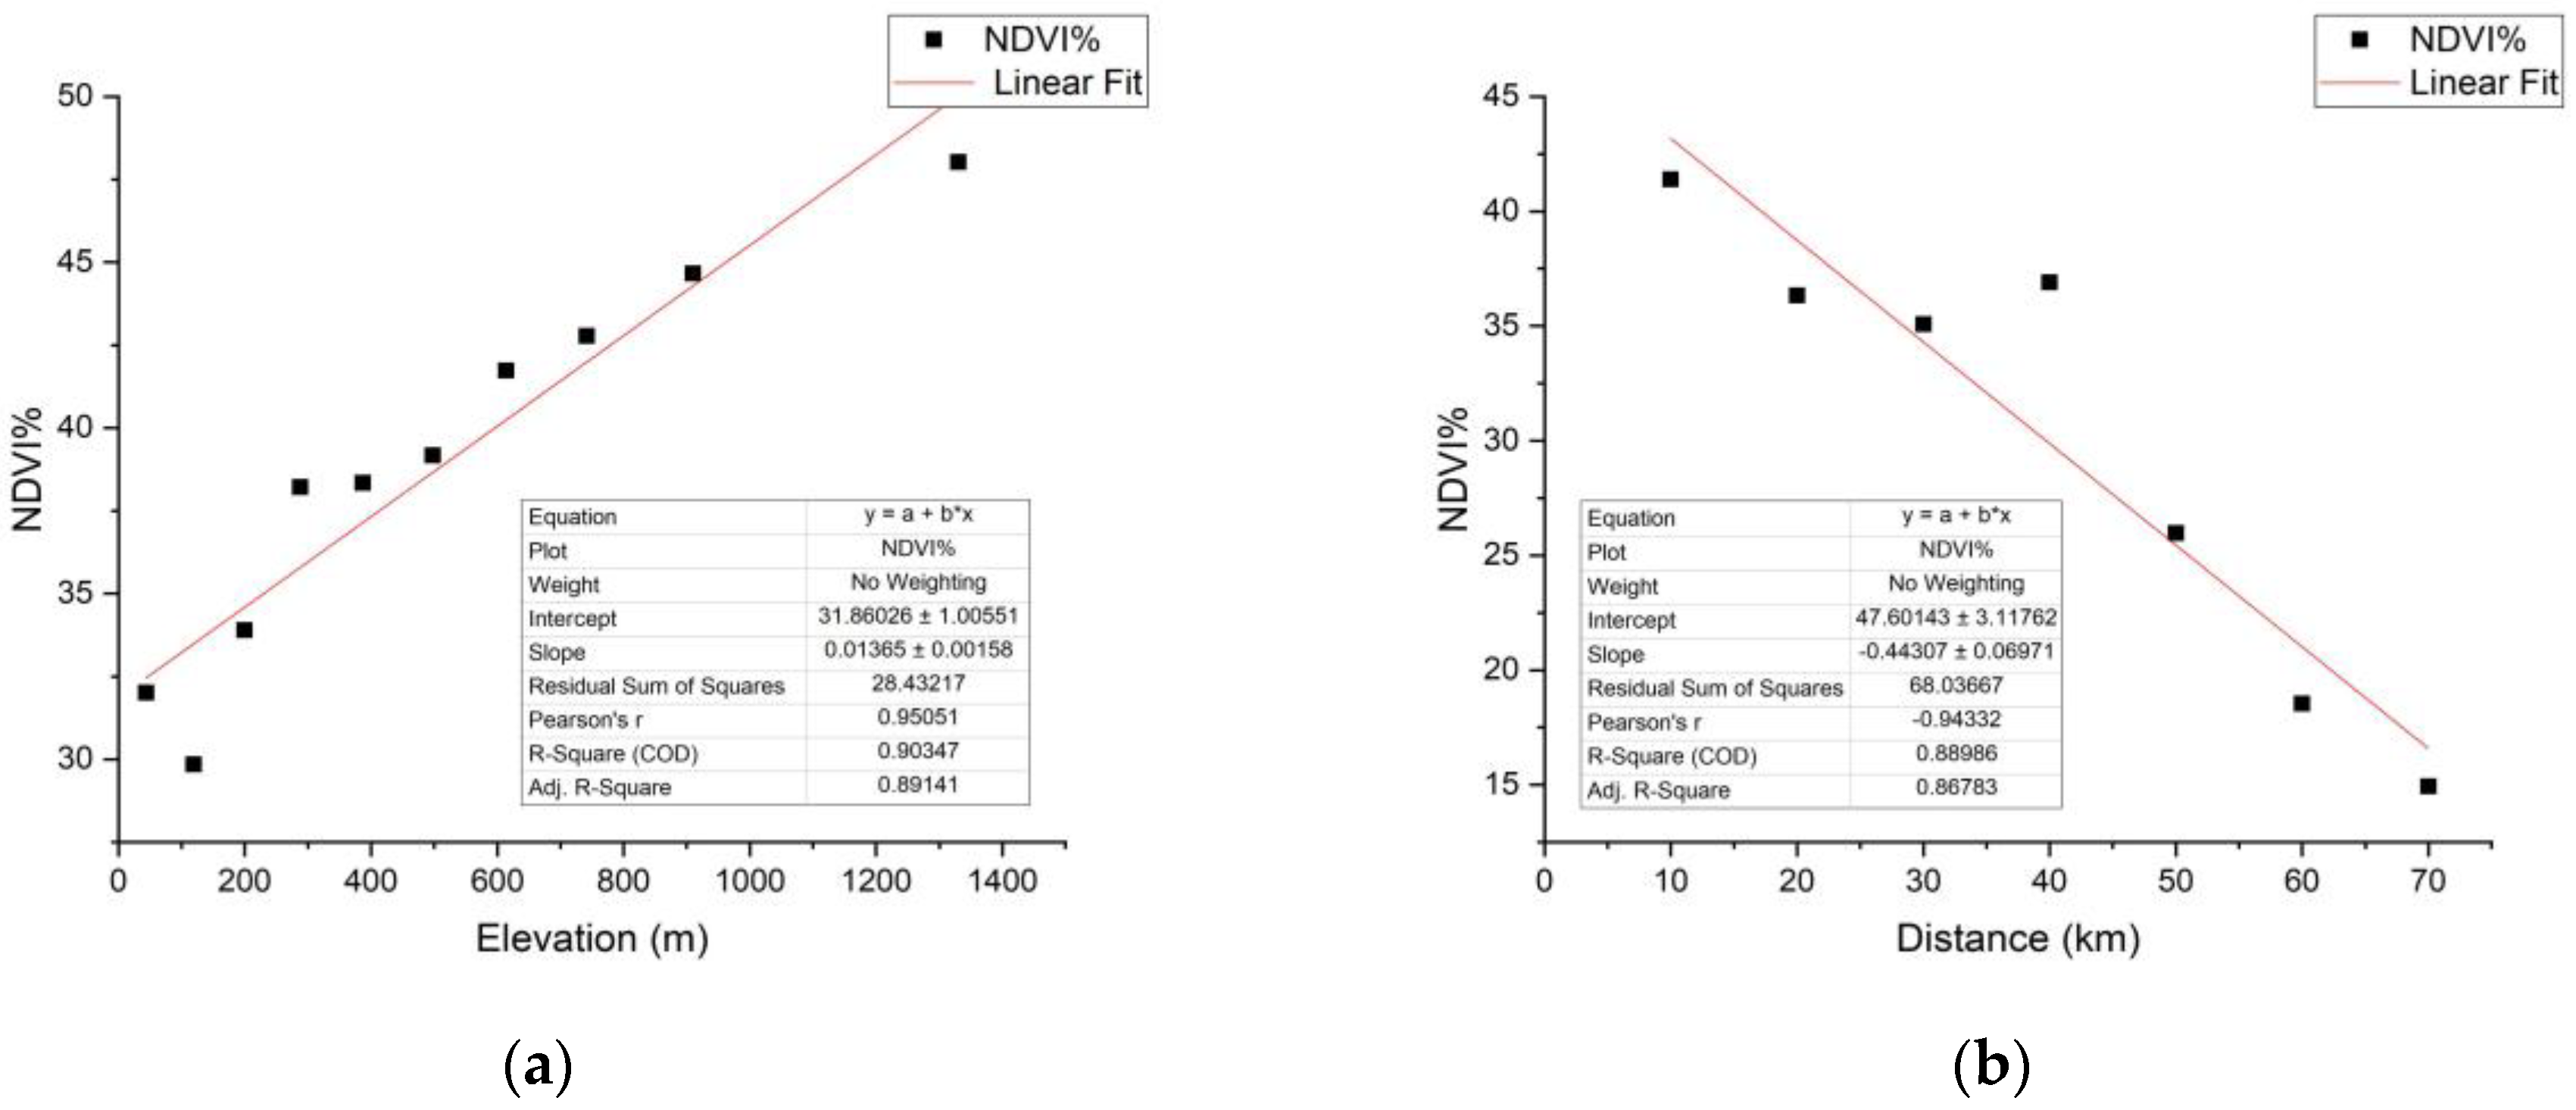
Based on the results of Table 7, there are significant differences in mean ΔNDVI and mean NDVI% among different elevation categories, especially for Puerto Rico. For Dominica, under an elevation of 86 m, the mean ΔNDVI (0.19) and mean NDVI% (21.01%) are lower than others; this is mainly because these areas are used for construction or agriculture. At elevations from 181 to 471 m, the mean ΔNDVI (0.25) and mean NDVI% (25.37%) are higher than the others, mainly because these areas are covered by evergreen and cloud forests. The correlation coefficient is 0.22 between elevation and mean ΔNDVI, and the correlation coefficient is 0.46 between elevation and mean NDVI%, which indicates a slightly positive relationship between the elevation and vegetation damage by hurricane. For Puerto Rico, under an elevation of 119 m, the value of mean ΔNDVI and mean NDVI% are not significantly different between different elevations. When the elevation is higher than 119 m, the value of mean ΔNDVI and mean NDVI% show an increasing trend at higher elevations, which represents the higher elevation, and the heavier damage by hurricane. The correlation coefficient is 0.88 between elevation and mean ΔNDVI, and the correlation coefficient is 0.95 between elevation and mean NDVI%, which indicates a strong positive relationship between the elevation and vegetation damage by hurricane. Comparing Dominica and Puerto Rico, we found that while both islands have a significant positive relationship between terrain elevation and vegetation damage, Puerto Rico has a stronger relationship. Specifically, for Puerto Rico, the linear fit of mean NDVI% and elevation is shown in Figure 9a. The value of Pearson correlation coefficient is 0.95, and R-squared is 0.90, which suggests a strong positive linear relationship between NDVI% and elevation.
5.4. Influence of Distance on Damage
The NDVI change values in Table 8 allow us to evaluate the importance of distance to track [18]. For Dominica, there seems to be little variation of damage with distance. This result is probably because the width of Dominica is smaller than the radius of maximum wind of Hurricane Maria [46].
For Puerto Rico, the role of distance is much clearer. The greater the distance, the lower the mean ΔNDVI and mean NDVI%. The largest mean ΔNDVI and mean NDVI% occurred at distances less than 10 km, over which the eye of the hurricane passed upon departing from the island. At the opposite end of the scale, we find distance greater than 70 km with the lowest mean ΔNDVI and mean NDVI%. The correlation coefficient is −0.93 between distance and mean ΔNDVI, and the correlation coefficient is −0.94 between distance and mean NDVI%, which indicates a strong negative relationship between the distance and vegetation damage by hurricane.
Similarly, the linear fit of mean NDVI% and distance is shown in Figure 9b. The value of Pearson correlation coefficient is −0.94 and R-squared is 0.89, which suggests a strong negative linear relationship between NDVI% and distance. It follows that Hurricane Maria had a significant impact on vegetation damage at Puerto Rico.
6. Conclusions
Landsat 8 OLI and Sentinel-2 data are used to investigate vegetation damage on Dominica and Puerto Rico by Hurricane Maria (September 2017) and related influencing factors (land cover types, terrain elevation, and distance to path) are analyzed. The main conclusions are summarized as follows:
(1) NDVI is used to indicate the extent of vegetation destruction and provide information on damage severity. In early September 2017, there was a sudden drop in NDVI after Hurricane Maria’s landfall (Dominica: from 0.91 to 0.70, and Puerto Rico: from 0.75 to 0.56). Subsequently, there was an abnormal new leaf bloom and the vegetation recovered slowly. By November of 2017, the NDVI had reached nearly normal values (Dominica: 0.83, and Puerto Rico: 0.72) but was still slightly lower than in the previous years of 2015 (Dominica: 0.90; and Puerto Rico: 0.79) and 2016 (Dominica: 0.91, and Puerto Rico: 0.78). This remaining NDVI depression suggests that the vegetation had not fully recovered from hurricane damage. The lack of any NDVI drop in 2015 and 2016 verifies that the 2017 drop was, in fact, hurricane related.
(2) For Dominica, cloud forest (the mean NDVI% is 27.36%) is the most sensitive land cover type from Hurricane Maria, followed by evergreen forest (25.83%), wetland (24.93%), built-up land (23.84%), and natural grassland (18.72%), which is lowest. For Puerto Rico, cloud forest (the mean NDVI% is 48.40%) is the most sensitive type from Hurricane Maria, then followed by wetland (44.16%), evergreen forest (42.43%), built-up land (34.26%), and natural grassland (25.16%), which is lowest. Moreover, the NDVI% of Puerto Rico is higher than Dominica, which indicates that Puerto Rico has heavier damage than Dominica by Hurricane Maria.
(3) Dominica has a weak relationship between elevation and vegetation damage (correlation coefficient is 0.46), and weak, also, between distance and vegetation damage by Hurricane Maria (correlation coefficient is −0.43). Puerto Rico has a strong positive relationship between elevation and vegetation damage (correlation coefficient is 0.95), and has a strong negative relationship between distance and vegetation damage (correlation coefficient is −0.94). The weak correlation of damage with distance for Dominica arises, we believe, from the fact that all of Dominica fell within the radius of maximum wind. No point on Dominica was sufficiently far from the storm track to avoid damage.
(4) For the areas outside the radius of maximum wind in Puerto Rica, the damage by hurricane shows an increasing trend at higher elevations and closer distance.
Compared to previous research on Hurricane Maria [17], the present study uses reference years (2015 and 2016) and compares two islands. We also show how hurricane damage depends on land cover type, terrain elevation, and distance from the storm track. This study shows that Landsat 8 OLI and Sentinel-2 data can reveal significant impacts from the passage of Hurricane Maria. However, cloud contamination is problematic, resulting in the use of only small fraction of the remote sensing images.
Author Contributions
T.H. performed the experiments and wrote the paper; and R.B.S. designed the research and revised the paper. All authors commented on and approved the final manuscript.
Funding
This research was funded by [the National Natural Science Foundation of China] grant number [41676167 and 21377166].
Acknowledgments
We thank anonymous reviewers for their constructive comments and financial support from China Scholarship Council.
Conflicts of Interest
The authors declare no conflict of interest.
References
- Blackwell, C. Power law or lognormal? Distribution of normalized hurricane damages in the United States, 1900–2005. Nat. Hazards Rev. 2015, 16, 04014024. [Google Scholar] [CrossRef]
- Brun, J.; Barros, A.P. Vegetation activity monitoring as an indicator of eco-hydrological impacts of extreme events in the southeastern USA. Int. J. Remote Sens. 2013, 34, 519–544. [Google Scholar] [CrossRef]
- Zhang, D.R.; Zhang, Y.Z.; Hu, T.G.; Xie, B.; Xu, J.F. A comparison of HY-2 and QuikSCAT vector wind products for tropical cyclone track and intensity development monitoring. IEEE Geosci. Remote Sens. 2014, 11, 1365–1369. [Google Scholar] [CrossRef]
- Hu, T.; Wang, X.; Zhang, D.; Zheng, G.; Zhang, Y.; Wu, Y.; Xie, B. Study on typhoon center monitoring based on HY-2 and FY-2 data. IEEE Geosci. Remote Sens. 2017, 14, 2350–2354. [Google Scholar] [CrossRef]
- Shuckburgh, E.; Mitchell, D.; Stott, P. Hurricanes Harvey, Irma and Maria: How natural were these ‘natural disasters? Weather 2017, 72, 353–354. [Google Scholar] [CrossRef]
- Hurricane Maria. Available online: https://en.wikipedia.org/wiki/Hurricane_Maria (accessed on 9 January 2018).
- Rodgers, J.C.; Murrah, A.W.; Cooke, W.H. The impact of Hurricane Katrina on the coastal vegetation of the Weeks Bay Reserve, Alabama from NDVI data. Estuar. Coasts 2009, 32, 496–507. [Google Scholar] [CrossRef]
- Hoque, M.A.-A.; Phinn, S.; Roelfsema, C.; Childs, I. Assessing tropical cyclone impacts using object-based moderate spatial resolution image analysis: A case study in Bangladesh. Int. J. Remote Sens. 2016, 37, 5320–5343. [Google Scholar] [CrossRef]
- Zhang, X.; Wang, Y.; Jiang, H.; Wang, X. Remote-sensing assessment of forest damage by Typhoon Saomai and its related factors at landscape scale. Int. J. Remote Sens. 2013, 34, 7874–7886. [Google Scholar] [CrossRef]
- Klemas, V.V. The role of remote sensing in predicting and determining coastal storm impacts. J. Coast. Res. 2009, 25, 1264–1275. [Google Scholar] [CrossRef]
- Horner, M.W.; Widener, M.J. The effects of transportation network failure on people’s accessibility to hurricane disaster relief goods: A modeling approach and application to a Florida case study. Nat. Hazards 2011, 59, 1619–1634. [Google Scholar] [CrossRef]
- Bhowmik, A.K.; Cabral, P. Cyclone Sidr impacts on the Sundarbans floristic diversity. Earth Sci. Res. 2013, 2, 62–79. [Google Scholar] [CrossRef]
- Ramsey, E.W.; Hodgson, M.E.; Sapkota, S.K.; Nelson, G.A. Forest impact estimated with NOAA AVHRR and Landsat TM data related to an empirical hurricane wind-field distribution. Remote Sens. Environ. 2001, 77, 279–292. [Google Scholar] [CrossRef]
- Staben, G.W.; Evans, K.G. Estimates of tree canopy loss as a result of Cyclone Monica, in the Magela Creek catchment northern Australia. Aust. Ecol. 2008, 33, 562–569. [Google Scholar] [CrossRef]
- Villa, P.; Boschetti, M.; Morse, J.L.; Politte, N. A multitemporal analysis of tsunami impact on coastal vegetation using remote sensing: A case study on Koh Phra Thong Island, Thailand. Nat. Hazards 2012, 64, 667–689. [Google Scholar] [CrossRef]
- Negron-Juarez, R.; Baker, D.B.; Chambers, J.Q.; Hurtt, G.C.; Goosem, S. Multi-scale sensitivity of Landsat and MODIS to forest disturbance associated with tropical cyclones. Remote Sens. Environ. 2014, 140, 679–689. [Google Scholar] [CrossRef]
- Feng, Y.L.; Negron-Juarez, N.I.; Patricola, C.M.; Collins, W.D.; Uriarte, M.; Hall, J.S.; Clinton, N.; Chambers, J.Q. Rapid remote sensing assessment of impacts from Hurricane Maria on forests of Puerto Rico. PeerJ Preprints 2018, 6, 1–13. [Google Scholar] [CrossRef]
- Ayala-Silva, T.; Twumasi, Y.A. Hurricane Georges and vegetation change in Puerto Rico using AVHRR satellite data. Int. J. Remote Sens. 2004, 25, 1629–1640. [Google Scholar] [CrossRef]
- Rogan, J.; Schneider, L.; Christman, Z.; Millones, M.; Lawrence, D.; Schmook, B. Hurricane disturbance mapping using MODIS EVI data in the southeastern Yucatán, Mexico. Remote Sens. Lett. 2010, 2, 259–267. [Google Scholar] [CrossRef]
- Liu, Y.; Liu, R.; Ge, Q. Evaluating the vegetation destruction and recovery of Wenchuan earthquake using MODIS data. Nat. Hazards 2010, 54, 851–862. [Google Scholar] [CrossRef]
- Martinez, J.M.; Toan, T.L. Mapping of flood dynamics and spatial distribution of vegetation in the Amazon floodplain using multitemporal SAR data. Remote Sens. Environ. 2007, 108, 209–223. [Google Scholar] [CrossRef]
- Teillet, P.M.; Staenz, K.; Williams, D.J. Effects of spectral, spatial, and radiometric characteristics on remote sensing vegetation indices of forested regions. Remote Sens. Environ. 1997, 61, 139–149. [Google Scholar] [CrossRef]
- Oindo, B.O.; Skidmore, A.K. Interannual variability of NDVI and species richness in Kenya. Int. J. Remote Sens. 2002, 23, 285–298. [Google Scholar] [CrossRef]
- Ramsey, E.W.; Chappell, D.K.; Baldwin, D.G. AVHRR imagery used to identify hurricane damage in a forested wetland of Louisiana. Photogramm. Eng. Remote Sens. 1997, 63, 293–297. [Google Scholar]
- Hurricane MARIA Advisory Archive. Available online: http://www.nhc.noaa.gov/archive/2017/MARIA.shtml? (accessed on 9 January 2018).
- Pasch, R.J.; Penny, A.B.; Berg, R. Tropical Cyclone Report Hurricane Maria (AL152017); National Hurricane Center: Miami, FL, USA, 2018. [Google Scholar]
- Smith, R.B.; Minder, J.R.; Nugent, A.D.; Storelvmo, T.; Kirshbaum, D.J.; Warren, R.; Lareau, N.; Palany, P.; James, A.; French, J. Orographic precipitation in the tropics the Dominica experiment. Bull. Am. Meteorol. Soc. 2012, 93, 1567–1579. [Google Scholar] [CrossRef]
- Smith, R.B.; Schafer, P.; Kirshbaum, D.J.; Regina, E. Orographic precipitation in the tropics: Experiments in Dominica. J. Atmos. Sci. 2009, 66, 1698–1716. [Google Scholar] [CrossRef]
- Minder, J.R.; Smith, R.B.; Nugent, A.D. The dynamics of ascent-forced orographic convection in the tropics: Results from Dominica. J. Atmos. Sci. 2013, 70, 4067–4088. [Google Scholar] [CrossRef]
- Smith, R.B.; Schafer, P.; Kirshbaum, D. Orographic enhancement of precipitation inside Hurricane Dean. J. Hydrometeorol. 2009, 10, 820–831. [Google Scholar] [CrossRef]
- Nugent, A.; Rios-Berrios, R. Factors leading to extreme precipitation on Dominica from Tropical Storm Erika (2015). Mon. Weather Rev. 2018. [Google Scholar] [CrossRef]
- Wang, C.; Yu, M.; Gao, Q. Continued reforestation and urban expansion in the new century of a tropical island in the Caribbean. Remote Sens. 2017, 9, 731. [Google Scholar] [CrossRef]
- Zhu, Z.; Woodcock, C.E. Object-based cloud and cloud shadow detection in Landsat imagery. Remote Sens. Environ. 2012, 118, 83–94. [Google Scholar] [CrossRef]
- Zhu, Z.; Wang, S.X.; Woodcock, C.E. Improvement and expansion of the Fmask algorithm: Cloud, cloud shadow, and snow detection for Landsats 4–7, 8, and Sentinel 2 images. Remote Sens. Environ. 2015, 159, 269–277. [Google Scholar] [CrossRef]
- Ghulam, A. Monitoring tropical forest degradation in Betampona Nature Reserve, Madagascar using multisource remote sensing data fusion. IEEE J. Sel. Top. Appl. Earth Obs. Remote Sens. 2014, 7, 4960–4971. [Google Scholar] [CrossRef]
- Bernstein, L.S.; Adler-Golden, S.M.; Sundberg, R.L.; Levine, R.Y.; Perkins, T.C.; Berk, A.; Ratkowski, A.J.; Felde, G.; Hoke, M.L. A new method for atmospheric correction and aerosol optical property retrieval for VIS-SWIR multi- and hyperspectral imaging sensors: QUAC (QUick Atmospheric Correction). In Proceedings of the 25th IEEE International Geoscience and Remote Sensing Symposium, Seoul, Korea, 25–29 July 2005. [Google Scholar]
- Li, A.N.; Wang, Q.F.; Bian, J.H.; Lei, G.B. An improved physics-based model for topographic correction of Landsat TM images. Remote Sens. 2015, 7, 6296–6319. [Google Scholar] [CrossRef]
- Helmer, E.H.; Ramos, O.; Lopez, T.D.M.; Quinones, M.; Diaz, W. Mapping the forest type and land cover of Puerto Rico, a component of the Caribbean bodiversity hotspot. Caribb. J. Sci. 2002, 38, 165–183. [Google Scholar]
- Caribbean Land Cover Analyses. Available online: https://lca.usgs.gov/carland/approach.php (accessed on 9 January 2018).
- Mui, A.; He, Y.H.; Weng, Q.H. An object-based approach to delineate wetlands across landscapes of varied disturbance with high spatial resolution satellite imagery. ISPRS J. Photogramm. Remote Sens. 2015, 109, 30–46. [Google Scholar] [CrossRef]
- Cakir, H.I.; Khorram, S.; Nelson, S.A.C. Correspondence analysis for detecting land cover change. Remote Sens. Environ. 2006, 102, 306–317. [Google Scholar] [CrossRef]
- Goto, K.; Goto, T.; Nmor, J.C.; Minematsu, K.; Gotoh, K. Evaluating salinity damage to crops through satellite data analysis: Application to typhoon affected areas of southern Japan. Nat. Hazards 2015, 75, 2815–2828. [Google Scholar] [CrossRef]
- Jenks Natural Breaks Optimization. Available online: https://en.wikipedia.org/wiki/Jenks_natural_breaks_optimization (accessed on 9 January 2018).
- Multiple Ring Buffer. Available online: http://pro.arcgis.com/en/pro-app/tool-reference/analysis/multiple-ring-buffer.htm (accessed on 9 January 2018).
- Helmer, E.H.; Kennaway, T. The forest types and ages cleared for land development in Puerto Rico. GIsci. Remote Sens. 2007, 44, 356–382. [Google Scholar] [CrossRef]
- Lajoie, F.; Walsh, K. A technique to determine the radius of maximum wind of a tropical cyclone. Weather Forecast. 2008, 23, 1007–1015. [Google Scholar] [CrossRef]
Figure 1.
The moving track of Hurricane Maria and the location of Dominica and Puerto Rico.

Figure 2.
The flowchart for analyzing influencing factors of Hurricane Maria.

Figure 3.
Spatial distribution of ΔNDVI. (a) Dominica (pre-hurricane: 09/09/2017, post-hurricane: 09/21/2017); (b) Puerto Rico (pre-hurricane: 09/17/2017, post-hurricane: 10/03/2017).
Figure 3.
Spatial distribution of ΔNDVI. (a) Dominica (pre-hurricane: 09/09/2017, post-hurricane: 09/21/2017); (b) Puerto Rico (pre-hurricane: 09/17/2017, post-hurricane: 10/03/2017).

Figure 4.
The histogram of ΔNDVI. (a) Dominica (ΔNDVI 2017: pre-hurricane: 09/09/2017, post-hurricane: 09/21/2017, ΔNDVI 2016: pre-hurricane: 09/18/2016, post-hurricane: 10/20/2016, ΔNDVI 2015: pre-hurricane: 09/16/2015, post-hurricane: 10/18/2015); (b) Puerto Rico (ΔNDVI 2017: pre-hurricane: 09/17/2017, post-hurricane: 10/03/2017, ΔNDVI 2016: pre-hurricane: 09/14/2016, post-hurricane: 10/16/2016, ΔNDVI 2015: pre-hurricane: 09/28/2015, post-hurricane: 10/14/2015).

Figure 5.
2017 Land cover maps. (a) Dominica; (b) Puerto Rico.

Figure 6.
The elevation classification (meters) and distance maps (kilometers). (a) The elevation classification map of Dominica; (b) the elevation classification map of Puerto Rico; (c) the distance map of Dominica; (d) the distance map of Puerto Rico.
Figure 6.
The elevation classification (meters) and distance maps (kilometers). (a) The elevation classification map of Dominica; (b) the elevation classification map of Puerto Rico; (c) the distance map of Dominica; (d) the distance map of Puerto Rico.


Figure 7.
The NDVI changes in long-term. (a) Dominica; (b) Puerto Rico.

Figure 8.
The mean NDVI% and ΔNDVI of different land cover types and their rankings. (a) Dominica; (b) Puerto Rico.
Figure 8.
The mean NDVI% and ΔNDVI of different land cover types and their rankings. (a) Dominica; (b) Puerto Rico.

Figure 9.
The linear regression results for Puerto Rico. (a) The strong positive relationship between mean NDVI% and elevation; (b) the strong negative relationship between mean NDVI% and distance.
Figure 9.
The linear regression results for Puerto Rico. (a) The strong positive relationship between mean NDVI% and elevation; (b) the strong negative relationship between mean NDVI% and distance.


Table 1.
Detail quantification of the damage caused by Hurricane Maria.
| Region | Total Deaths (Unit: Person) | Total Affected (Unit: Person) | Total Damage (Unit: US $) | Insured Losses (Unit: US $) |
|---|---|---|---|---|
| Dominica | 64 | 71,393 | 380,490 | 0 |
| Puerto Rico | 44 | 5700 | 68,000,000 | 30,000,000 |
* Source: EM-DAT: The Emergency Events Database—Universite catholique de Louvain (UCL)—CRED, D. Guha-Sapir—www.emdat.be, Brussels, Belgium.
Table 2.
Satellite imagery used in this study.
| Date | Sensor | Resolution (m) | Sun Elevation (Degree) | Cloud Cover (Percent) | Region |
|---|---|---|---|---|---|
| 14:26 08/15/2015 | Landsat 8 OLI | 30 | 65.07 | 42.14 | Dominica |
| 14:26 09/16/2015 | Landsat 8 OLI | 30 | 63.49 | 24.92 | Dominica |
| 14:26 10/18/2015 | Landsat 8 OLI | 30 | 57.17 | 16.77 | Dominica |
| 14:26 11/03/2015 | Landsat 8 OLI | 30 | 53.03 | 6.69 | Dominica |
| 14:47 08/15/2016 | Sentinel-2 | 10 | 70.06 | 6.86 | Dominica |
| 14:26 09/18/2016 | Landsat 8 OLI | 30 | 63.19 | 24.36 | Dominica |
| 14:26 10/20/2016 | Landsat 8 OLI | 30 | 56.51 | 12.53 | Dominica |
| 14:26 12/07/2016 | Landsat 8 OLI | 30 | 45.61 | 15.46 | Dominica |
| 14:26 08/20/2017 | Landsat 8 OLI | 30 | 65.14 | 18.30 | Dominica |
| 14:47 09/09/2017 | Sentinel-2 | 10 | 68.70 | 5.75 | Dominica |
| 14:26 09/21/2017 | Landsat 8 OLI | 30 | 62.77 | 10.55 | Dominica |
| 14:26 10/23/2017 | Landsat 8 OLI | 30 | 55.78 | 38.72 | Dominica |
| 14:26 11/08/2017 | Landsat 8 OLI | 30 | 51.64 | 16.79 | Dominica |
| 14:26 11/24/2017 | Landsat 8 OLI | 30 | 47.93 | 5.97 | Dominica |
| 14:50 09/28/2015 | Landsat 8 OLI | 30 | 60.12 | 6.81 | Puerto Rico |
| 14:50 10/14/2015 | Landsat 8 OLI | 30 | 56.24 | 9.95 | Puerto Rico |
| 14:50 11/15/2015 | Landsat 8 OLI | 30 | 47.76 | 5.62 | Puerto Rico |
| 14:50 09/14/2016 | Landsat 8 OLI | 30 | 62.66 | 5.04 | Puerto Rico |
| 14:50 10/16/2016 | Landsat 8 OLI | 30 | 55.55 | 4.22 | Puerto Rico |
| 14:50 12/03/2016 | Landsat 8 OLI | 30 | 47.13 | 12.81 | Puerto Rico |
| 14:50 09/01/2017 | Landsat 8 OLI | 30 | 64.31 | 14.64 | Puerto Rico |
| 14:50 09/17/2017 | Landsat 8 OLI | 30 | 62.19 | 8.08 | Puerto Rico |
| 14:50 10/03/2017 | Landsat 8 OLI | 30 | 58.90 | 6.71 | Puerto Rico |
| 14:50 10/19/2017 | Landsat 8 OLI | 30 | 54.79 | 8.28 | Puerto Rico |
| 14:50 11/04/2017 | Landsat 8 OLI | 30 | 50.45 | 8.98 | Puerto Rico |
| 14:50 12/06/2017 | Landsat 8 OLI | 30 | 43.47 | 29.04 | Puerto Rico |
Table 3.
Land cover types for the islands of Dominica and Puerto Rico.
| ID | Land Cover Types | Description |
|---|---|---|
| 1 | Urban or built-up land | High-medium density urban or low-medium density built-up land (rural or residential). |
| 2 | Agricultural land | Sugar cane, fruits, active sun coffee, mixed woody agriculture, pasture, hay, other crops, and grassy areas. |
| 3 | Natural grassland, natural shrubland | Drought deciduous open woodland or short/medium/tail grassland |
| 4 | Deciduous forest | Broadleaf drought deciduous or semi-deciduous forest, lowland or submontane (dry, dry-moist) |
| 5 | Evergreen forest | Broadleaf seasonal evergreen and evergreen forest, lowland or submontane (moist, wet, rain) |
| 6 | Cloud forest | Broadleaf evergreen cloud forest, submontane or lower montane (wet, rain) |
| 7 | Wetland | Non-forested wetland (emergent wetland and salt or mudflat) and forested wetland (mangrove, Pterocarpus swamp) |
| 8 | Barren land | Quarry, coastal sand, rock and bare soil |
| 9 | Water | Water—permanent |
Table 4.
The changes in NDVI for Dominica.
| 2015 | 2016 | 2017 | ||||||
|---|---|---|---|---|---|---|---|---|
| Date | Mean NDVI | Counts (Pixels) | Date | Mean NDVI | Counts (Pixels) | Date | Mean NDVI | Counts (Pixels) |
| 08/15/2015 | 0.89 | 141,441 | 08/15/2016 | 0.91 | 207,615 | 08/20/2017 | 0.91 | 130,993 |
| 09/16/2015 | 0.91 | 141,441 | 09/18/2016 | 0.91 | 207,615 | 09/09/2017 | 0.91 | 130,993 |
| 10/18/2015 | 0.88 | 141,441 | 10/20/2016 | 0.91 | 207,615 | 09/21/2017 | 0.69 | 130,993 |
| 11/03/2015 | 0.90 | 141,441 | 12/07/2016 | 0.91 | 207,615 | 10/23/2017 | 0.68 | 130,993 |
| 11/08/2017 | 0.78 | 130,993 | ||||||
| 11/24/2017 | 0.83 | 130,993 | ||||||
Table 5.
The changes in NDVI for Puerto Rico.
| 2015 | 2016 | 2017 | ||||||
|---|---|---|---|---|---|---|---|---|
| Date | Mean NDVI | Counts (Pixels) | Date | Mean NDVI | Counts (Pixels) | Date | Mean NDVI | Counts (Pixels) |
| 09/28/2015 | 0.72 | 4,994,576 | 09/14/2016 | 0.76 | 4,425,283 | 09/01/2017 | 0.70 | 3,642,897 |
| 10/14/2015 | 0.73 | 4,994,576 | 10/16/2016 | 0.74 | 4,425,283 | 09/17/2017 | 0.75 | 3,642,897 |
| 11/15/2015 | 0.79 | 4,994,576 | 12/03/2016 | 0.78 | 4,425,283 | 10/03/2017 | 0.56 | 3,642,897 |
| 10/19/2017 | 0.58 | 3,642,897 | ||||||
| 11/04/2017 | 0.72 | 3,642,897 | ||||||
| 12/06/2017 | 0.72 | 3,642,897 | ||||||
Table 6.
The NDVI change statistics for different land cover types for Dominica (pre-hurricane: 09/09/2017, post-hurricane: 09/21/2017) and Puerto Rico (pre-hurricane: 09/17/2017, post-hurricane: 10/03/2017).
Table 6.
The NDVI change statistics for different land cover types for Dominica (pre-hurricane: 09/09/2017, post-hurricane: 09/21/2017) and Puerto Rico (pre-hurricane: 09/17/2017, post-hurricane: 10/03/2017).
| Land Cover Types | Dominica | Puerto Rico | ||||
|---|---|---|---|---|---|---|
| Counts (Pixels) | Mean ΔNDVI | Mean NDVI% | Counts (Pixels) | Mean ΔNDVI | Mean NDVI% | |
| Built-up land | 918 | 0.21 | 23.84 | 414,430 | 0.21 | 34.26 |
| Agricultural land | 55,314 | 0.21 | 22.94 | 1,424,071 | 0.23 | 29.92 |
| Natural grassland | 1882 | 0.17 | 18.72 | 28,407 | 0.19 | 25.16 |
| Deciduous forest | 18,817 | 0.20 | 21.87 | 344,688 | 0.25 | 28.95 |
| Evergreen forest | 52,911 | 0.23 | 25.83 | 1,300,332 | 0.37 | 42.43 |
| Cloud forest | 413 | 0.24 | 27.36 | 54,564 | 0.40 | 48.40 |
| Wetland | 738 | 0.23 | 24.93 | 51,807 | 0.31 | 44.16 |
| Barren land | - | - | - | 24,598 | 0.21 | 33.11 |
Table 7.
The vegetation index statistics of different elevation for Dominica and Puerto Rico.
| Dominica | Puerto Rico | ||||||
|---|---|---|---|---|---|---|---|
| Elevation (m) | Count (Pixels) | Mean ΔNDVI | Mean NDVI% | Elevation (m) | Count (Pixels) | Mean ΔNDVI | Mean NDVI% |
| <86 | 24,867 | 0.19 | 21.01 | <44 | 735,044 | 0.23 | 32.01 |
| 86–181 | 36,095 | 0.21 | 23.43 | 44–119 | 712,529 | 0.23 | 29.85 |
| 181–275 | 25,885 | 0.23 | 25.37 | 119–200 | 614,978 | 0.28 | 33.90 |
| 275–371 | 19,598 | 0.23 | 25.63 | 200–288 | 464,776 | 0.33 | 38.22 |
| 371–471 | 14,193 | 0.23 | 25.37 | 288–387 | 404,579 | 0.33 | 38.34 |
| 471–578 | 7302 | 0.21 | 23.78 | 387–498 | 273,367 | 0.33 | 39.17 |
| 578–703 | 2292 | 0.21 | 24.29 | 498–614 | 189,079 | 0.34 | 41.73 |
| 703–860 | 593 | 0.18 | 21.49 | 614–742 | 140,231 | 0.35 | 42.77 |
| 860–1082 | 160 | 0.25 | 29.00 | 742–910 | 97,888 | 0.36 | 44.66 |
| >1082 | 9 | 0.09 | 11.90 | >910 | 24,586 | 0.39 | 48.02 |
Table 8.
The vegetation index statistics of different distance for Dominica and Puerto Rico.
| Dominica | Puerto Rico | ||||||
|---|---|---|---|---|---|---|---|
| Distance (km) | Count (Pixels) | Mean ΔNDVI | Mean NDVI% | Distance (km) | Count (Pixels) | Mean ΔNDVI | Mean NDVI% |
| 2 | 10,796 | 0.27 | 29.56 | 10 | 883,313 | 0.33 | 41.39 |
| 4 | 7698 | 0.27 | 29.94 | 20 | 798,768 | 0.29 | 36.33 |
| 6 | 10,779 | 0.22 | 23.86 | 30 | 833,555 | 0.29 | 35.08 |
| 8 | 23,863 | 0.23 | 25.60 | 40 | 566,369 | 0.30 | 36.90 |
| 10 | 30,337 | 0.21 | 23.07 | 50 | 371,491 | 0.20 | 25.98 |
| 12 | 27,195 | 0.18 | 19.42 | 60 | 181,916 | 0.14 | 18.54 |
| 14 | 12,330 | 0.20 | 22.49 | 70 | 21,645 | 0.11 | 14.93 |
| 16 | 3481 | 0.23 | 25.00 | - | - | - | - |
| 18 | 4515 | 0.26 | 27.45 | - | - | - | - |
© 2018 by the authors. Licensee MDPI, Basel, Switzerland. This article is an open access article distributed under the terms and conditions of the Creative Commons Attribution (CC BY) license (http://creativecommons.org/licenses/by/4.0/).
Share and Cite
MDPI and ACS Style
Hu, T.; Smith, R.B. The Impact of Hurricane Maria on the Vegetation of Dominica and Puerto Rico Using Multispectral Remote Sensing. Remote Sens. 2018, 10, 827. https://0-doi-org.brum.beds.ac.uk/10.3390/rs10060827
AMA Style
Hu T, Smith RB. The Impact of Hurricane Maria on the Vegetation of Dominica and Puerto Rico Using Multispectral Remote Sensing. Remote Sensing. 2018; 10(6):827. https://0-doi-org.brum.beds.ac.uk/10.3390/rs10060827
Chicago/Turabian StyleHu, Tangao, and Ronald B. Smith. 2018. "The Impact of Hurricane Maria on the Vegetation of Dominica and Puerto Rico Using Multispectral Remote Sensing" Remote Sensing 10, no. 6: 827. https://0-doi-org.brum.beds.ac.uk/10.3390/rs10060827
Note that from the first issue of 2016, this journal uses article numbers instead of page numbers. See further details here.