A Personalized QoS Prediction Approach for CPS Service Recommendation Based on Reputation and Location-Aware Collaborative Filtering


Abstract
:1. Introduction
2. Related Work
- We propose an improved method for calculating users’ reputation, based on the approach in reference [17]. Different to the probability model and the treatment of data from the identified unreliable users, our method uses statistical interval partitioning, Gaussian normal distribution, and Dirichlet probability distribution to calculate users’ reputation. Next, the untrusted users are identified and their unreliable QoS data are fixed by the mean value of reliable users. This ensures the credibility of user data and avoids exacerbating the sparseness of QoS data due to the direct deletion of unreliable data.
- In order to identify similar users/services and alleviate data sparseness, we propose a geographic proximity recognition algorithm based on the locations of users/services. The algorithm fully exploits the geographic relevance of users/services and improves the Pearson correlation formula to identify the neighbors of users/services in geographic location.
- We propose a QoS prediction approach (GURAP) based on reputation and geographic location-aware collaborative filtering. The approach can predict unknown QoS values, based on reliable QoS data from users and services with geographic proximity. We simultaneously consider the impact of data reliability and data sparseness on the prediction accuracy for the first time. We conduct extensive experiments with real world data sets to study the prediction accuracy and robustness of our approach by comparing with classical approaches.
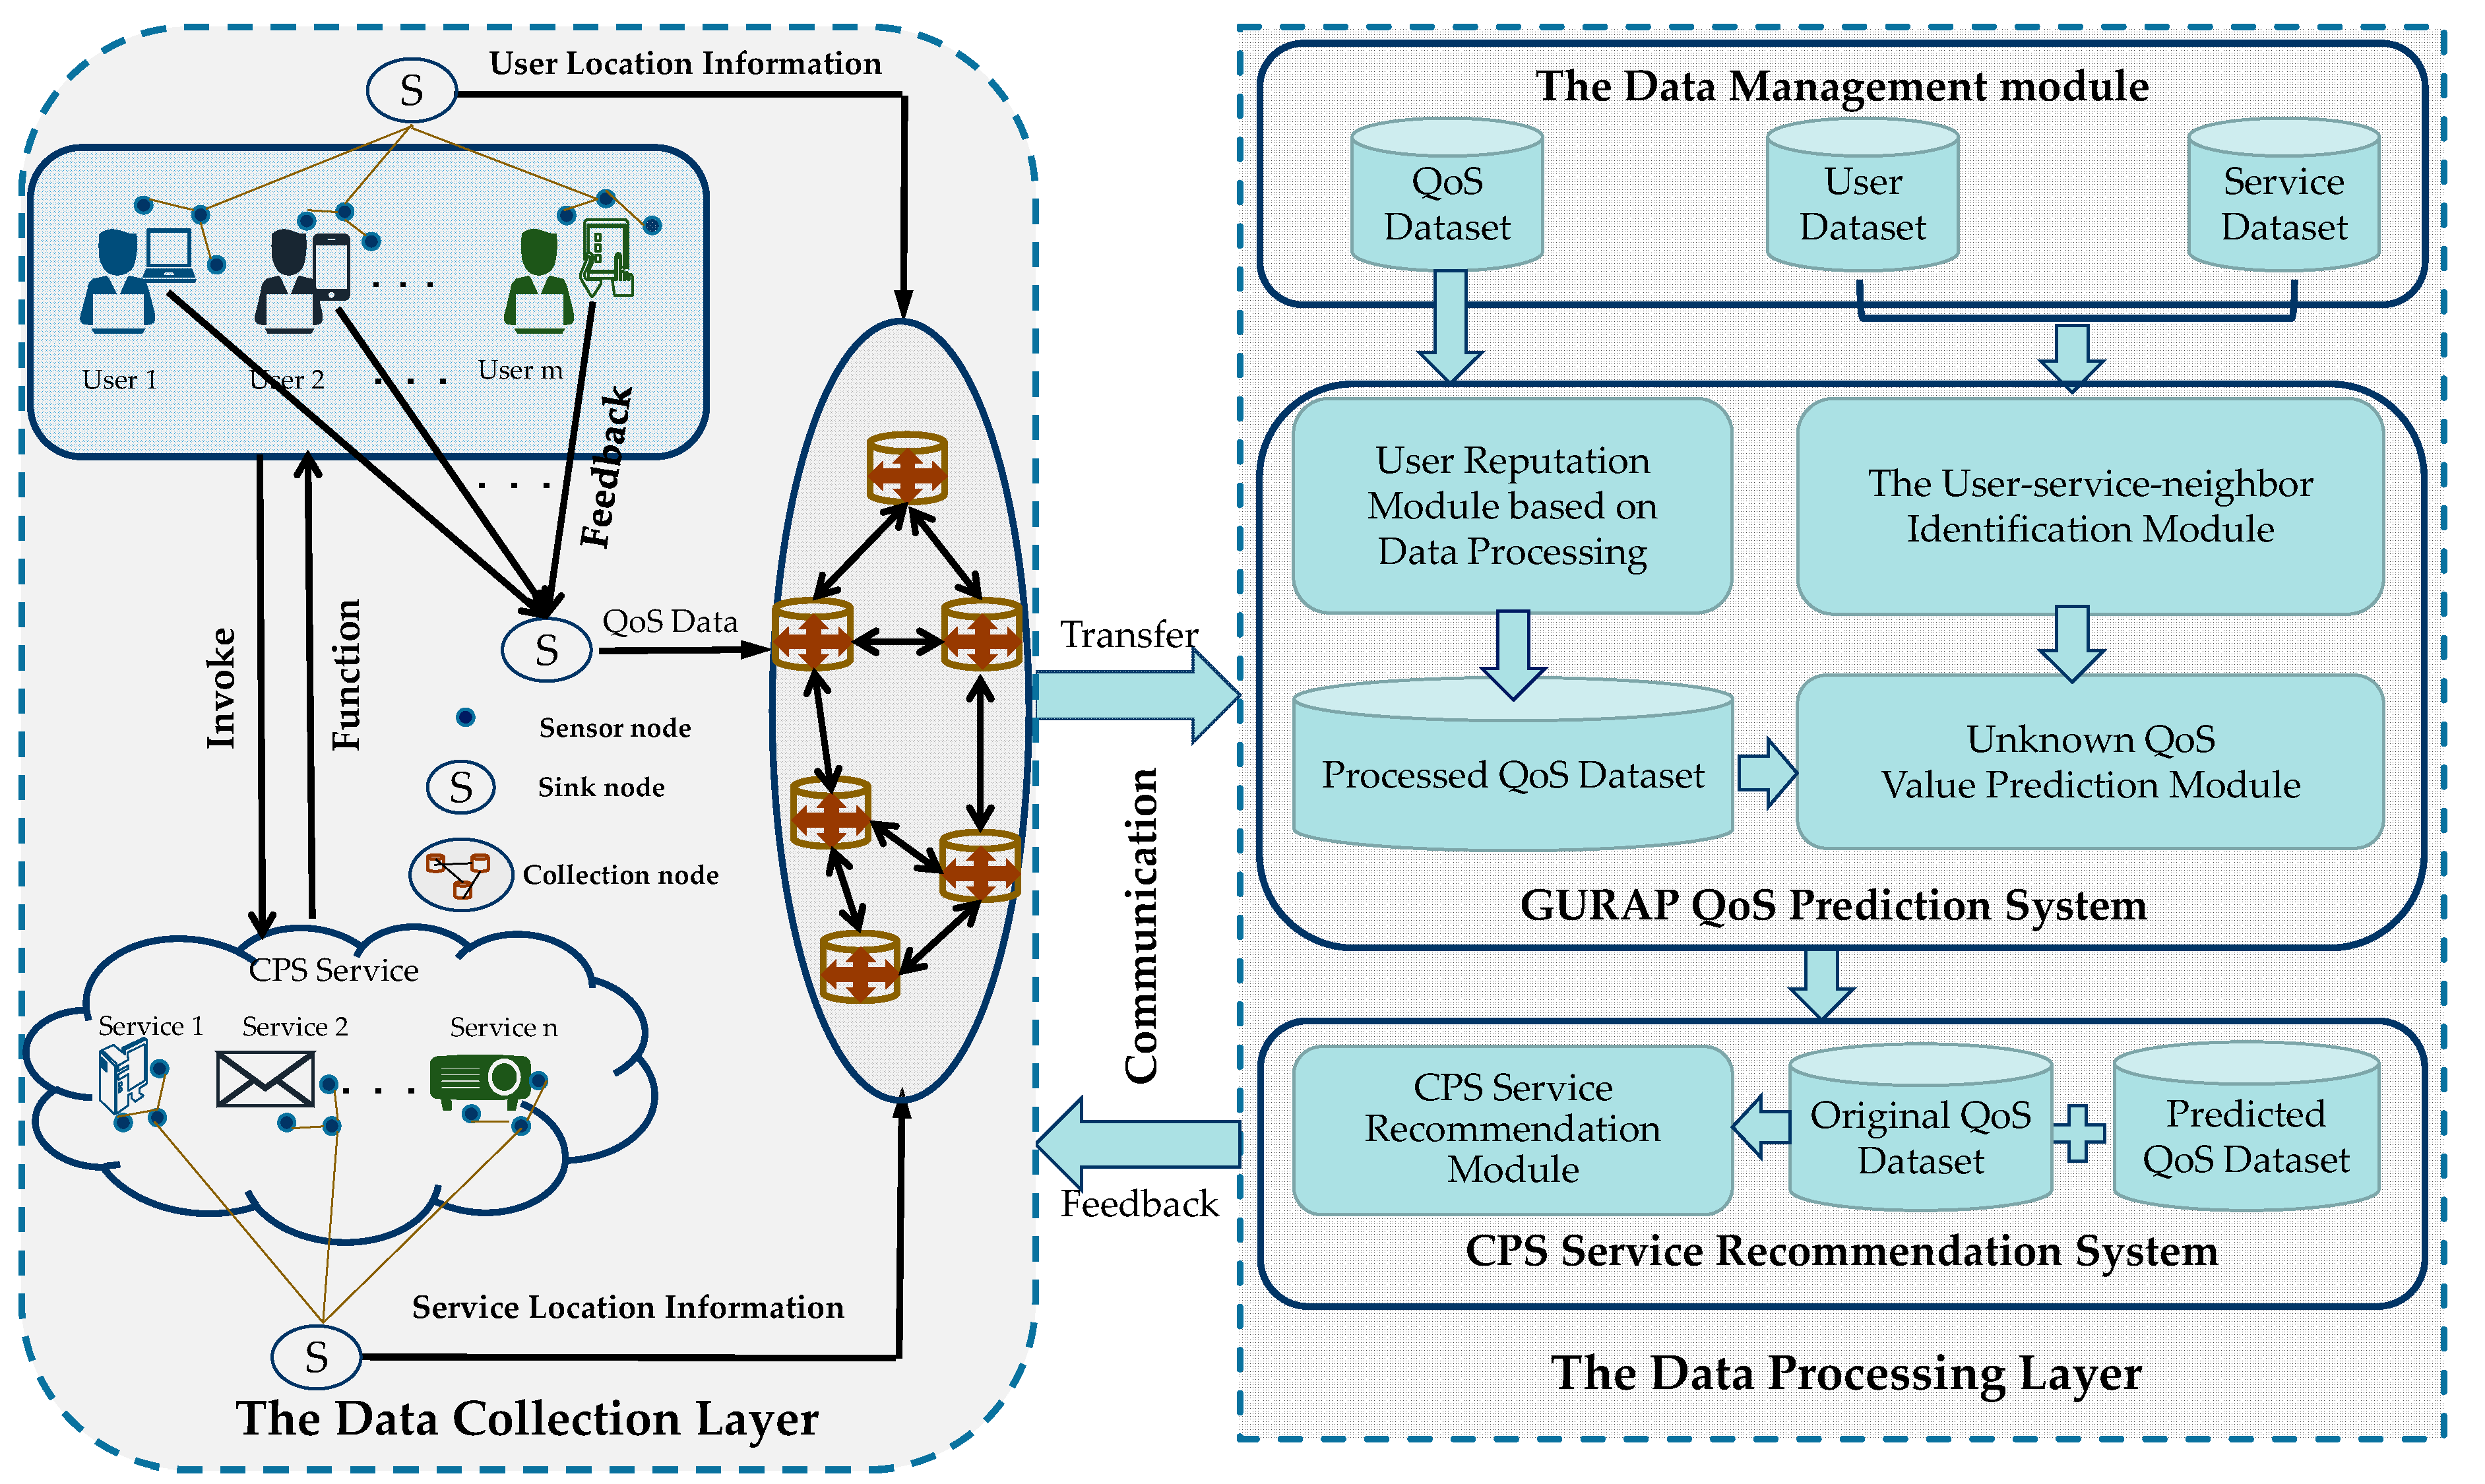
3. QoS Prediction Framework for CSP Services
- First, in the data collection layer, the QoS records of users’ invocation of CPS services, as well as the geographic location information of users and CPS services, are collected and transmitted to the collection node through the internet. The collection node then transfers the collected information to the data management module in the data processing layer.
- The data management module is in charge of information extraction, transformation, and load from multiple sources, and the collected data are classified to three kinds, namely the QoS data, users’ locations, and services’ locations.
- In the user reputation recognition module, the calculation unit performs pre-processing on the QoS data matrix, identifies the untrusted users, and processes the unreliable QoS data to form a new QoS matrix.
- In the user-service-similar-neighbor identification module of the data processing layer, the module computing unit firstly mines the correlation between the geographical locations of the users or services through calculation, and then identifies the similar geographical neighbors of users/services, according to the new QoS matrix.
- In the unknown QoS prediction module of the data processing layer, the module predicts the unknown QoS values of the trusted user based on the reliable QoS records from the selected top-K similar users/services.
- In the last step, the predicted unknown QoS value is transmitted to the CPS service recommendation system to select a high-quality CPS service for the user. Afterward, the process starts from step 1 again, thus forming a CPS service prediction recommendation system for computing, communication, and control.
4. QoS Prediction Approach Based on Reputation and Location-Aware Collaborative Filtering
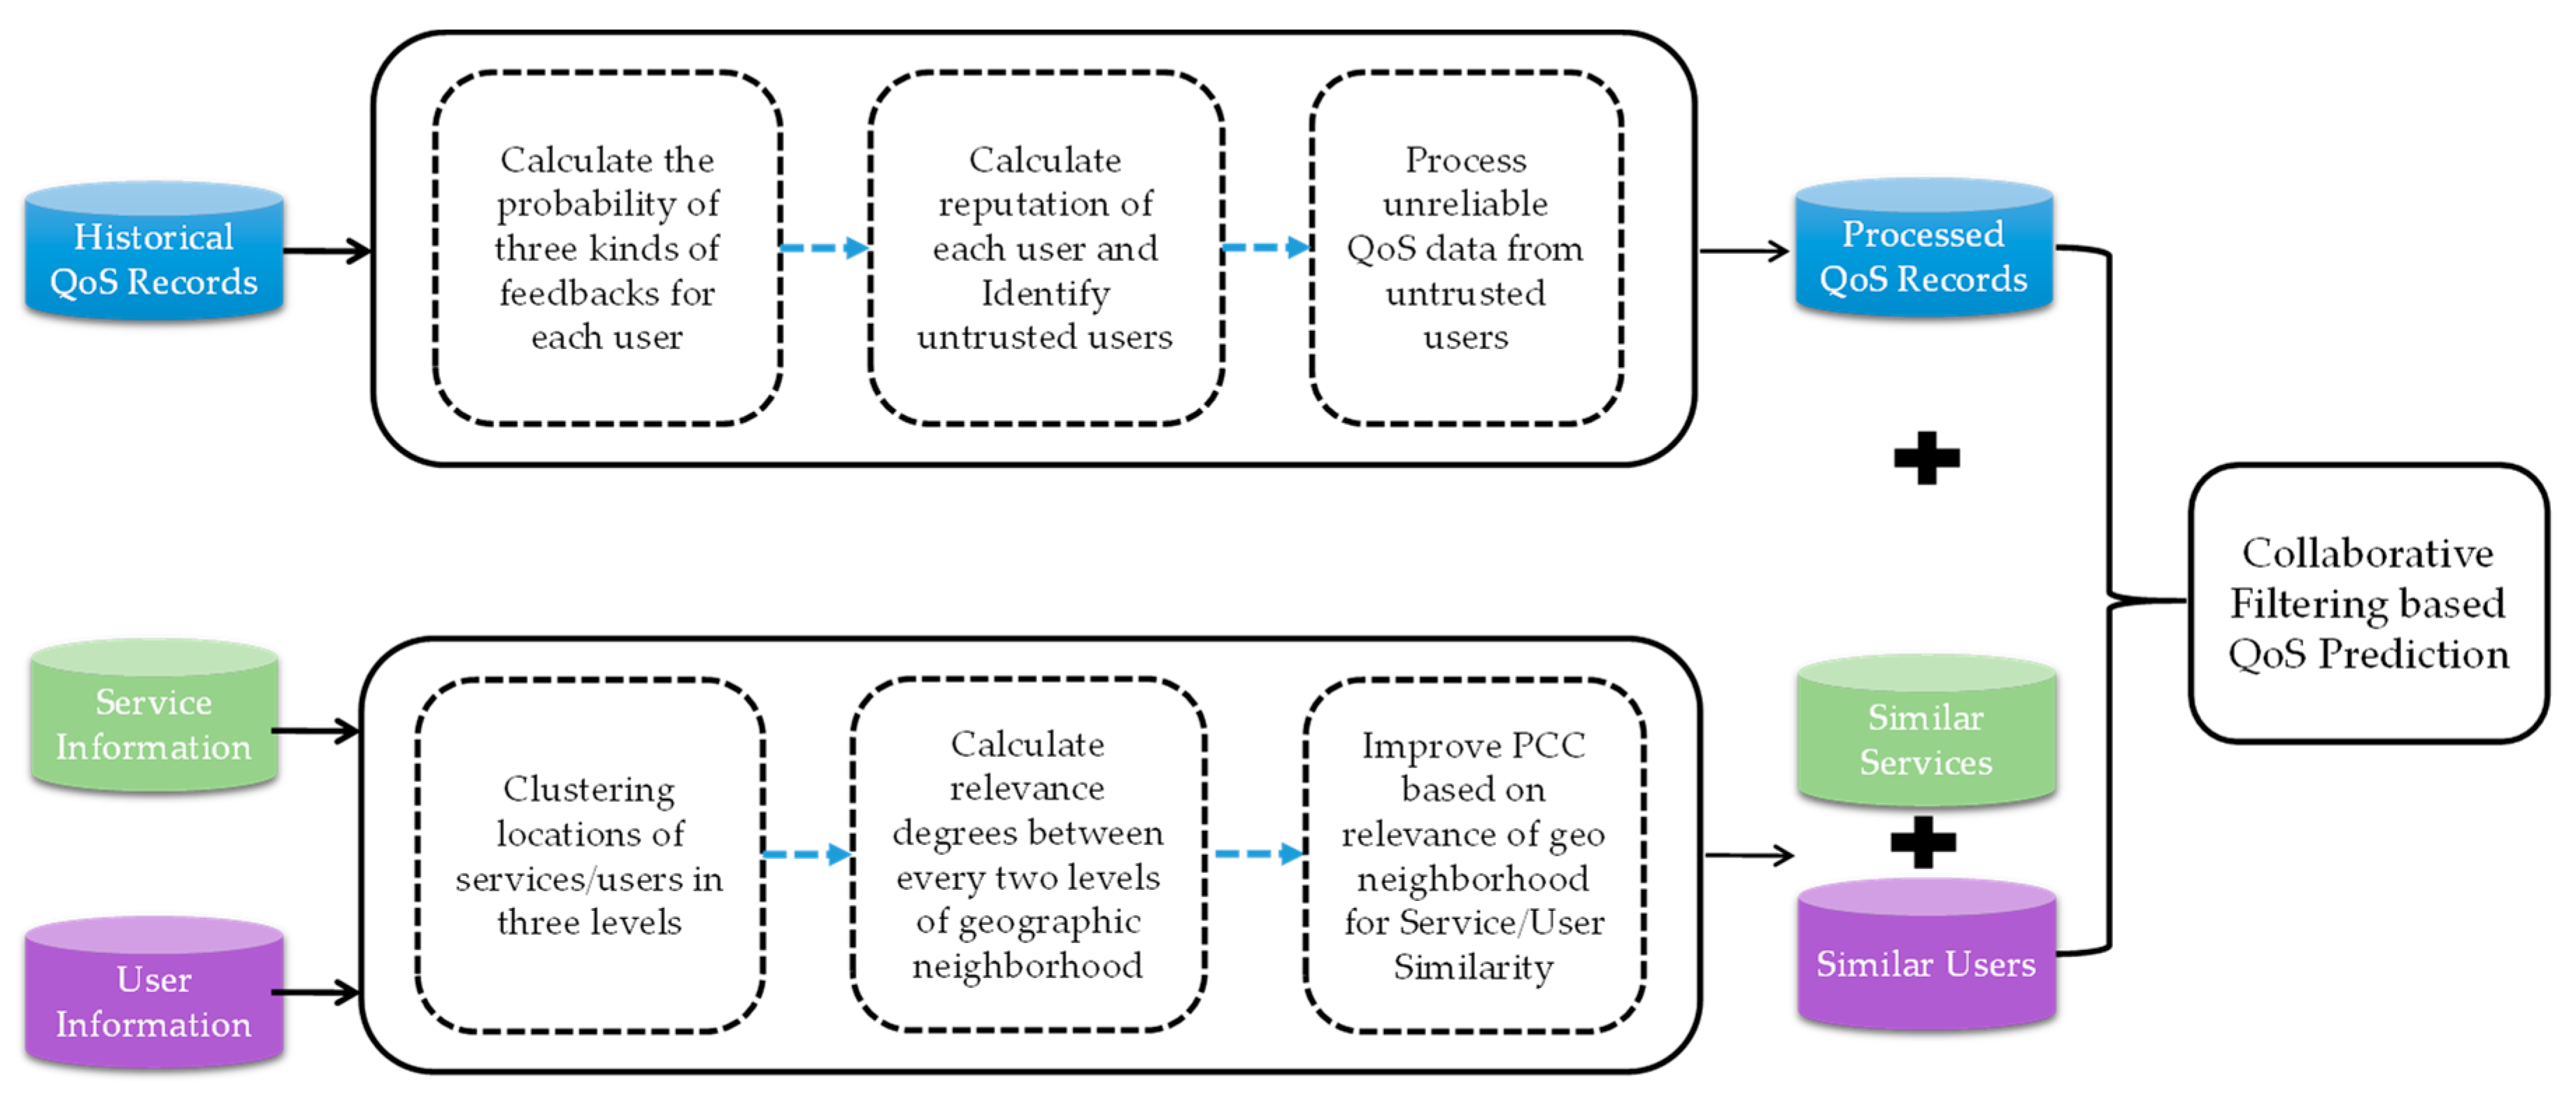
4.1. The Process of GURAP
4.2. User Reputation-Based Calculation
4.2.1. Calculating User’s Feedback Vector
4.2.2. Calculating Users’ Reputations
4.2.3. Identifying Untrustworthy Users and Fixing Unreliable QoS Values
4.3. Geographic-Based User (Service) Similarity Neighbor Recognition
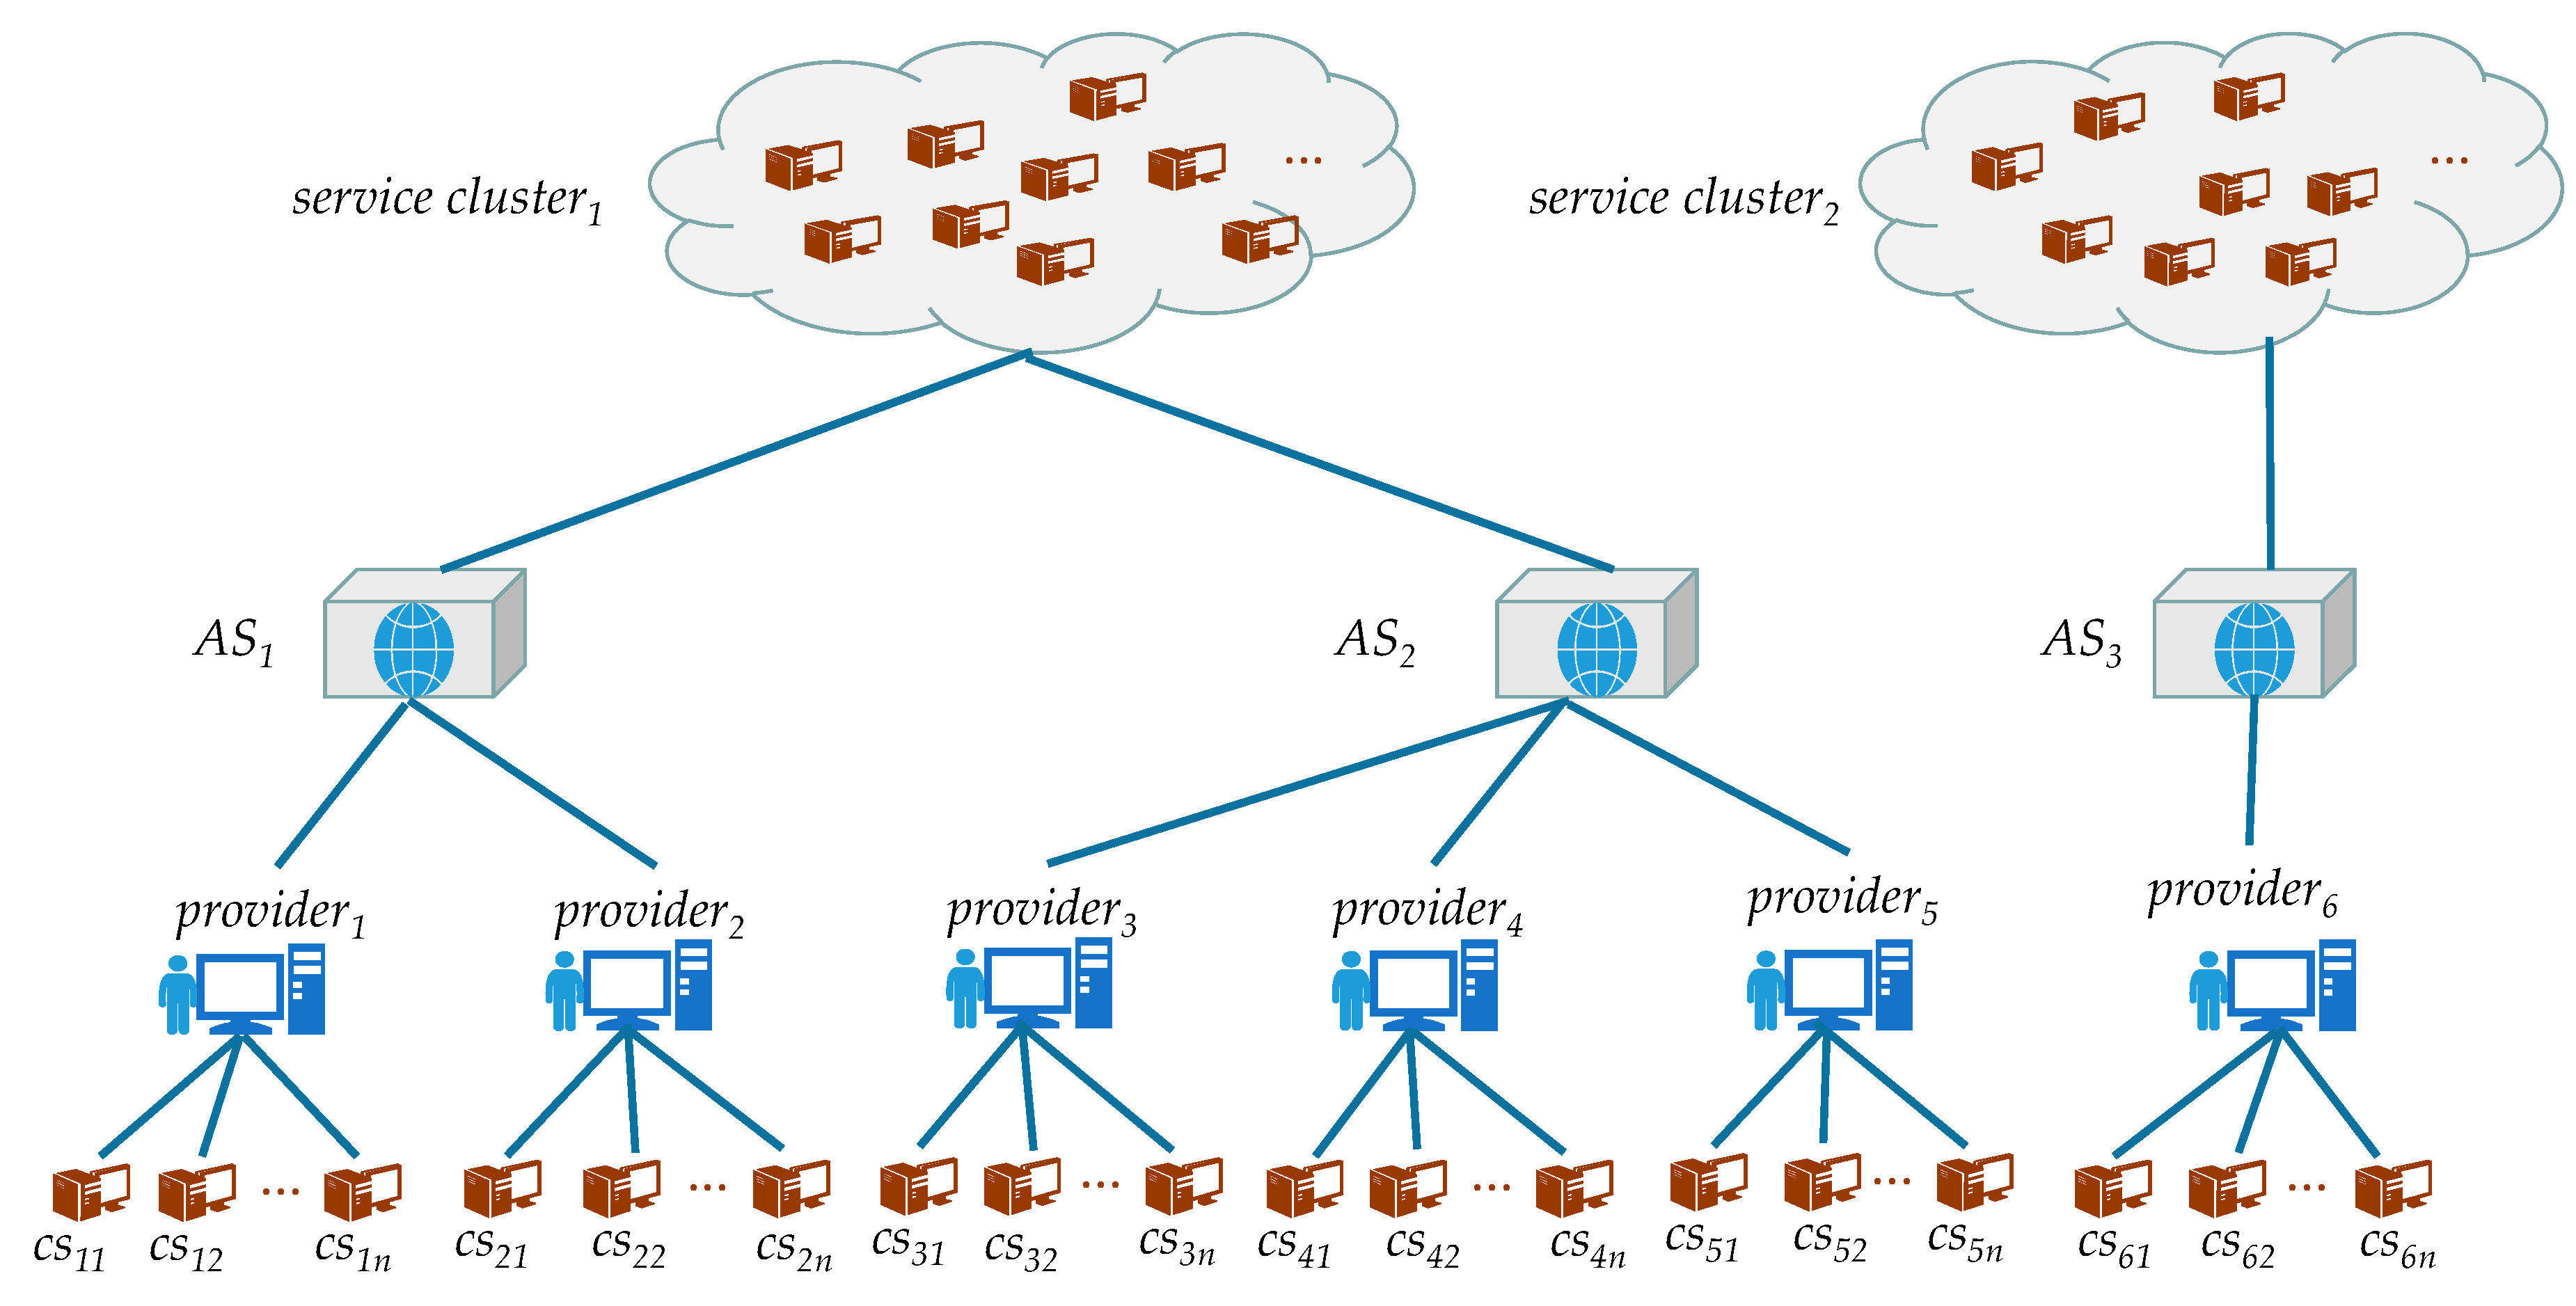
4.3.1. The Geographic Neighborhood Stratification
4.3.2. Calculating Geographic Neighborhood Correlation Degree
4.3.3. The Identification of Similar Geographical Neighbors of Users and Services
4.4. Unknown QoS Value Prediction Based on Reliable Data
5. Experiments Results
5.1. Experimental Settings
5.2. Experimental Indicators
5.3. Comparison
- UPCC: In this approach, the QoS value is predicted by utilizing the similarity between two users using the Pearson correlation coefficient (PCC), and the history invocation records of similar users [45].
- IPCC: This approach is similar to the UPCC method, except that it predicts the unknown QoS value by calculating the similarity between two services and using the QoS value of similar services [46].
- UIPCC: This approach integrates the UPCC and IPCC approaches into a unified model, and then uses the similar users and similar services to combine their predicted results with specific parameters λ [33].
- CURA: This approach is the one we proposed in Section 4.2 of this paper that predicts unknown QoS entries by identifying untrusted users and processing unreliable data and then combining the processed QoS data with the UPCC method.
- GUIPCC: GUIPCC identifies similar services and similar users using the QoS data of unidentified untrusted users by the approach proposed in Section 4.2 of this article, and then uses the prediction approach in UIPCC to predict missing QoS values.
- TAP: In this approach, user reputation is evaluated and a set of reliable similar users are identified by using K-means clustering and Beta distribution, and then the results predicted by similar users and the unknown QoS values predicted by similar services, based on service clustering, are combined with specific parameters λ [17].
- GNMF: In this approach, similar service geo-neighbors are identified by using a bottom-up hierarchical neighborhood clustering of service geography and then integrated into matrix decomposition to predict [18].
- (1)
- In different response time matrix densities, our approach can achieve smaller NMAE and RMSE values than other approaches at different response time matrix densities, which shows that our approach is more accurate than the existing approaches, in most cases. Specifically, compared with TAP, in the case of 2.95% untrusted users, the values of NMEAE and RMSE in our approach GURAP increased by an average of 16.83% and 17.05%, respectively. In the case of 5.90% of untrustworthy users, they increased by an average of 17.49% and 17.83%, respectively. Compared with the GNMF model in the case of two kinds of untrustworthy users, in GURAP the NMAE values reached 14.62% and 13.32%, respectively, while the RMSE values reached 26.19% and 27.59%, respectively.
- (2)
- Compared with UPCC, IPCC, UIPCC, and GUIPCC, our approach GURAP achieves better prediction accuracy. The reason for this result is that our approach guarantees the reliability of the data by identifying untrusted users through the user reputation method and by using the average QoS value of the reliable users to correct the value contributed by the untrusted user. Other approaches do not consider whether the QoS data provided by the user is reliable. As the GUIPCC approach considers the geographical location information, the prediction accuracy is improved, compared to the other three approaches.
- (3)
- Compared with the CURA and TAP approaches, our approach mines the potential geographical information relationships of users and services so that more similar neighbors can be obtained and geographical neighbors of users can be used to mitigate the matrix sparseness. TAP does not consider the impact of geographical location, but also ignores that the contribution of untrusted users will affect the prediction accuracy, therefore as the matrix density increases, the prediction accuracy decreases. Because the CURA method processes the unreliable data, as the matrix density increases, the prediction accuracy can continue to improve.
- (4)
- Compared with the GNMF method, our approach achieves smaller NMAE and RMSE values in QoS prediction, but the degree of reduction in RMSE value is very large, because the RMSE evaluation index is more sensitive to outliers. Because our approach identifies untrustworthy users and processes the values of unreliable data, while GNMF does not consider unreliable data and directly uses the original QoS data to predict., our approach has better prediction accuracy than GNMF.
- (5)
- When the response time matrix density is 5%, the GURAP approach’s NMAE value is similar to the TAP method, and the RMSE value in the TAP method is greater than the GURAP approach, because in the TAP method, when the data is very sparse, the volume of untrusted data is also very small, therefore the impact of untrusted users on QoS prediction is small. However, the RMSE assessment index is very sensitive to outliers, and the TAP method does not processes untrusted data, so the RMSE value is larger than in GURAP. When the matrix density is greater than 5%, our approach is greatly improved compared to the TAP method. Compared with GNMF, The prediction accuracy of the GURAP approach is always larger than that of GNMF, and increases as matrix density increases. Experiments show that our approach can achieve better prediction accuracy by considering user reputation and the potential geographic information of service users.
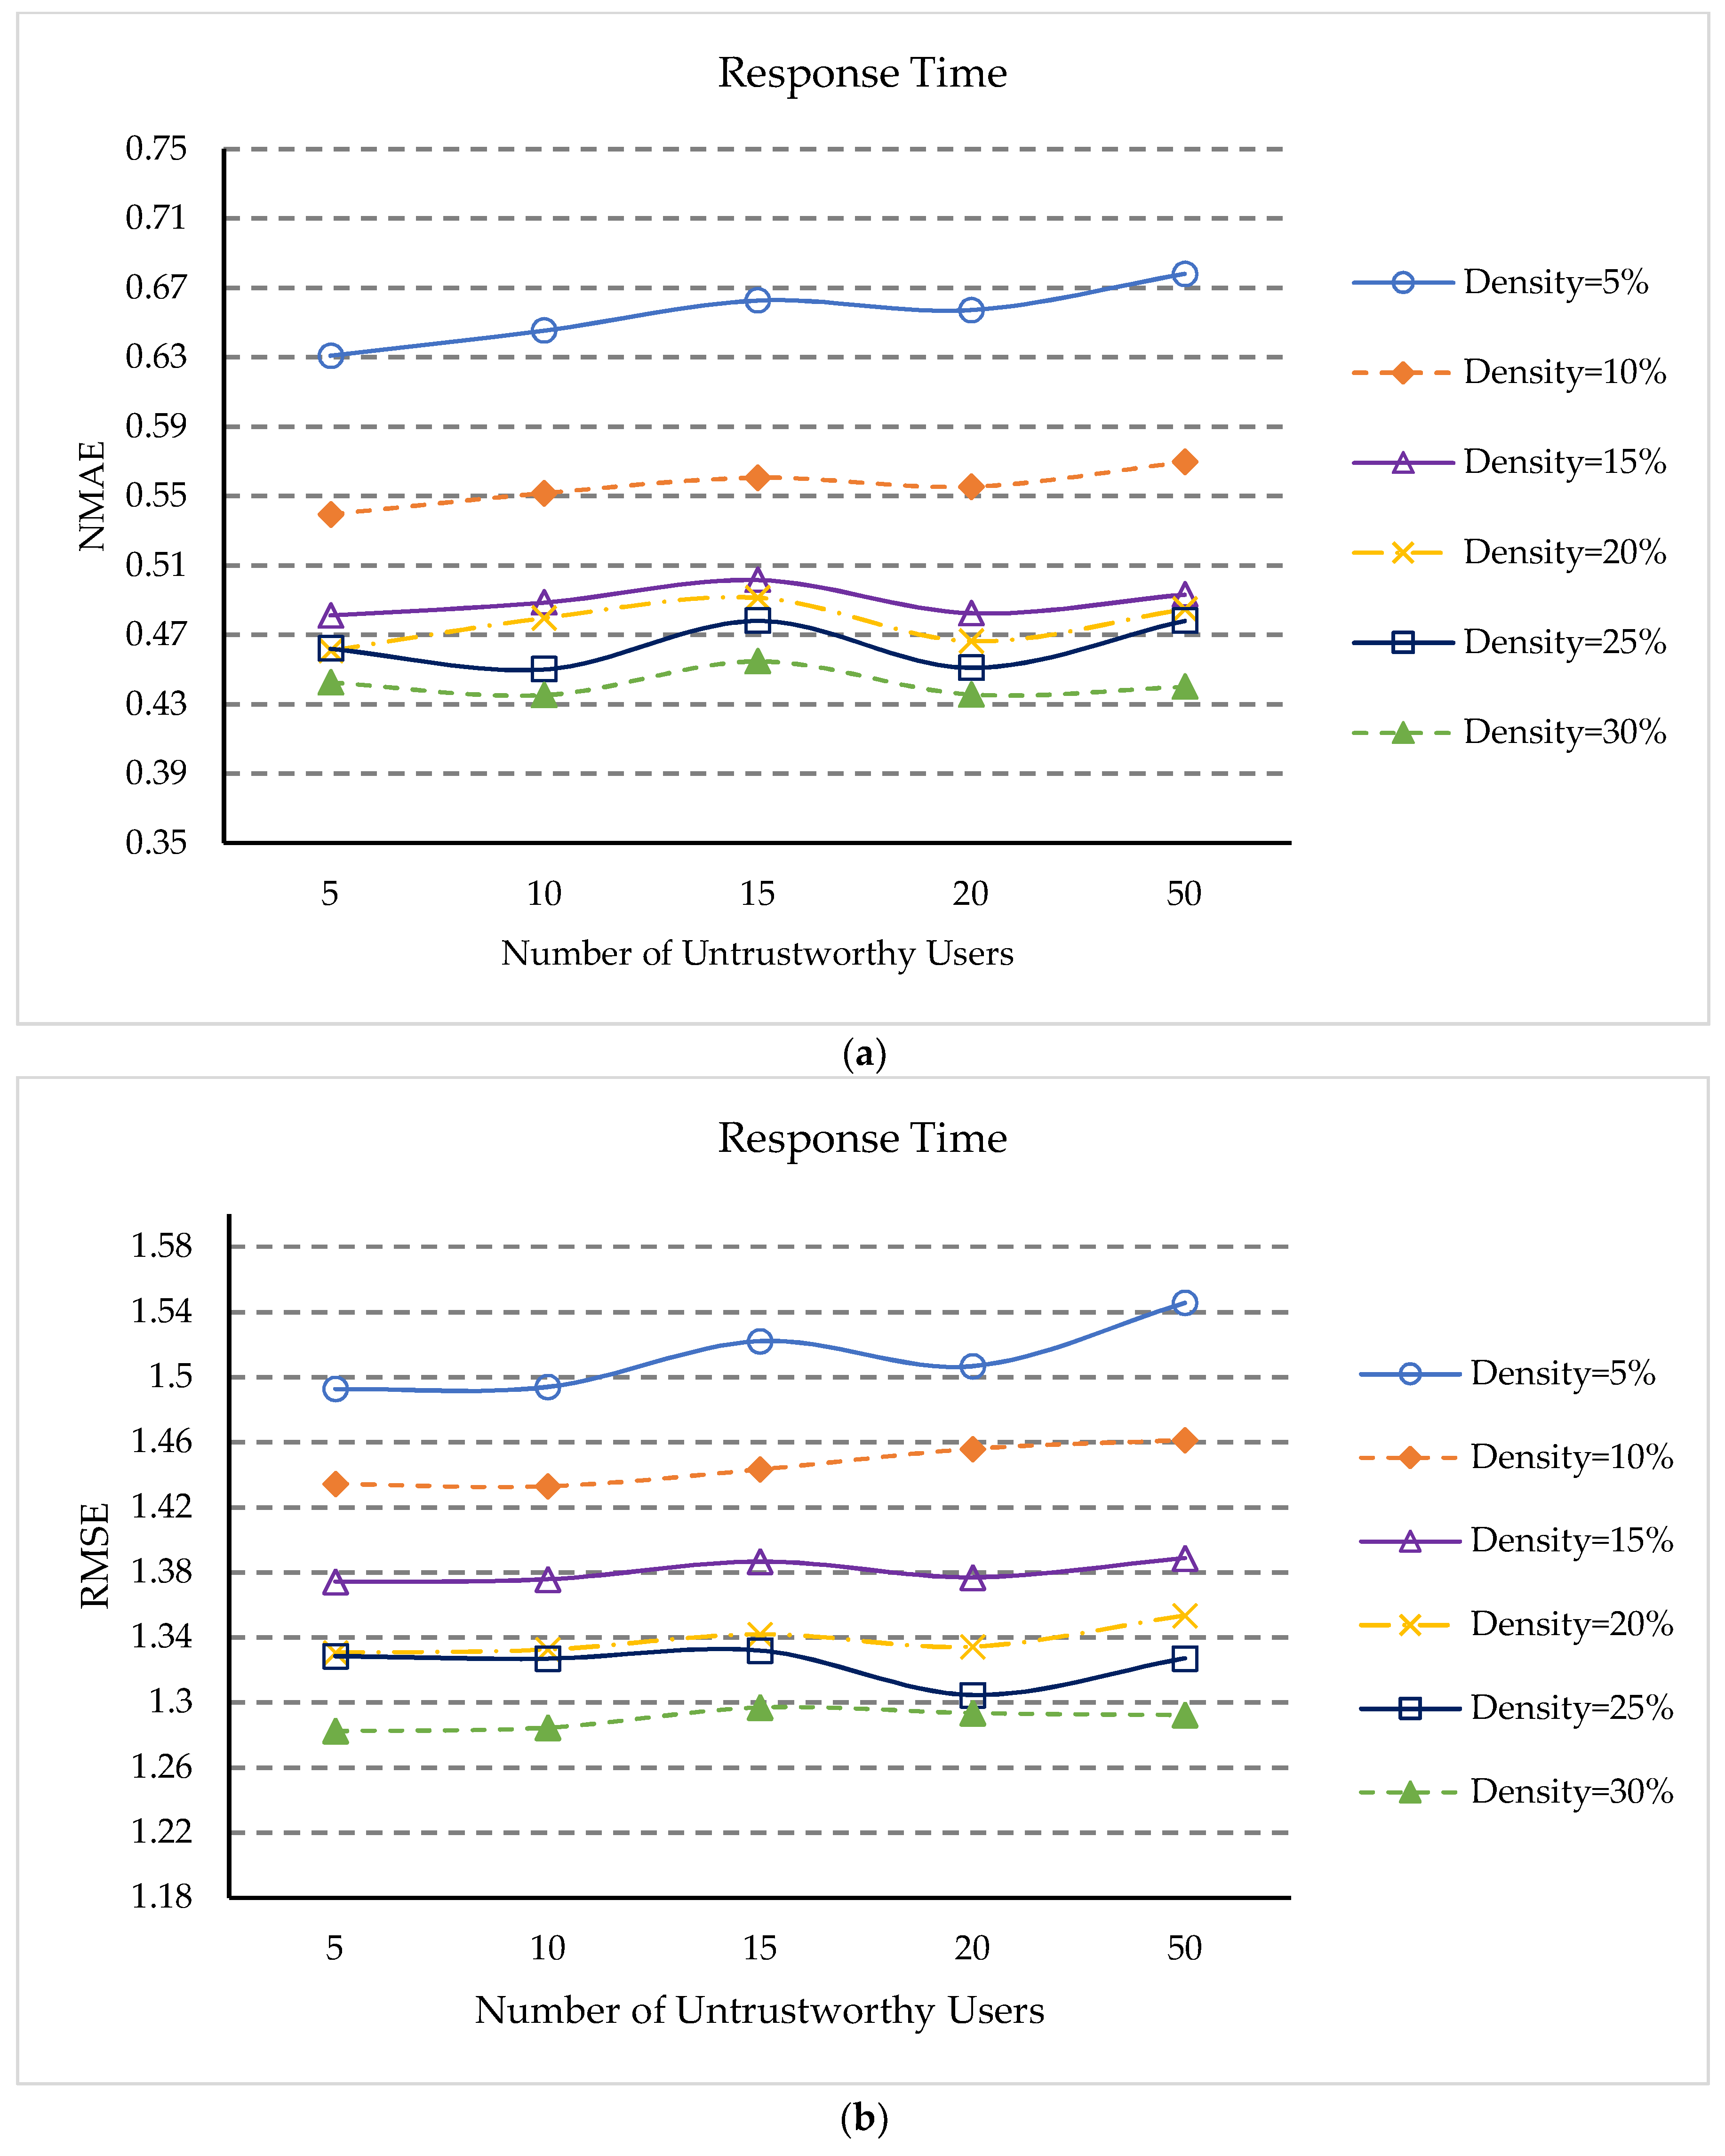
5.4. Impacts of Percentage of Untrusted Users
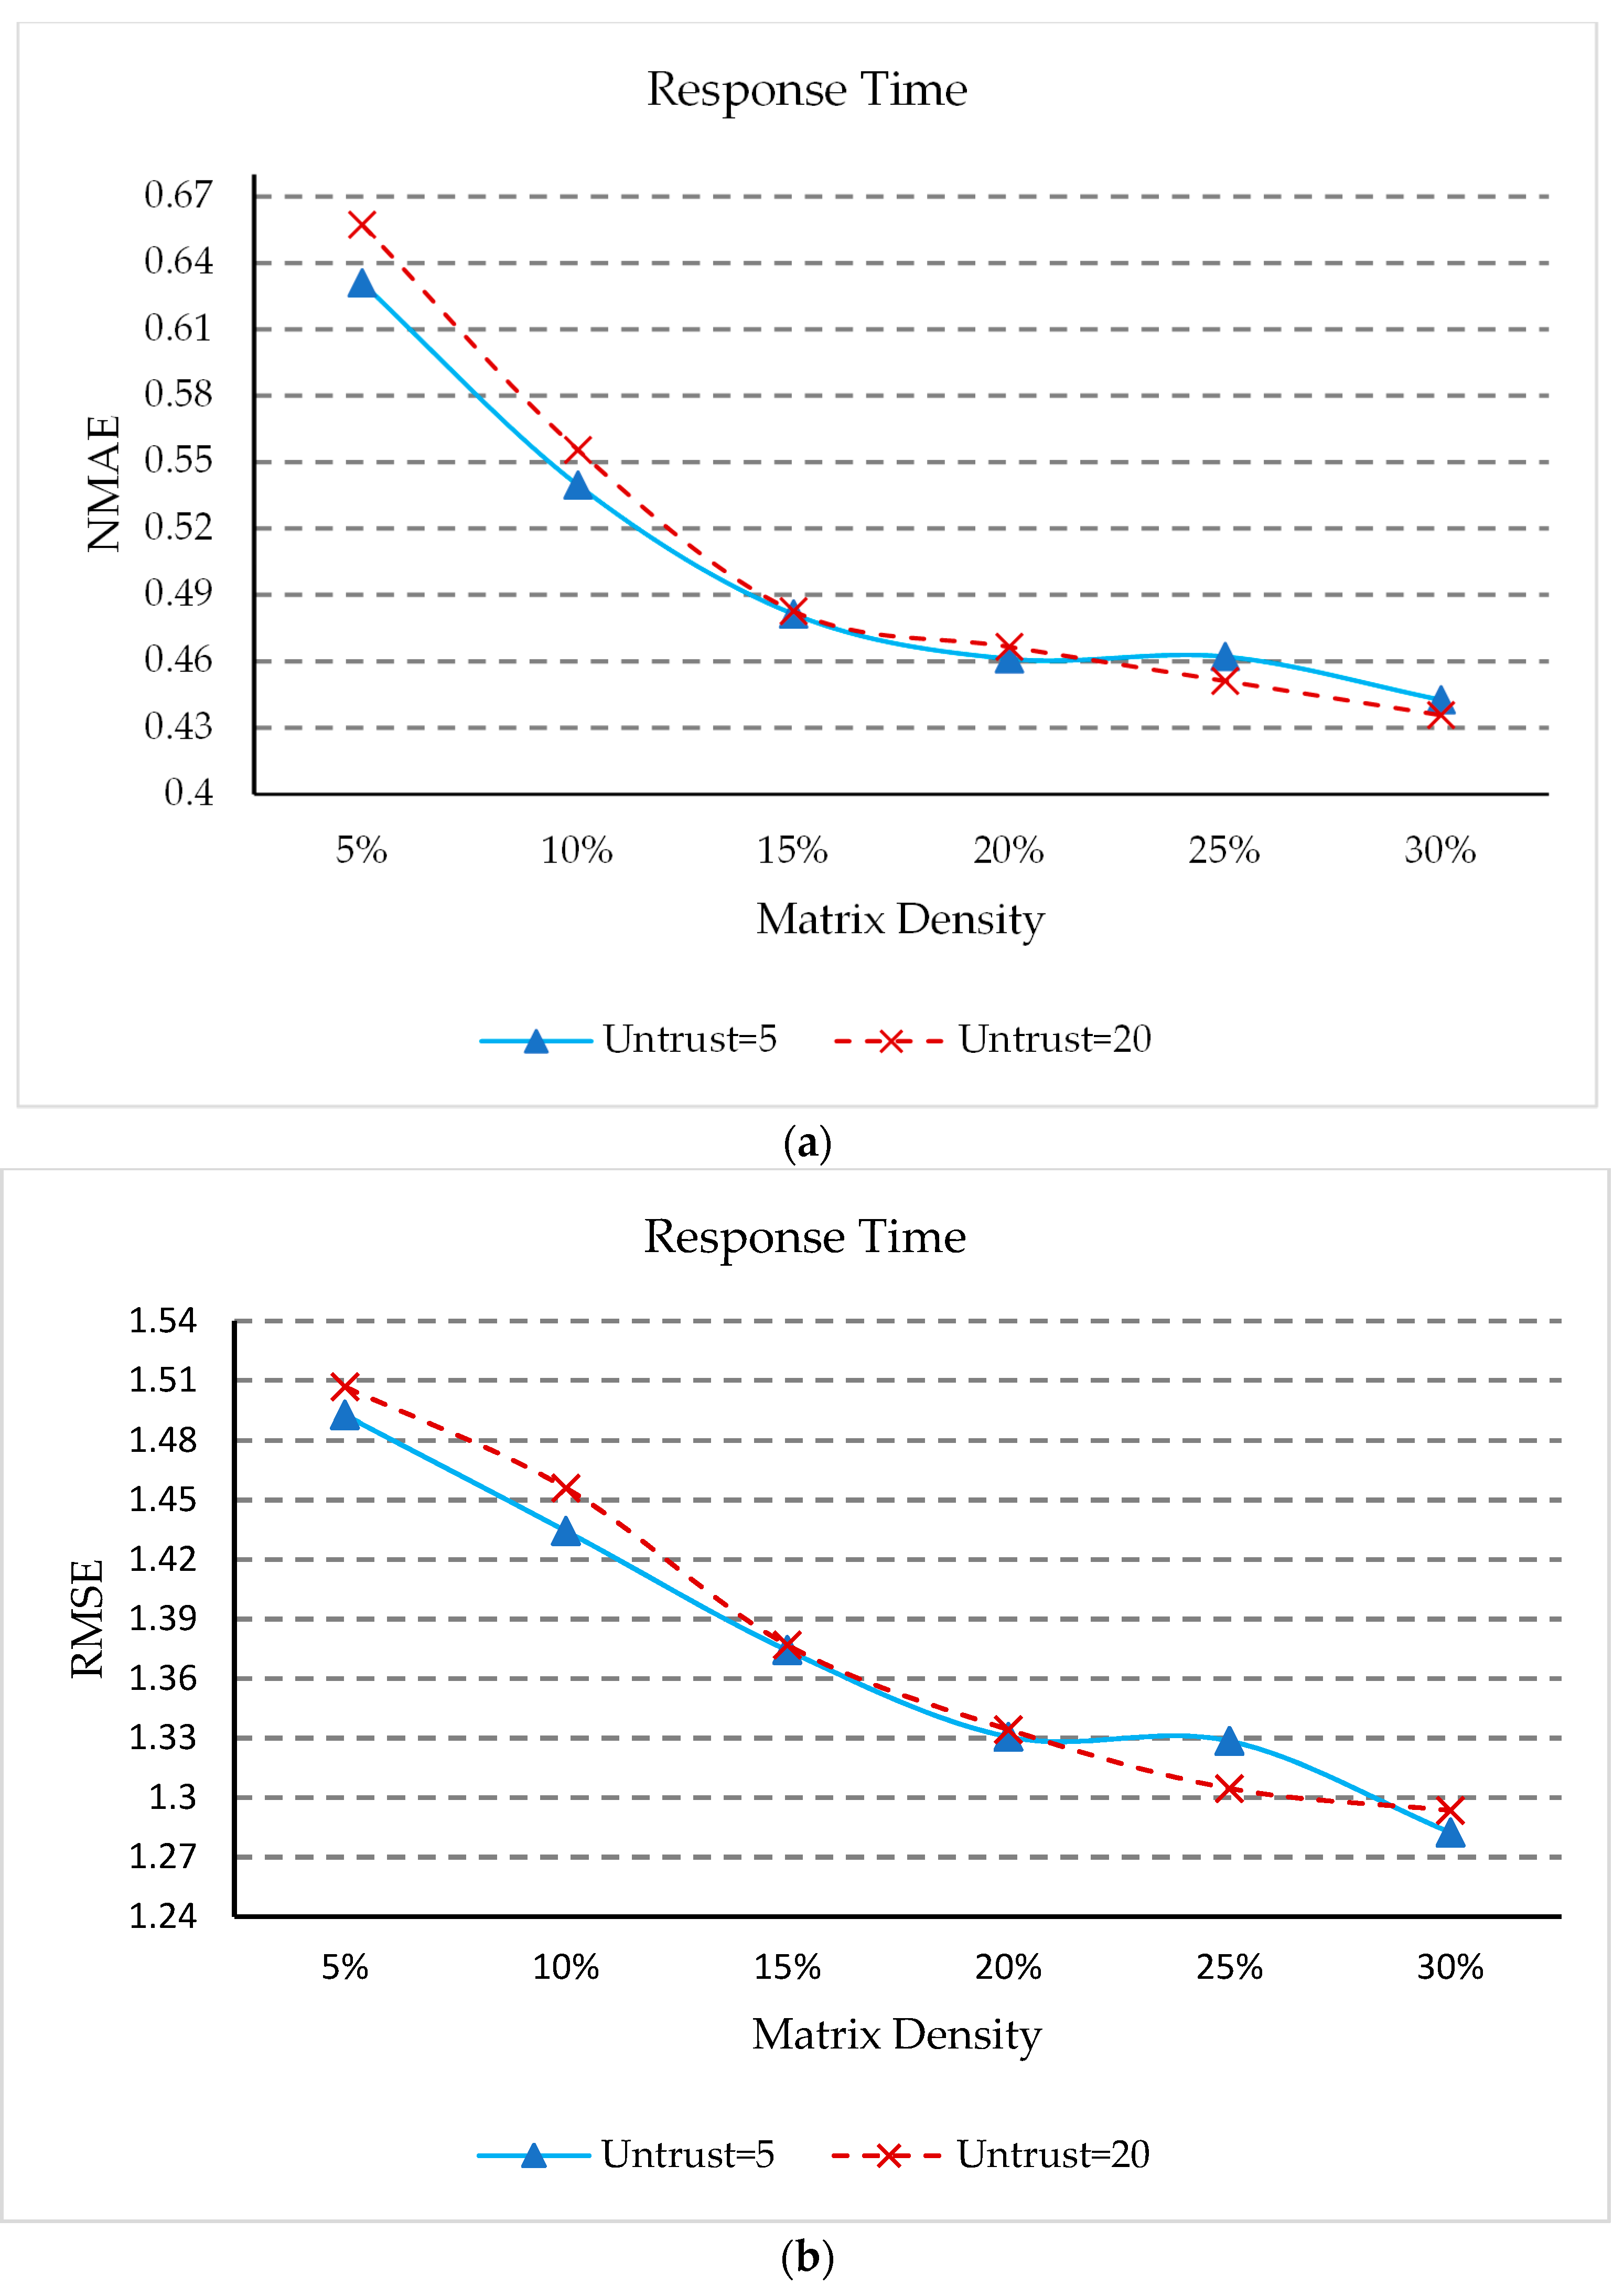
- (1)
- In Figure 4a,b, when the percentage of untrustworthy users is 1.47%, the QoS prediction assessment indicators NMAE and RMSE are generally the smallest. When the matrix density is small, the overall trend is slowly increasing, but their NMAE and RMSE values are all very close. This is because the data obtained by our approach when processing untrusted data is only close to the true value, when the number of untrusted users increases, the increase of untrusted data will affect the prediction accuracy of QoS. However, when the matrix density is relatively large, the NMAE and RMSE values fluctuate within a certain range. This indicates that our method can identify unreliable users and can handle untrusted QoS data.
- (2)
- From Figure 4a,b, it can also be seen that NMAE and RMSE continue to reduce as the matrix density becomes more and more dense. This is because for different percentages of untrusted users, more dense matrices can provide more information.
5.5. Impact of Threshold δ
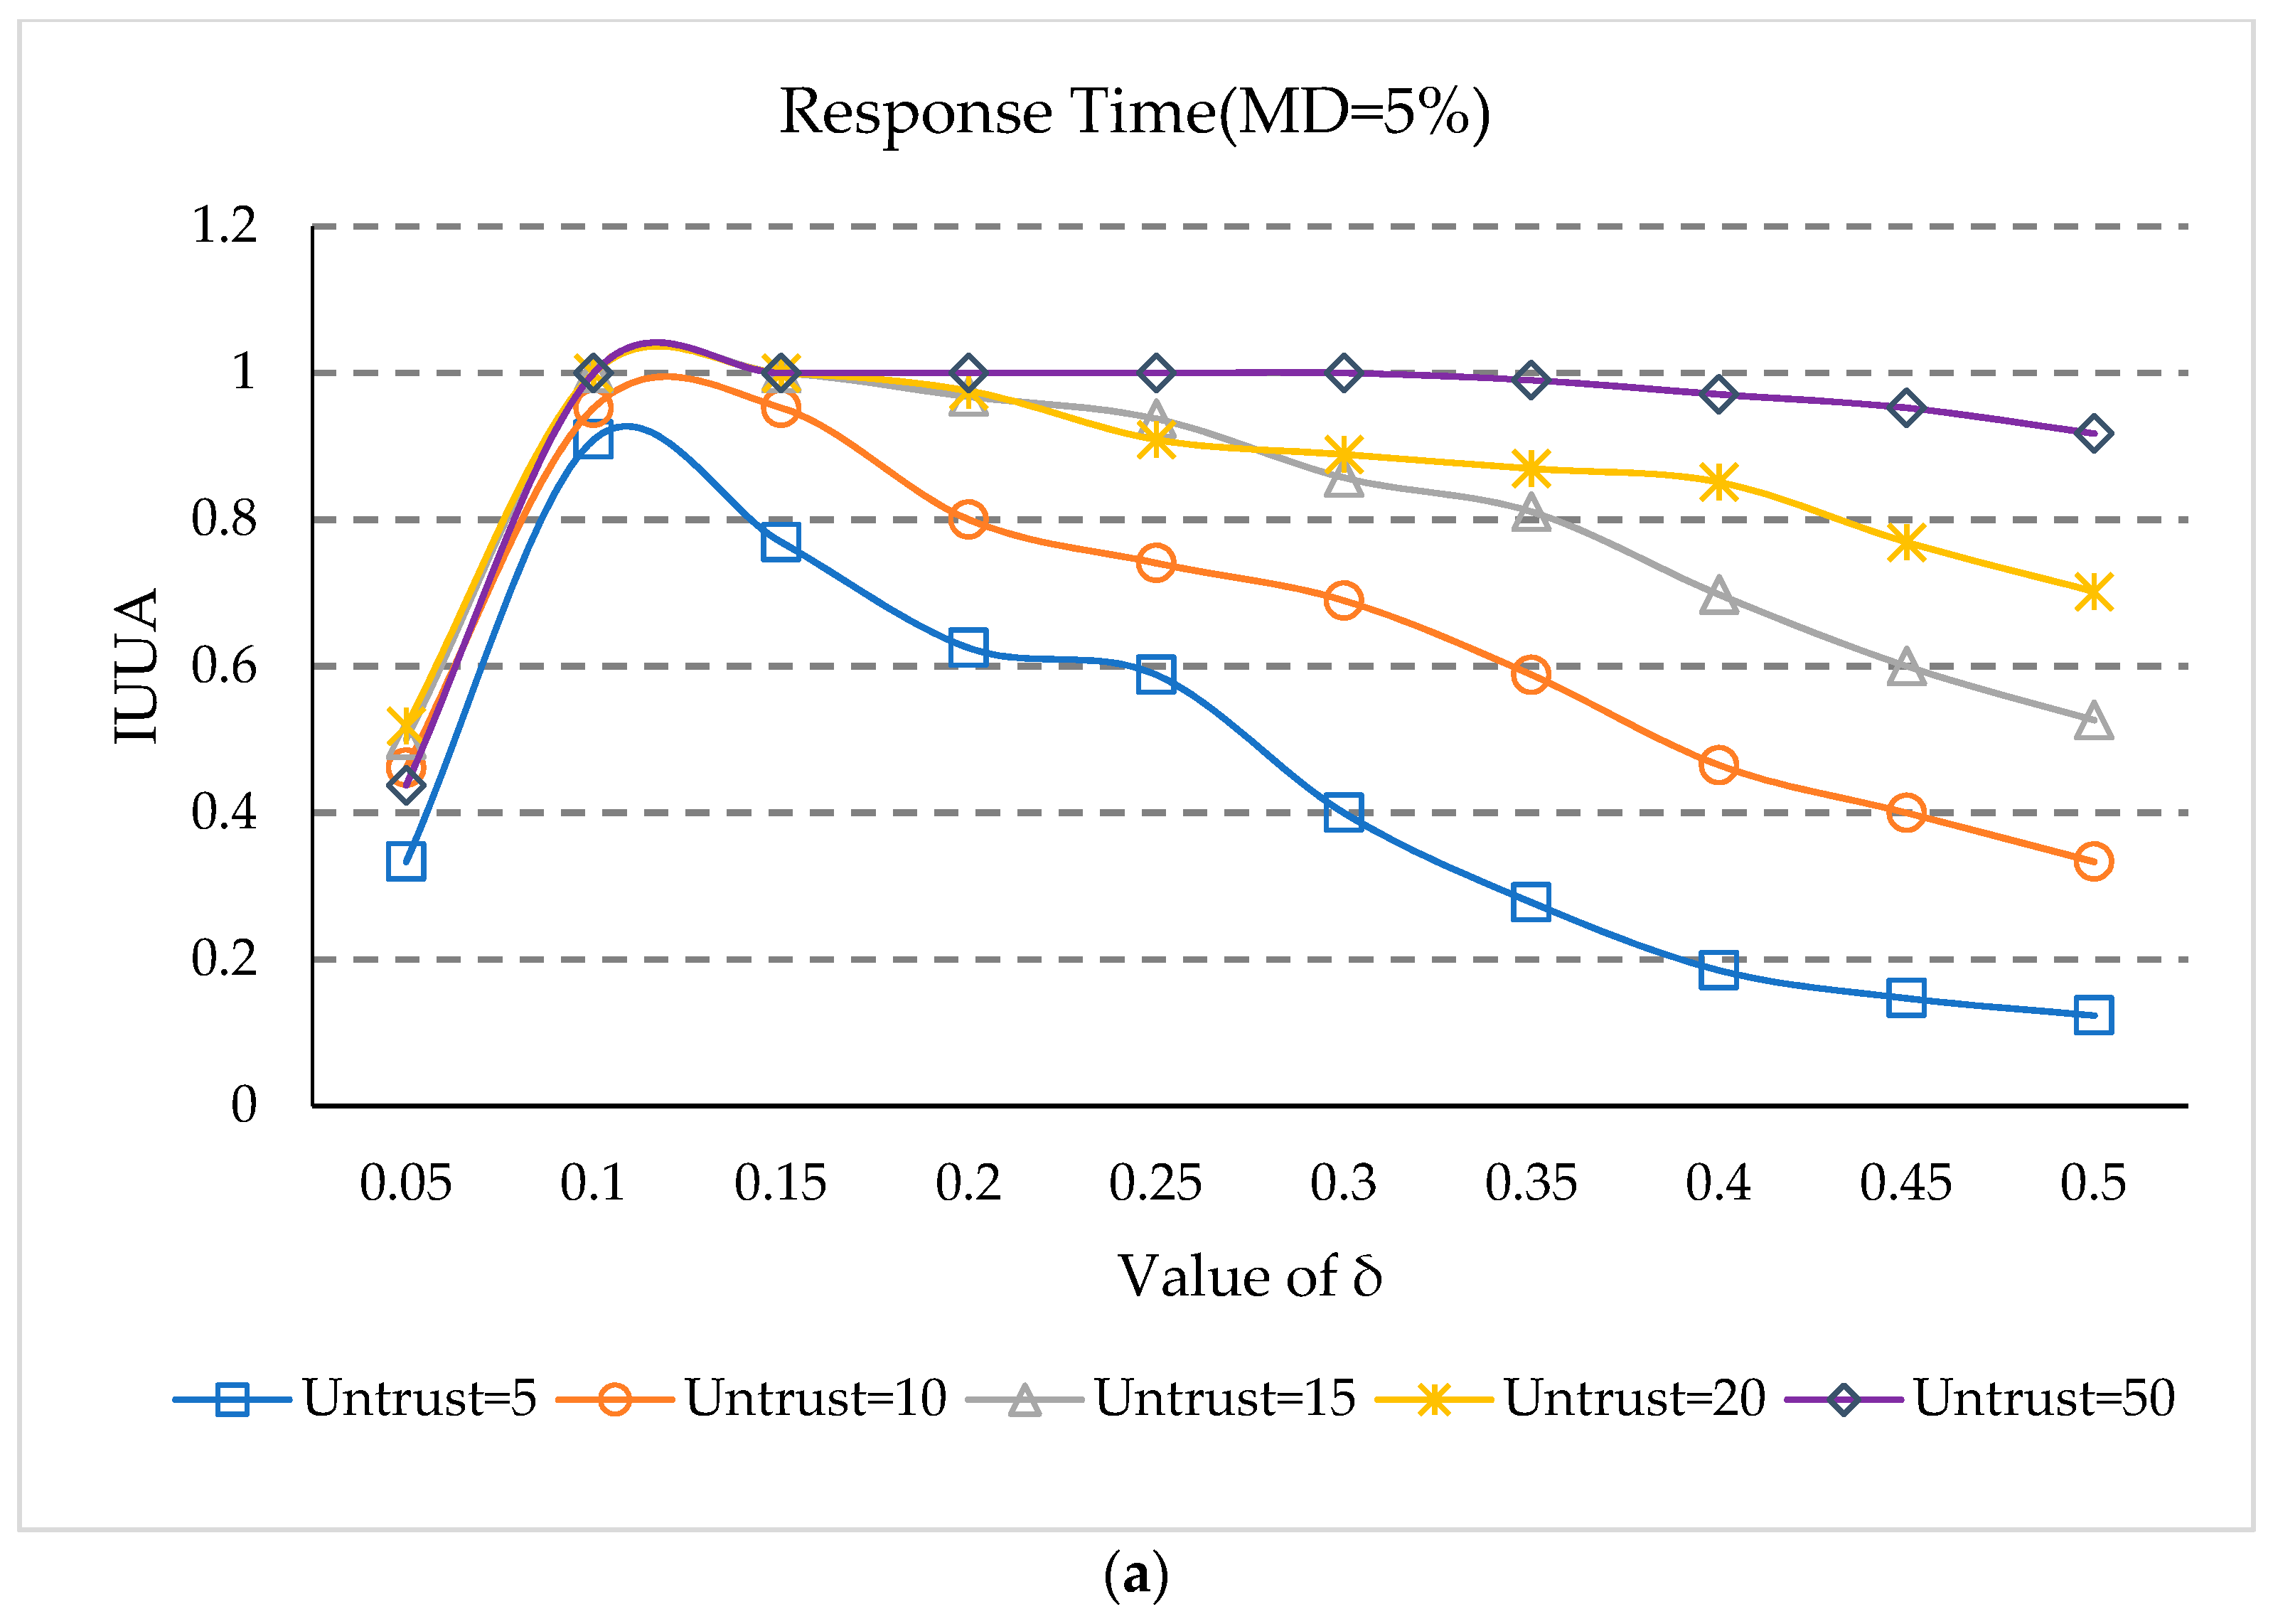
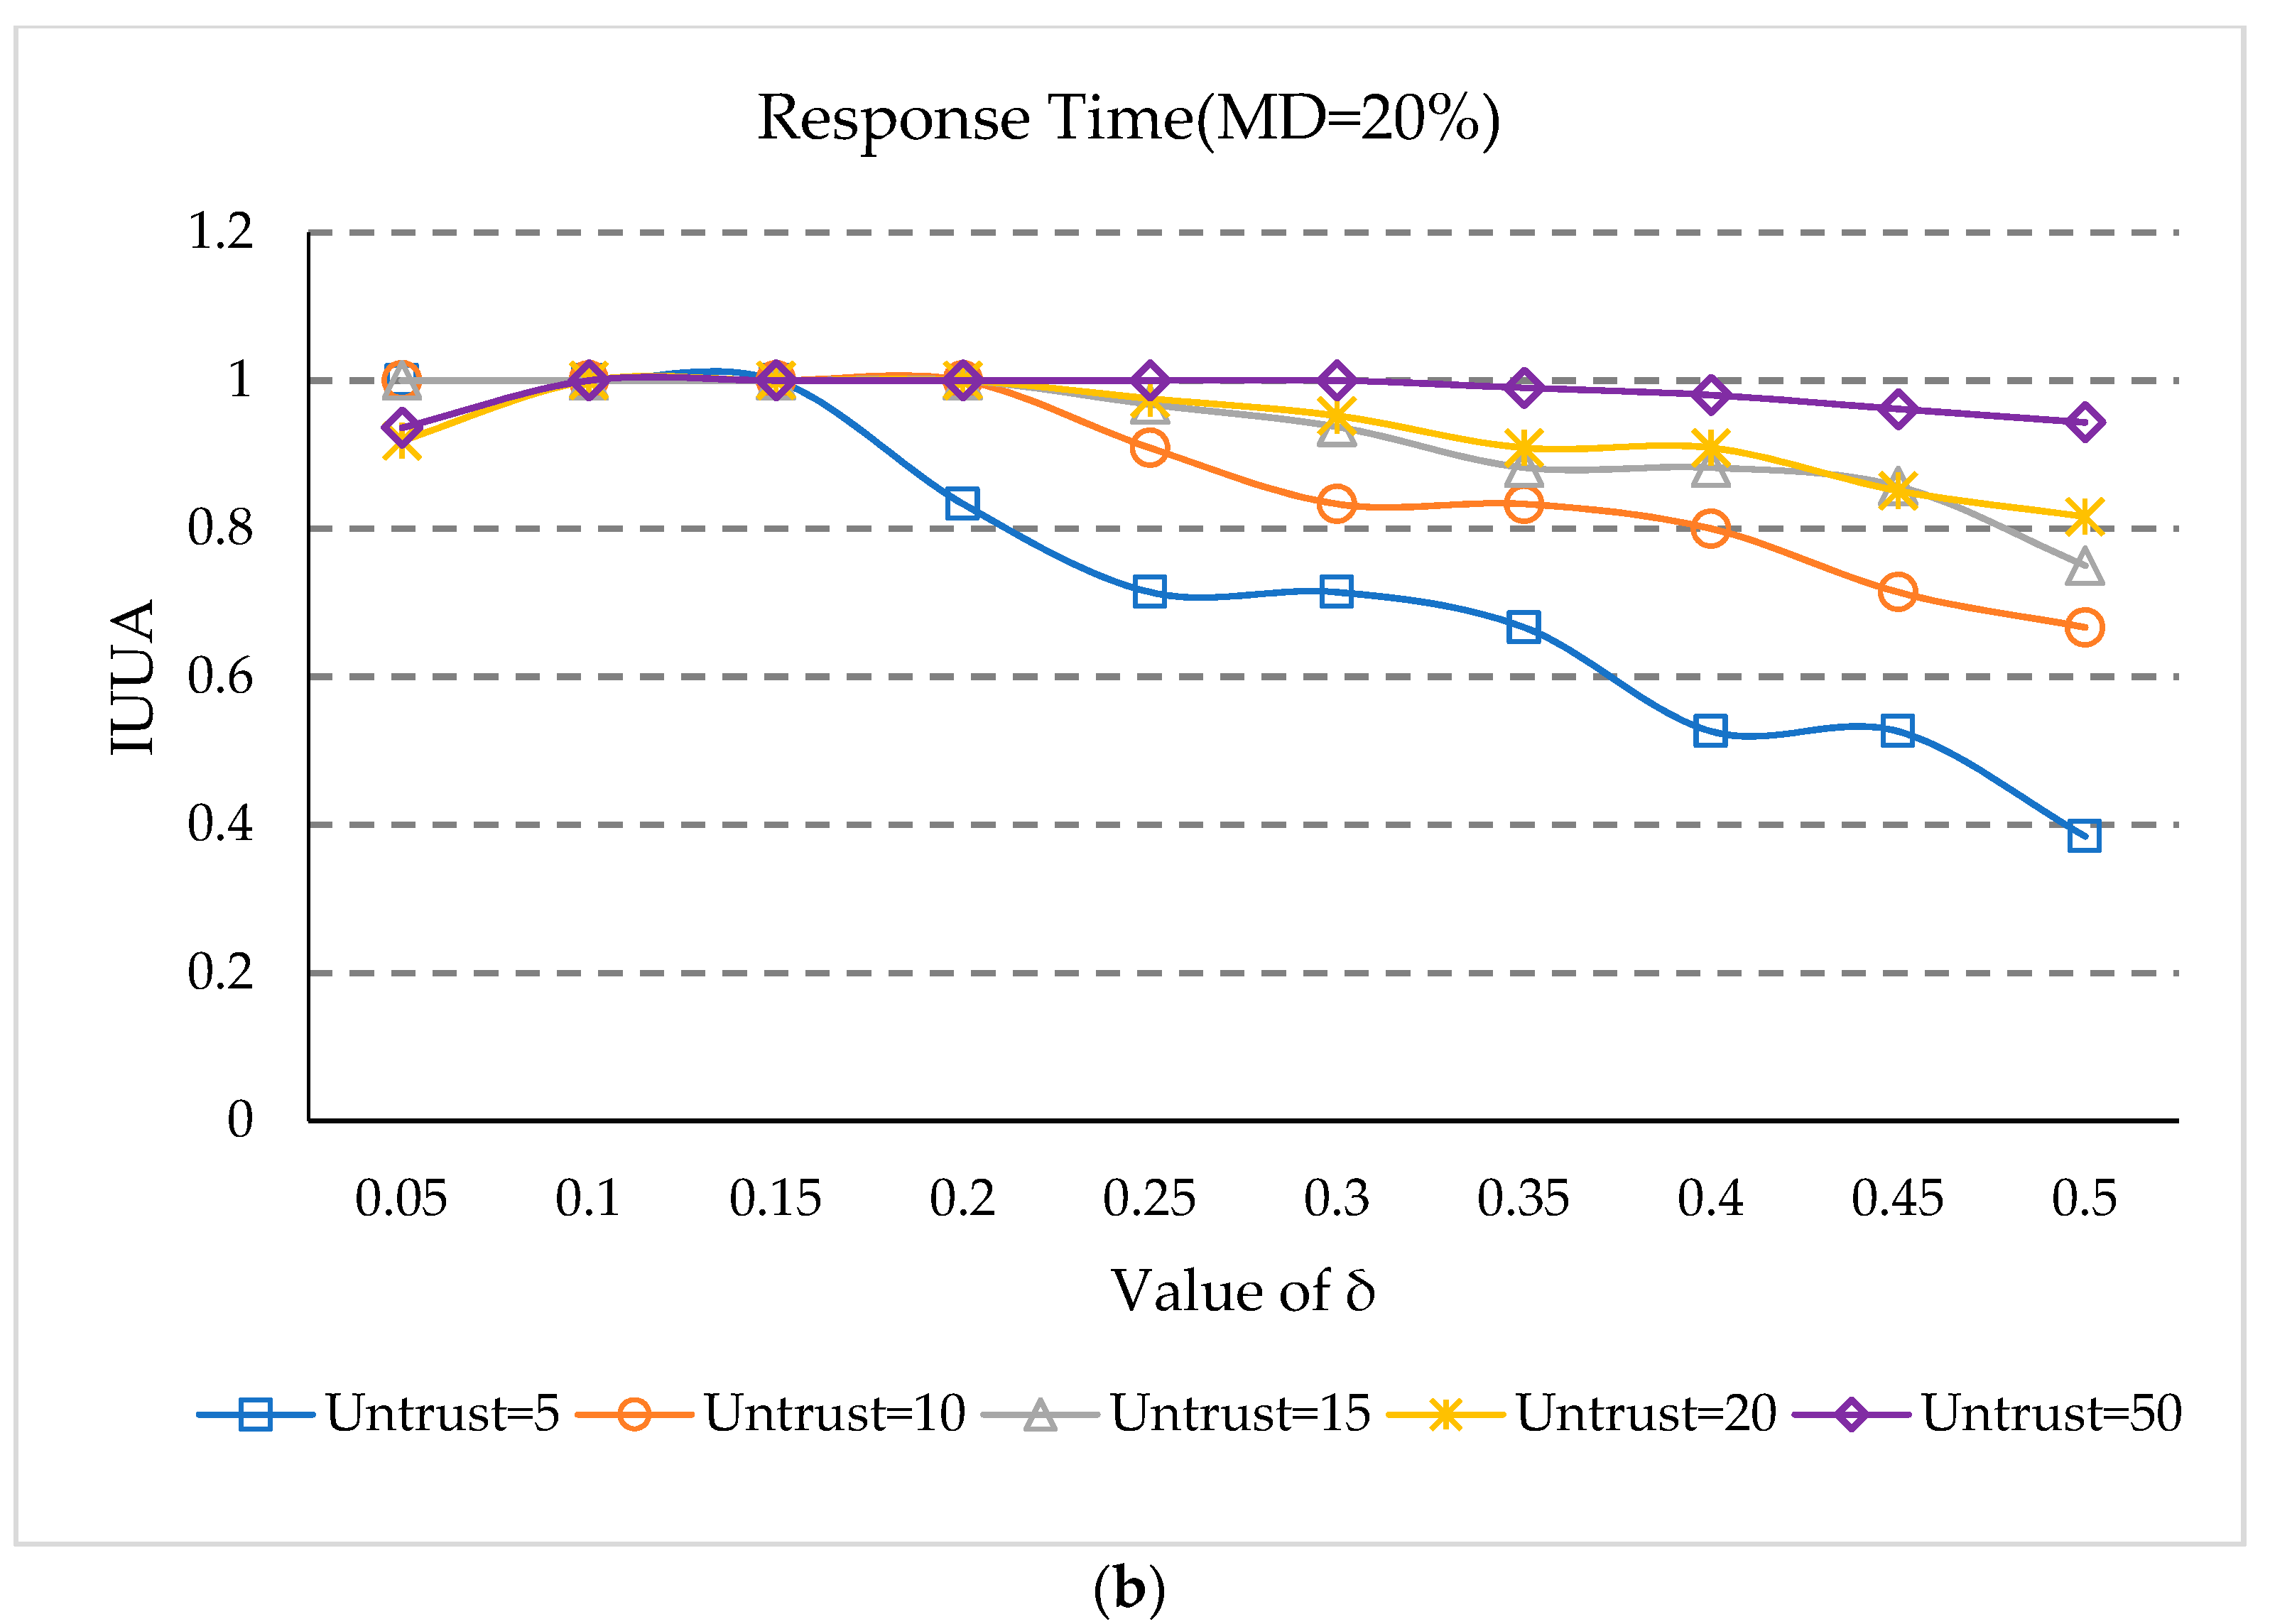
- (1)
- At first, IUUA increases rapidly as δ increases, when the matrix density is 5%. This is because user reputation methods cannot identify untrusted users when δ is small. After IUUA rises to 1, it declines as the value of δ increases, because when the value is too large, trusted users will be identified as untrusted users.
- (2)
- In Figure 5a,b, there are the earliest declines in the case of five untrusted users, and the slowest drop for 50 untrusted users. This is because when the number of untrusted users is small, some feedback situations of the trusted users can be easily recognized as untrusted feedback, as some trusted users have relatively small reputation values. Therefore, with δ increasing, trusted users can easily be identified as untrusted users, which influences the prediction accuracy.
- (3)
- It can be seen from Figure 5 that when the value is 0.10, the IUUA value can be maximized at both matrix densities.
5.6. Impact of UK
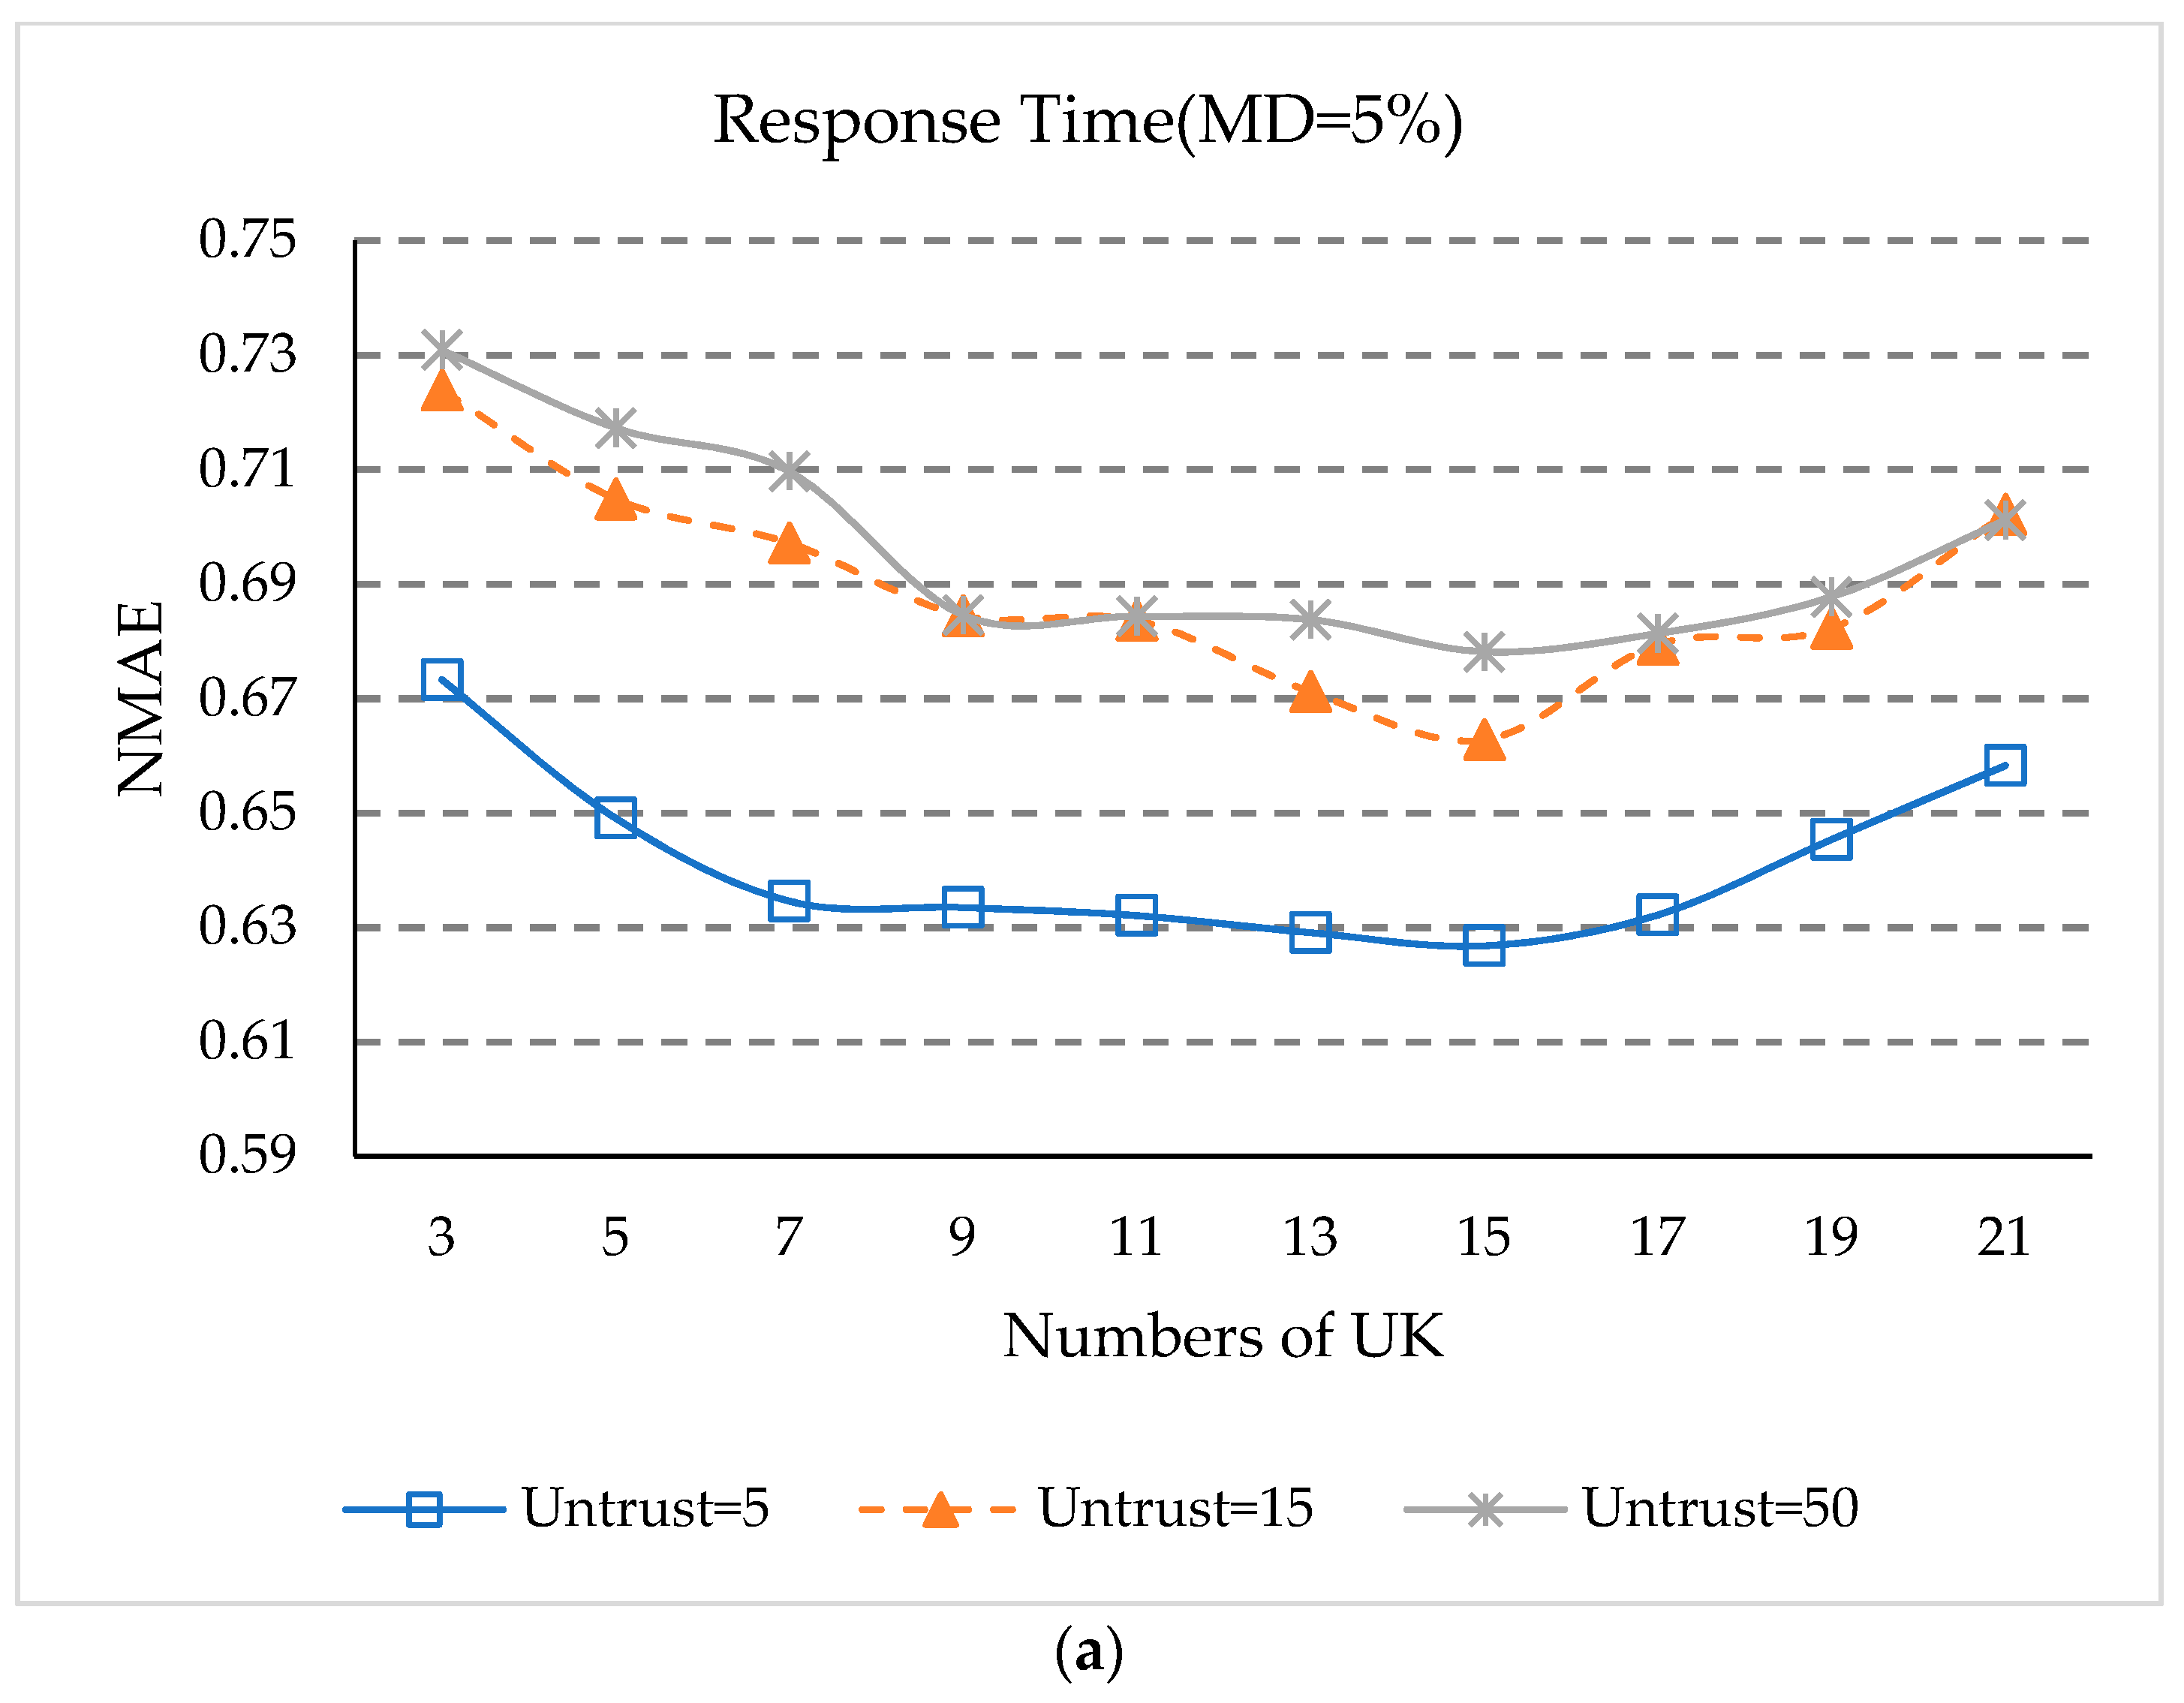
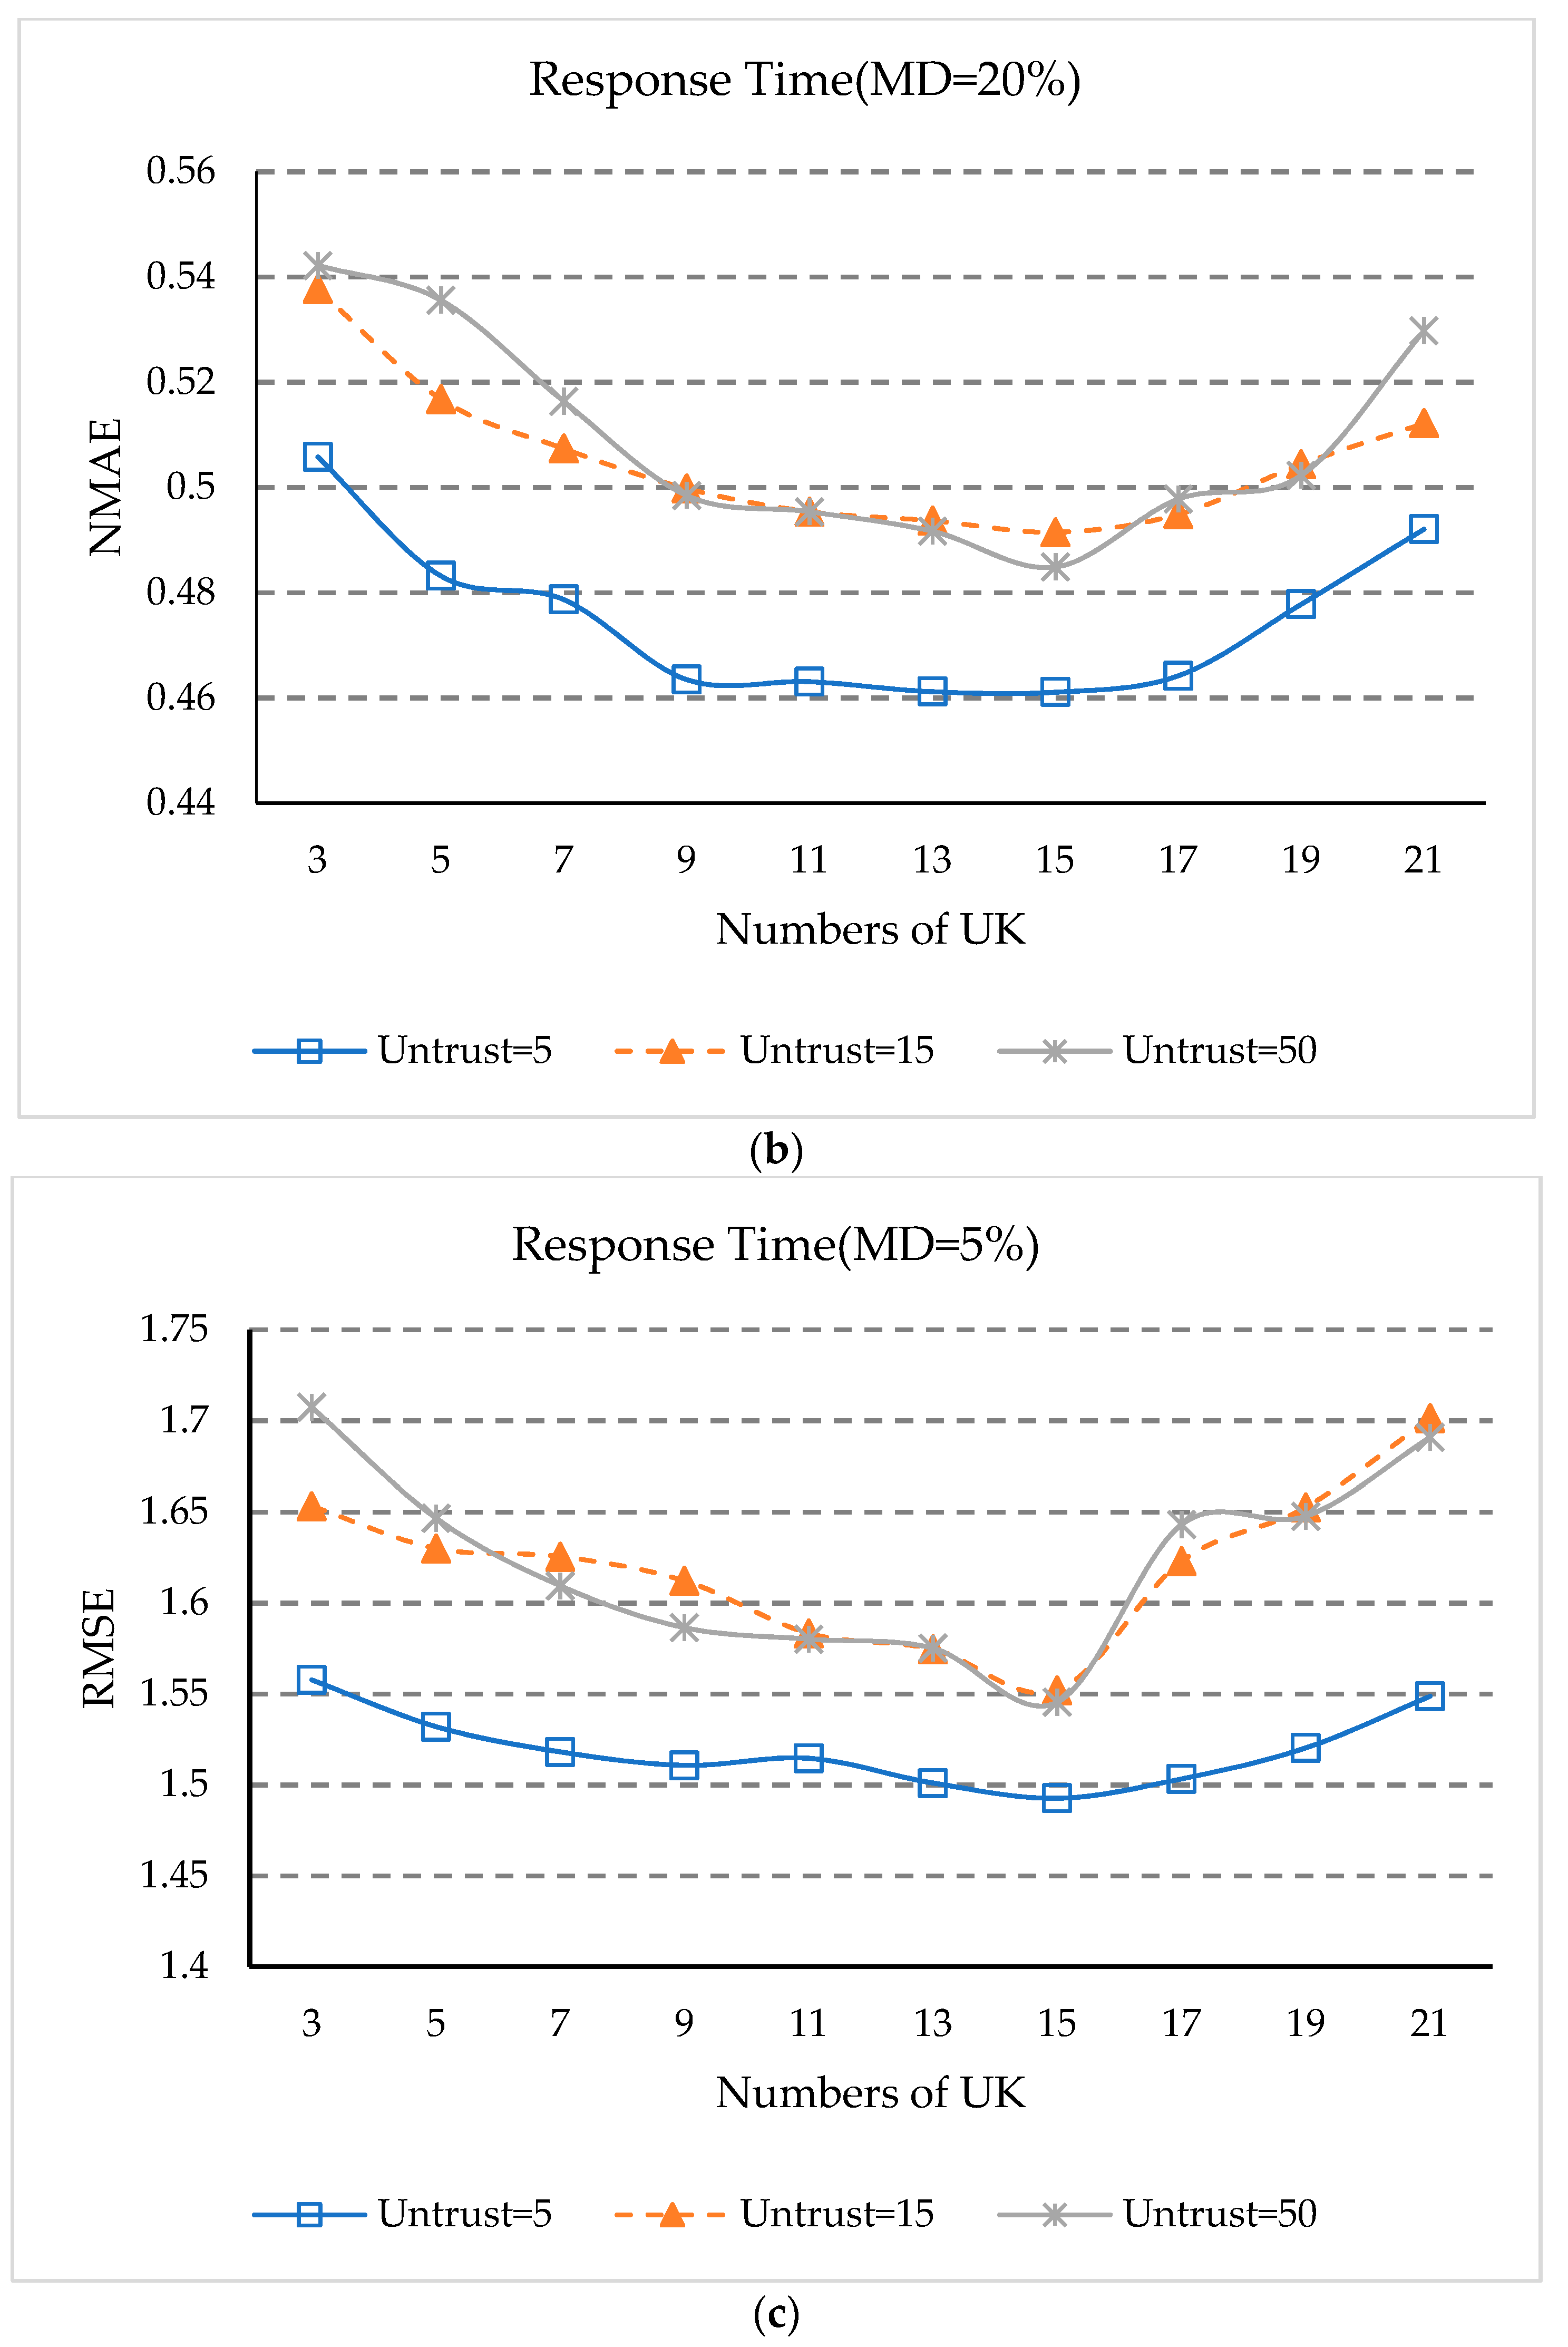
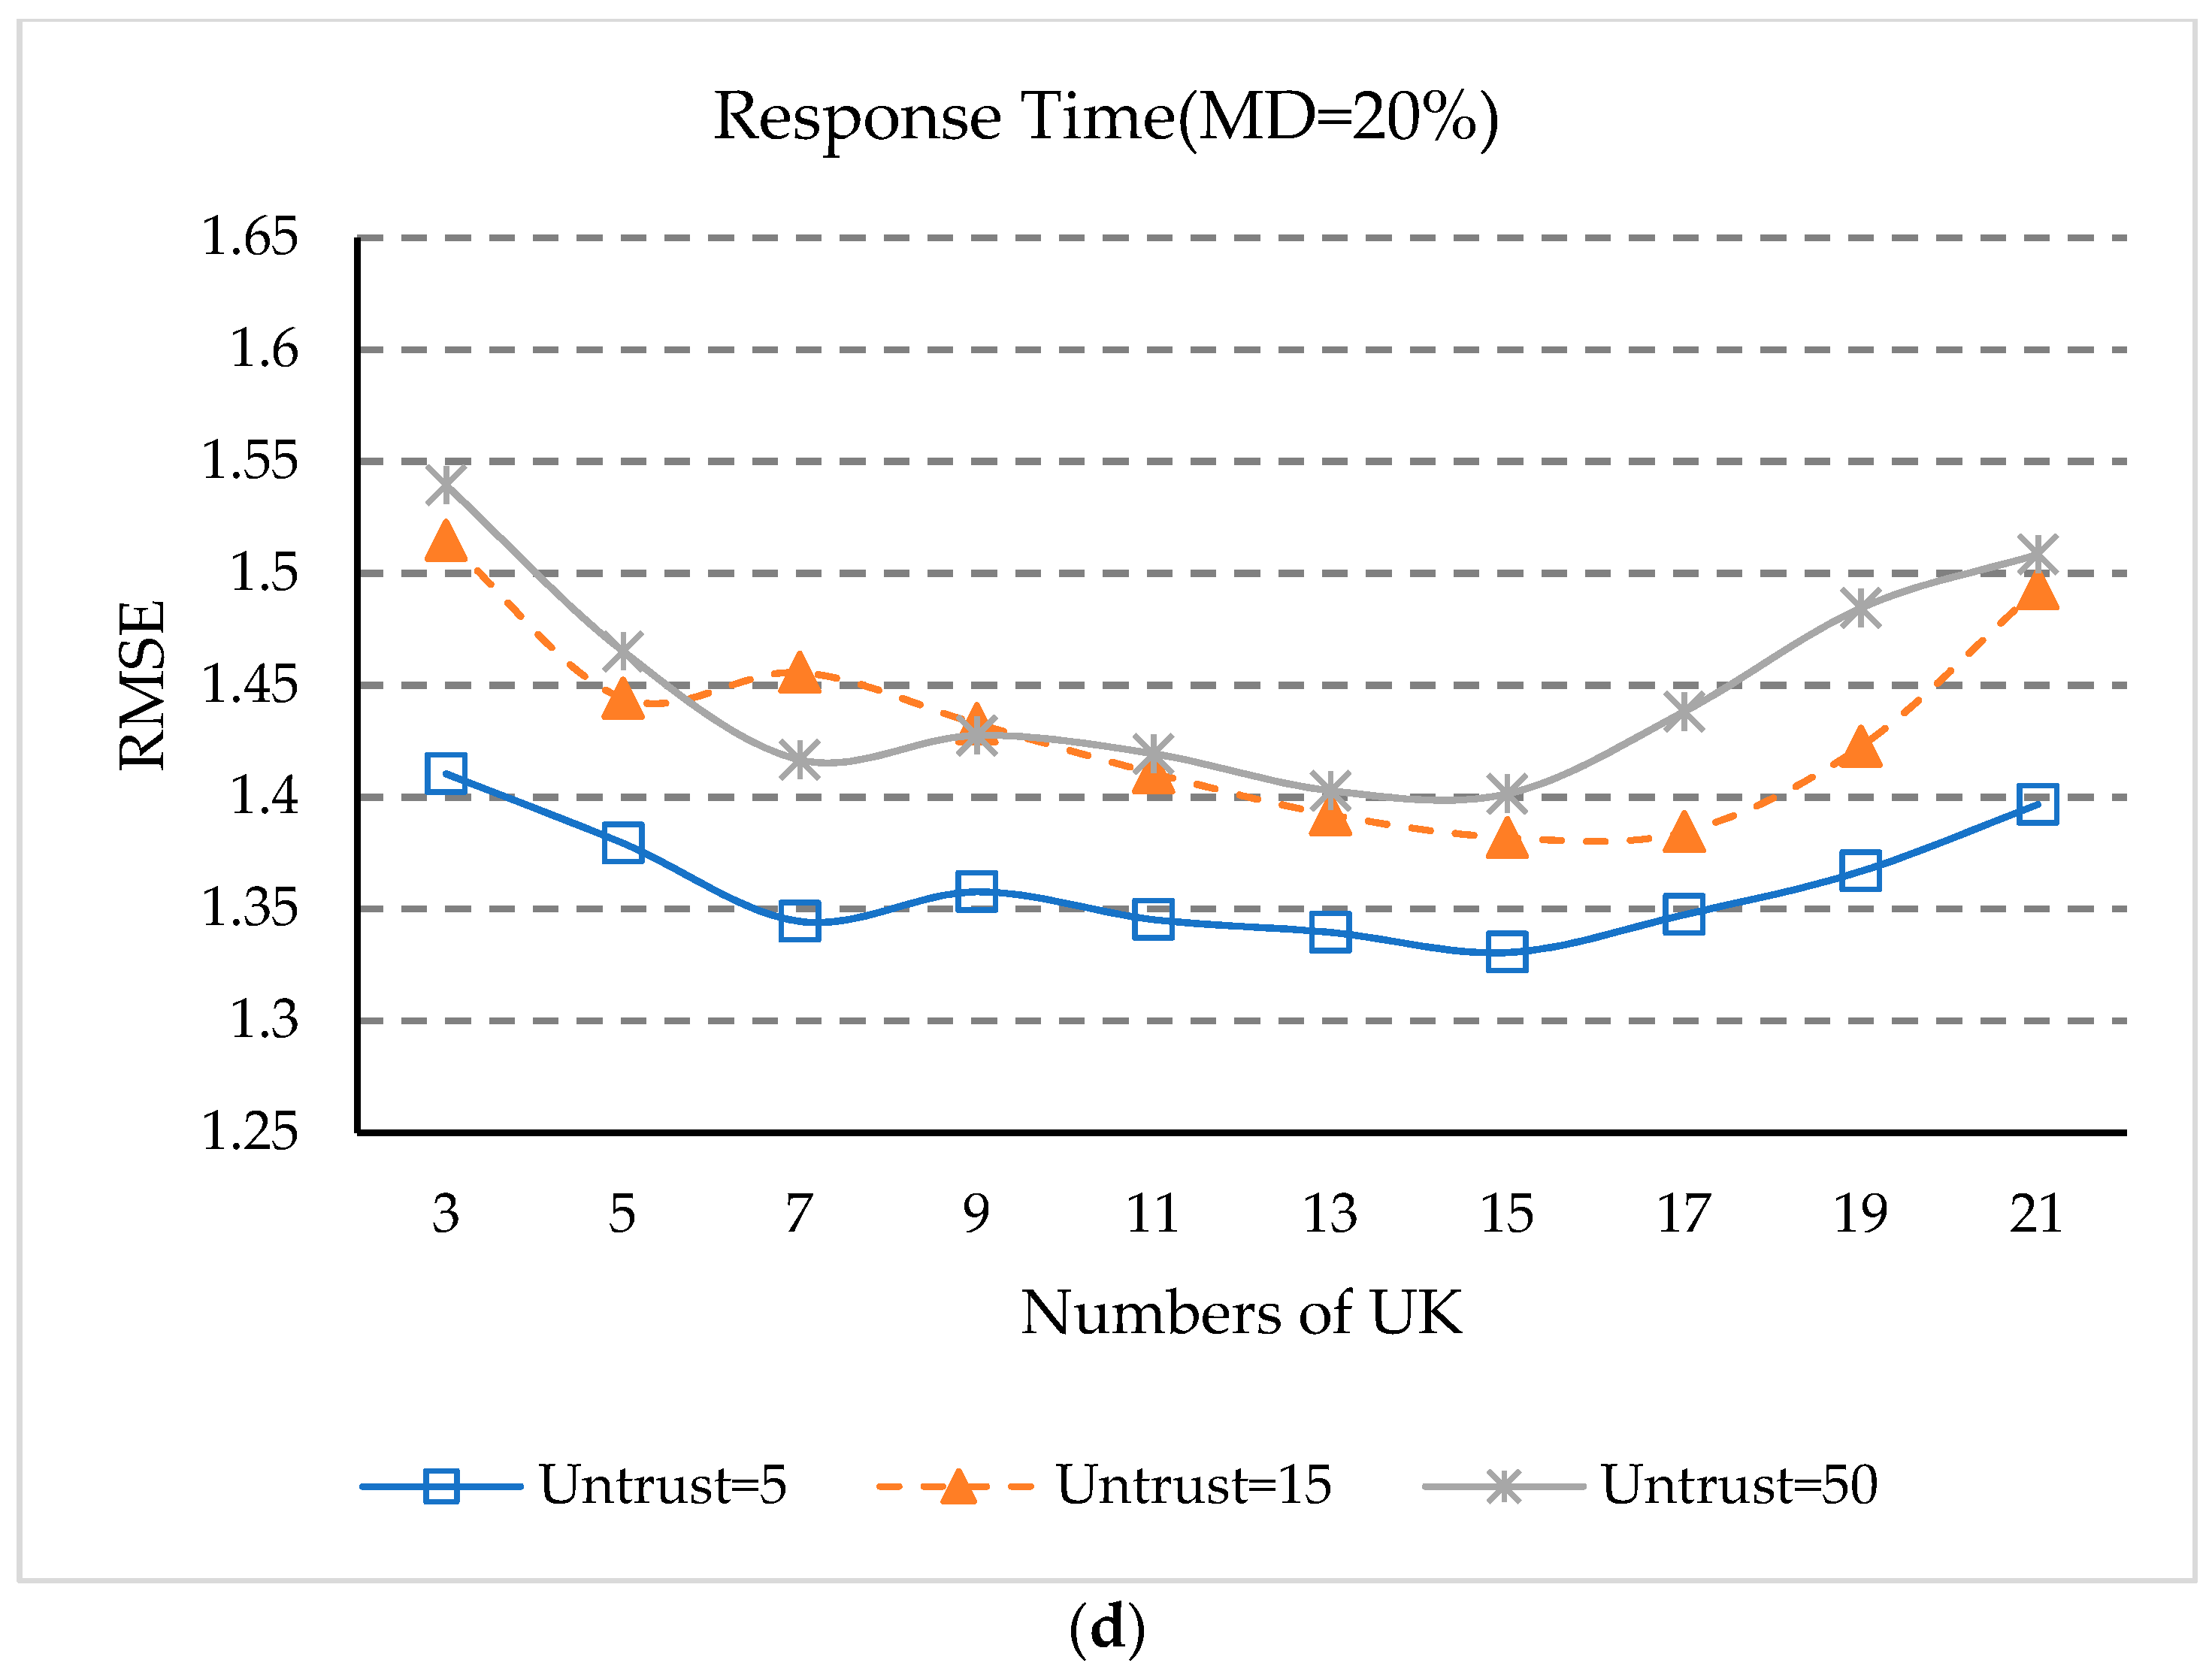
- (1)
- It can be seen from Figure 6 that the values of NMAE and RMSE keep declining when the value of UK is between 3 and 15. When the value of UK is between 15 and 21, the values of MAE and RMSE begin to slowly rise again. This is because when the number of statistical intervals UK is relatively small, the reliable interval cannot distinguish the untrustworthy users. When the statistical interval is relatively large, the reliable interval users may not be able to completely include all the trusted users.
- (2)
- It can also be observed in Figure 6 that when the number of untrusted users is 5, the NMAE and RMSE values are smaller than those of 15 and 50, while when the number of untrustworthy users is 15, the NMAE and RMSE values are generally smaller than for 50 users. This fact shows that when there are more untrusted users, this will still affect the accuracy of QoS prediction.
- (3)
- As can be seen from Figure 6, when UK equals 15, the NAME and RMSE values are the smallest under different numbers of untrusted users, which indicates that when the statistical interval UK is 15, our approach has the best prediction accuracy.
5.7. Impacts of Matrix Density
5.8. Impact of Ks
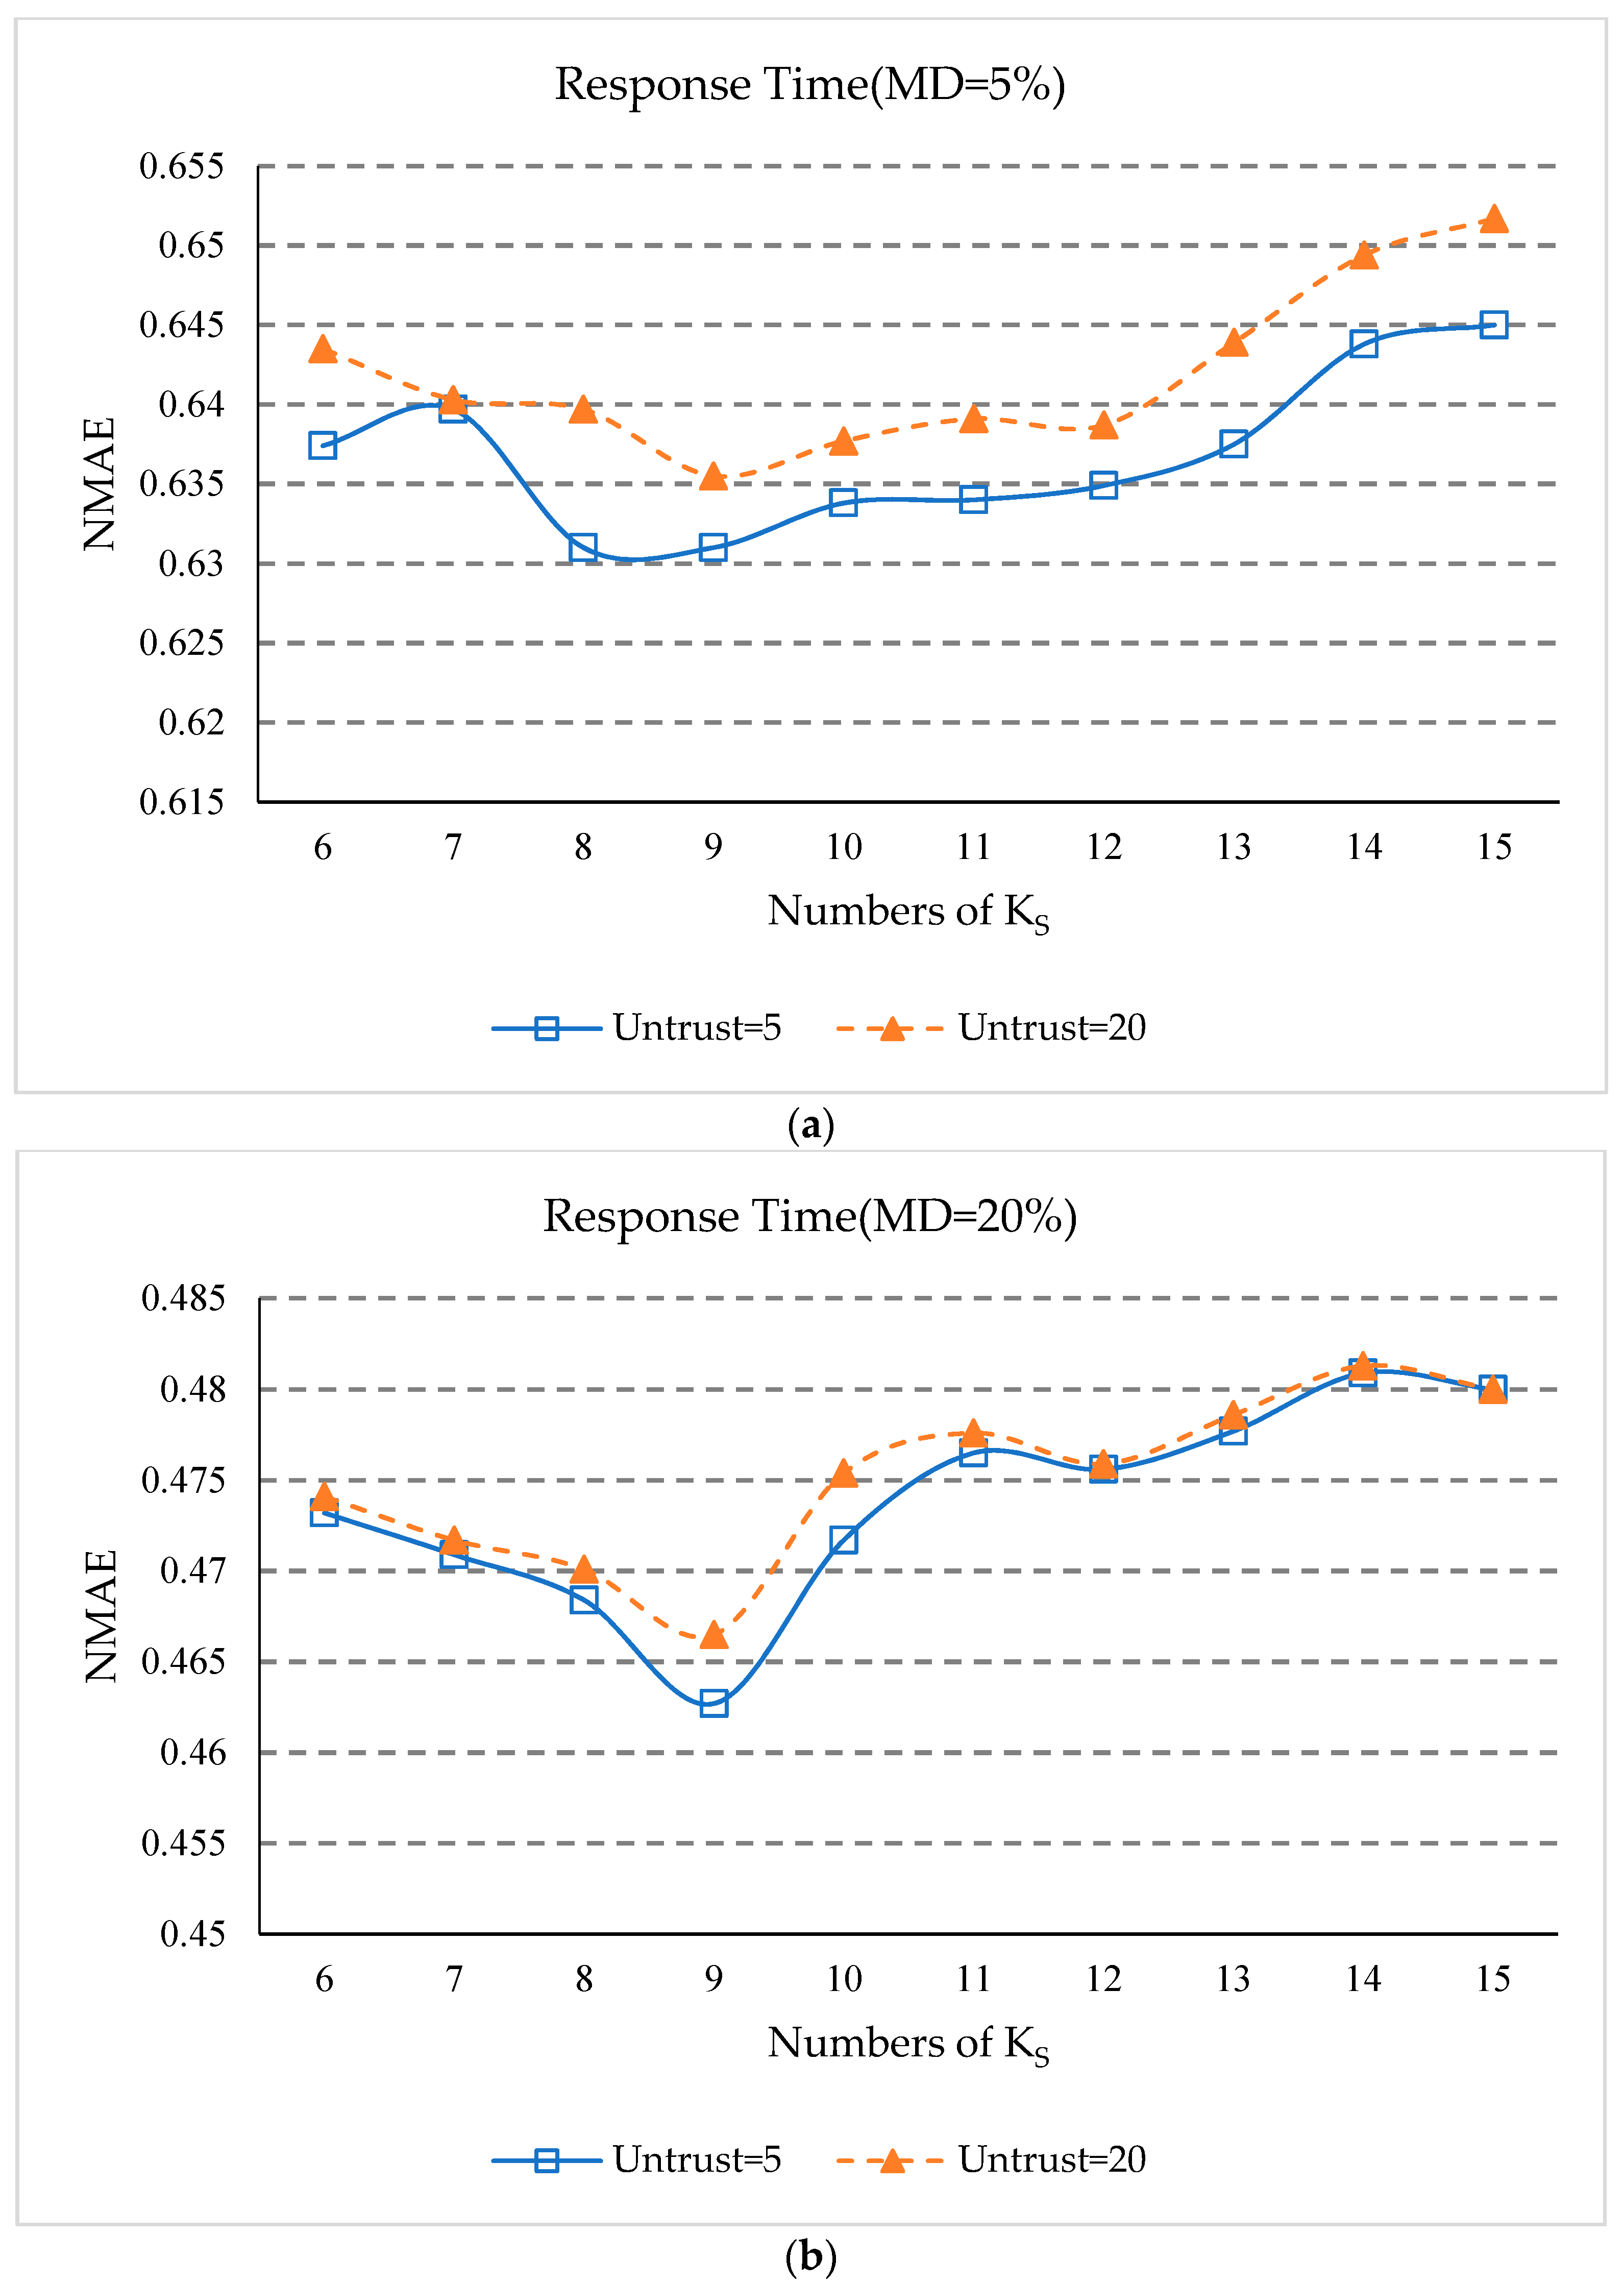
- (1)
- In Figure 8a,b, the overall trend of NMAE value decreases first and then increases as KS increases, which indicates that when the number of service clusters is too small, our approach can’t exclude services that are dissimilar but happen to have similar QoS experiences with a few common users. In addition, when the service cluster is too much, the number of services in the service cluster will be too small to find adequate geographic neighbors.
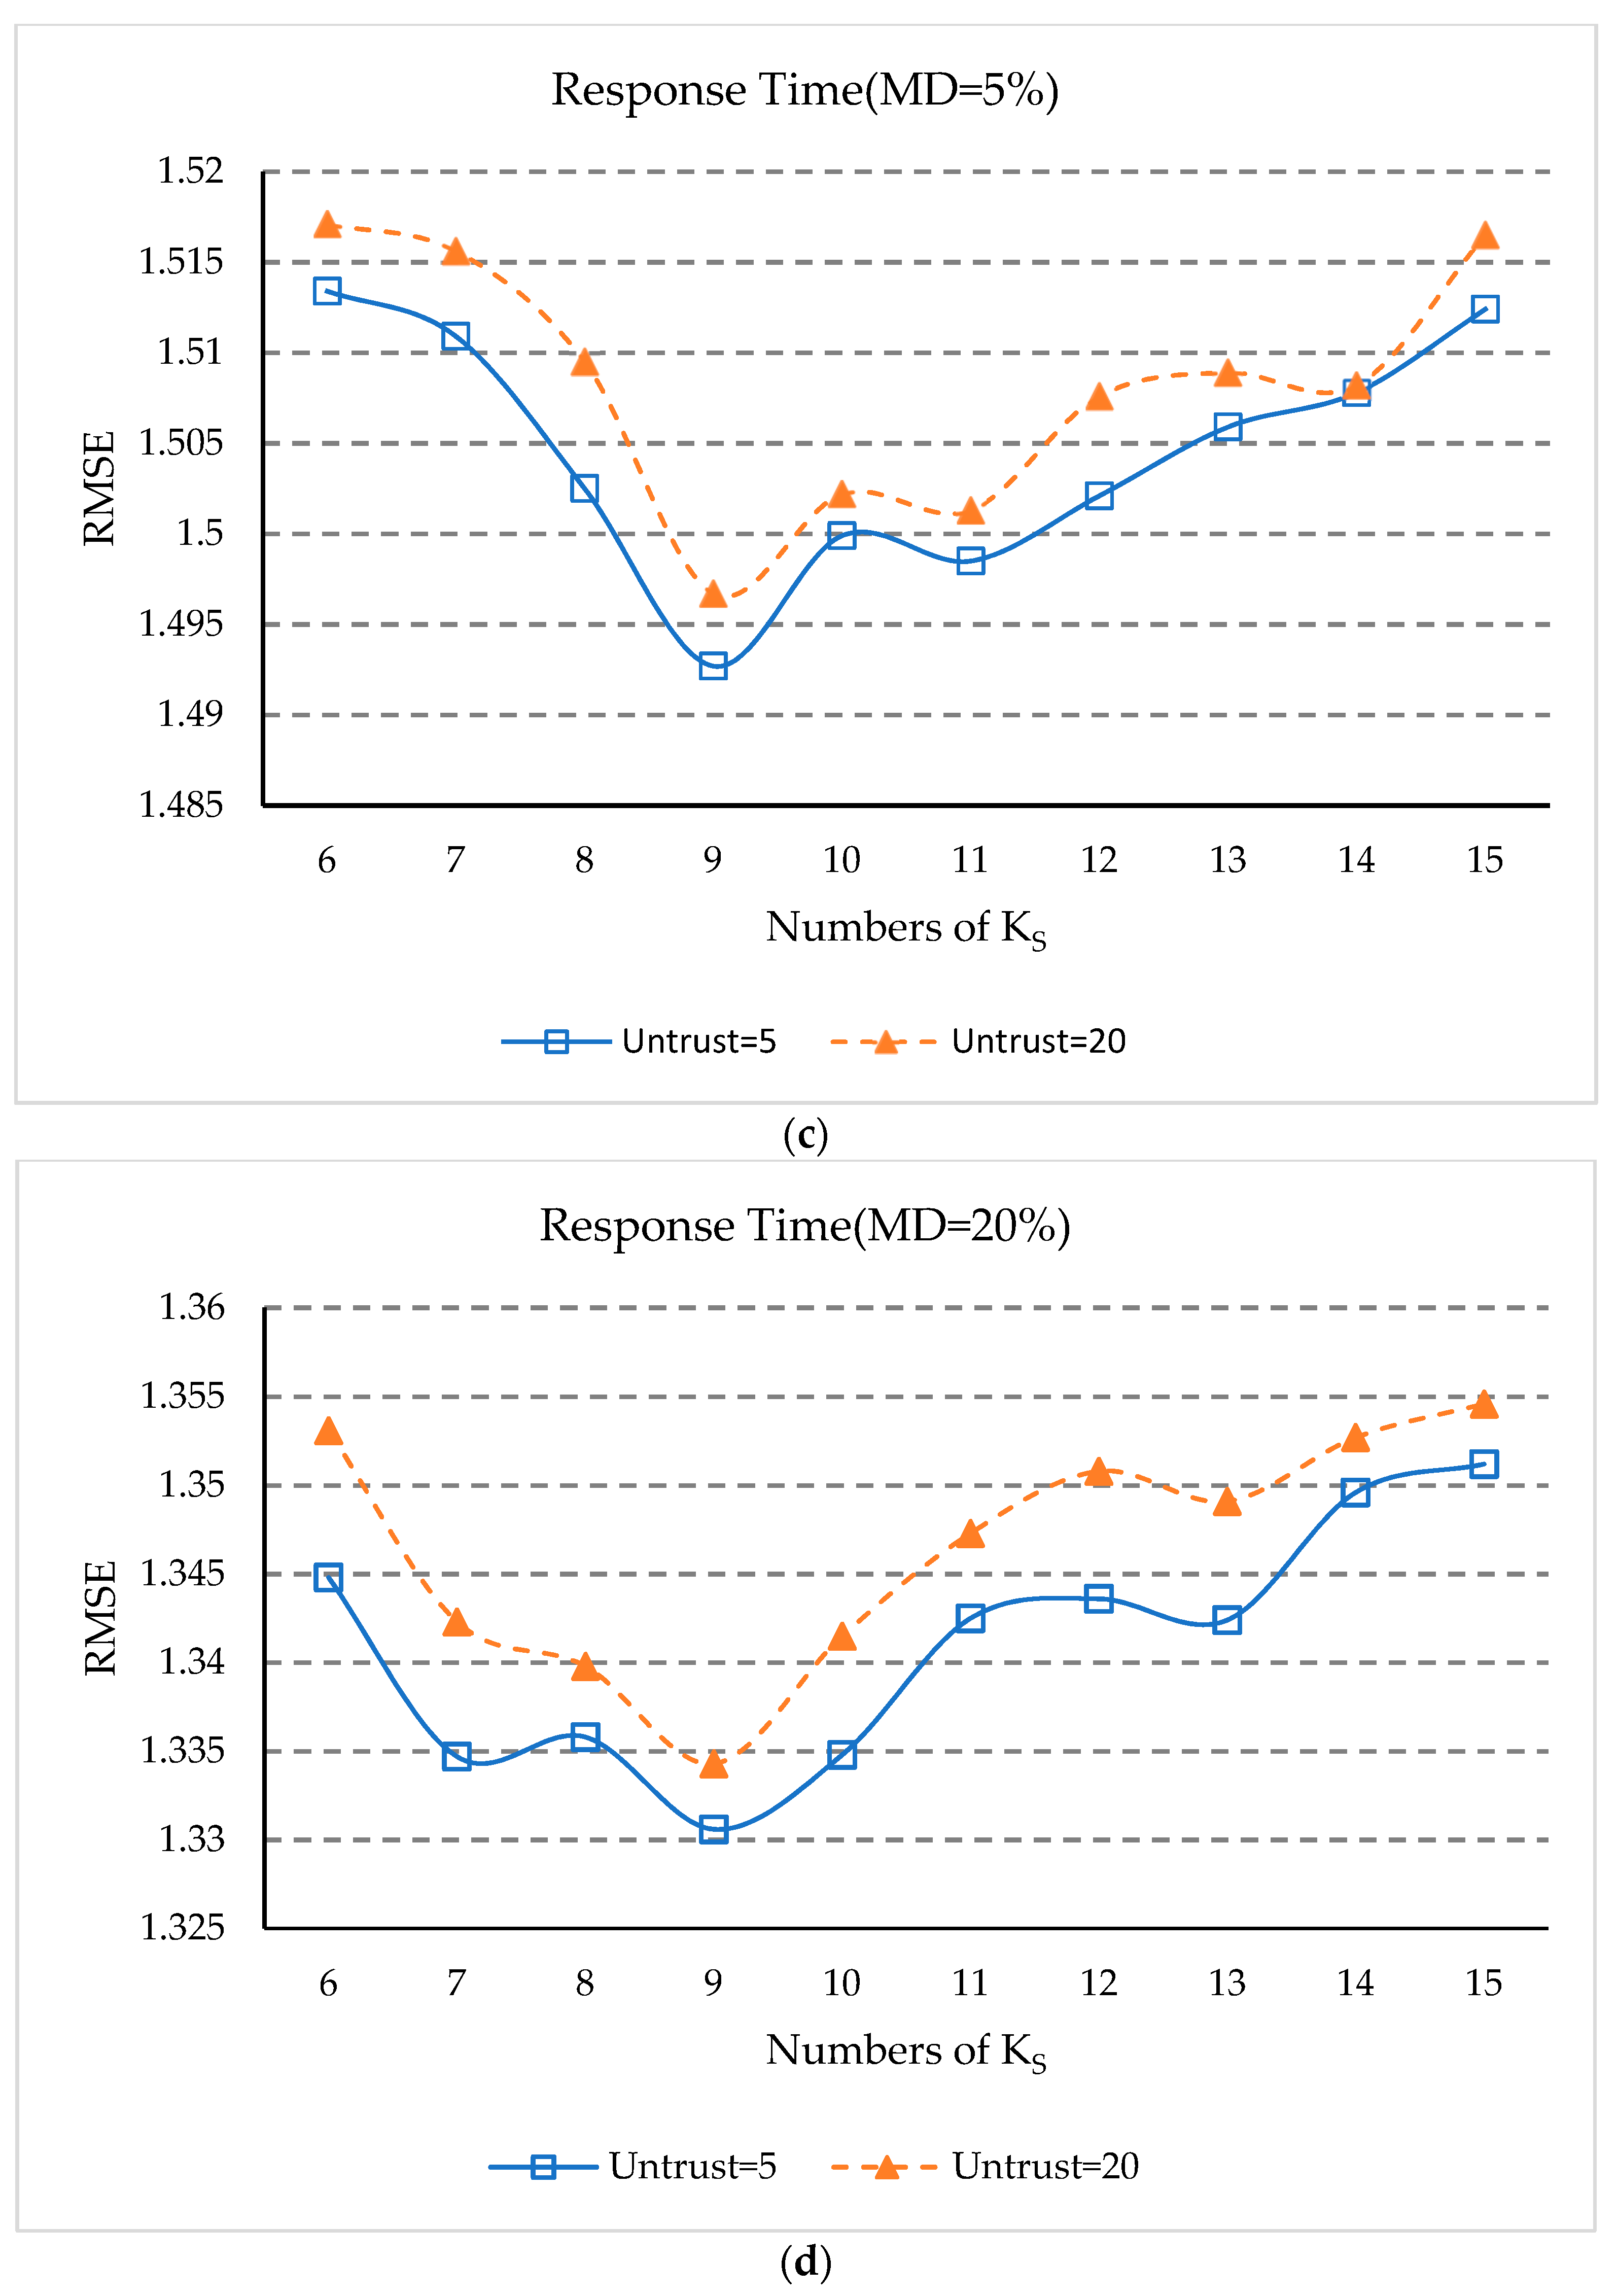
- (2)
- In Figure 8c,d, the overall trend of the RMSE value also decreases first and then increases as KS increases, but the RMSE value decreases quickly. This is because RMSE evaluation indicators are more susceptible to services that are not truly similar.
- (3)
- As can be seen from Figure 8a–d, when KS is equal to nine, the values of NMAE and RMSE are the smallest. This shows that when the number of service clusters is nine, our approach has the best prediction accuracy.
5.9. Impact of KNS and KNU
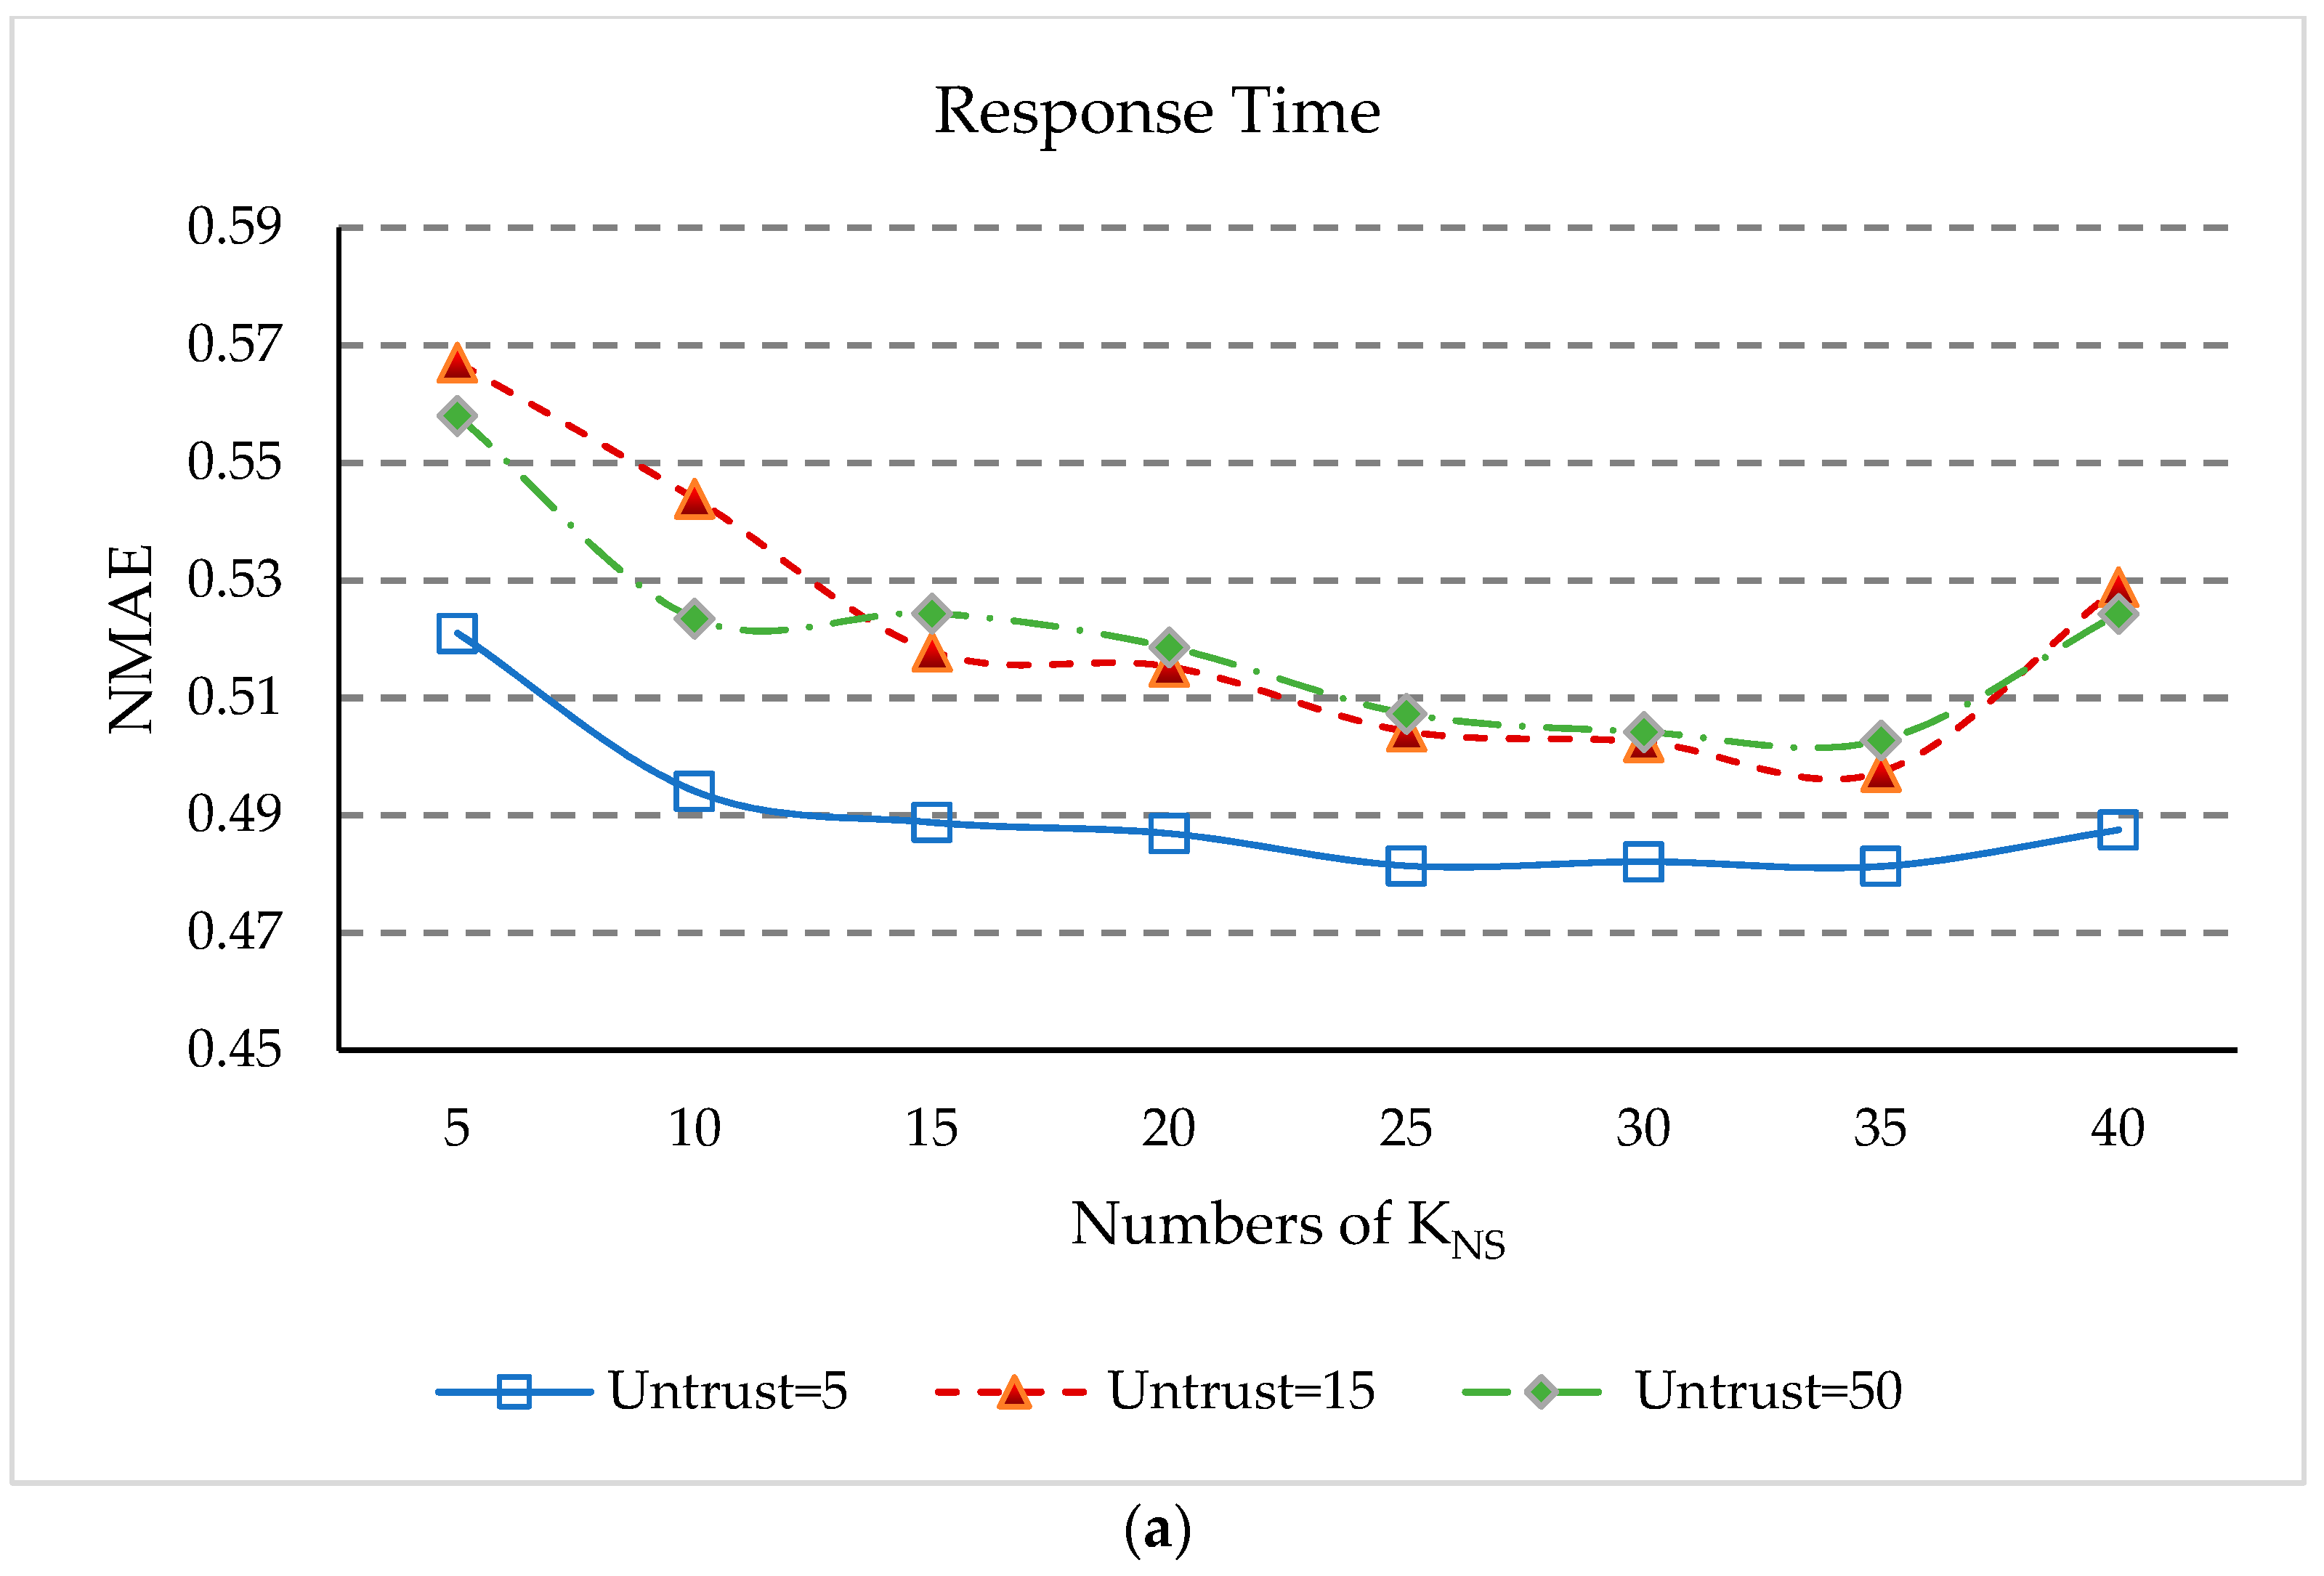
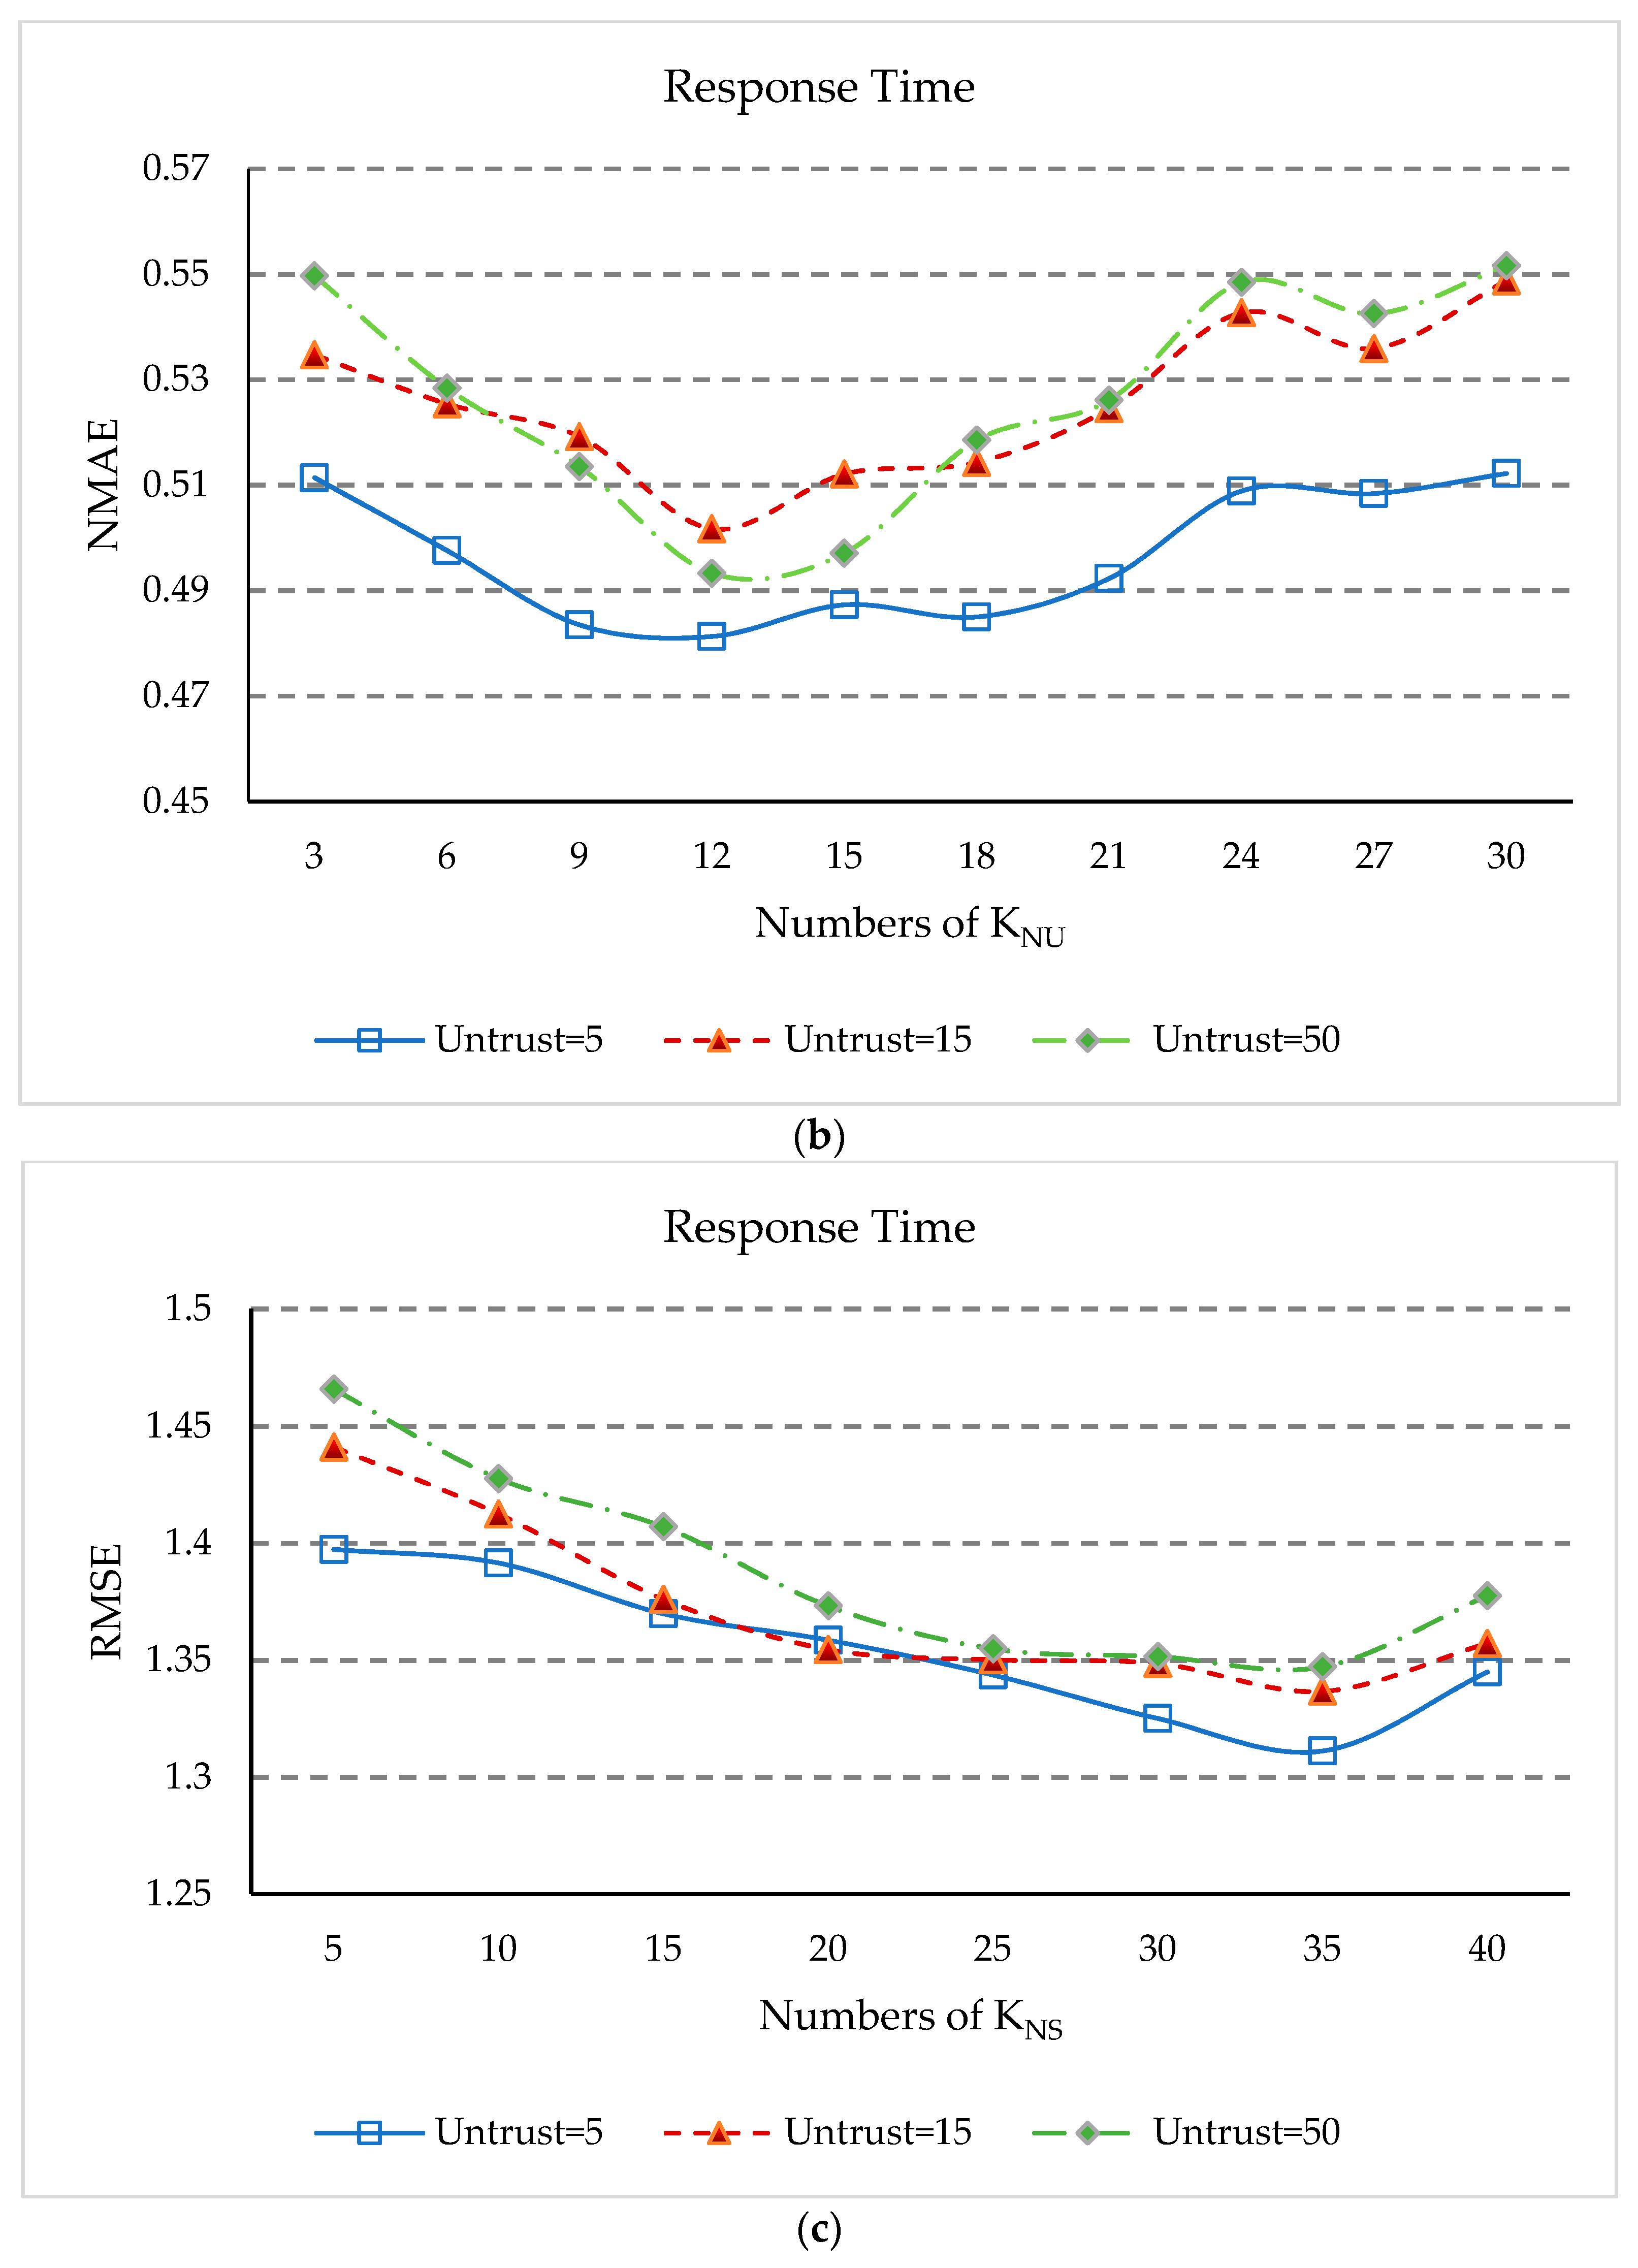
- (1)
- The values of NMAE in Figure 9a and RMSE in Figure 9c initially decrease rapidly with increasing KNS, but after KNS is equal to 15, the rate of decline slows down. After KNS is equal to 35, the values of NMAE and RMSE rose rapidly again. This is because when the number of geographical neighbors of services is too small, our approach cannot obtain enough information to predict unknown QoS values, and when KNS is too large, the dissimilar geographical neighbors will affect the accuracy of QoS prediction.
- (2)
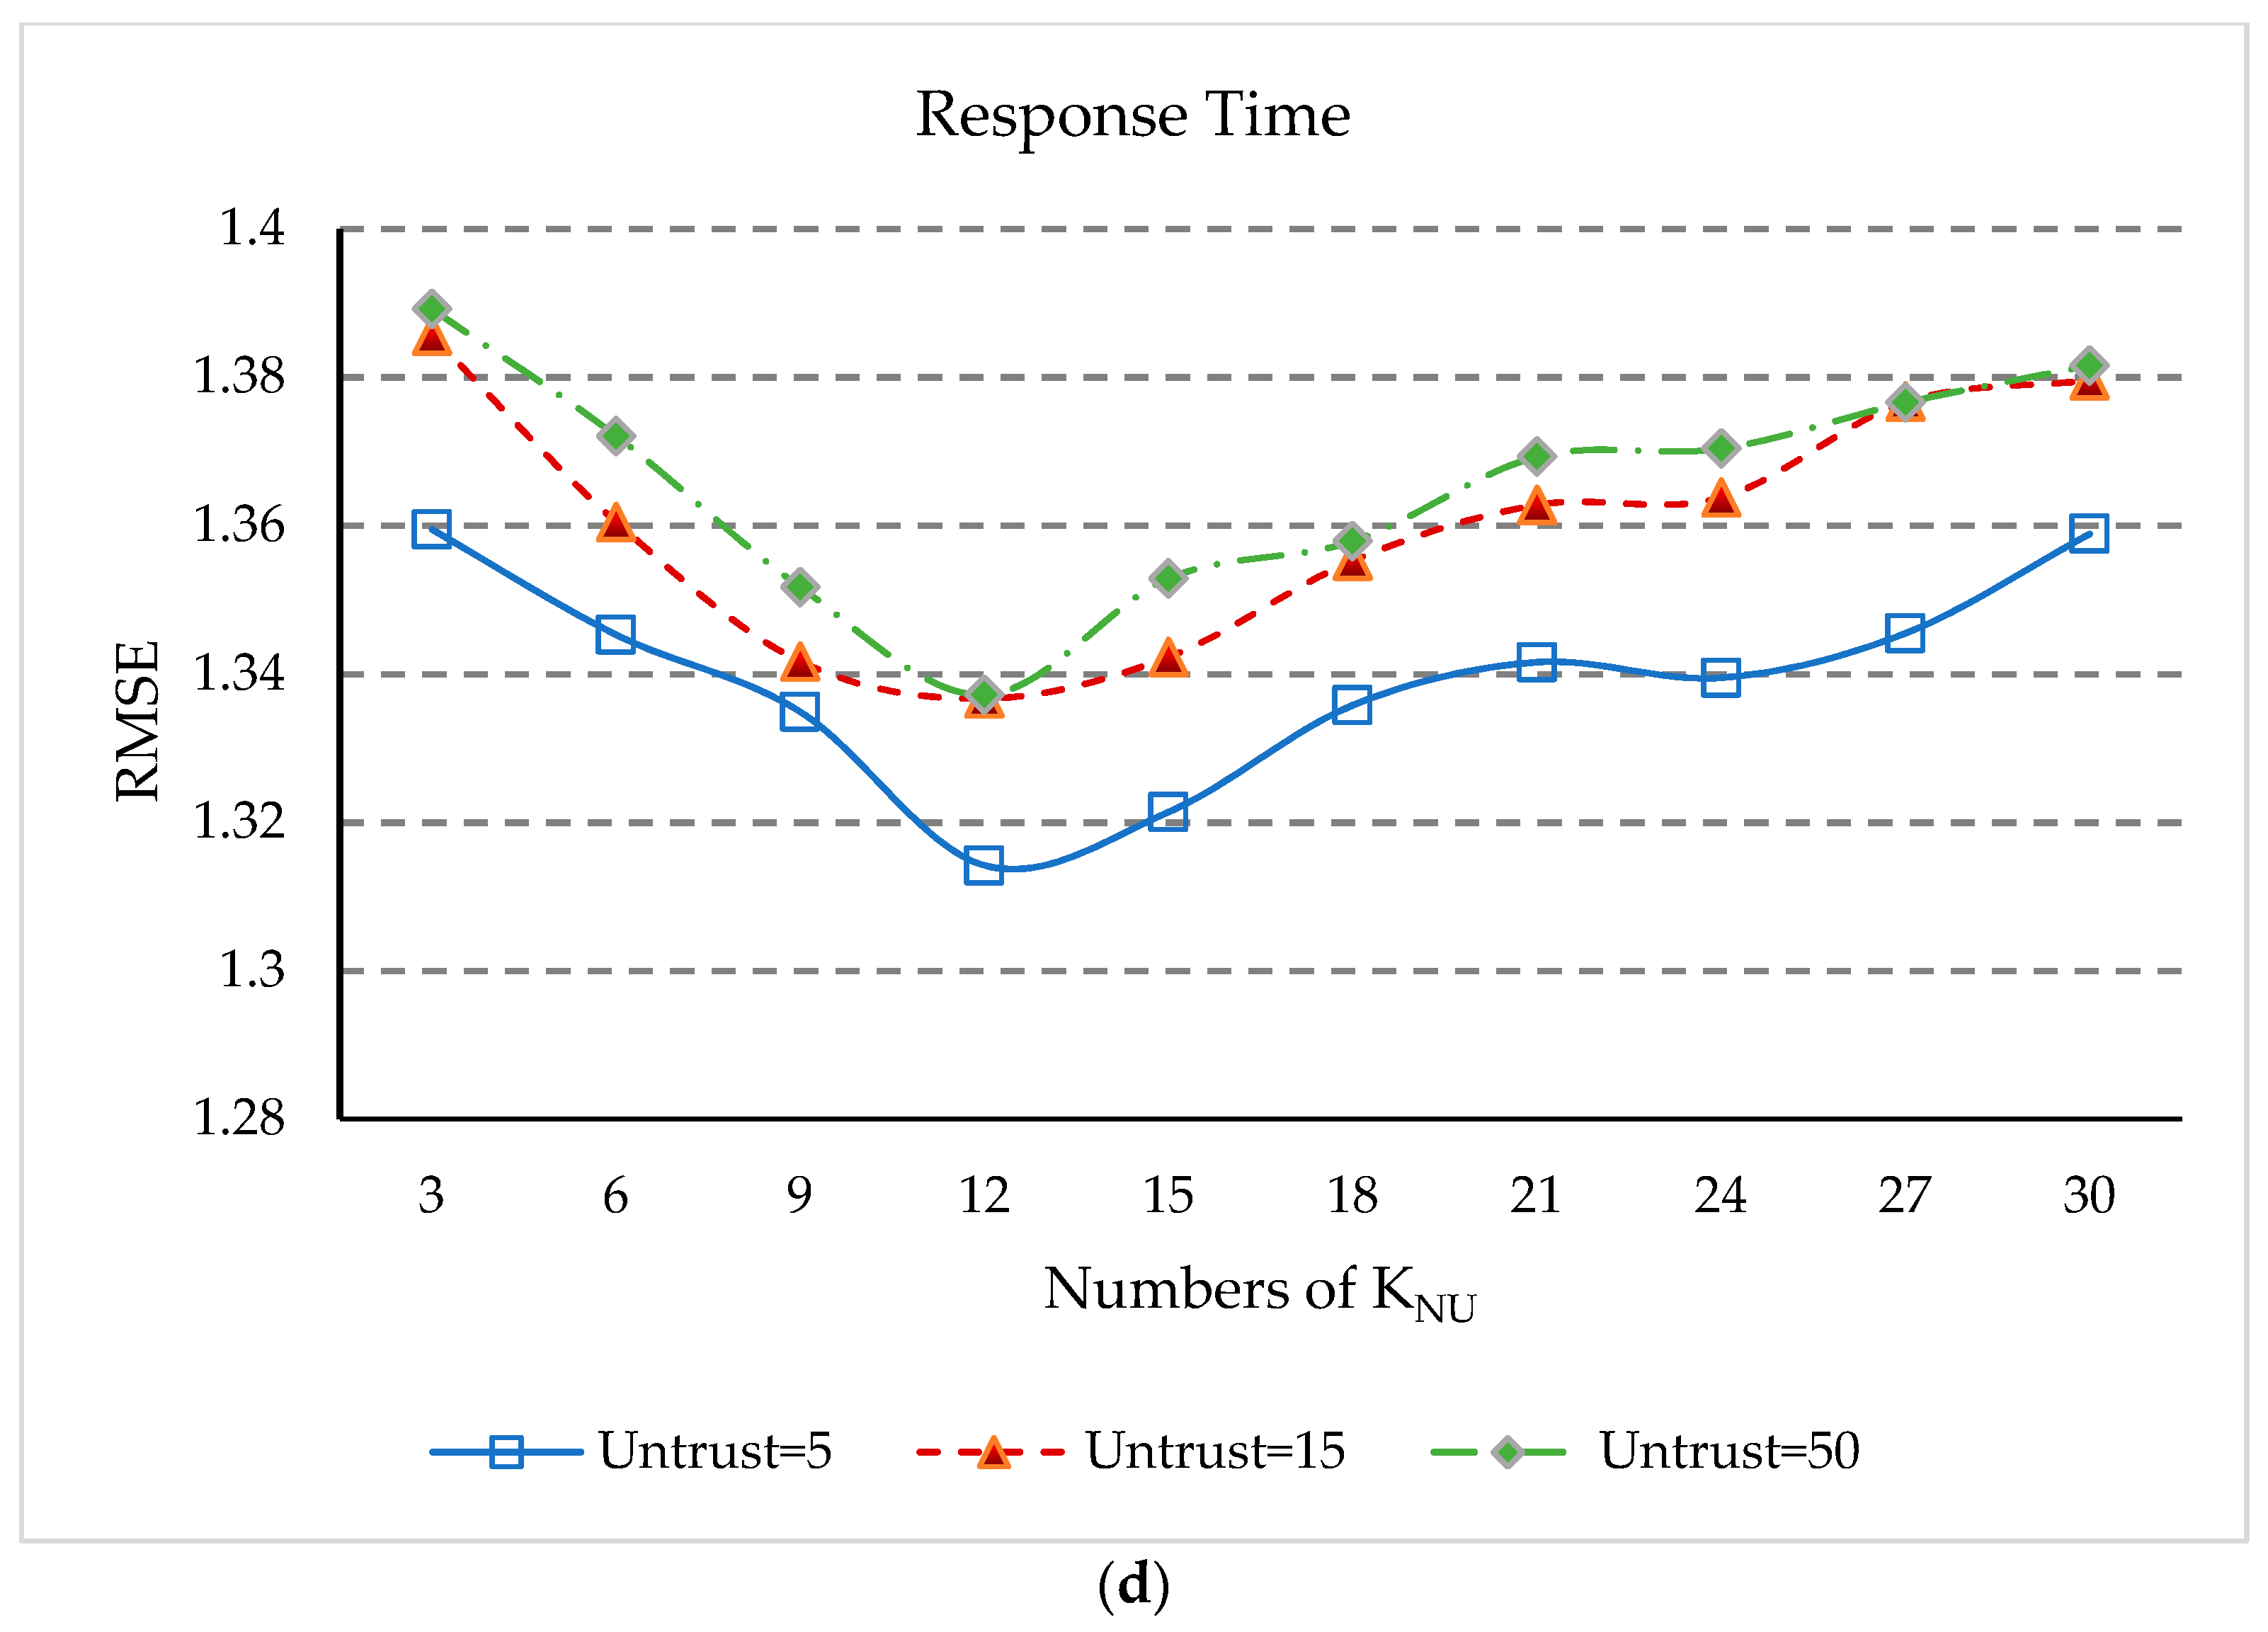
- (3)
- In Figure 9b,d, the values of NMAE and RMSE begin to decrease. Then, when KNU equals 12, NMAE and RMSE reach the minimum value. When KNU is greater than 12, the values of NMAE and RMSE increase continuously. However, when KNU is greater than 24, the values of NMAE and RMSE increase slowly. The reason is similar to the above, when KNU increases to a certain level, the impact of this parameter on QoS prediction will be weakened. As can be seen from Figure 9b,d, when KNU is equal to 12, that is the geographical proximity of the user is 12, the prediction accuracy of our approach is optimal.
- (4)
- Thus, it can conclude that KNS equal to 35 and KNU equal to 12 give the best parameter setting for the experimental results in our approach.
6. Conclusions and Future Work
Author Contributions
Funding
Acknowledgments
Conflicts of Interest
References
- Xia, F.; Ma, L.; Dong, J.; Sun, Y. Network QoS management in cyber-physical systems. In Proceedings of the 2008 IEEE International Conference on Embedded Software and Systems Symposia, ICESS Symposia’08, Sichuan, China, 29–31 July 2008; pp. 302–307. [Google Scholar]
- Dillon, T.; Potdar, V.; Singh, J.; Talevski, A. Cyber-physical systems: Providing Quality of Service (QoS) in a heterogeneous systems-of-systems environment. In Proceedings of the 2011 5th IEEE International Conference on Digital Ecosystems and Technologies Conference (DEST), Daejeon, Korea, 31 May–3 June 2011. [Google Scholar]
- Liu, Y.; Peng, Y.; Wang, B.; Yao, S.; Liu, Z. Review on cyber-physical systems. IEEE/CAA J. Autom. Sin. 2017, 4, 27–40. [Google Scholar] [CrossRef]
- Mohammed, A.W.; Xu, Y.; Hu, H.; Agyemang, B. Markov task network: A framework for service composition under uncertainty in cyber-physical systems. Sensors 2016, 16, 1542. [Google Scholar] [CrossRef] [PubMed]
- Stankovic, J.A. Research directions for cyber physical systems in wireless and mobile healthcare. ACM Trans. Cyber Phys. Syst. 2017, 1, 1. [Google Scholar] [CrossRef]
- Yin, Y.; Yu, F.; Xu, Y.; Yu, L.; Mu, J. Network Location-Aware Service Recommendation with Random Walk in Cyber-Physical Systems. Sensors 2017, 17, 2059. [Google Scholar] [CrossRef] [PubMed]
- Su, K.; Ma, L.; Xiao, B.; Zhang, H. Web service QoS prediction by neighbor information combined non-negative matrix factorization. J. Intell. Fuzzy Syst. 2016, 30, 3593–3604. [Google Scholar] [CrossRef]
- Bobadilla, J.; Ortega, F.; Hernando, A.; Gutiérrez, A. Recommender systems survey. Knowl. Based Syst. 2013, 46, 109–132. [Google Scholar] [CrossRef]
- Tang, M.; Jiang, Y.; Liu, J.; Liu, X. Location-aware collaborative filtering for QoS-based service recommendation. In Proceedings of the 2012 19th IEEE International Conference on Web Services (ICWS), Honolulu, HI, USA, 24–29 June 2012; pp. 202–209. [Google Scholar]
- Wu, J.; Chen, L.; Feng, Y.; Zheng, Z.; Zhou, M.C.; Wu, Z. Predicting quality of service for selection by neighborhood-based collaborative filtering. IEEE Trans. Syst. Man Cybern. Syst. 2013, 43, 428–439. [Google Scholar] [CrossRef]
- Shao, L.; Zhang, J.; Wei, Y.; Zhao, J.; Xie, B.; Mei, H. Personalized qos prediction forweb services via collaborative filtering. In Proceedings of the 2007 IEEE International Conference on Web Services, ICWS 2007, Salt Lake City, UT, USA, 9–13 July 2007; pp. 439–446. [Google Scholar]
- Yu, Q. QoS-aware service selection via collaborative QoS evaluation. World Wide Web 2014, 17, 33–57. [Google Scholar] [CrossRef]
- Gunes, I.; Kaleli, C.; Bilge, A.; Polat, H. Shilling attacks against recommender systems: A comprehensive survey. Artif. Intell. Rev. 2014, 42, 1–33. [Google Scholar] [CrossRef]
- Qiu, W.; Zheng, Z.; Wang, X.; Yang, X.; Lyu, M.R. Reputation-Aware QoS Value Prediction of Web Services. In Proceedings of the IEEE International Conference on Services Computing, Santa Clara, CA, USA, 28 June–3 July 2013; pp. 41–48. [Google Scholar]
- Xu, J.; Zheng, Z.; Lyu, M.R. Web Service Personalized Quality of Service Prediction via Reputation-Based Matrix Factorization. IEEE Trans. Reliab. 2016, 65, 28–37. [Google Scholar] [CrossRef]
- Wu, C.; Qiu, W.; Zheng, Z.; Wang, X.; Yang, X. Qos prediction of web services based on two-phase k-means clustering. In Proceedings of the 2015 IEEE International Conference on Web Services (ICWS), New York, NY, USA, 27 June–2 July 2015; pp. 161–168. [Google Scholar]
- Su, K.; Xiao, B.; Liu, B.; Zhang, H.; Zhang, Z. TAP: A personalized trust-aware QoS prediction approach for web service recommendation. Knowl. Based Syst. 2017, 115, 55–65. [Google Scholar] [CrossRef]
- Chen, Z.; Shen, L.; Li, F. Exploiting Web service geographical neighborhood for collaborative QoS prediction. Future Gener. Comput. Syst. 2017, 68, 248–259. [Google Scholar] [CrossRef]
- Xu, Y.; Yin, J.; Lo, W.; Wu, Z. Personalized Location-Aware QoS Prediction for Web Services Using Probabilistic Matrix Factorization. In Web Information Systems Engineering; Springer: Berlin/Heidelberg, Germany, 2013; pp. 229–242. [Google Scholar]
- He, P.; Zhu, J.; Zheng, Z.; Xu, J.; Lyu, M.R. Location-Based Hierarchical Matrix Factorization for Web Service Recommendation. In Proceedings of the IEEE International Conference on Web Services, Anchorage, AK, USA, 27 June–2 July 2014; pp. 297–304. [Google Scholar]
- Luo, X.; Zhou, M.; Xia, Y.; Zhu, Q. Predicting web service QoS via matrix-factorization-based collaborative filtering under non-negativity constraint. In Proceedings of the Wireless and Optical Communication Conference (WOCC), Newark, NJ, USA, 9–10 May 2014; pp. 1–6. [Google Scholar]
- Zhang, Y.; Zheng, Z.; Lyu, M.R. WSPred: A time-aware personalized QoS prediction framework for Web services. In Proceedings of the 2011 22nd IEEE International Symposium on Software Reliability Engineering (ISSRE), Hiroshima, Japan, 29 November–2 December 2011; pp. 210–219. [Google Scholar]
- Xie, Q.; Zhao, S.; Zheng, Z.; Zhu, J.; Lyu, M.R. Asymmetric correlation regularized matrix factorization for web service recommendation. In Proceeding of the 2016 IEEE International Conference on Web Services (ICWS), San Francisco, CA, USA, 27 June–2 July 2016; pp. 204–211. [Google Scholar]
- Lika, B; Kolomvatsos, K; Hadjiefthymiades, S. Facing the cold start problem in recommender systems. Expert Syst. Appl. 2014, 41, 2065–2073. [Google Scholar] [CrossRef]
- Ardagna, D.; Pernici, B. Adaptive service composition in flexible processes. IEEE Trans. Softw. Eng. 2007, 33. [Google Scholar] [CrossRef]
- Xiong, N.; Wu, Z.; Huang, Y.; Xu, D. Analyzing comprehensive QoS with security constraints for services composition applications in wireless sensor networks. Sensors 2014, 14, 22706–22736. [Google Scholar] [CrossRef] [PubMed]
- Yu, T.; Zhang, Y.; Lin, K.J. Efficient algorithms for Web services selection with end-to-end QoS constraints. ACM Trans. Web (TWEB) 2007, 1, 6. [Google Scholar] [CrossRef]
- Huang, Y.; Huang, J.; Cheng, B.; He, S.; Chen, J. Time-Aware Service Ranking Prediction in the Internet of Things Environment. Sensors 2017, 17, 974. [Google Scholar] [CrossRef] [PubMed]
- Abdullah, A.; Li, X. An integrated-model qos-based graph for web service recommendation. In Proceedings of the 2015 IEEE International Conference on Web Services (ICWS), New York, NY, USA, 27 June–2 July 2015; pp. 416–423. [Google Scholar]
- Liu, J.; He, K.; Wang, J.; Liu, F.; Li, X. Service organization and recommendation using multi-granularity approach. Knowl. Based Syst. 2015, 73, 181–198. [Google Scholar] [CrossRef]
- Hu, Y.; Peng, Q.; Hu, X.; Yang, R. Web service recommendation based on time series forecasting and collaborative filtering. In Proceedings of the 2015 IEEE International Conference on Web Services (ICWS), New York, NY, USA, 27 June–2 July 2015; pp. 233–240. [Google Scholar]
- Kuang, L.; Liao, Z.; Feng, W.; He, H.; Zhang, B. Multimedia services quality prediction based on the association mining between context and QoS properties. Signal Process. 2016, 120, 767–776. [Google Scholar] [CrossRef]
- Zheng, Z.; Ma, H.; Lyu, M.R.; King, I. WSRec: A Collaborative Filtering Based Web Service Recommender System. In Proceedings of the IEEE International Conference on Web Services, Los Angeles, CA, USA, 6–10 July 2009; pp. 437–444. [Google Scholar]
- Chen, M.; Ma, Y. A Hybrid Approach to Web Service Recommendation Based on QoS-Aware Rating and Ranking. arXiv 2015, arXiv:1501.04298501.04298. [Google Scholar]
- Chen, M.; Ma, Y.; Hu, B.; Zhang, L.J. A ranking-oriented hybrid approach to qos-aware web service recommendation. In Proceedings of the 2015 IEEE International Conference on Services Computing (SCC), New York, NY, USA, 27 June–2 July 2015; pp. 578–585. [Google Scholar]
- Chen, F.; Yuan, S.; Mu, B. User-QoS-Based Web Service Clustering for QoS Prediction. In Proceedings of the IEEE International Conference on Web Services, New York, NY, USA, 27 June–2 July 2015; pp. 583–590. [Google Scholar]
- Lo, W.; Yin, J.; Deng, S.; Li, Y.; Wu, Z. An extended matrix factorization approach for qos prediction in service selection. In Proceedings of the 2012 IEEE Ninth International Conference on Services Computing (SCC), Honolulu, HI, USA, 24–29 June 2012; pp. 162–169. [Google Scholar]
- Maniak, T.; Jayne, C.; Iqbal, R.; Doctor, F. Automated intelligent system for sound signalling device quality assurance. Inf. Sci. 2015, 294, 600–611. [Google Scholar] [CrossRef]
- Ma, Y.; Wang, S.; Hung, P.C.; Hsu, C.H.; Sun, Q.; Yang, F. A highly accurate prediction algorithm for unknown web service QoS values. IEEE Trans. Serv. Comput. 2015, 9, 511–523. [Google Scholar] [CrossRef]
- Yin, J.; Xu, Y. Personalised QoS–based web service recommendation with service neighbourhood–enhanced matrix factorisation. Int. J. Web Grid Serv. 2015, 11, 39–56. [Google Scholar] [CrossRef]
- Zhang, G.; Zhang, G. Agent selection and P2P overlay construction using global locality knowledge. In Proceedings of the IEEE International Conference on Networking, Sensing and Control (ICNSC 07), London, UK, 15–17 April 2007; pp. 519–524. [Google Scholar]
- Zheng, Z.; Zhang, Y.; Lyu, M.R. Investigating QoS of real-world web services. IEEE Trans. Serv. Comput. 2014, 7, 32–39. [Google Scholar] [CrossRef]
- Zheng, Z.; Zhang, Y.; Lyu, M.R. Distributed qos evaluation for real-world web services. In Proceedings of the 2010 IEEE International Conference on Web Services (ICWS), Miami, FL, USA, 5–10 July 2010; pp. 83–90. [Google Scholar]
- Zhang, Y.; Zheng, Z.; Lyu, M.R. Exploring latent features for memory-based QoS prediction in cloud computing. In Proceedings of the 2011 30th IEEE Symposium on Reliable Distributed Systems (SRDS), Madrid, Spain, 4–7 October 2011; pp. 1–10. [Google Scholar]
- Resnick, P.; Iacovou, N.; Suchak, M.; Bergstrom, P.; Riedl, J. GroupLens: An open architecture for collaborative filtering of netnews. In Proceedings of the 1994 ACM Conference on Computer Supported Cooperative Work, Chapel Hill, NC, USA, 22–26 October 1994; pp. 175–186. [Google Scholar]
- Sarwar, B.; Karypis, G.; Konstan, J.; Riedl, J. Item-based collaborative filtering recommendation algorithms. In Proceedings of the 10th ACM International Conference on World Wide Web, Hong Kong, China, 1–5 May 2001; pp. 285–295. [Google Scholar]


| S1 | S2 | S3 | S4 | S5 | |
|---|---|---|---|---|---|
| u1 | 0.334 | 0 | 0.432 | 0 | 0 |
| u2 | 0 | 0.938 | 0 | 0 | 1.321 |
| u3 | 0.206 | 0.304 | 0 | 0 | 0 |
| u4 | 0 | 0 | 0 | 0.468 | 0.541 |
| Matrices | Methods | Matrix Density(MD) | |||||
|---|---|---|---|---|---|---|---|
| 5% | 10% | 15% | 20% | 25% | 30% | ||
| 2.95% Untrustworthy Users | UPCC | 0.9229 | 0.8674 | 0.8670 | 0.8451 | 0.8215 | 0.7917 |
| IPCC | 0.9443 | 0.8875 | 0.8706 | 0.8675 | 0.8425 | 0.8014 | |
| UIPCC | 0.8553 | 0.7887 | 0.7863 | 0.7620 | 0.7364 | 0.7206 | |
| CURA | 0.7745 | 0.6227 | 0.5485 | 0.4882 | 0.4917 | 0.4766 | |
| GUIPCC | 0.8184 | 0.7650 | 0.7469 | 0.7351 | 0.7094 | 0.6805 | |
| TAP | 0.6304 | 0.5889 | 0.6043 | 0.6203 | 0.6168 | 0.6070 | |
| GNMF | 0.6842 | 0.6471 | 0.6079 | 0.5646 | 0.5465 | 0.5128 | |
| GURAP | 0.6455 | 0.5518 | 0.4887 | 0.4798 | 0.4502 | 0.4354 | |
| Improvement vs. TAP (%) | −2.39% | 6.30% | 19.13% | 22.65% | 27.01% | 28.27% | |
| Improvement vs. GNMF (%) | 5.66% | 14.73% | 19.61% | 15.02% | 17.62% | 15.09% | |
| 5.90% Untrustworthy Users | UPCC | 0.9369 | 0.8870 | 0.8790 | 0.8467 | 0.8261 | 0.7987 |
| IPCC | 0.9576 | 0.8903 | 0.8755 | 0.8555 | 0.8478 | 0.8159 | |
| UIPCC | 0.8631 | 0.8022 | 0.7892 | 0.7460 | 0.7485 | 0.7325 | |
| CURA | 0.7883 | 0.6197 | 0.5239 | 0.4891 | 0.4569 | 0.4486 | |
| GUIPCC | 0.8122 | 0.7809 | 0.7571 | 0.7381 | 0.7190 | 0.6984 | |
| TAP | 0.6501 | 0.5725 | 0.5991 | 0.6232 | 0.6275 | 0.6258 | |
| GNMF | 0.6989 | 0.6265 | 0.5998 | 0.5523 | 0.5264 | 0.5025 | |
| GURAP | 0.6573 | 0.5555 | 0.4826 | 0.4665 | 0.4511 | 0.4357 | |
| Improvement vs. TAP (%) | −1.11% | 2.97% | 19.45% | 25.14% | 28.11% | 30.38% | |
| Improvement vs. GNMF (%) | 5.95% | 11.33% | 19.54% | 15.53% | 14.30% | 13.29% | |
| Matrices | Methods | Matrix Density(MD) | |||||
|---|---|---|---|---|---|---|---|
| 5% | 10% | 15% | 20% | 25% | 30% | ||
| 2.95% Untrustworthy Users | UPCC | 2.4882 | 2.2699 | 1.9419 | 1.8698 | 1.8088 | 1.7901 |
| IPCC | 2.5753 | 2.3225 | 2.1973 | 1.931 | 1.8888 | 1.7575 | |
| UIPCC | 2.3637 | 2.0274 | 1.9799 | 1.8419 | 1.7403 | 1.7391 | |
| CURA | 1.88 | 1.7196 | 1.5648 | 1.5471 | 1.4329 | 1.4015 | |
| GUIPCC | 2.3637 | 1.974 | 1.9099 | 1.8119 | 1.7003 | 1.6791 | |
| TAP | 1.6645 | 1.6308 | 1.6446 | 1.6517 | 1.6679 | 1.6851 | |
| GNMF | 2.2754 | 2.0785 | 1.8724 | 1.7029 | 1.6823 | 1.6547 | |
| GURAP | 1.4939 | 1.4329 | 1.3757 | 1.3325 | 1.3269 | 1.2845 | |
| Improvement vs. TAP (%) | 10.25% | 12.14% | 16.35% | 19.33% | 20.44% | 23.77% | |
| Improvement vs. GNMF (%) | 34.34% | 31.06% | 26.53% | 21.75% | 21.13% | 22.37% | |
| 5.90% Untrustworthy Users | UPCC | 2.5332 | 2.3007 | 2.1174 | 1.9267 | 1.8613 | 1.8157 |
| IPCC | 2.6811 | 2.3964 | 2.1436 | 1.9987 | 1.882 | 1.8305 | |
| UIPCC | 2.4767 | 2.2887 | 2.0342 | 1.9264 | 1.8226 | 1.793 | |
| CURA | 1.8871 | 1.7339 | 1.5566 | 1.5582 | 1.4636 | 1.4102 | |
| GUIPCC | 2.4263 | 2.1584 | 1.9342 | 1.8768 | 1.8023 | 1.7734 | |
| TAP | 1.7067 | 1.6521 | 1.6563 | 1.6648 | 1.6858 | 1.6904 | |
| GNMF | 2.333 | 2.0166 | 1.8986 | 1.8069 | 1.7309 | 1.6952 | |
| GURAP | 1.4967 | 1.4459 | 1.3769 | 1.3343 | 1.3246 | 1.2835 | |
| Improvement vs. TAP (%) | 12.30% | 12.48% | 16.87% | 19.85% | 21.43% | 24.07% | |
| Improvement vs. GNMF (%) | 35.85% | 28.30% | 27.48% | 26.15% | 23.47% | 24.29% | |
© 2018 by the authors. Licensee MDPI, Basel, Switzerland. This article is an open access article distributed under the terms and conditions of the Creative Commons Attribution (CC BY) license (http://creativecommons.org/licenses/by/4.0/).
Share and Cite
Kuang, L.; Yu, L.; Huang, L.; Wang, Y.; Ma, P.; Li, C.; Zhu, Y. A Personalized QoS Prediction Approach for CPS Service Recommendation Based on Reputation and Location-Aware Collaborative Filtering. Sensors 2018, 18, 1556. https://0-doi-org.brum.beds.ac.uk/10.3390/s18051556
Kuang L, Yu L, Huang L, Wang Y, Ma P, Li C, Zhu Y. A Personalized QoS Prediction Approach for CPS Service Recommendation Based on Reputation and Location-Aware Collaborative Filtering. Sensors. 2018; 18(5):1556. https://0-doi-org.brum.beds.ac.uk/10.3390/s18051556
Chicago/Turabian StyleKuang, Li, Long Yu, Lan Huang, Yin Wang, Pengju Ma, Chuanbin Li, and Yujia Zhu. 2018. "A Personalized QoS Prediction Approach for CPS Service Recommendation Based on Reputation and Location-Aware Collaborative Filtering" Sensors 18, no. 5: 1556. https://0-doi-org.brum.beds.ac.uk/10.3390/s18051556