Article

Sustainable Land Use Management Needed to Conserve the Dragon’s Blood Tree of Socotra Island, a Vulnerable Endemic Umbrella Species

1
Department of Forest Botany, Dendrology and Geobiocoenology, Mendel University in Brno, Zemědělská 3, 613 00 Brno, Czech Republic
2
Department of Forest Management and Applied Geoinformatics, Mendel University in Brno, Zemědělská 3, 613 00 Brno, Czech Republic
3
Lower Morava Biosphere Reserve, Zámecké náměstí 69, 691 44 Lednice, Czech Republic
4
Department of Plant Biology, Mendel University in Brno, Zemědělská 3, 613 00 Brno, Czech Republic
5
UNEP/GEF Project, Hadibo, Socotra, Republic of Yemen
*
Author to whom correspondence should be addressed.
Sustainability 2019, 11(13), 3557; https://0-doi-org.brum.beds.ac.uk/10.3390/su11133557
Submission received: 13 May 2019 / Revised: 24 June 2019 / Accepted: 26 June 2019 / Published: 28 June 2019
(This article belongs to the Special Issue Sustainable Landscape Management and Planning)

Abstract

:
Unsustainable overgrazing is one of the most important threats to the endemic and endangered population of dragon’s blood tree (Dracaena cinnabari) on Socotra Island (Republic of Yemen). However, there is a lack of information about the exact population size and its conservation status. We estimated the population size of D. cinnabari using remote sensing data. The age structure was inferred using a relationship between crown projection area and the number of branch sections. The conservation importance of each sub-population was assessed using a specially developed index. Finally, the future population development (extinction time) was predicted using population matrices. The total population size estimated consists of 80,134 individuals with sub-populations varying from 14 to 32,196 individuals, with an extinction time ranging from 31 to 564 years. Community forestry controlled by a local certification system is suggested as a sustainable land management approach providing traditional and new benefits and enabling the reforestation of endemic tree species on Socotra Island.

1. Introduction

Socotra Island is the largest island (3600 km2) in the Socotra Archipelago (Figure 1). This archipelago is continental in origin and was separated from Africa during the middle Miocene at about 17 Ma [1], at which time pre-adaptation of the modern lineage of Dracaena to arid environments started [2]. The archipelago is part of the Republic of Yemen, and is located where the Indian Ocean meets the Arabian Sea, in the Gulf of Aden. The climate of Socotra Island is in accord with its occurrence in the arid tropical zone [3], with the island therefore hosting xeromorphic, desert and semi-desert plant communities [4,5,6,7,8]. Long-term separation from the continent has led to a high degree of endemism, with 37% of the almost 850 plant species there being endemic [4,5,9,10]. Due to the unstable political situation in the country, the island is relatively isolated from civilization. For thousands of years, the main source of livelihood for its inhabitants has been raising goats and sheep, and, less frequently, cattle and camels [4].
The dragon’s blood tree, Dracaena cinnabari (Asparagaceae), endemic to Socotra Island and with a distinctive appearance, is widely recognized as a flagship species of that location. It is an exceptional tree belonging to the monocotyledonous plants, and along with several other arborescent species in Dracaena forms the dragon tree group [11]. Crucially, it is a cenozoic relict, with the island’s forests of dragon’s blood trees belonging to one of the oldest ecosystems in the world [4,5,12,13].
D. cinnabari is categorized as “vulnerable” on the Red List of the International Union for Conservation of Nature [14], and its conservation has been recognized as important [15]. In addition to its restricted distribution, ancientness, vulnerable status and distinctive appearance, its conservation is important because of the significant ecological roles that it plays. Rejžek et al. [16] have shown D. cinnabari to be an important nurse plant that facilitates the establishment and growth of different plant species seedlings under and in the vicinity of canopies. With the decline of its populations likely to adversely affect overall plant diversity and the abundance of rare endemic plants, its loss may lead to a homogenization of vegetation. Similarly, García and Vasconcelos [17] described important mutualistic relationships between D. cinnabari and endemic geckos which belong to the pollinators of this species. Fruits of D. cinnabari serve as food for birds, which disseminate the seeds [18]. Furthermore, it can be expected that the occurrence of a wide range of insect species depend on D. cinnabari [19]. Moreover, dragon’s blood stands function as cloud forests, catching water from horizontal precipitation, fog, drizzle and mist [20], and thus are very important to the hydrology of the island. A decreasing dragon’s blood tree population density may cause land aridification and desertification [21], followed by increasing soil erosion (Figure S1). Given its ecological importance, D. cinnabari has been characterized as an umbrella species of Socotra Island, with its conservation essential to conserving the island’s native biota [15,17,20,22,23,24].
Remote sensing provides data for vegetation mapping with lower prices and faster and easier repeatability in comparison with the field-based surveys. Remote sensing can cover wider and inaccessible areas [25] like Socotra. Nevertheless, it has limitations caused by clouds [26] and uses spatial resolution. The use of spaceborne remote sensing data began in the 1970s [27]. The spatial resolution of these satellite images was a limiting factor for studies at a tree level. Since the end of the 1990s, spaceborne remote sensing has provided data with a very high spatial resolution, under 1 m, so that studies of individual trees have become more possible [28]. Attore et al. [22,29], Malatesta et al. [30] and Habrová [31] used advantages of remote sensing data for vegetation mapping on Socotra Island. Attore et al. [22] and Král and Pavliš [32] first used remote sensing data for evaluating of D. cinnabari distribution.
Attore et al. [22] estimated that D. cinnabari now occupies only 5% of its potential habitat on the island. Král and Pavliš [32] found that although the habitats hosting D. cinnabari comprise a total of 7230 ha, these include only 230 ha of forests and 800 ha of mixed mountains forests, with the rest of the area (6200 ha) consisting of woodlands with low tree densities and overmatured populations [15,26]. Dragon’s blood tree population decline has been attributed not only to the ongoing harvesting of the tree’s resin, known since ancient times as dragon’s blood, but also crucially to overgrazing, which makes natural population regeneration impossible [4,5,12,23,24,33,34]. Moreover, the traditional silvopastoral system of using inflorescences, fruits and leaves of D. cinnabari as fodder for livestock in dry times poses an additional threat [4]. Dragon’s blood tree population decline has been predicted to continue without changes to the above-described current pastoral practices and habits of local inhabitants [13,35]. Conservation of the dragon’s blood tree will depend upon implementation of land management practices to protect both natural [24] and artificial [36] seedling regeneration.
The population size and structure of different dragon tree species has been the subject of interest in several studies. Research at a population level is very important in small, fragmented and isolated populations of endemic species, as it is generally in dragon tree species. Such population structures can impose further evolutionary constraints due to low genetic diversity, and it has been predicted that D. cambodiana, as with other long-lived species with a narrow genetic base, will not be able to adapt to new selection pressures brought about by changes in environmental and climate conditions [37]. Fragmentation, isolation and the remoteness of D. cambodiana populations may lead to a decrease in gene flow, while an increase in the probability of divergent natural selection [37], a significant phylogeographic structure and genetic differentiation among populations were detected [38]. The population size was described for D. ombet in Gebel Elba NP [39,40], D. tamaranae on Grand Canaria Island [41], D. draco subsp. draco on Tenerife Island [42], D. kaweesakii in Thailand [43] and D. cambodiana on Hainan Island [37].
Generally, the life cycle of trees can be divided into vegetative (juvenile) and generative (adult) phases. Attorre et al. [22] used more details to divide dragon’s blood tree ontogeny into four stages. Within the juvenile phase, the plant consists of a single leaf rosette without a trunk in the first ontogeny stage, whereas in the second stage the plant has an added trunk. Within the adult phase, the third stage in this classification is represented by a plant with more than one leaf rosette, as well as a crown with a diameter less than 2.5 m, while in the fourth stage the plant has a crown larger than 2.5 m in diameter. More recently, Maděra et al. [36] described four juvenile stages of dragon’s blood tree development and estimated that the juvenile phase lasts between 100 and 200 or more years, and that its end is defined by the onset of first flowering [12]. The lifespan of the adult phase of the dragon’s blood tree has been estimated to be more than 500 years [34]. Due to the longevity of the dragon’s blood tree, which may exceed 700 years, this species isn’t actually threatened by extinction but by overmaturity [13]. However, Habrová et al. [13] have predicted population development only for the next 105 years, they didn´t develop the model finishing by extinction. Thus, the question of how much time we have for effective conservation measures remains unanswered.
The objectives of the present study were to document the abundance of D. cinnabari as accurately as possible using remote sensing and ground data, and to evaluate the conservation importance of its overall population and sub-populations including the modelling of extinction time. These steps are needed to help identify and prioritize sustainable management for this flagship umbrella species, which in turn would advance conservation of the island’s other endemic species associated with it. In our study, we wanted to find answers to the following questions: How large is the population of D. cinnabari on Socotra Island? Which habitats are the most important in terms of occurrence of dragon’s blood trees? Are there any differences in conservation importance among particular sub-populations? Is there a threat of extinction of any sub-populations? How is it possible to conserve D. cinnabari on Socotra Island?

2. Materials and Methods

2.1. Detection of Dragon’s Blood Trees on Socotra Island

Detection of individual trees was carried out using a combination of automatic object-based classification and manual vectorization of remotely sensed data. For this purpose, we used Pleiades 1A satellite images provided by Airbus and the National Centre for Space Studies (CNES) available from Google orthophoto imagery. Analysis was done using ArcGIS (ESRI) and eCognition (Trimble) software.
Object-based classification was conducted in several steps. Distinction between vegetation and bare land was accomplished using analysis of the normalized difference vegetation index (NDVI). Clusters of pixels covered with vegetation were segmented into geometric structures. All circular structures indicative of dragon’s blood tree crowns were identified and distinguished from other circular structures (circular bush or grassland structures) by the presence of sickle-shaped shadows of tree crowns.
The whole dataset was verified and corrected using a process of manual vectorization. The area of the island was segmented into a grid of 1 km2 squares. Each square with dragon’s blood tree presence (588 of 3600 squares) was selected, misclassified trees were deleted and unclassified trees were vectorized. The output polygon vector layer was projected onto a WGS 1984 Web Mercator (auxiliary sphere) coordinate system and the area of the tree crowns was calculated.
In mountain areas covered by an evergreen mosaic of vegetation, individual trees cannot be detected using a remote sensing approach; therefore, all mountainous areas over 1100 m a.s.l. (0.54% of the island’s total area) were excluded from the analysis. Although some dragon’s blood trees occur in mixed forests at these higher elevations, we roughly estimate, based on personal field observation, that they constitute only 2–3% of the island’s entire overall population.
Mis-identification with other species was also considered. Euphorbia arbuscula and Euphorbia socotrana also have the top-view circular crown shape typical of D. cinnabari. E. arbuscular, inhabits the territory below the lowest elevational limits of D. cinnabari, while E. socotrana inhabits high elevations, and such areas (above 1100 m a.s.l.) were excluded from the analytical model. In cases where Euphorbia species occurred in the analyzed territory, they were misidentified as D. cinnabari, but this only happened sporadically, and not in significant numbers (six examples of E. arbuscula were identified inside Dracaena woodland in the Homehill protected area).

2.2. Accuracy of Abundance Estimation

To explore the accuracy of our estimation of the abundance and age-classification of trees based on remote sensing, we compared our results with those produced by the statistical inventory of dragon’s blood tree forest that had been done in the Firmihin area by Adolt et al. [33]. That locality hosts the best-preserved dragon’s blood tree forest and the most abundant population. In that inventory, for a total of 107 randomly generated circle plots 25 m in radius, the coordinates and crown projections of 1930 individual trees were recorded. We spatially overlaid the dataset of remotely detected trees on the inventory dataset to quantify the analytical errors caused by misclassification or by overlapping crown structures invisible in satellite data.

2.3. Growth Characteristics and Age Estimation

To estimate the ages of all remotely detected dragon’s blood trees, we needed to first infer the number of branch orders represented in each tree, which could then be used to estimate age. The number of branch orders was estimated using the relationship between them and the area of crown projection based on field data collected from ~800 trees in the Firmihin dragon’s blood tree forest remnant during a statistical forest inventory [33] as well as a few hundred other trees evaluated over the course of 20 years of field work on the island. Specifically, the relationship between crown area and number of branch orders was calculated using a linear regression model in the R software environment [44]. Crown area was cube-root transformed to linearize the relationship before fitting the linear regression model.
The age of each dragon’s blood tree was then estimated using the methodology of Adolt et al. [34]. The principles of this methodology were formulated by Adolt and Pavliš [12], who also made the first attempt to derive a statistical linear model for crown age prediction. Adolt et al. [34] parametrized this model as a more suitable logistic regression model using mean number of branch orders as the only explanatory variable; the correspondence between crown ages and numbers of branch orders are shown in Table S1.
To improve the clarity of age structure description, the trees inside sub-populations were grouped into ontogenetic developmental stages. Juvenile trees are individuals with only leaf rosette, early adult trees are individuals with 1 to 5 branch orders, adult trees possess 6 to 17 branch orders, late adult trees possess 18 to 24 branch orders and senescent possess more than 25 branch orders.

2.4. Sub-Population Delimitation

Dragon’s blood trees occur typically in small dense groups and occupy plateaus of higher elevations. However, in some areas it is possible to find large sparse groups in a high range of elevations. That is why neighboring distance and altitude were used as explanatory variables to separate the whole population into the groups (sub-populations). Using average nearest neighbor analysis, we obtained an index value for each tree describing its average distance from neighboring trees. We then performed a geographically weighted regression (GWR) to delimitate individual sub-populations using the index of the average distance as the dependent variable and elevation as an independent explanatory variable. The GWR kernel was defined as adaptive to allow variations in tree density in extent as a function. Optimal distance and number of used neighbors were analytically defined using the Akaike information criterion. The spatial context (the Gaussian kernel) was a function of a specified number of neighbors. Where tree distribution was dense, the spatial context was smaller. Where tree distribution was sparse, the spatial context was larger. The area of each distinct sub-population was delineated by the generation of a concave hull over the input point vector layer.

2.5. Modelling of Sub-Population Extinction Times

Population matrices [45] were used for modelling the future development of particular sub-populations. The starting point was zero natural regeneration, which is the current situation. The input data for the model were mortality rate in specific age category (see below), and probability that the tree will stay in a specific age category or move to the next age category if the population becomes older by one year. Specific age category was expressed by the number of branch sections, and probability the tree will stay (PS = (Dn − 1)/Dn) or move (PM = 1/Dn) to the next age category was given by the duration (Dn) of this category (Table S1). The same approach has already been used for modelling the population development of dragon’s blood trees by Habrová et al. [13] and Hubálková [35]. We used a more robust dataset that allowed us to build our model more precisely.
The mortality curve expressing the probability that a tree in a specific age category will die used field data collected in a 200-m-wide transect (Figure 2) across the Firmihin area in 2013. The transect encompassed 100 m on each side of the road leading across the Firmihin area, and for all recently dead trees visible from the road we recorded the number of branch orders. Recently dead trees comprised those that had no signs of decay, thus indicating that they had died within the past year. The field data from those dead trees was then combined with the number and ages of all living trees in the transect, inferred from remotely sensed data using the methods described above (see Section 2.1 and Section 2.3), which enabled estimation of mortality rates (MR) in relation to the number of branch sections (NBS). This was done using the R software environment, by fitting a non-linear model (Equation (1)).
MR = a + b ∗ NBS ∗ exp(c ∗ NBS),
where a, b and c are parameters estimated using the non-linear model.

2.6. Sub-Population Conservation Importance Evaluation

We developed a conservation importance index (CI) to evaluate the conservation importance of each individual sub-population, which was calculated using Equation (2). CI expresses the relative importance of individual sub-populations of D. cinnabari for conservation of this species. CI contains information about the sub-population characteristics that are possible to estimate from remote sensing data. A higher value of CI means greater importance of sub-population for conservation, while a lower value of CI means a higher priority of some conservation measures.
CI = HD + AM + DT + SP + TN,
where HD = habitat degradation index, AM = mean age index, DT = tree density index, SP = sub-population size index and TN = tree number index.
The habitat degradation index was calculated, using Equation (3), as the sum of the products of individual landcover classes’ [32] areas (LCAs) within each sub-population multiplied by the coefficient of naturalness of the landcover class (CN, Table 1). This sum was divided by the total sub-population area (S) so that the maximal value was 1.00. Forests had the highest coefficient, woodland and shrubland had progressively lower values and grasslands had the lowest value. Thus, the coefficient of naturalness expressed the degree of degradation for each habitat relative to the potential vegetation (i.e., forests with occurrence of D. cinnabari) and the HD index described the degree to which the overall area occupied by the sub-population has been degraded.
H D = i = 1 n ( LCA i   C N ) / S ,
We identified the area of individual landcover classes for dragon’s blood tree occurrence by overlaying a landcover map [32] and the trees’ distribution map.
Using Equation (4), the mean age index (AM) was calculated as the ratio of the difference between the highest mean crown age among the sub-populations (Amax) and the mean crown age of the evaluated sub-population (A) to the difference between the highest and lowest (Amin) mean crown ages of sub-populations. The maximum value for AM was 1.00, and high values indicate the evaluated sub-population was relatively young compared with the other sub-populations.
AM = (Amax − A)/(Amax − Amin),
The tree density index (DT) was calculated, as shown in Equation (5), as the mean tree density (D) of the individual sub-population (in terms of trees per ha) divided by 50. Fifty trees per hectare with an average crown area of 20 m2 (this value was estimated from the dataset of field-measured trees) meant coverage of 10%, which is minimal forest cover according to the FAO forest definition. In the theoretical case in which the sub-population mean tree density D reaches 50, the value of the tree density index would be 1.
DT = D/50,
The sub-population size index (Equation (6)) was calculated as the ratio of the size of the evaluated sub-population (S) to the size of the largest sub-population (Smax). SP index expresses the importance of the sub-population area in comparison with the largest sub-population area.
SP = S/Smax,
The tree number index (Equation (7)) was calculated as the proportion of number of trees in the evaluated sub-population (T) to the number of trees in the most abundant sub-population (Tmax). The TN index expresses the importance of sub-population tree numbers in comparison with the tree number of the most abundant sub-population.
TN = T/Tmax,
Theoretically, the value of CI can to range from 0 to 5, with higher values denoting an increasing importance of the sub-population from a conservation point of view; therefore, we expressed the conservation importance index as a relative value from potential (maximal) value CI rel. (Table 4).

3. Results

3.1. Abundance of Dragon’s Blood Tree Population on Socotra Island

A total of 80,134 individual trees were detected using the combination of object-based classification and manual vectorization of remote sensing data in the area of the whole island up to the elevational limit of 1100 m a.s.l. Of these, more than 40% (32,195) were located in the Firmihin area, where dragon’s blood trees occur with the highest density.
The comparison of field inventory and remote sensing data revealed that 18 of the trees identified by remote sensing in the inventory area did not actually exist, with this number representing only 0.9% of the total number of 1930 inventoried trees. The ground-truthing also showed there were 152 trees (7.9% of the 1930 trees actually present) that were not counted in the image analysis based on remote sensing because they were members of pairs of closely occurring trees or because they were smaller trees covered by neighboring crowns. These overcounting and undercounting rates produced by our analysis of remote-sensing images came from the locality with the highest density of trees and with one of the youngest sub-populations, making it very likely to be the area most susceptible to such errors.
Comparison of field and remotely sensed data from the Firmihin location hosting the only remaining Dracaena forest habitat also showed different age structures. Specifically, field data revealed a greater representation of younger trees (by a total of 28% in age classes from 0 to 13 branch sections). This indicates that our results originating from remote sensed data had a tendency to overestimate crown projection. Such large discrepancies in age structure were not found for other habitats—Dracaena woodlands, shrublands and grasslands—where population densities were lower and individual trees were more visible from satellite imagery due to being farther from each other and with bigger crown projection (older).

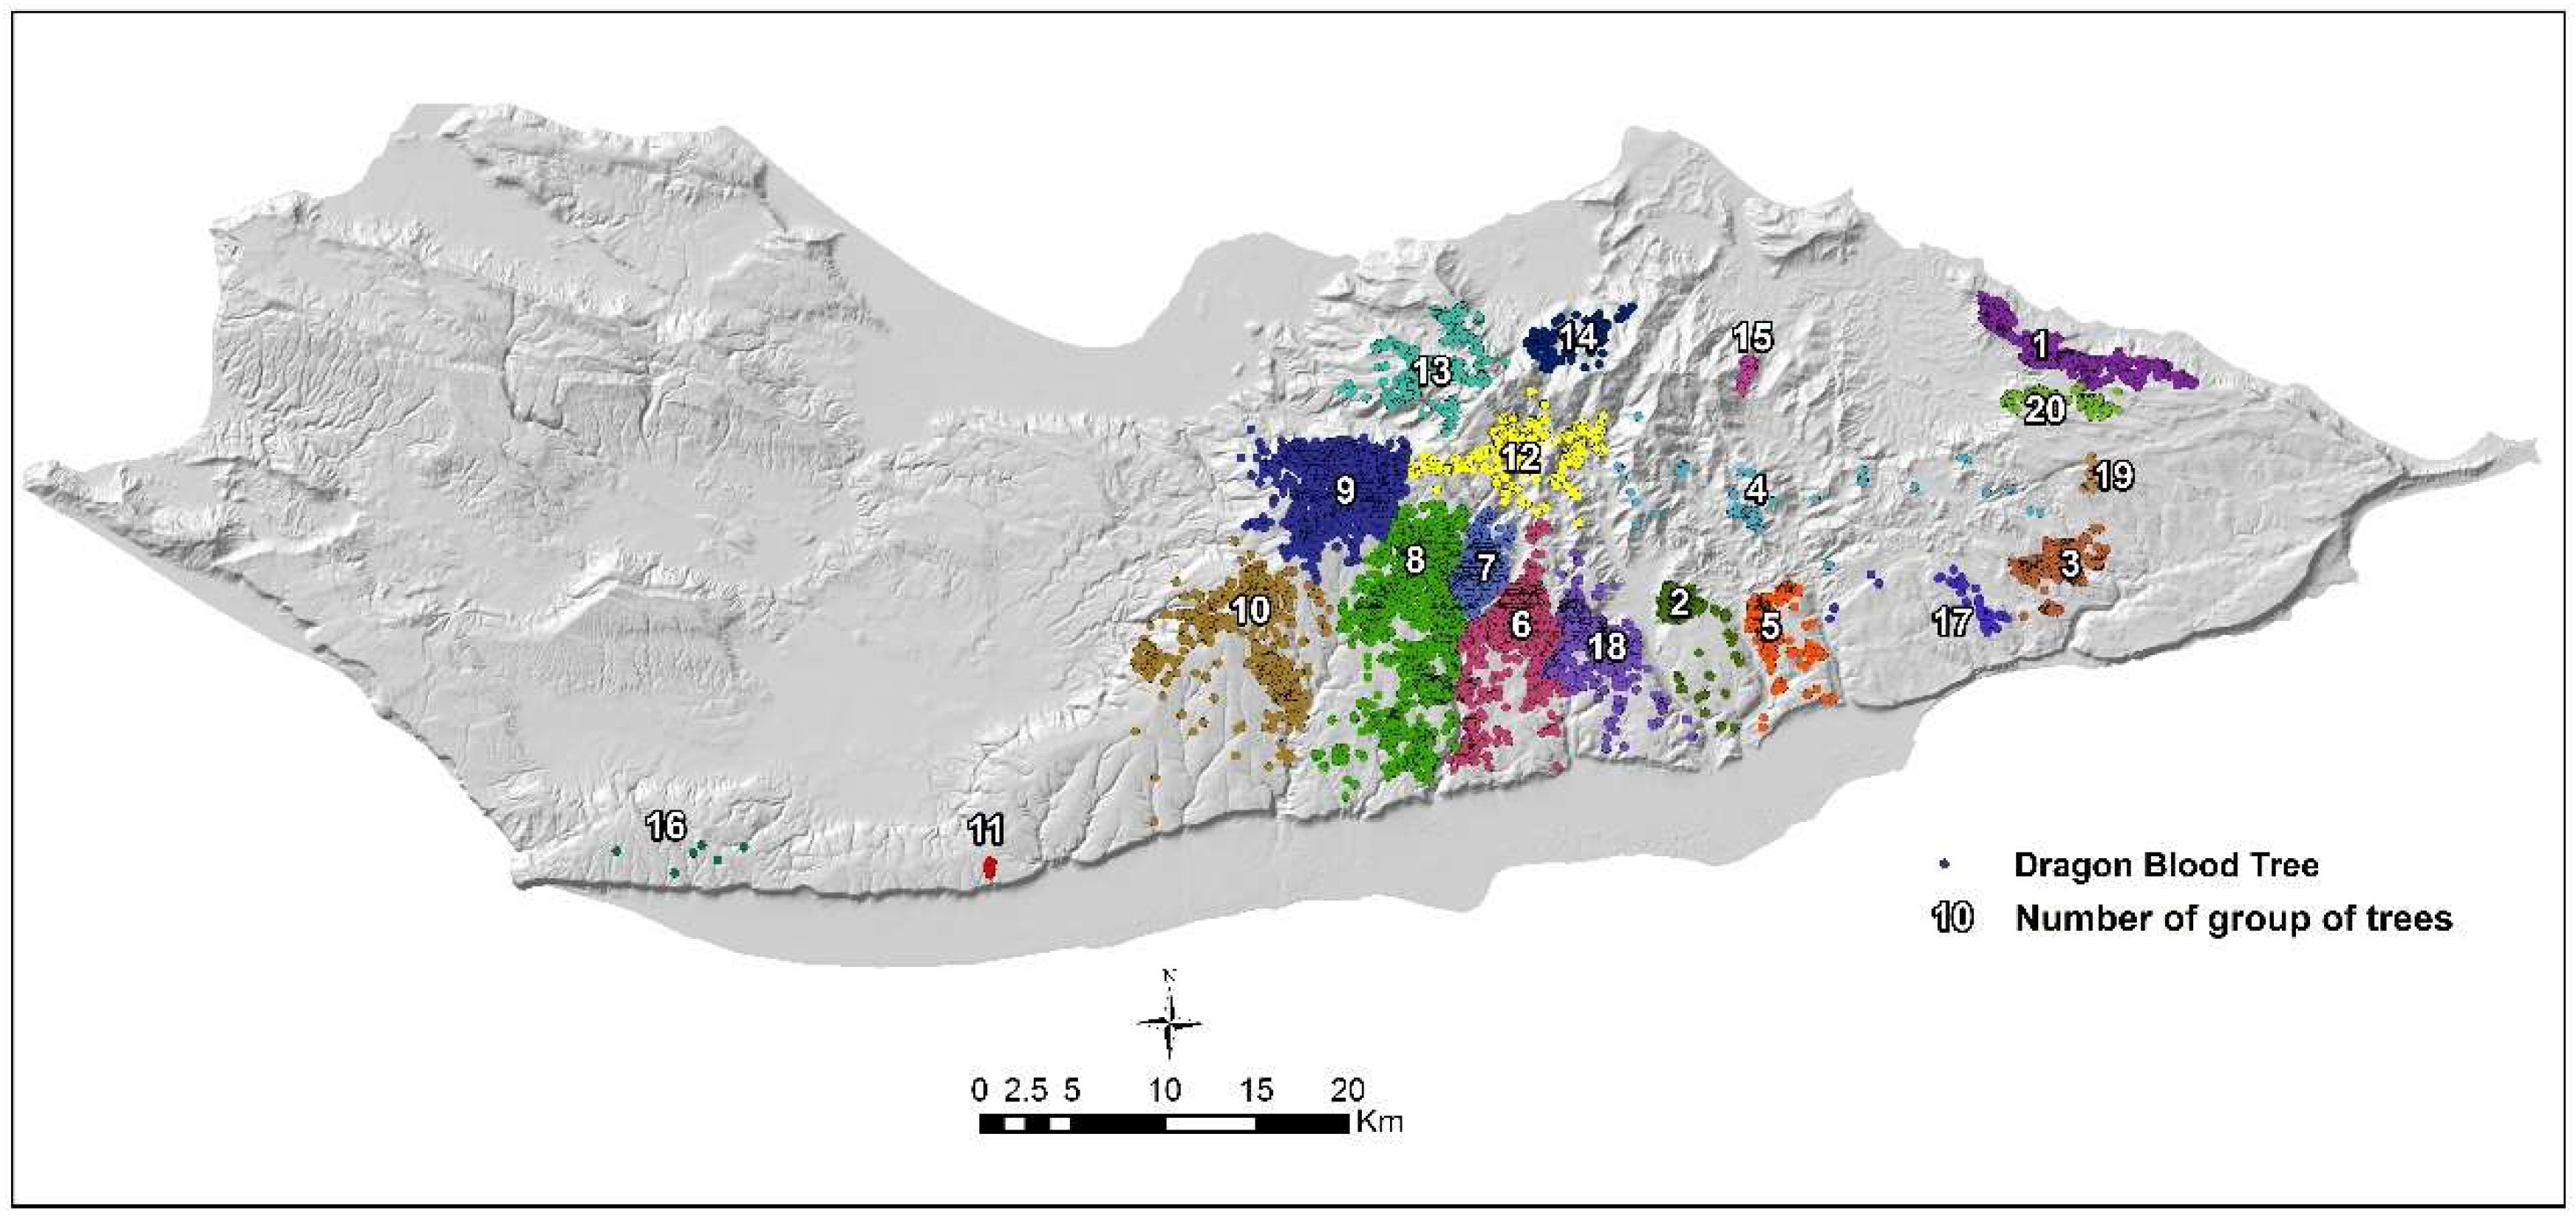
3.2. Spatial Distribution of Dragon’s Blood Tree Population on Socotra Island

The dataset was separated into 20 sub-populations (Table 2, Figure 3) using geographically weighted regression. The most numerous sub-population, in the Firmihin area, consisted of 32,195 individuals. The smallest remnant sub-population, comprising 15 individuals, was found in an isolated enclave of area of tree occurrence in the southwest of the island (No. 16). The total area of occupancy of the focal species was 51,963 ha. The sub-population (No. 10) occupying the largest area occupies 10,408 ha southwest of Dixam and consists of 1252 trees. The smallest area (11 ha) occupied by a sub-population (No. 11) is located south of Dixam and comprises only 22 trees.
The distribution of dragon’s blood trees is mostly in the highlands and mountains of the central and eastern parts of the island. Dragon’s blood trees are missing from the seaside plains and lowlands (below 180 m a.s.l.), and their absence from the western part of the island is very conspicuous.
The highest densities of dragon’s blood trees were found in the Dracaena forests, Dracaena woodlands and limestone rocks; the highest numbers of dragon’s blood trees were recorded in Dracaena woodlands, submontane grasslands, Dracaena forests and submontane shrublands (Table 3). Dracaena forests and woodlands hosted more than 50% of the population on 10% of the area of the dragon’s blood tree distribution. Woodlands, grasslands and shrublands with occurrence of dragon’s blood trees were degraded habitats originating from Dracaena forests.

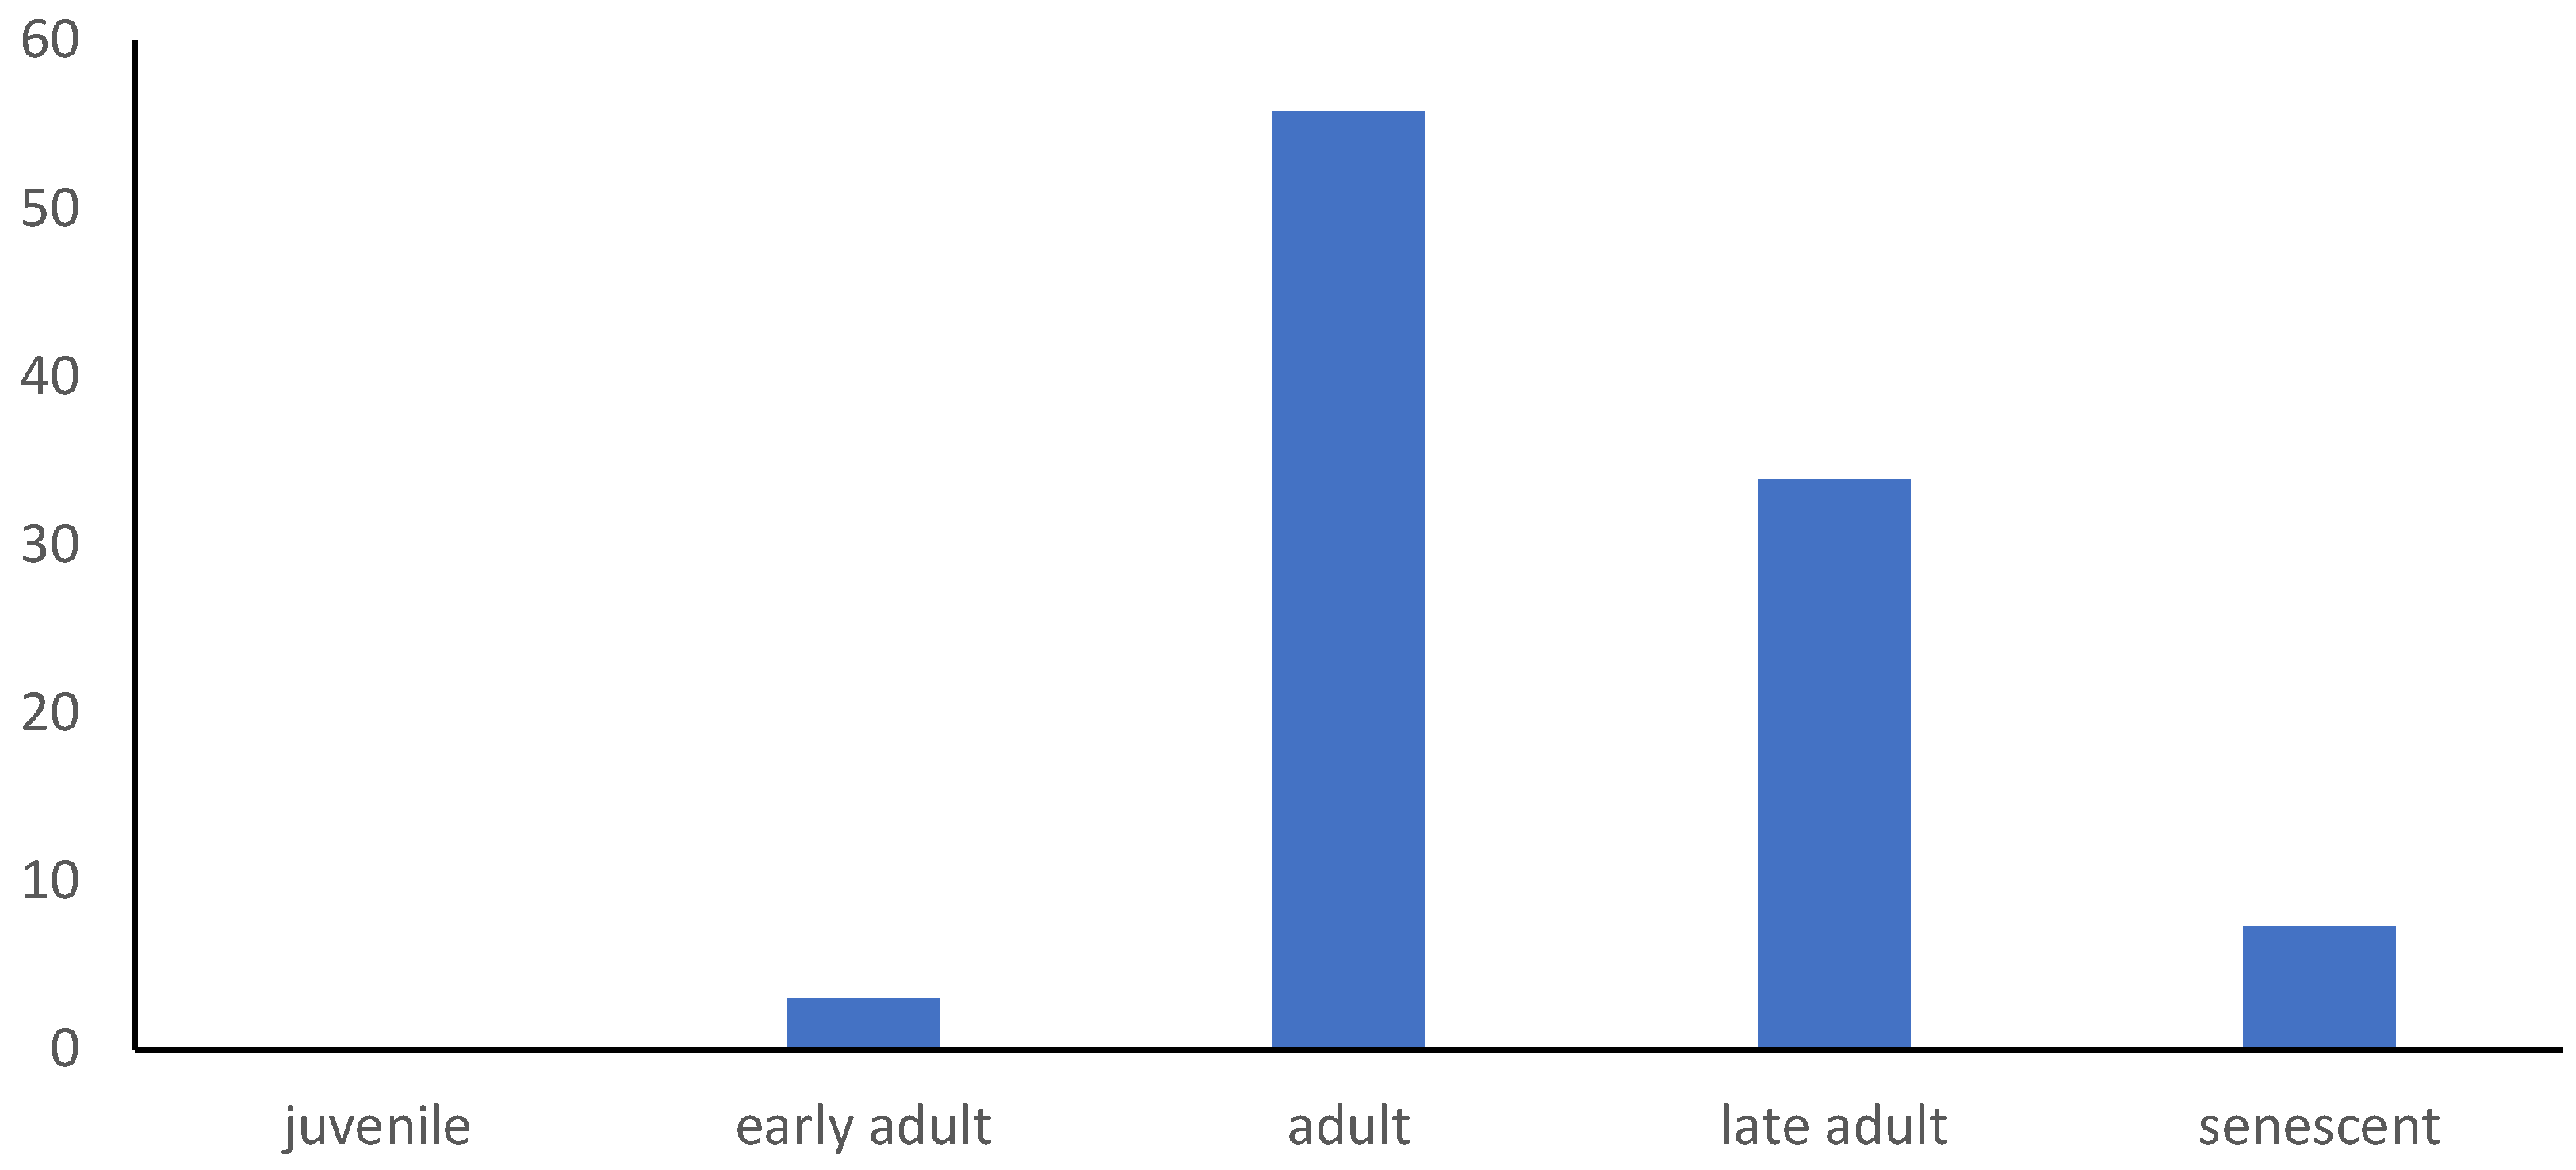
3.3. Age Structure of Dracaena cinnabari Population on Socotra Island

To infer the crown age of dragon’s blood trees identified from satellite imagery, we need to know the relationship between crown projection area and number of branch sections (Figure 4). Using this relationship, we estimated the crown age of all detected trees in all sub-populations according to Adolt et al. [34] and counted the mean crown age for each sub-population (Table 4). The youngest sub-population had a mean crown age of 200 years and the oldest a mean of 466 years.
The age structures of the whole population on Socotra Island and individual sub-populations are shown in Figure 5 and Table 4. Figure 5 clearly depicts the over-maturity of the dragon’s blood tree population, as there is a visibly low representation of young age classes, especially juvenile trees with only a top rosette, as defined by Madera et al. [36]. Even though Table 4 clearly shows differences among individual sub-populations, juvenile and early adult ontogenetic stages are insufficient among all sub-populations.

3.4. Prediction of Dragon’s Blood Tree Extinction

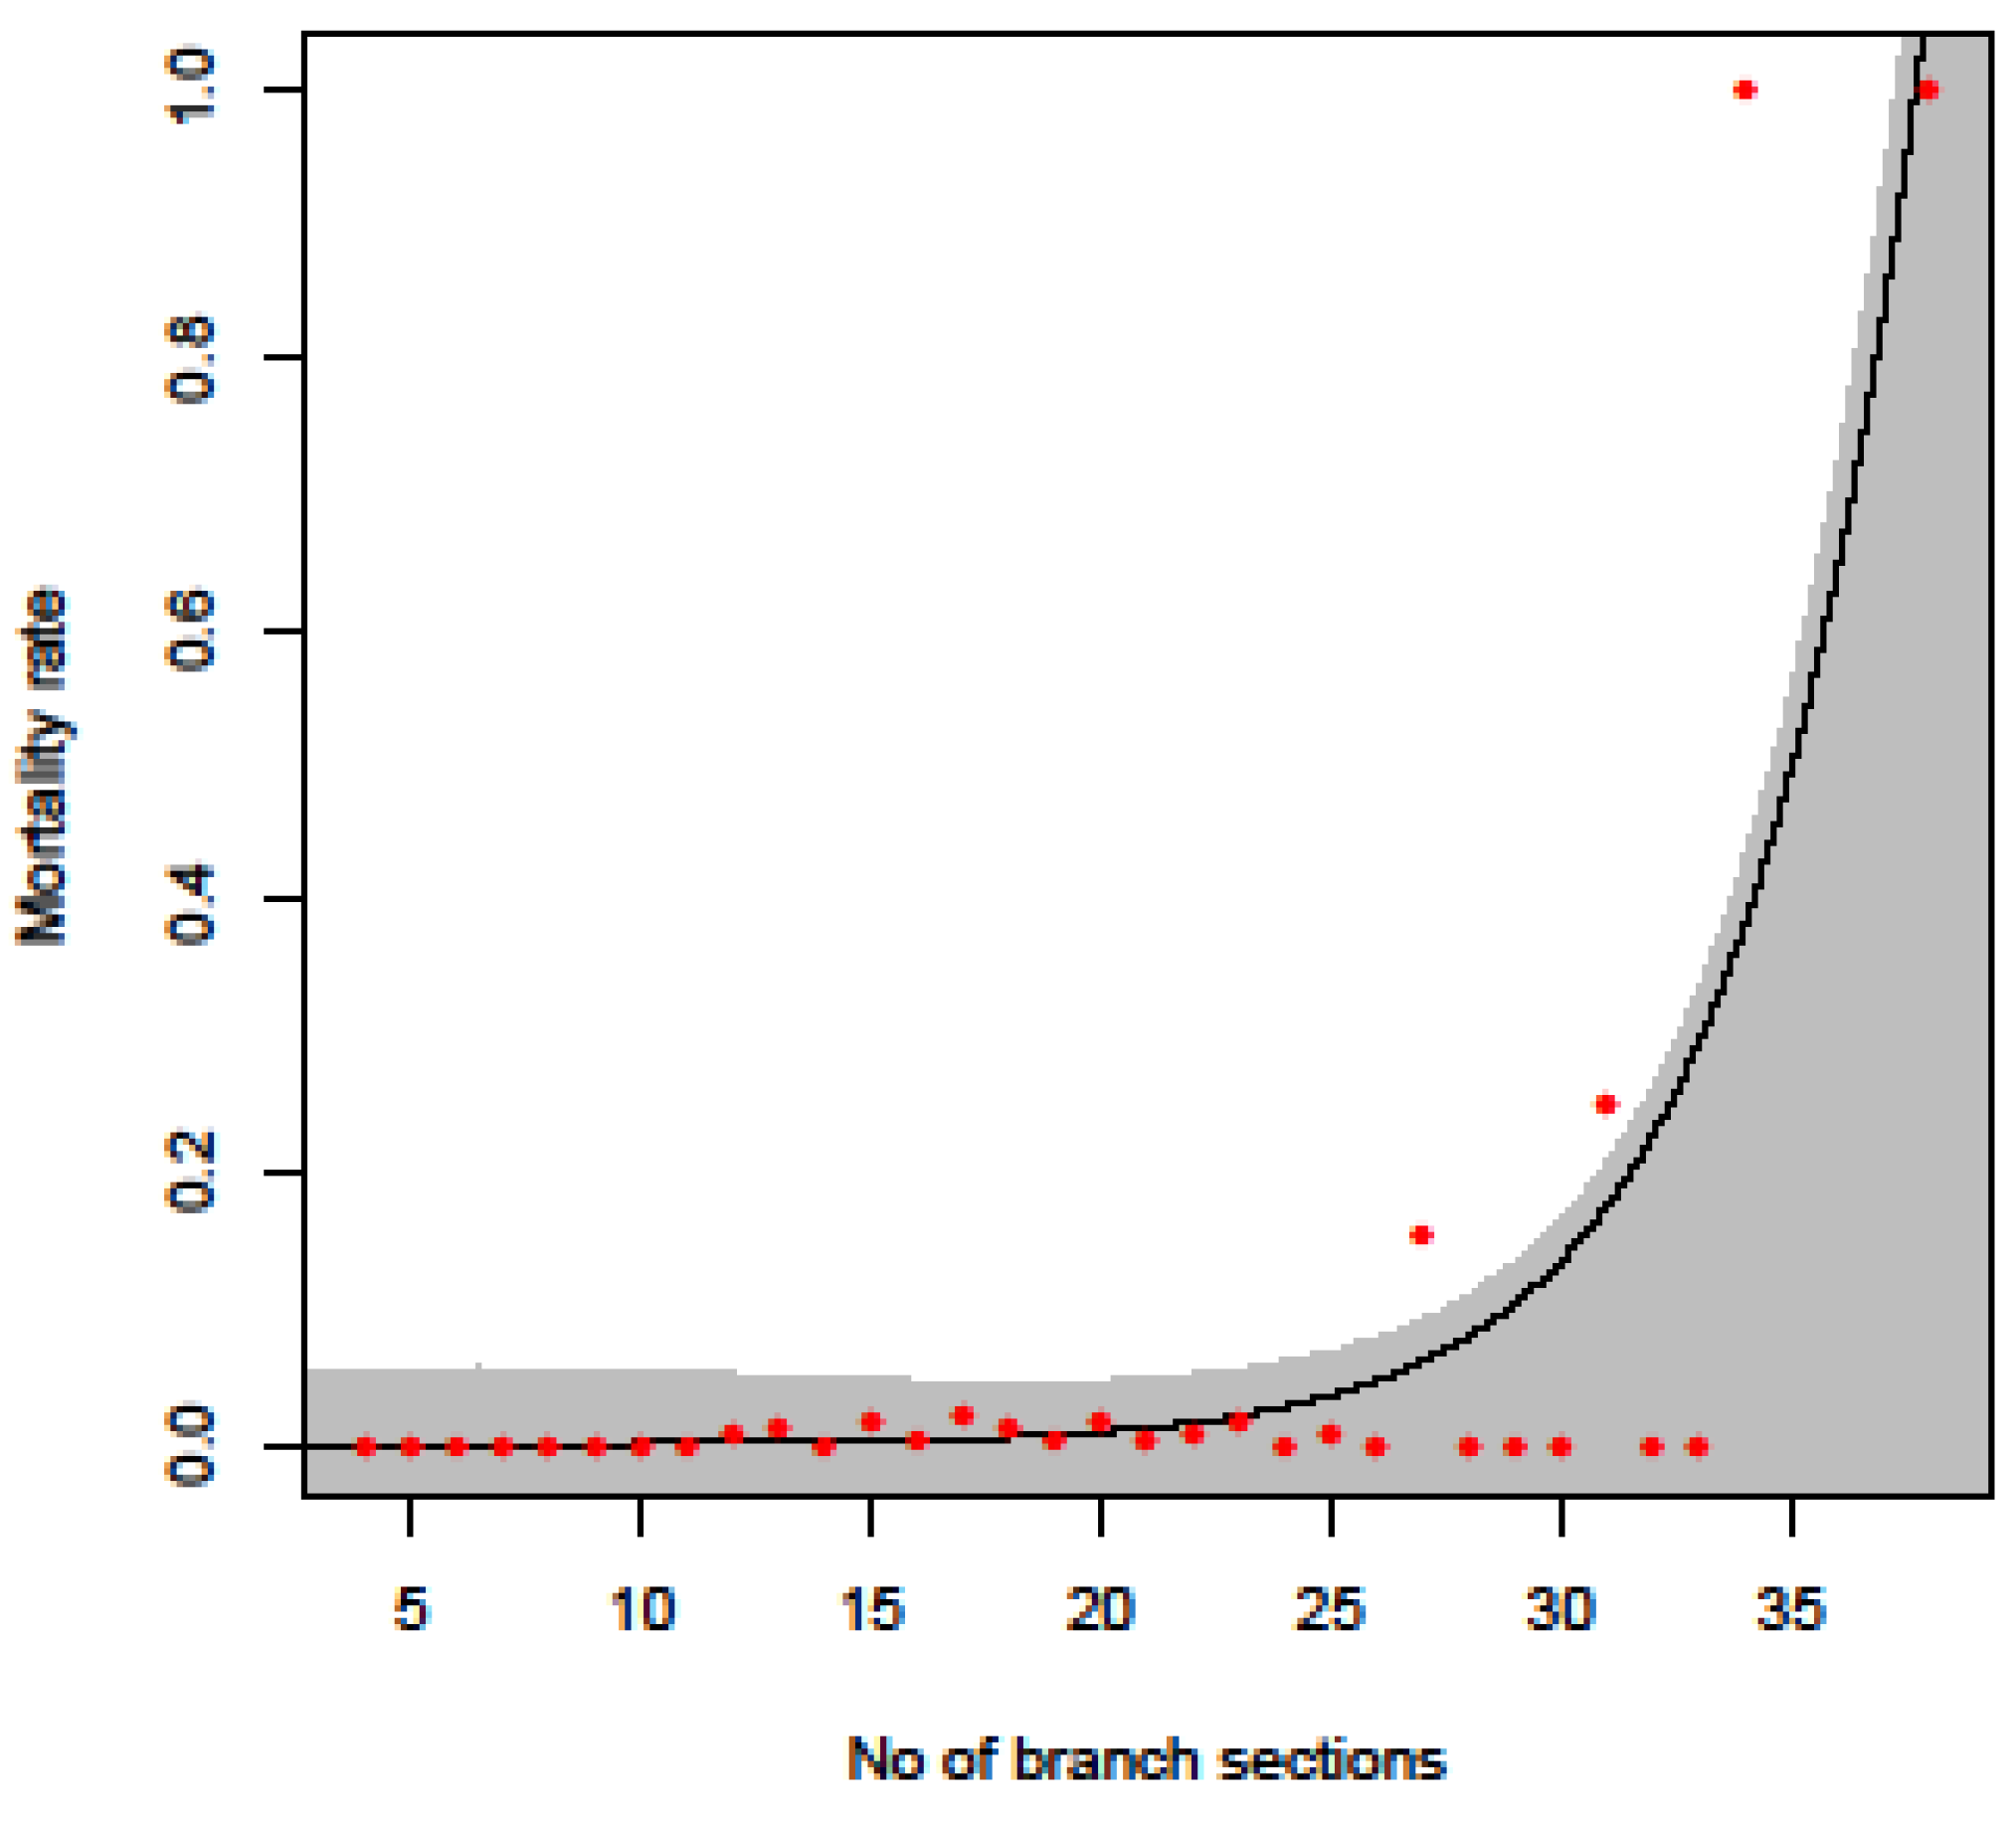
3.4.1. Mortality Curve

In total, within the belt described above (Figure 2), 3805 living and 33 dead trees were detected, which means the mean mortality rate was very low (less than 1% per year). The mortality curve (Figure 6) shows that tree mortality is near zero until the tree crown reaches the age of 400 years (expressed by having 20 branch sections) and substantially increases after the tree crown reaches the age of 450 years (expressed by having 25 branch sections).

3.4.2. Extinction Time of Dragon’s Blood Tree Sub-Populations

The estimated extinction times of individual sub-populations are shown in Table 4. The extinction time varied from 31 to 564 years. The most endangered are sub-populations with a high mean crown age and low numbers of trees. Due to the dragon’s blood tree being a long-lived organism, there are only a small number of sub-populations with short predicted extinction times, including only one under 100 years (No. 16) and only three under 200 years (Nos. 11, 17 and 19). These sub-populations are the most vulnerable to the local extinction. The sub-population matrices are shown in Table S2, with a visualization of sub-population extinction in Video S1.

3.5. The Conservation Importance of the Dragon’s Blood Tree Sub-Populations on Socotra Island

From a conservation status point of view (Table 5), sub-population 7 (Firmihin) is the most important (CI rel ˃ 50%), and although it occupies only 2% of the dragon’s blood tree occurrence area, it hosts more than 40% of the species’ trees. Sub-populations 4, 6, 8, 9, 10, 12 and 13 are characterized by a CI rel greater than 30% but less than 40%, with their conservation importance thus average, together covering nearly 73% of the dragon’s blood tree area of occurrence and hosting 38% of the trees. Sub-populations 1, 2, 3, 5 14 and 18 have relatively lower conservation importance (CI rel greater than 20%, but less than 30%), and altogether comprise 21% of the species’ distribution area and host 20% of its trees. The conservation importance of sub-populations 11, 15, 17, 19 and 20 is relatively very low (CI rel greater than 10% but less than 20%), comprising 3% of the dragon’s blood tree occurrence area while harboring 1% of the trees. Sub-population 16 had the lowest conservation importance index value (CI rel under 10%) and comprises only a negligible number of trees. However, this sub-population, as it represents the most western ridge of the species’ occurrence, is nevertheless very important to demonstrating the former distribution of dragon’s blood trees in the whole central highlands.

3.6. Sustainable Land Management Measures to Conserve Dragon’s Blood Tree Population

We found sub-population 7 (Firmihin) to be the most important from a nature conservation perspective. Thus, we selected this sub-population as a pilot area where we incorporated components of sustainable forest management into the currently practiced traditional community silvo-pastoral system (Supplement S1). There were 153 inhabitants in 4 villages within the Firmihin pilot area (size 778.9 ha), who kept 1168 goats, 217 sheep, 137 cows, 2 donkeys, 6 camels and 14 beehives. The livestock density was approximately 2 animals per ha.
We prepared a concept for a certified sustainable community forestry system, which we implemented using a farmer field school [46]. In the pilot area, we established:
  • a forest nursery to produce tree seedlings from local tree species populations;
  • a trial demonstration focused on the presentation of the advantages of rotational pastures;
  • a trial demonstration focused on reforestation using artificial regeneration (Figure S1);
  • a trial agro-forestry demonstration focused on dragon’s blood tree natural regeneration together with Aloe perryi plantation.
Local certified community forestry is based on an implementation of forest regeneration into the traditional rules of silvo-pastoral land use (Supplement S1). The local certification authority (the newly established Forests office within the Agriculture office) will control compliance with sustainable community forestry rules.
Within the farmer field school, training sessions are organized for local inhabitants on how to make products with added value from aloe juice, dragon’s blood, myrrh and frankincense, local herbs and honey, and also on how to set up value chains with these products to bring higher benefits from agricultural and forestry lands.

4. Discussion

4.1. Conservation Status

As noted above, the dragon’s blood tree is categorized in the IUCN Red List [14] as a vulnerable species. Our results confirm this evaluation. Extent of occurrence (EOO) was measured as 77,239 ha and area of occupancy (AOO) as 51,963 ha, which substantially differ from the area of landcover classes with occurrence of dragon’s blood trees estimated by Král and Pavliš [32]. Král and Pavliš [32] mentioned occurrences of dragon’s blood trees only in three landcover classes—Dracaena forests, Dracaena woodlands and mixed mountain forests, altogether totaling an area a little bit over 7000 ha. However, we also distinguished also different types of shrublands and grasslands with sparse occurrences of dragon’s blood trees, which is why the recently estimated dragon’s blood tree area of occupancy is seven times greater than the area reported by Král and Pavliš [32].
The overall population was relatively abundant, with more than 80,000 individuals counted, and an extinction time estimated to be centuries due to the longevity of this species [34], which is in agreement with the results of Hubálková [35]. The threat lies especially in the absence of natural regeneration [4,5,12,23,24,33,34], which has likely lasted for more than a hundred years [33]. Thus, the population has an unbalanced age structure [12,15,33]; according to our results, more than half of the trees were adult, with more than one-third belonging to the late-adult ontogenetic stage, and 7% of trees being senescent. Only 3% of trees belonged to the early adult ontogenetic stage. Juvenile trees almost do not occur, as confirmed by our field observations.
There is a close correlation (y = 0.4439e^0,0026x; R2 = 0.7903) comparing the conservation importance index and extinction time of sub-populations of dragon’s blood trees, which confirms the correctness of our approach in assessing the importance of sub-populations from a nature conservation point of view using the available data.

4.2. Driving Forces of Dragon’s Blood Tree Population Decline

Societal changes, improved medical care and better nutrition security caused a permanent increase in the inhabitant population on Socotra after World War II. Increased inhabitant population is directly connected to the growth of livestock abundance. While at the beginning of 1950s the number of goats and sheep was estimated at 19,000 and 26,000, respectively, estimates indicate there were 220,000 livestock in 1999 [47].
Several decades of overgrazing in all habitats with dragon’s blood tree occurrence has led to their gradual degradation. Over half of the trees are located in more or less degraded habitats on most of area of occupancy, and Dracaena woodlands, shrublands and grasslands contain three-quarters of the trees. Král and Pavliš [32] characterized only 230 ha as Dracaena forest, meaning that less than 0.5% of area of occupancy hosts one-quarter of the trees. However, current dragon’s blood tree distribution is only a fragment of its previous occurrence. Attorre et al. [22] estimated that dragon’s blood trees now occupy only 5% of its potential habitat on the island, as defined in terms of moisture index, mean annual temperature and slope. However, their model used very sparse climatological data and did not use any data regarding the occurrence of orographic (horizontal) precipitation at all, which is very important for the growth of dragon’s blood trees [4,18].
Such a huge contraction of dragon’s blood tree distribution cannot be explained only by overgrazing. All ethnobotanical uses performed without the local inhabitants ensuring the regeneration of dragon’s blood trees have contributed to the population decline, including: dragon’s blood harvesting (which has been practiced for thousands of years [4,48]); cutting of inflorescences, infructescences and leaves as fodder for livestock [4]; making beehives from stems [49,50]; and winding cordage from leaf veins [4]. These practices have continued in continental populations of dragon trees (D. ombet, D. serrulata) until today. In particular, cutting of branches, leaves and infructescences as a fodder for camels has accelerated population decline, as sparse studies prove [39,40,50]. Such direct damage, accompanied by overgrazing, can lead to local population extinction. Local rules on Socotra don’t allow cutting whole branches of dragon’s blood trees (cuttings of single leaves as a fodder is allowed only in the dry season—see Supplement S1). This could be the reason why dragon’s blood trees on Socotra are not damaged to the degree of similar continental species.
The above-described long-term unsustainable management practices of dragon’s blood tree populations, some of which persist to this day, can be intensified by current environmental developmental changes. Global climate changes [22] or long-term climate oscillations [51] can contribute to direct (disturbance by cyclones) and indirect (increasing drought) negative impacts on dragon’s blood tree populations.
Progressive decline of dragon’s blood tree forests and woodlands that function as “cloud forests” may cause land aridification and desertification [21], followed by increasing soil erosion and loss of land productivity. Decreasing pasture productivity and increasing numbers of livestock intensify the impact of grazing on remnant vegetation, including tree regeneration, except for poisonous species. Although local herders claim that a large amount of fodder from dragon’s blood trees cause scour in goats (and so can only be fed in very small quantities [4]), a recent author’s observation confirms the increasing resistance of goats to this feed. Moreover, because juvenile trees are slow-growing, it can take at least 50 years [36] for plants to escape the “browsing zone”, making them particularly susceptible to consumption by herbivorous mammals [36]. Every unprotected seedling is immediately grazed [24], along with leaves from broken mature trees. Therefore, any reforestation efforts must be accompanied by sufficient, substantial fencing over a long time [36].

4.3. Extinction Model for the Dragon’s Blood Tree

Population viability analysis is a collection of methods for evaluating the threats faced by populations of species, their risks of extinction or decline and their chances for recovery, based on species-specific data and models [52]. Thus, each model is individually based [53]. Our extinction model for dragon’s blood trees belongs to the stage-based population models, which are used advantageously just for tree populations [54]. For example, such models were developed for threatened tree species Taxus baccata [55], Fraxinus pennsylvanica [53] and Swietenia macrophylla [56]. The dragon’s blood tree’s extinction model is unique because individual stages have been expressed by the number of branch sections that are directly correlated with the age of the tree [12,34].
The survival probability of individual development stages as one of the important inputs for modelling is shown in mortality curve (Figure 6). This curve comprises all factors that affect the mortality of a studied species at a normal level without having to specifically detect them. The mortality rate of individual development stages is a crucial input in population extinction models and has the largest influence on resulting extinction time. Hubálková [35] used a less-robust dataset for the mortality rate of the dragon’s blood tree, and the mortality rate of older development stages was under-evaluated; thus, old trees were cumulated in the published model. In this sense our model could be closer to reality, because we investigated the mortality rate in transect with 3838 trees. Our model doesn’t include the influence of catastrophic disturbances, such as the two cyclones in November 2015. Such events (that could repeat more often with global climate changes) bring uncertainty to our extinction model.
Habrová et al. [13] retrospectively evaluated the decline of small populations on Skant mountain, directly comparing two photographs taken from the same place (one from 1899 and second from 2004). They found decline in the number of dragon’s blood trees by 44.22% from 199 trees in the original 1899 photograph to only 111 individuals in 2004. Also, the absence of trees from younger age classes was evident in the 2004 photo. The recorded decline of more than 40% during 105 years is very similar to that indicated by our model.

4.4. Suggestions for Sustainable Land Management Measures

There is clear evidence that there was a highly organized agricultural land use system on Socotra in the past, as a high density of wall systems around the island not only served various functions for agricultural production and management of incense, dragon’s blood and aloes, but were also used in water and soil management [57]. Recently, this system has unfortunately completely been forgotten, and free grazing is now practiced on the whole island. Not only the dragon’s blood tree, but also many other endemic trees including Boswellia spp. [58,59], Commiphora spp. [60] and others [4] are strongly endangered. Unfortunately, strict conservation of selected valuable areas, as the Socotra Archipelago Master Plan supposed in 2002, are now not feasible on Socotra due to the weak governmental administration and a complicated land tenure system based on tribal organization of society.
To save the island’s biodiversity, we have to find any land management measure enabling tree regeneration that will be acceptable by local inhabitants because it brings them new benefits. One approach that is already proven on Socotra but not very efficient is planting home gardens [61], where, besides vegetable and fruit species, the local people plant native species for medical use, as fodder or for shade. Thus, during 20 years of Czech developmental aid, the establishment of 320 home gardens have been supported and more than 10,000 native trees have been planted [62]. This solution is very expensive in terms of costs per tree, and insufficient in terms of the number of planted trees, but has huge educational significance.
Reforestation activities are very rare and small-scale on Socotra [36]. They are also mostly without success, as the tree species on Socotra are slow-growing, and grazing animals need to be excluded for many years, typically exceeding the lifetime of any given fence. Attacks from goats often break fences when they see green vegetation inside during the dry season.
A community forestry approach [63], including a return to careful land use planning, rotational pasturing along with a wall system and exclusion of particularly valuable parts of forests and woodlands from pasture land, could achieve regeneration of degraded forest. Such an approach is very much connected to the following three objectives: (1) alleviating poverty of forest users; (2) empowering them; and (3) improving the condition of the forests [64]. All these objectives are needed to be attained on Socotra, which would again bring benefits from traditional non-timber forest products (such as incense, dragon’s blood, honey, aloe juice) to local communities, compensating for pasture area reduction. To achieve success in community forestry, it is necessary to take into account the main socio-economic success factors [65] and establish the appropriate rules of natural resource management and use, as well as evaluation indicators [50]. Some forest certification systems provide opportunities to implement such management rules and evaluation indicators [66] that enable the sale of non-timber products at fair prices, and allow part of these profits to return to forest regeneration and biodiversity conservation [67].
Finally, it should be noted that Dracaena serrulata (Arabian peninsula) and D. ombet (northeast Africa, Arabian peninsula), also in the dragon tree group, are listed on the IUCN Red List as endangered [14], and also face threats from grazing [39,50,68,69]. These species may therefore benefit from similar conservation approaches to those we propose here.
Among other members of the dragon tree group [11] only sporadic efforts for practical conservation measures are known. Wild populations of critically endangered D. tamaranae count only 76 individuals from which only five generate fruits; 2900 seeds were collected and 350 seedlings were replanted, while others were sent to different botanical gardens [70]. Trials with the replantation of adult trees of D. serrulata endangered by road construction were carried out in Oman with 54% mortality after one year [71].

5. Conclusions

The dragon’s blood tree population on Socotra Island has suffered from a lack of natural regeneration due to direct and indirect human influences for decades and maybe centuries. The result is a creeping population decline consisting of increasing mean population age and senescent trees gradually dying without recruitment of young seedlings. Thus, the population is thinning from forests to woodlands, shrublands and eventually grasslands with individual sparse trees. The final stage of this decline is eroded treeless land used by local herders as low productivity pasture.
We found the six sub-populations (Nos. 11, 15, 16, 17, 19 and 20) with very low conservation importance indices, low numbers of trees, low tree densities and relatively high threats of local extinction, and thus with a high priority on conservation measures. On the other hand, seven sub-populations (Nos. 4, 6, 8, 9, 10, 12, 13) were defined as very important source sub-populations with high numbers of trees, high tree densities and low probabilities of local extinction. In these sub-populations it is very important to induce sustainable land management practices enabling tree regeneration.
According to our models, there is no danger of imminent extinction of endemic dragon’s blood trees, but the long-term future of this species is not hopeful without changing the current, unsustainable livestock management approach. Implementing sustainable land management, especially regarding the grazing system, is necessary to save the dragon’s blood tree and other endangered endemic tree species on Socotra Island.

Supplementary Materials

The following are available online at https://0-www-mdpi-com.brum.beds.ac.uk/2071-1050/11/13/3557/s1, Figure S1: Population decline and artificial reforestation; Table S1: Crown age estimation for D. cinnabari using fit model for Firmihin locality; Table S2: Future sub-population development models, Video S1: Visualization of sub-populations extinction, Supplement S1: Description of Firmihin pilot area.

Author Contributions

Conceptualization, P.M. and P.V.; methodology, P.M. and P.V.; literature review, H.K. and P.M.; data curation, P.M., Z.P., J.D., P.V., H.K., M.R., S.L., D.J., P.H., A.S.A., J.V. and D.V.; writing—original draft preparation, P.M., P.V., D.V., M.R. and H.K.; map creation, P.V.; project administration, H.K.

Funding

This research was funded by the Internal Grant Agency of the Faculty of Forestry and Wood Technology, Mendel University in Brno (grant numbers LDF_VP_2017012 and LDF_VT_2017009), and by UNEP-GEF (grant number 5347).

Conflicts of Interest

The authors declare no conflict of interest. The funders had no role in the design of the study; in the collection, analyses, or interpretation of data; in the writing of the manuscript, or in the decision to publish the results.

References

  1. Culek, M. Geological and morphological evolution of the Socotra archipelago (Yemen) from the biogeographical view. J. Landsc. Ecol. 2013, 6, 84–108. [Google Scholar] [CrossRef]
  2. Denk, T.; Güner, H.T.; Grimm, G.W. From mesic to arid: Leaf epidermal features suggest preadaptation in Miocene dragon trees (Dracaena). Rev. Paleobotany Palynol. 2014, 200, 211–228. [Google Scholar] [CrossRef]
  3. Scholte, P.; De Geest, P. The climate of Socotra Island (Yemen). A first-time assessment of the timing of the monsoon wind reversal and its influence on precipitation and vegetation patterns. J. Arid Environ. 2010, 74, 1507–1515. [Google Scholar] [CrossRef]
  4. Miller, A.G.; Morris, M.; Diccon, A.; Atkinson, R. Ethnoflora of the Soqotra Archipelago, 1st ed.; Royal Botanic Garden: Edinburgh, UK, 2004; p. 759. [Google Scholar]
  5. Brown, G.; Mies, B.A. Vegetation Ecology of Socotra, 1st ed.; Plant and Vegetation 7; Springer: Dordrecht, The Netherlands; Heidelberg, Germany; New York, NY, USA; London, UK, 2012; p. 379. [Google Scholar]
  6. De Sanctis, M.; Adeeb, A.; Farcomeni, A.; Patriarca, C.; Saed, A.; Attorre, F. Classification and distribution patterns of plant communities on Socotra Island, Yemen. Appl. Veg. Sci. 2013, 16, 148–165. [Google Scholar] [CrossRef]
  7. Habrová, H.; Buček, A. Overview of biotope types of Socotra island. J. Landsc. Ecol. 2013, 6, 60–83. [Google Scholar] [CrossRef]
  8. Kürschner, H.; Hein, P.; Kilian, N.; Hubaishan, M.A. Diversity and zonation of the forests and woodlands of the mountains of northern Socotra, Yemen. Englera 2006, 28, 11–55. [Google Scholar] [CrossRef]
  9. Kilian, N.; Hein, P. New and noteworthy records for the vascular plant flora of Socotra Island, Yemen. Englera 2006, 28, 57–77. [Google Scholar] [CrossRef]
  10. Řepka, R.; Maděra, P.; Čermák, M.; Forrest, A. Carex socotrana, a New Endemic Species from Socotra Island. Novon 2017, 25, 467–472. [Google Scholar] [CrossRef]
  11. Marrero, A.; Almeida, S.R.; Martín-González, M. A new species of the wild Dragon Tree, Dracaena (Dracaenaceae) from Gran Canaria and its taxonomic and biogeographic Implications. Bot. J. Linn. Soc. 1998, 128, 291–314. [Google Scholar]
  12. Adolt, R.; Pavliš, J. Age structure and growth of Dracaena cinnabari populations on Socotra. Trees—Struct. Funct. 2004, 18, 43–53. [Google Scholar] [CrossRef]
  13. Habrová, H.; Čermák, Z.; Pavliš, J. Dragon’s blood tree—Threatened by overmaturity, not by extinction: Dynamics of a Dracaena cinnabari woodland in the mountains of Soqotra. Biol. Conserv. 2009, 142, 772–778. [Google Scholar] [CrossRef]
  14. IUCN. IUCN Red List of Threatened Species. Version 2017.2. Available online: htttp://www.iucnredlist.org (accessed on 25 October 2017).
  15. Van Damme, K.; Banfield, L. Past and present human impacts on the biodiversity of Socotra Island (Yemen): Implications for future conservation. Zool. Middle East 2011, 54, 31–88. [Google Scholar] [CrossRef]
  16. Rejžek, M.; Svátek, M.; Šebesta, J.; Adolt, R.; Maděra, P.; Matula, R. Loss of a single tree species will lead to an overall decline in plant diversity: Effect of Dracaena cinnabari Balf. f. on the vegetation of Socotra Island. Biol. Conserv. 2016, 196, 165–172. [Google Scholar] [CrossRef]
  17. García, C.; Vasconcelos, R. The beauty and the beast: Endemic mutualistic interactions promote community-based conservation on Socotra Island (Yemen). J. Nat. Conserv. 2017, 35, 20–23. [Google Scholar] [CrossRef]
  18. González-Castro, A.; Pérez-Pérez, D.; Romero, J.; Nogales, M. Unraveling the Seed Dispersal System of an Insular “Ghost” Dragon Tree (Dracaena draco) in the Wild. Front. Ecol. Evol. 2019, 7, 39. [Google Scholar] [CrossRef]
  19. Batelka, J. Socotra Archipelago—A lifeboat in the sea of changes: Advancement in Socotran insect biodiversity survey. Acta Entomol. Musei Natl. Pragae 2012, 52 (Suppl. 2), 1–26. [Google Scholar]
  20. Nadezhdina, N.; Al-Okaishi, A.; Madera, P. Sap Flow Measurements in a Socotra Dragon’s Blood Tree (Dracaena cinnabari) in its Area of Origin. Trop. Plant Biol. 2018, 11, 107–118. [Google Scholar] [CrossRef]
  21. Hildebrandt, A.; Eltahir, E.A.B. Forest on the edge: Seasonal cloud forest in Oman creates its own ecological niche. Geophys. Res. Lett. 2006, 33. [Google Scholar] [CrossRef]
  22. Attorre, F.; Francesconi, F.; Taleb, N.; Scholte, P.; Saed, A.; Alfo, M.; Bruno, F. Will dragonblood survive the next period of climate change? Current and future potential distribution of Dracaena cinnabari (Socotra, Yemen). Biol. Conserv. 2007, 138, 430–439. [Google Scholar] [CrossRef]
  23. Hubálková, I.; Maděra, P.; Volařík, D. Growth dynamics of Dracaena cinnabari under controlled conditions as the most effective way to protect endangered species. Saudi J. Biol. Sci. 2017, 24, 1445–1452. [Google Scholar] [CrossRef]
  24. Habrová, H.; Pavliš, J. Dynamic response of woody vegetation on fencing protection in semi-arid areas; Case study: Pilot exclosure on the Firmihin Plateau, Socotra island. Saudi J. Biol. Sci. 2017, 24, 338–346. [Google Scholar] [CrossRef] [PubMed]
  25. Pham, T.D.; Yokoya, N.; Bui, D.T.; Yoshino, K.; Friess, D.A. Remote Sensing Approaches for Monitoring Mangrove Species, Structure, and Biomass: Opportunities and Challenges. Remote Sens. 2019, 11, 230. [Google Scholar] [CrossRef]
  26. Pettorelli, N.; Schulte to Bühne, H.; Tulloch, A.; Dubois, G.; Macinnis-Ng, C.; Queirós, A.M.; Keith, D.A.; Wegmann, M.; Schrodt, F.; Stellmes, M.; et al. Satellite remote sensing of ecosystem functions: Opportunities, challenges and way forward. Remote Sens. Ecol. Conserv. 2018, 4, 71–93. [Google Scholar] [CrossRef]
  27. Gougeon, F.A.; Leckie, D.G. Forest Information Extraction from High Spatial Resolution Images Using an Individual Tree Crown Approach, 1st ed.; Canadian Forest Service: Victoria, BC, Canada, 2003; p. 27. [Google Scholar]
  28. Gomes, M.F.; Maillard, P. Detection of Tree Crowns in Very High Spatial Resolution Images. In Environmental Applications of Remote Sensing; Marghany, M., Ed.; InTech: London, UK, 2016; pp. 41–71. [Google Scholar] [CrossRef]
  29. Attorre, F.; Issa, A.; Malatesta, L.; Adeeb, A.; De Sanctis, M.; Vitale, M.; Farcomeni, A. Analysing the relationship between land units and plant communities: The case of Socotra Island (Yemen). Plant Biosyst. 2014, 148, 529–539. [Google Scholar] [CrossRef]
  30. Malatesta, L.; Attorre, F.; Altobelli, A.; Adeeb, A.; De Sanctis, M.; Taleb, N.M.; Scholte, P.T.; Vitale, M. Vegetation mapping from high-resolution satellite images in the heterogeneous arid environments of Socotra Island (Yemen). J. Appl. Remote Sens. 2013, 7, 073527. [Google Scholar] [CrossRef]
  31. Habrová, H. Geobiocoenological differentiation as a tool for sustainable land-use of Socotra Island. Ekológia (Bratislava) 2004, 23, 47–57. [Google Scholar]
  32. Král, K.; Pavliš, J. The first detailed land cover map of Socotra Island by Landsat /ETM+ data. Int. J. Remote Sens. 2006, 27, 3239–3250. [Google Scholar] [CrossRef]
  33. Adolt, R.; Maděra, P.; Abraham, J.; Čupa, P.; Svátek, M.; Matula, R.; Šebesta, J.; Čermák, M.; Volařík, D.; Koutecký, T.; et al. Field survey of Dracaena cinnabari populations in Firmihin, Socotra island: Methodology and preliminary results. J. Landsc. Ecol. 2013, 6, 7–34. [Google Scholar] [CrossRef]
  34. Adolt, R.; Habrová, H.; Maděra, P. Crown age estimation of a monocotyledonous tree species Dracaena cinnabari using logistic regression. Trees—Struct. Funct. 2012, 26, 1287–1298. [Google Scholar] [CrossRef]
  35. Hubálková, I. Prediction of Dragon’s Blood Tree (Dracaena cinnabari Balf.) stand sample density on Soqotra Island. J. Landsc. Ecol. 2011, 4, 5–17. [Google Scholar] [CrossRef]
  36. Maděra, P.; Habrová, H.; Šenfeldr, M.; Hubálková, I.; Lvončík, S.; Ehrenbergerová, L.; Roth, M.; Naděždina, N.; Němec, P.; Rosenthal, J.; et al. Growth dynamics of endemic Dracaena cinnabari of Socotra Island suggest essential elements for a conservation strategy. Biologia 2019, 74, 339–349. [Google Scholar] [CrossRef]
  37. Zheng, D.J.; Xie, L.S.; Zhu, J.H.; Zhang, Z.L. Low genetic diversity and local adaptive divergence of Dracaena cambodiana (Liliaceae) populations associated with historical population bottlenecks and natural selection: An endangered long-lived tree endemic to Hainan Island, China. Plant Biol. 2012, 14, 828–838. [Google Scholar] [CrossRef] [PubMed]
  38. Zhao, J.L.; Zhang, L.; Dayanandan, S.; Nagaraju, S.; Liu, D.M.; Li, Q.M. Tertiary origin and pleistocene diversification of dragon blood tree (Dracaena cambodiana-Asparagaceae) populations in the Asian tropical forests. PLoS ONE 2013, 8, e60102. [Google Scholar] [CrossRef]
  39. Kamel, M.; Ghazaly, U.M.; Callmander, M.W. Conservation status of the Endangered Nubian dragon tree Dracaena ombet in Gebel Elba National Park, Egypt. Oryx 2015, 49, 704–709. [Google Scholar] [CrossRef]
  40. Elnoby, S.K.; Moustafa, A.A.; Mansour, S.R. Impact of climate change on the endangered Nubian dragon tree (Dracaena ombet) in the South Eastern of Egypt. Catrina 2017, 16, 23–28. [Google Scholar]
  41. Almeida Pérez, R.S. Censo, distribución, habitat y estado de conservation de Dracaena tamaranae A.Marrero, R.S.González-Martín. Gran Canaria, Islas Canarias. Botanica Macarónesica 2003, 24, 39–56. [Google Scholar]
  42. Almeida Pérez, R.S. Dracaena draco (L.) L. In Atlas y Libro Rojo de la Flora Vascular Amenazada de España, 2nd ed.; Bañares, A., Blanca, G., Güemes, J., Moreno, J.C., Ortiz, S., Eds.; Publicaciones de O.A.P.N.: Madrid, Spain, 2004; pp. 680–681. [Google Scholar]
  43. Wilkin, P.; Suksathan, P.; Keeratikiat, K.; Van Welzen, P.; Wiland-Szymanska, J. A new species from Thailand and Burma, Dracaena kaweesakii Wilkin & Suksathan (Asparagaceae subfamily Nolinoideae). PhytoKeys 2013, 26, 101–112. [Google Scholar] [CrossRef]
  44. R Core Team. R: A Language and Environment for Statistical Computing. Available online: https://www.R-project.org/ (accessed on 25 December 2018).
  45. Caswell, H. Matrix Population Models: Construction, Analysis, and Interpretation, 2nd ed.; Sinauer Associates, Inc.: Sunderland, MA, USA, 2001; p. 722. [Google Scholar]
  46. FAO. Farmer Field School Guidance Document. Planning for Quality Programmes; Food and Agriculture Organization of the United Nations: Roma, Italy, 2016; p. 112. [Google Scholar]
  47. Scholte, P.; Miller, A.; Shamsan, A.R.; Suleiman, A.S.; Taleb, N.; Millroy, T.; Attorre, F.; Porter, R.; Carugati, C.; Pella, F. Goats: Part of the Problem or the Solution to Biodiversity Conservation on SOCOTRA? Technical Report; SCDP: Hadibo, Socotra, Republic of Yemen, 2007; p. 11. [Google Scholar]
  48. Edward, H.G.M.; de Oliveira, L.F.C.; Quye, A. Raman spectroscopy of coloured resins used in antiquity: dragon’s blood and related substances. Spectrochim. Acta Part A 2001, 57, 2831–2842. [Google Scholar] [CrossRef]
  49. Miller, A. Dracaena cinnabari. Available online: http://0-dx-doi-org.brum.beds.ac.uk/10.2305/IUCN.UK.2004.RLTS.T30428A9548491.en (accessed on 27 December 2018).
  50. Lavranos, J.J. A new, arborescent subspecies of Dracaena from Saudi Arabia. Cactus Succul. J. 2017, 89, 148–152. [Google Scholar] [CrossRef]
  51. Van Rampelbergh, M.; Fleitmann, D.; Verheyden, S.; Cheng, H.; Edwards, L.; De Geest, P.; De Vleeschouwer, D.; Burns, J.S.; Matter, A.; Claeys, P.; et al. Mid- to late holocene Indian ocean monsoon variability recorded in four speleothems from Socotra island, Yemen. Quat. Sci. Rev. 2013, 65, 129–142. [Google Scholar] [CrossRef]
  52. Akçakaya, H.R.; Sjögren-Gulve, P. Population viability analysis in conservation planning: An overview. Ecol. Bull. 2000, 48, 9–21. [Google Scholar]
  53. Kappler, R.H.; Knight, K.S.; Root, K.V. Evaluating the population viability of green ash trees (Fraxinus pennsylvanica) before and after the emerald ash borer beetle (Agrilus planipennis) invasion. Ecol. Model. 2019, 400, 53–59. [Google Scholar] [CrossRef]
  54. Davelos, A.L.; Jarosz, A.M. Demography of american chestnut populations: Effects of a pathogen and a hyperparasite. J. Ecol. 2004, 92, 675–685. [Google Scholar] [CrossRef]
  55. Dhar, A.; Ruprecht, H.; Vacik, H. Population viability risk management (PVRM) for in situ management of endangered tree species—a case study on a Taxus baccata L. population. For. Ecol. Manag. 2008, 255, 2835–2845. [Google Scholar] [CrossRef]
  56. Grogan, J.; Landis, R.M.; Free, C.M.; Schulze, M.D.; Lentini, M.; Ashton, M.S. Bigleaf mahogany Swietenia macrophylla population dynamics and implications for sustainable management. J. Appl. Ecol. 2014, 51, 664–674. [Google Scholar] [CrossRef]
  57. Van Rensburg, J.J.; Hopper, K. Incense and imagery: Mapping agricultural and water management systems on the island of Socotra, Yemen. Proc. Semin. Arab. Stud. 2017, 47, 129–138. [Google Scholar]
  58. Attorre, F.; Taleb, N.; De Sanctis, M.; Farcomeni, A.; Guillet, A.; Vitale, M. Developing conservation strategies for endemic tree species when faced with time and data constraints: Boswellia spp. on Socotra (Yemen). Biodivers. Conserv. 2011, 20, 1483–1499. [Google Scholar] [CrossRef]
  59. Lvončík, S.; Maděra, P.; Volařík, D.; Vrškový, B.; Habrová, H. First proposal of seed regions for frankincense trees (Boswellia spp.) on Socotra Island. J. Landsc. Ecol. 2013, 6, 35–45. [Google Scholar] [CrossRef]
  60. Maděra, P.; Paschová, Z.; Ansorgová, A.; Vrškový, B.; Lvončík, S.; Habrová, H. Volatile compounds in oleo-gum resin of Socotran species of Burseraceae. Acta Universitatis Agriculturae Et Silviculturae Mendelianae Brunensis 2017, 65, 73–90. [Google Scholar] [CrossRef]
  61. Ceccolini, L. The homegardens of Soqotra island, Yemen: An example of agroforestry approach to multiple land-use in an isolated location. Agrofor. Syst. 2002, 56, 107–115. [Google Scholar] [CrossRef]
  62. Nováková, P. Evaluation of Success of Native Trees Plantation in Home-gardens on Socotra. Bachelor’s Thesis, Mendel University, Brno, Czech Republic, 2015; p. 83. [Google Scholar]
  63. Gauld, R. Maintaining Centralized Control in Community-based Forestry: Policy Construction in the Philippines. Dev. Chang. 2000, 31, 229–254. [Google Scholar] [CrossRef]
  64. Maryudi, A.; Devkota, R.R.; Schusser, C.; Yufanyi, C.; Salla, M. Back to basics: Considerations in evaluating the outcomes of community forestry. For. Policy Econ. 2012, 14, 1–5. [Google Scholar] [CrossRef]
  65. Baynes, J.; Herbohn, J.; Smith, C.; Fisher, R.; Braye, D. Key factors which influence the success of community forestry in developing countries. Glob. Environ. Chang. 2015, 35, 226–238. [Google Scholar] [CrossRef]
  66. Rametsteiner, E.; Simula, M. Forest certification—An instrument to promote sustainable forest management? J. Environ. Manag. 2003, 67, 87–98. [Google Scholar] [CrossRef]
  67. Gullison, R.E. Does forest certification conserve biodiversity? Oryx 2003, 37, 153–165. [Google Scholar] [CrossRef] [Green Version]
  68. Aynekulu, E. Forest Diversity in Fragmented Landscapes of Northern Ethiopia and Implications for Conservation. Ph.D. Thesis, University of Bonn, Bonn, Germany, 2011; p. 132. [Google Scholar]
  69. Aynekulu, E.; Aerts, R.; Moonen, P.; Denich, M.; Gebrehiwot, K.; Vagen, T.G.; Mekuria, W.; Boehmer, H.J. Altitudinal variation and conservation priorities of vegetation along the Great Rift Valley escarpment, northern Ethiopia. Biodivers. Conserv. 2012, 21, 2691–2707. [Google Scholar] [CrossRef]
  70. Marrero, A.; Almeida, R.S.; Roca, A. Diáspora y rescate: Acciones para la conservación del Drago de Gran Canaria, Dracaena tamaranae. In Proceedings of the V Congreso de Biología de la Conservación de Plantas, Menorca, Es Mercadal, Spain, 28 September–1 October 2011. [Google Scholar]
  71. Al Hosni, A.; Oliver, I.; Al Jabri, I.; Al Saidi, A.; Al Rawahi, A.; Al Hinai, H. Ex situ conservation of Dracaena serrulata in Dhofar province, southern Oman. Acta Hortic. 2018, 1190, 9–14. [Google Scholar] [CrossRef]
Figure 1. Socotra Island and its toponyms.
Sustainability 11 03557 g001
Figure 2. Transect along the road across Firmihin with dead and living dragon’s blood trees.
Sustainability 11 03557 g002
Figure 3. Map of dragon’s blood tree sub-populations on Socotra Island.
Sustainability 11 03557 g003
Figure 4. The relationship between crown projection area (CPA) and number of branch sections (NBS). NBS = (CPA^(1/3)-0.868425)/0.106529.
Sustainability 11 03557 g004
Figure 5. Age structure of the whole dragon’s blood tree population on Socotra Island. Vertical axis expresses frequency [%] of ontogenetic developmental stages.
Sustainability 11 03557 g005
Figure 6. Mortality curve of Dracaena cinnabari.
Sustainability 11 03557 g006
Table 1. Coefficients of naturalness (CN) for individual landcover classes according to Král and Pavliš [32].
Landcover class.CN
Dracaena forest1.0
Frankincense forest1.0
Montane forest1.0
Dracaena woodland0.6
Frankincense woodland0.6
Montane mosaic0.6
Submontane shrubland0.4
High shrubland with succulents0.4
Low Croton-Jatropha shrubland0.3
Sparse dwarf shrubland0.2
Submontane grassland0.2
Montane grassland0.2
Limestone rocks1.0
Basement rocks1.0
Wadi0.1
Date palm plantations0.0
Table 2. Sub-populations and their main characteristics.
Sub-Pop. NoArea
[ha]
No. of TreesTree Density
[tree per ha]
Mean Elevation
[m a.s.l.]
11635.7335532.17482
21675.3113920.83476
3923.9118722.03358
44873.312230.05465
51900.1328671.51427
64383.3510 8902.48530
71089.6932 19529.55638
87952.0793431.17611
94487.6370051.56900
1010 408.8012520.12745
1111.19221.97513
123105.4810890.35744
132632.817190.27771
141162.843110.27630
1577.211111.44479
16462.07150.03549
17871.86810.09403
183714.8265511.76445
1948.45761.57495
20546.525651.03475
Table 3. Occurrence of dragon’s blood trees within landcover classes [25] on Socotra Island.
Landcover ClassNo. of TreesArea
[ha]
Tree Density
[tree per ha]
Dracaena forests16,979240.0070.75
Dracaena woodland26,8694883.545.50
Limestone rocks5919.962.96
Submontane grassland17,04315,413.971.11
Submontane shrubland11,48314,829.530.77
High shrubland with succulents45967899.900.58
Montane forest119214.870.55
Frankincense woodland17624049.950.44
Frankincense forest356927.210.38
Montane mosaic5181603.330.32
Montane grassland82329.000.25
Sparse dwarf shrubland25103.140.24
Low Croton-Jatropha shrubland2331211.760.19
Wadi978.550.11
Basement rocks667.280.09
Date palm plantations072.360.00
Table 4. Age structure and representation of ontogenetic stages within sub-populations.
Sub-Pop. NoMean Age
[years]
SDSEMin
[years]
Max
[years]
Juve-Nile
[%]
Early Adult
[%]
Adult
[%]
Late Adult
[%]
Sene-
Scent
[%]
Extinction Time
[years]
129987.011.4605450.034.2869.4322.633.63509
230786.002.31565290.003.5265.8826.514.09451
333580.441.86565130.002.0854.0138.145.77442
420089.956.02564280.0029.1565.475.380.00470
533281.651.52565210.001.9555.1437.325.58461
634687.460.84565520.002.1847.1439.7010.98506
732782.270.46565590.002.4558.1134.484.96546
835287.980.91275450.001.5147.0036.6814.81495
928289.351.07275290.007.3571.8318.931.88564
1035589.382.53565450.001.3647.0434.2717.33395
1135546.089.822384380.000.0045.4554.550.00117
12230109.663.32275210.0024.3360.3311.753.58545
1331497.183.62565290.006.8257.0228.237.93428
1436485.284.84275290.001.9341.1639.8717.04313
1534370.336.681085040.000.9054.0537.847.21226
1646661.2015.803535590.000.007.1421.4371.4331
1738863.437.051985040.000.0022.2259.2618.52162
1835078.350.97275450.000.7248.0541.879.36461
1936371.678.221775040.000.0040.7951.327.89194
2036574.763.15275370.000.3542.4843.5413.63311
Table 5. Conservation importance index values for all sub-populations on Socotra Island.
Sub-Pop. NoHDAMDTSPTNCICI rel
70.580.520.590.101.002.7955.90
40.421.000.000.470.011.9037.97
80.380.430.020.760.291.8837.66
100.400.420.001.000.041.8637.22
90.440.690.030.430.221.8136.28
120.550.890.010.300.031.7735.48
60.370.450.050.420.341.6332.66
130.660.570.010.250.021.5130.19
180.370.440.040.360.201.4028.04
10.390.630.040.160.111.3226.47
140.660.380.010.110.011.1623.30
50.360.500.030.180.091.1623.26
20.330.600.020.160.041.1523.03
30.370.490.040.090.061.0521.03
200.430.380.020.050.020.9018.02
150.380.460.030.010.000.8817.66
190.380.390.030.000.000.8016.00
110.300.420.040.000.000.7615.13
170.320.290.000.080.000.7014.07
160.300.000.000.040.000.356.93

