Monitoring Methods for Systems-Strengthening Activities Toward Sustainable Water and Sanitation Services in Low-Income Settings

 , and
, and 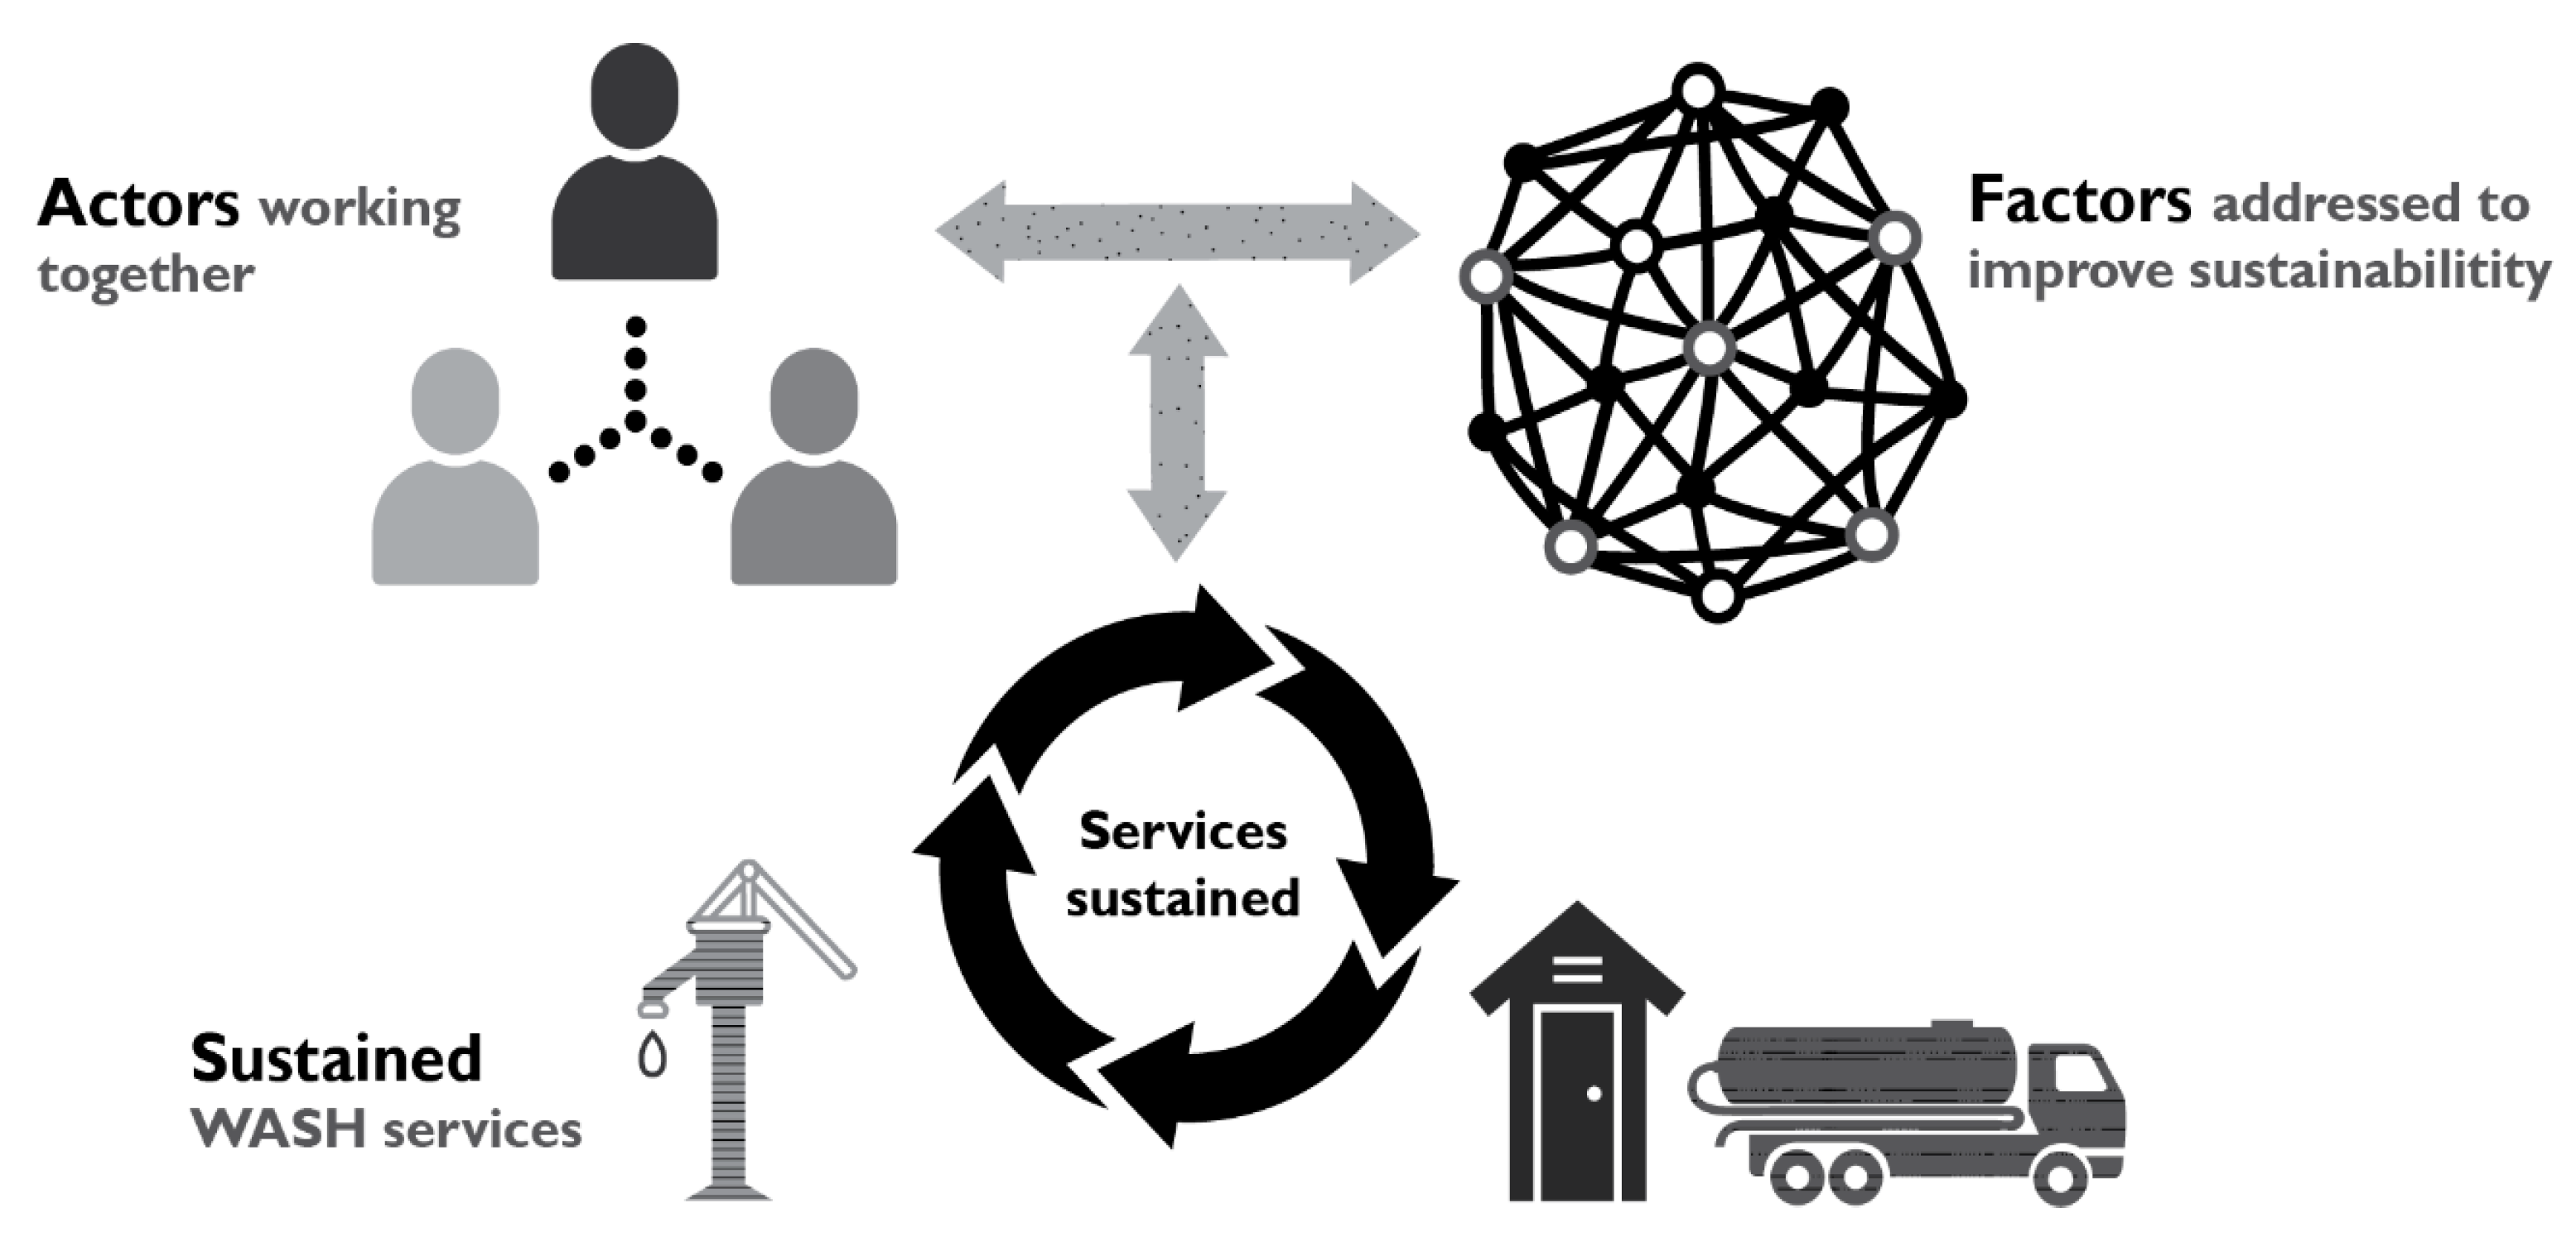
Abstract
:1. Introduction
2. Components of a Systems Approach
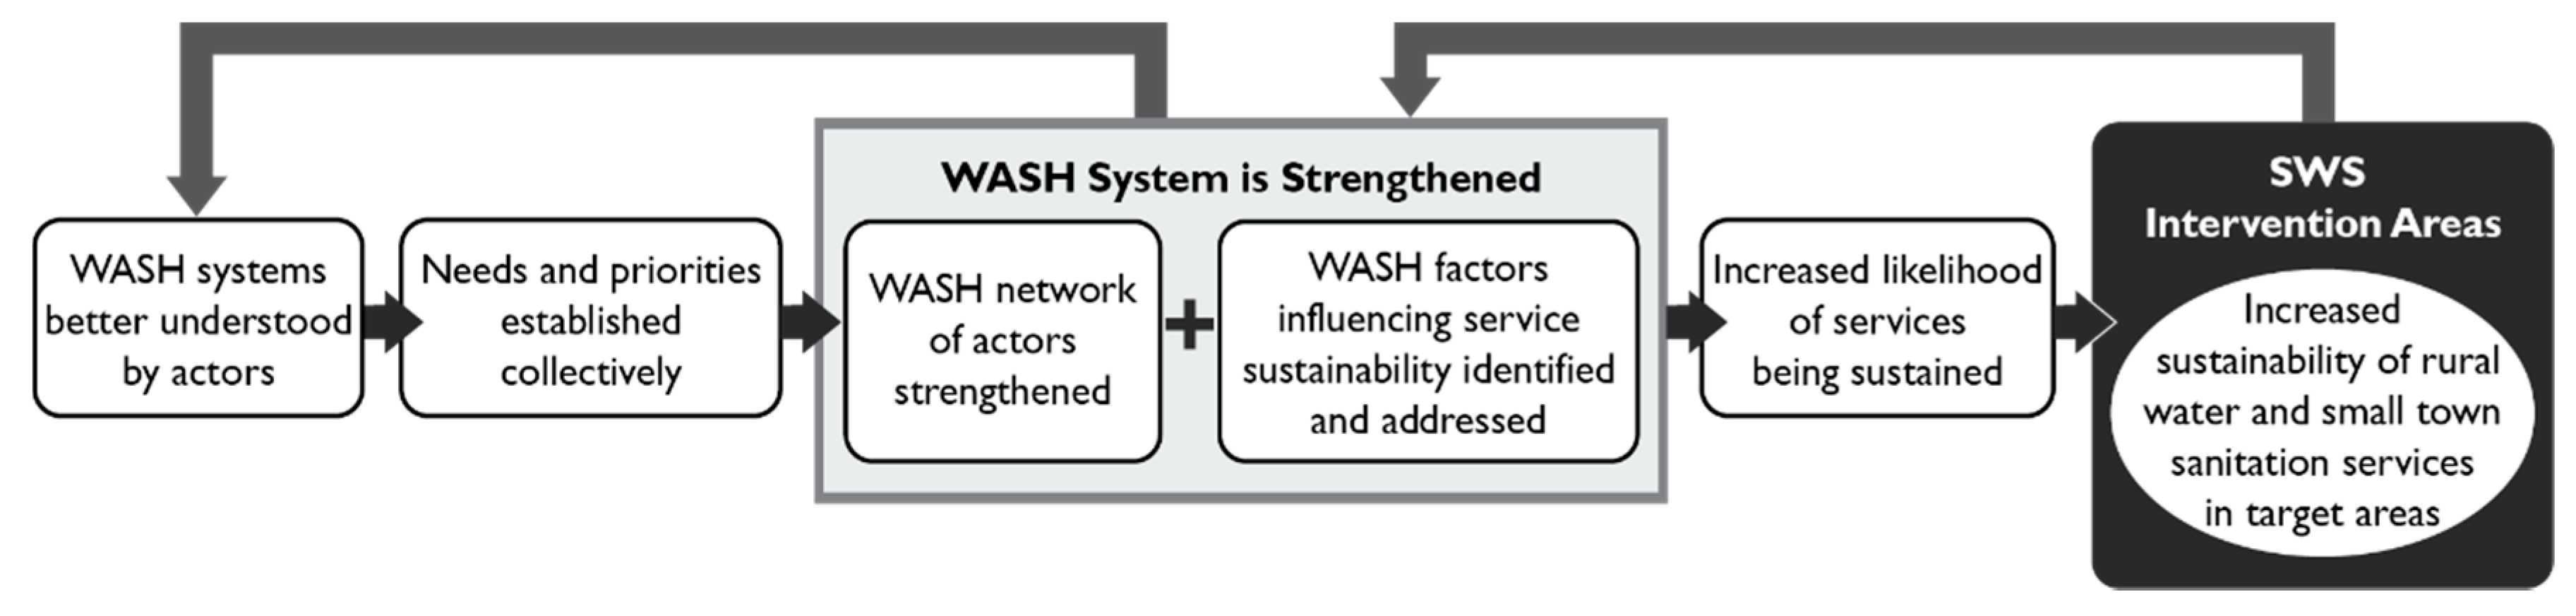
2.1. General Theory of Change for a Systems Approach
- Systems mapping and analysis: By mapping the system, including both the network of actors and the systems of interacting factors, key stakeholders will better understand what is driving outcomes and identify weaknesses and potential leverage points as entry points for systems-strengthening interventions.
- Systems strengthening and engagement: Based on the identified weaknesses, gaps, or disconnects within the existing system, interventions are designed and deployed to specifically address them and strengthen the overall function of the system.
- Service delivery impacts: In the near term, the resulting impacts on the system as a whole, or, in the longer term, the impacts on the sustainability of the service itself, can be observed, through both quantitative and qualitative monitoring.
2.2. Considering Systems Complexity
2.2.1. Incremental and Flexible Methods
2.2.2. Monitoring the Full System of Actor
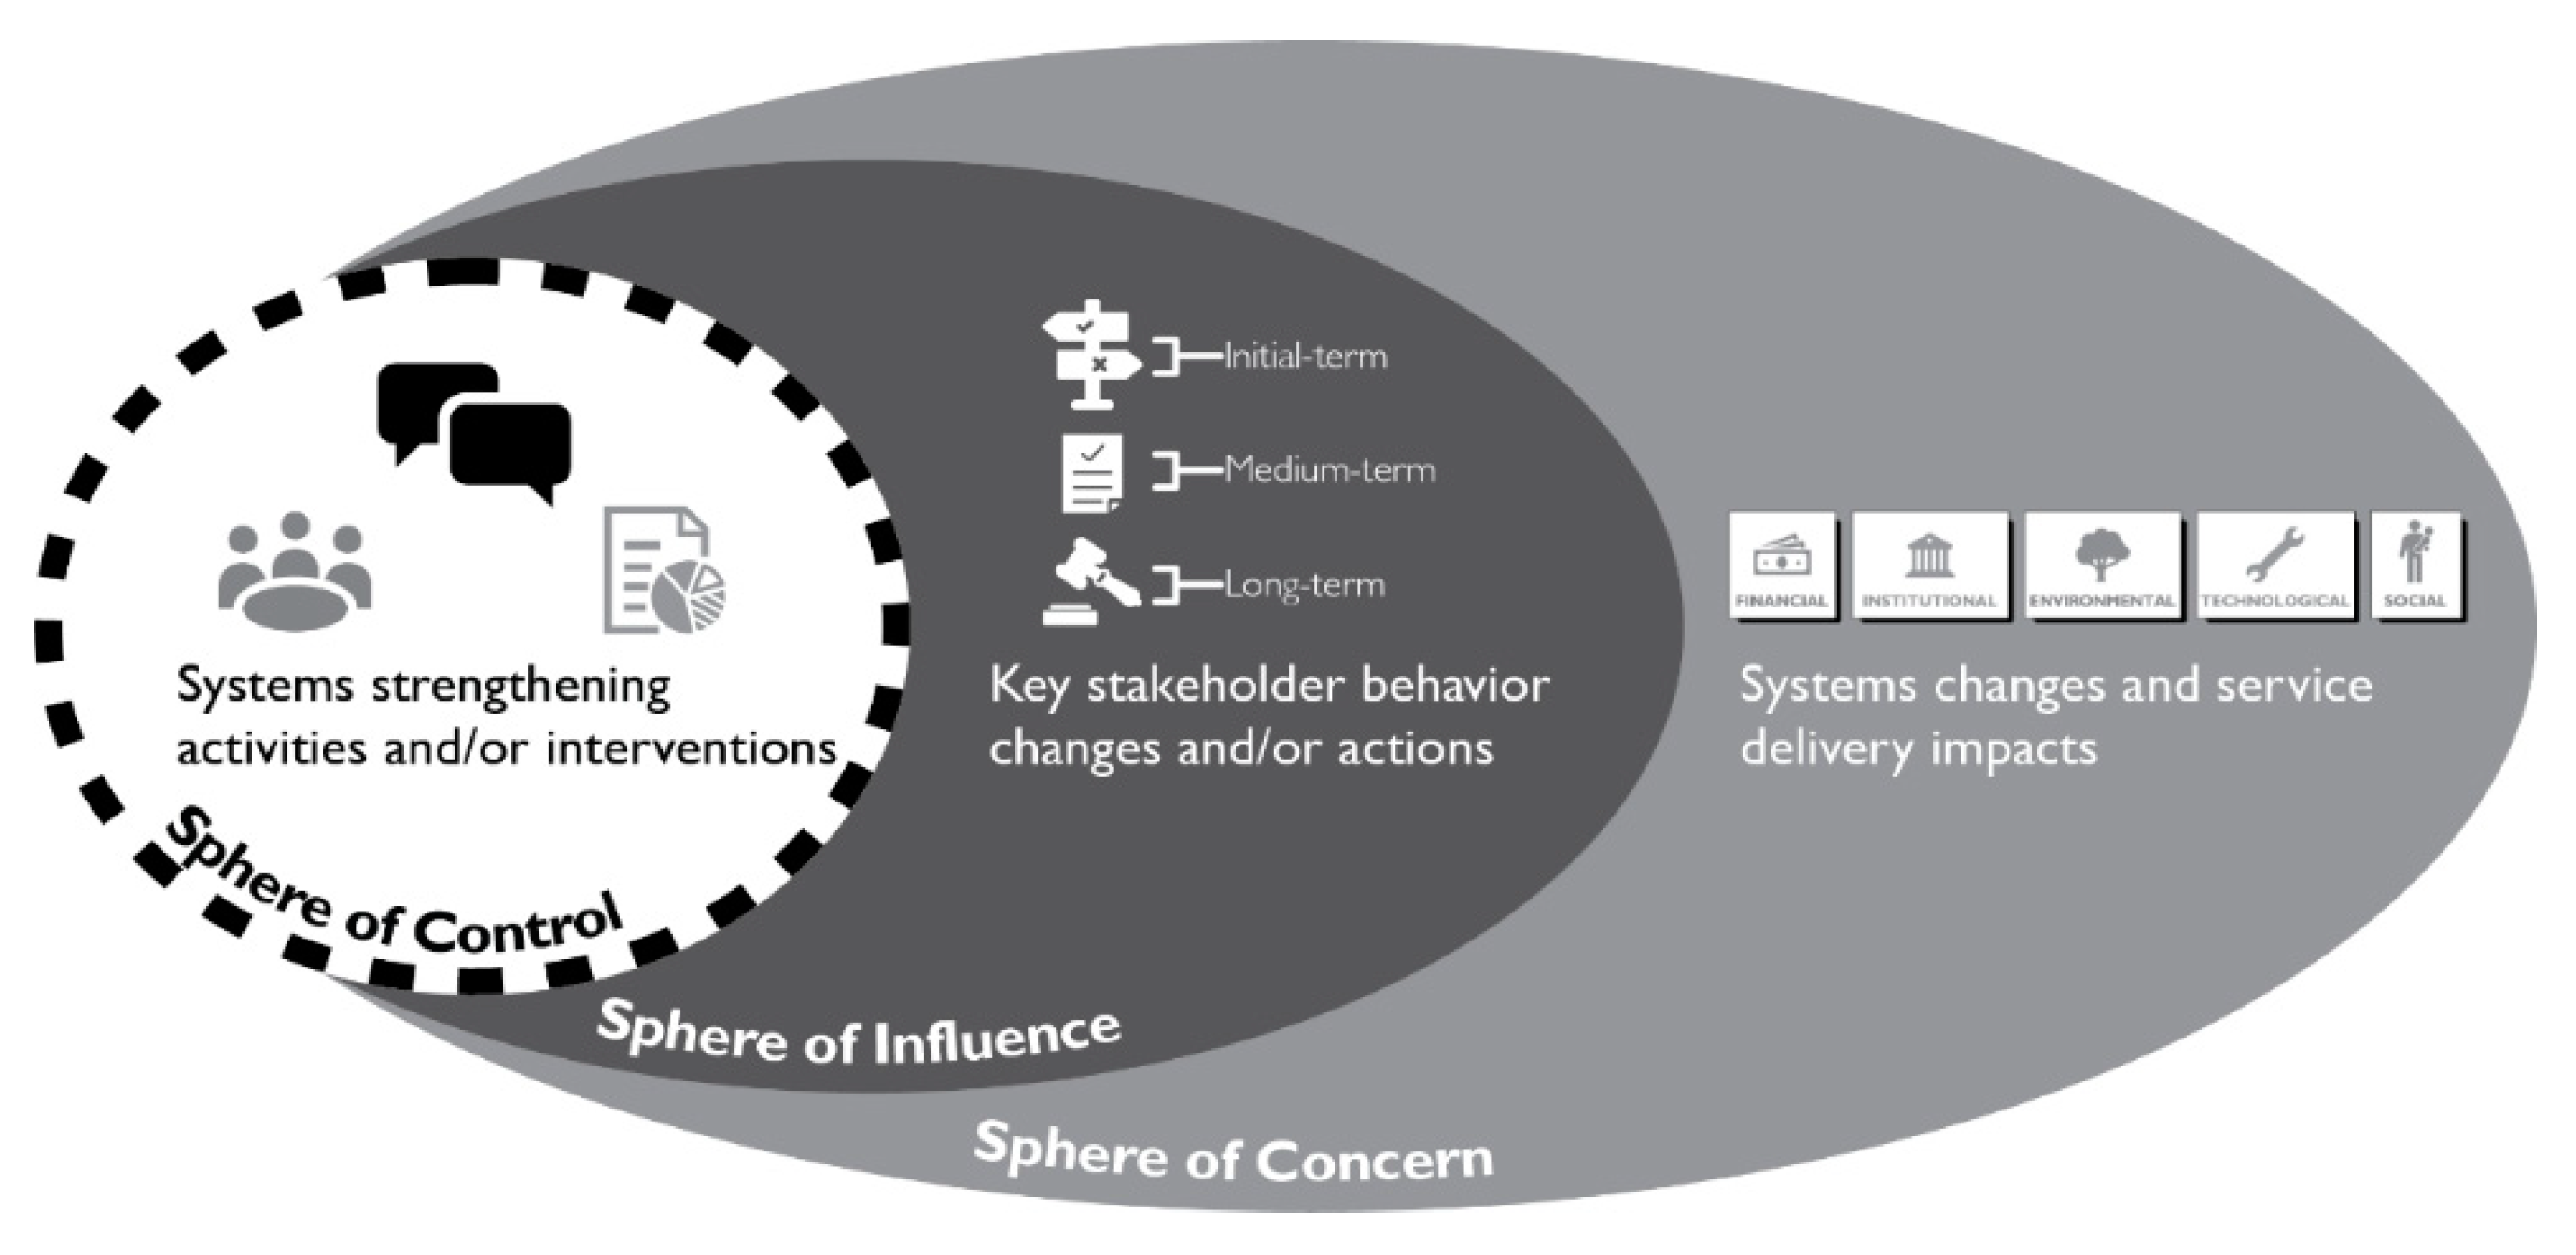
2.3. Understanding and Setting Effective Boundaries
2.4. WASH Systems Monitoring Methods
- Qualitative monitoring methods, focused primarily on the process of systems change;
- Analytical monitoring and analysis of the overall structure of the system and actor networks;
- Indicators or proxy indicators that adequately capture impacts and results of activities, while also considering the complex nature of such shifts and impacts.
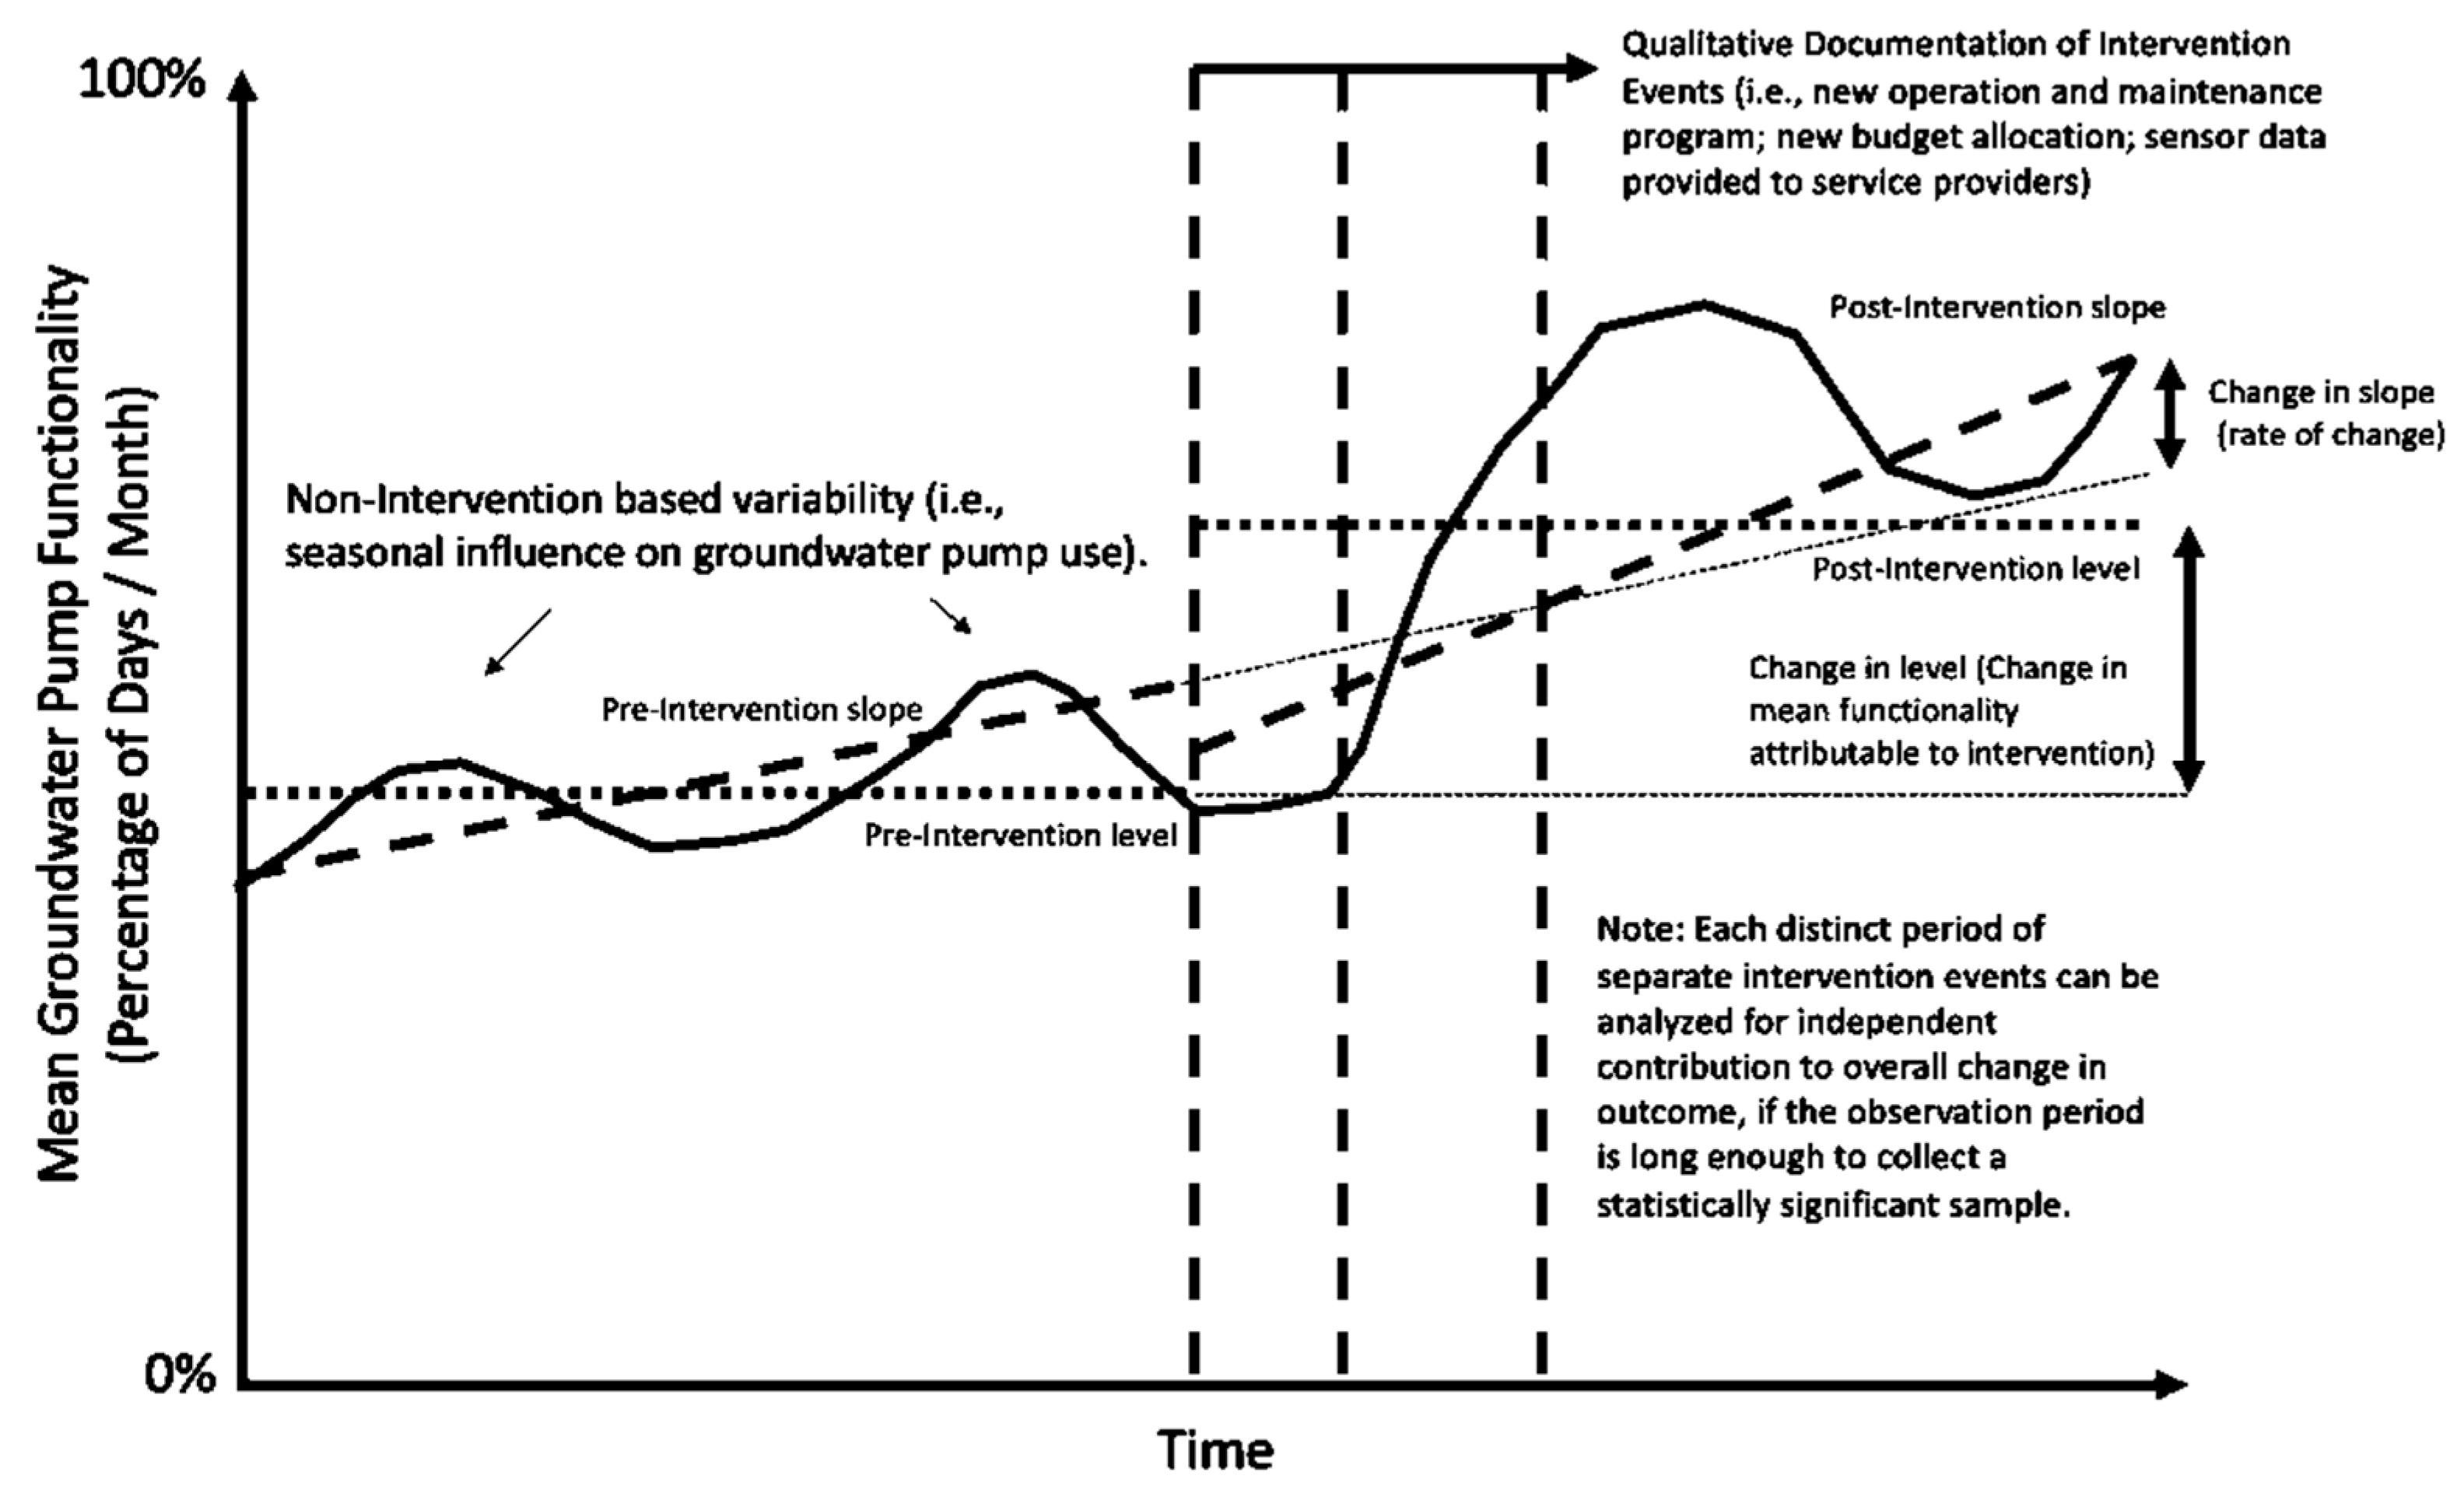
- Implementation Science: Using an implementation science framework to iteratively evaluate a water service intervention, we use time series analysis to link measures of water service delivery to intervention activities. This method is being applied in the Afar region of Ethiopia and in northern Kenya;
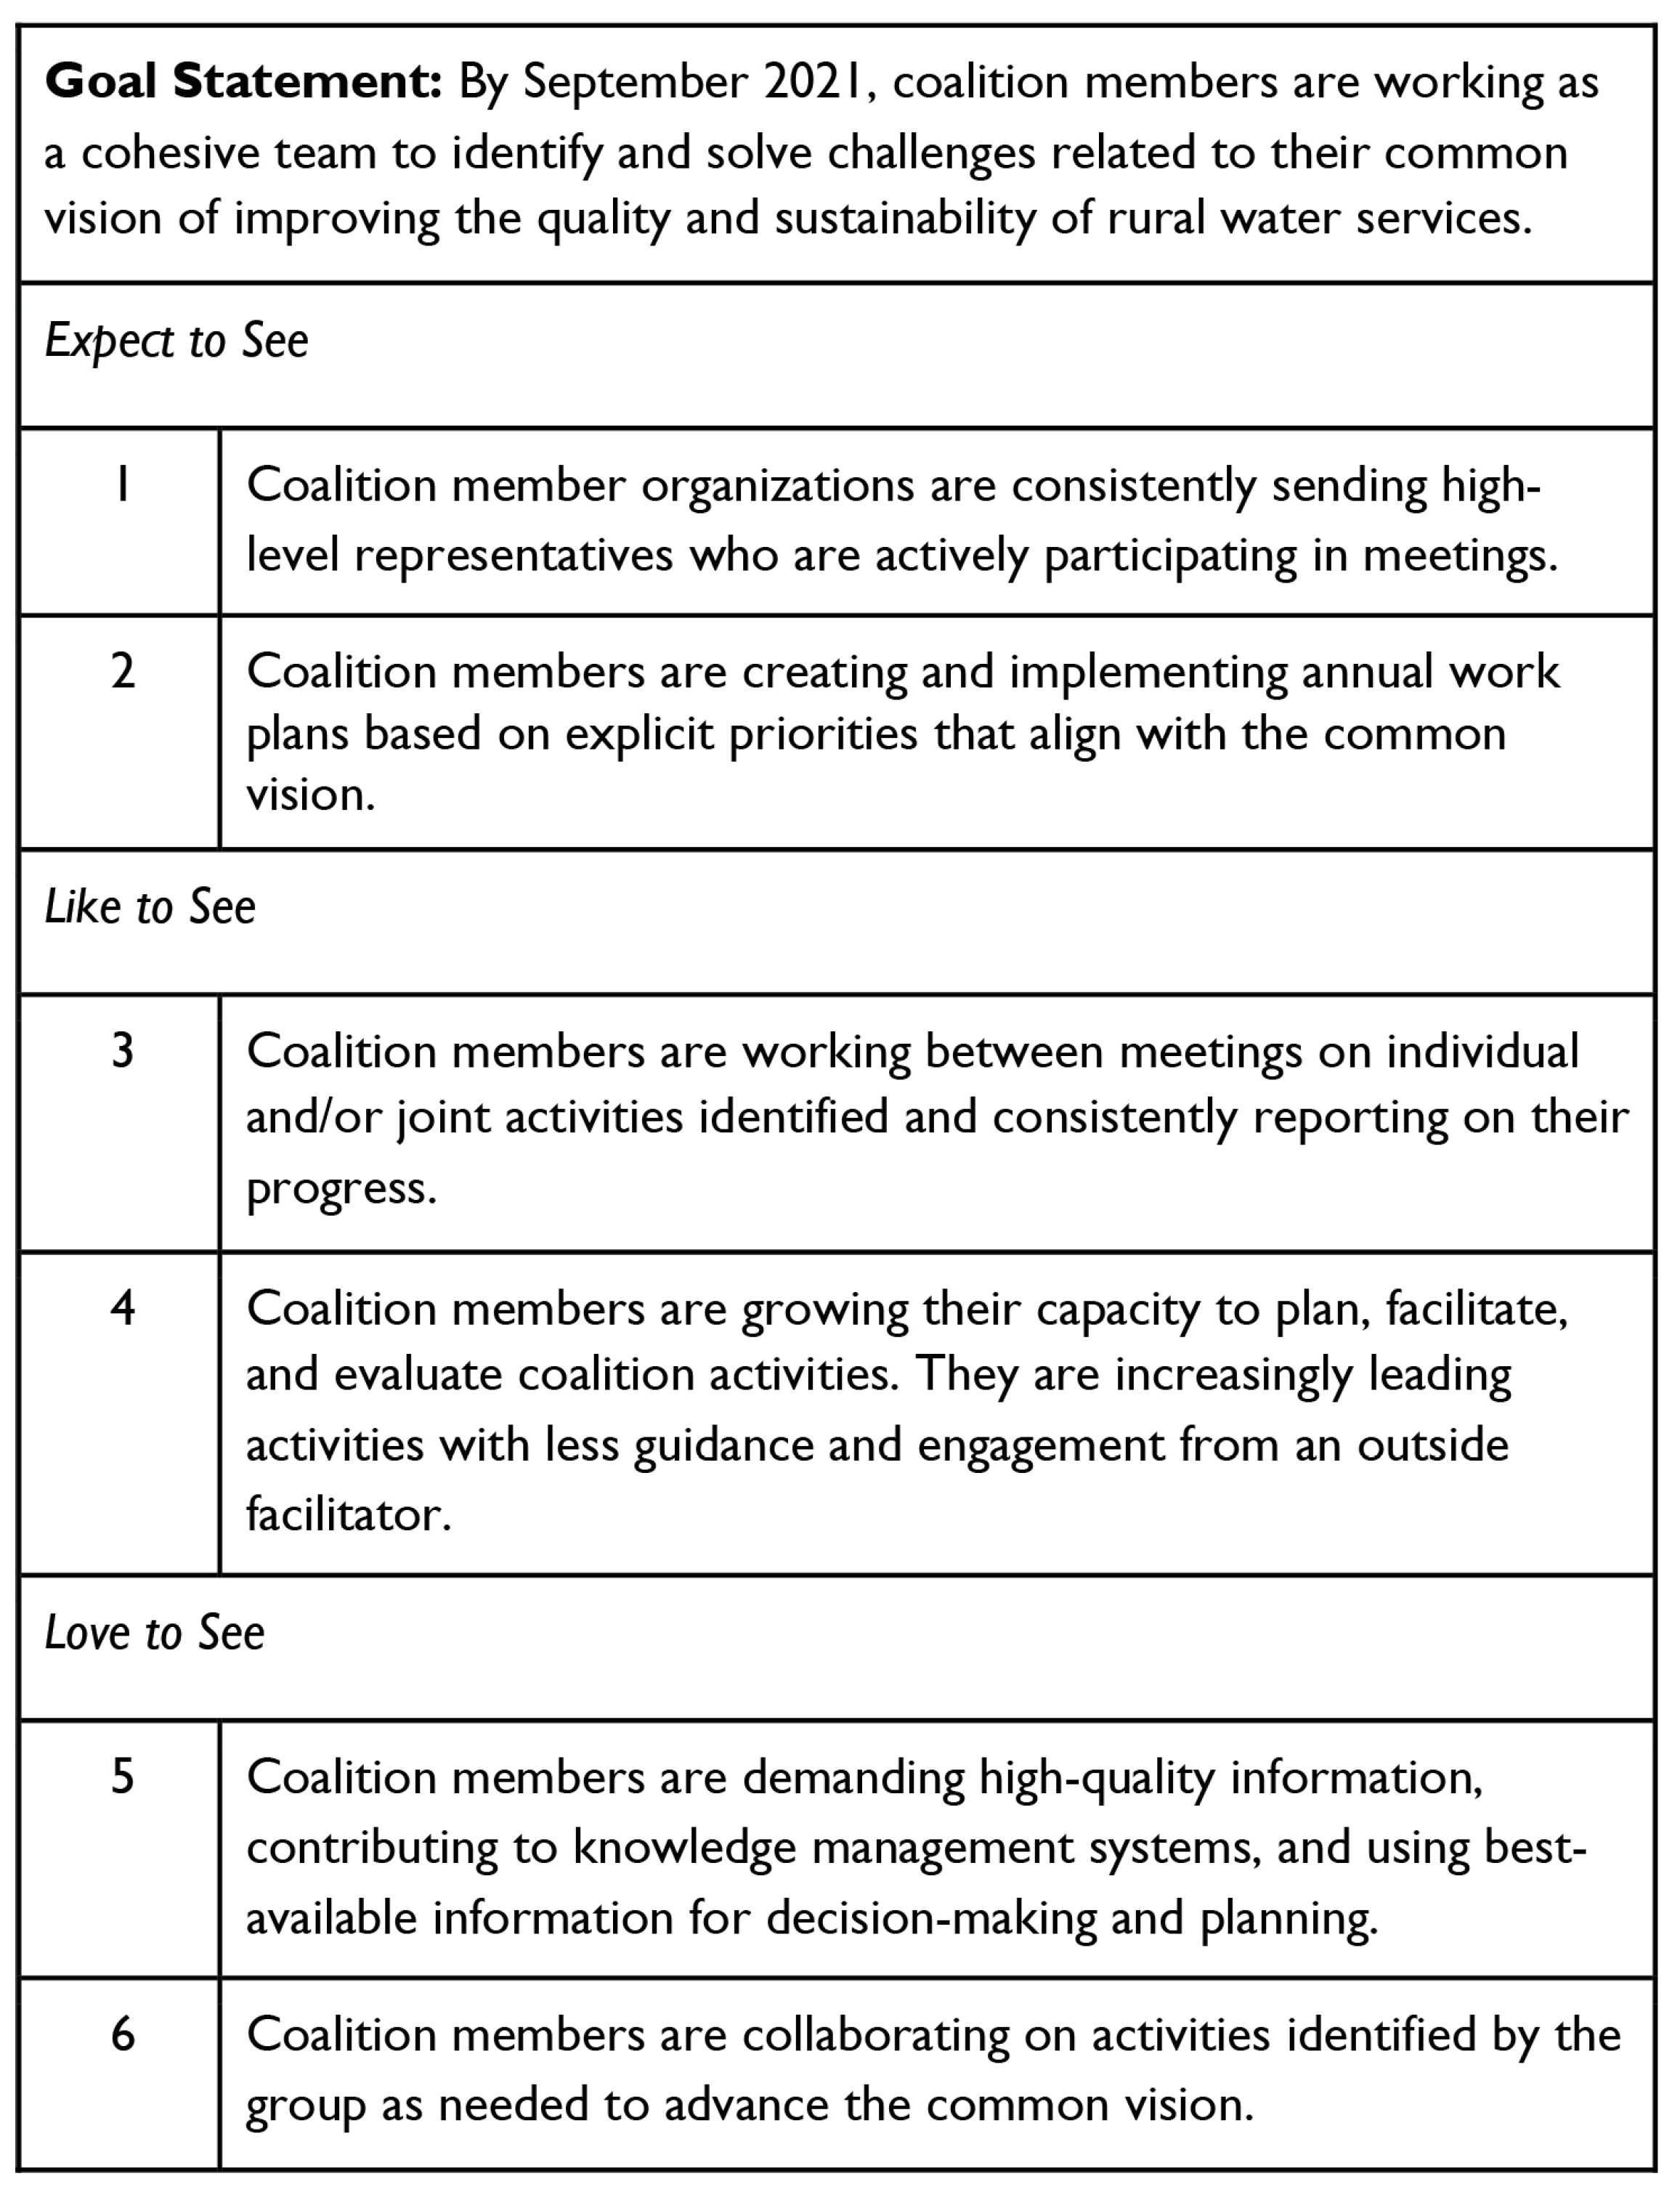
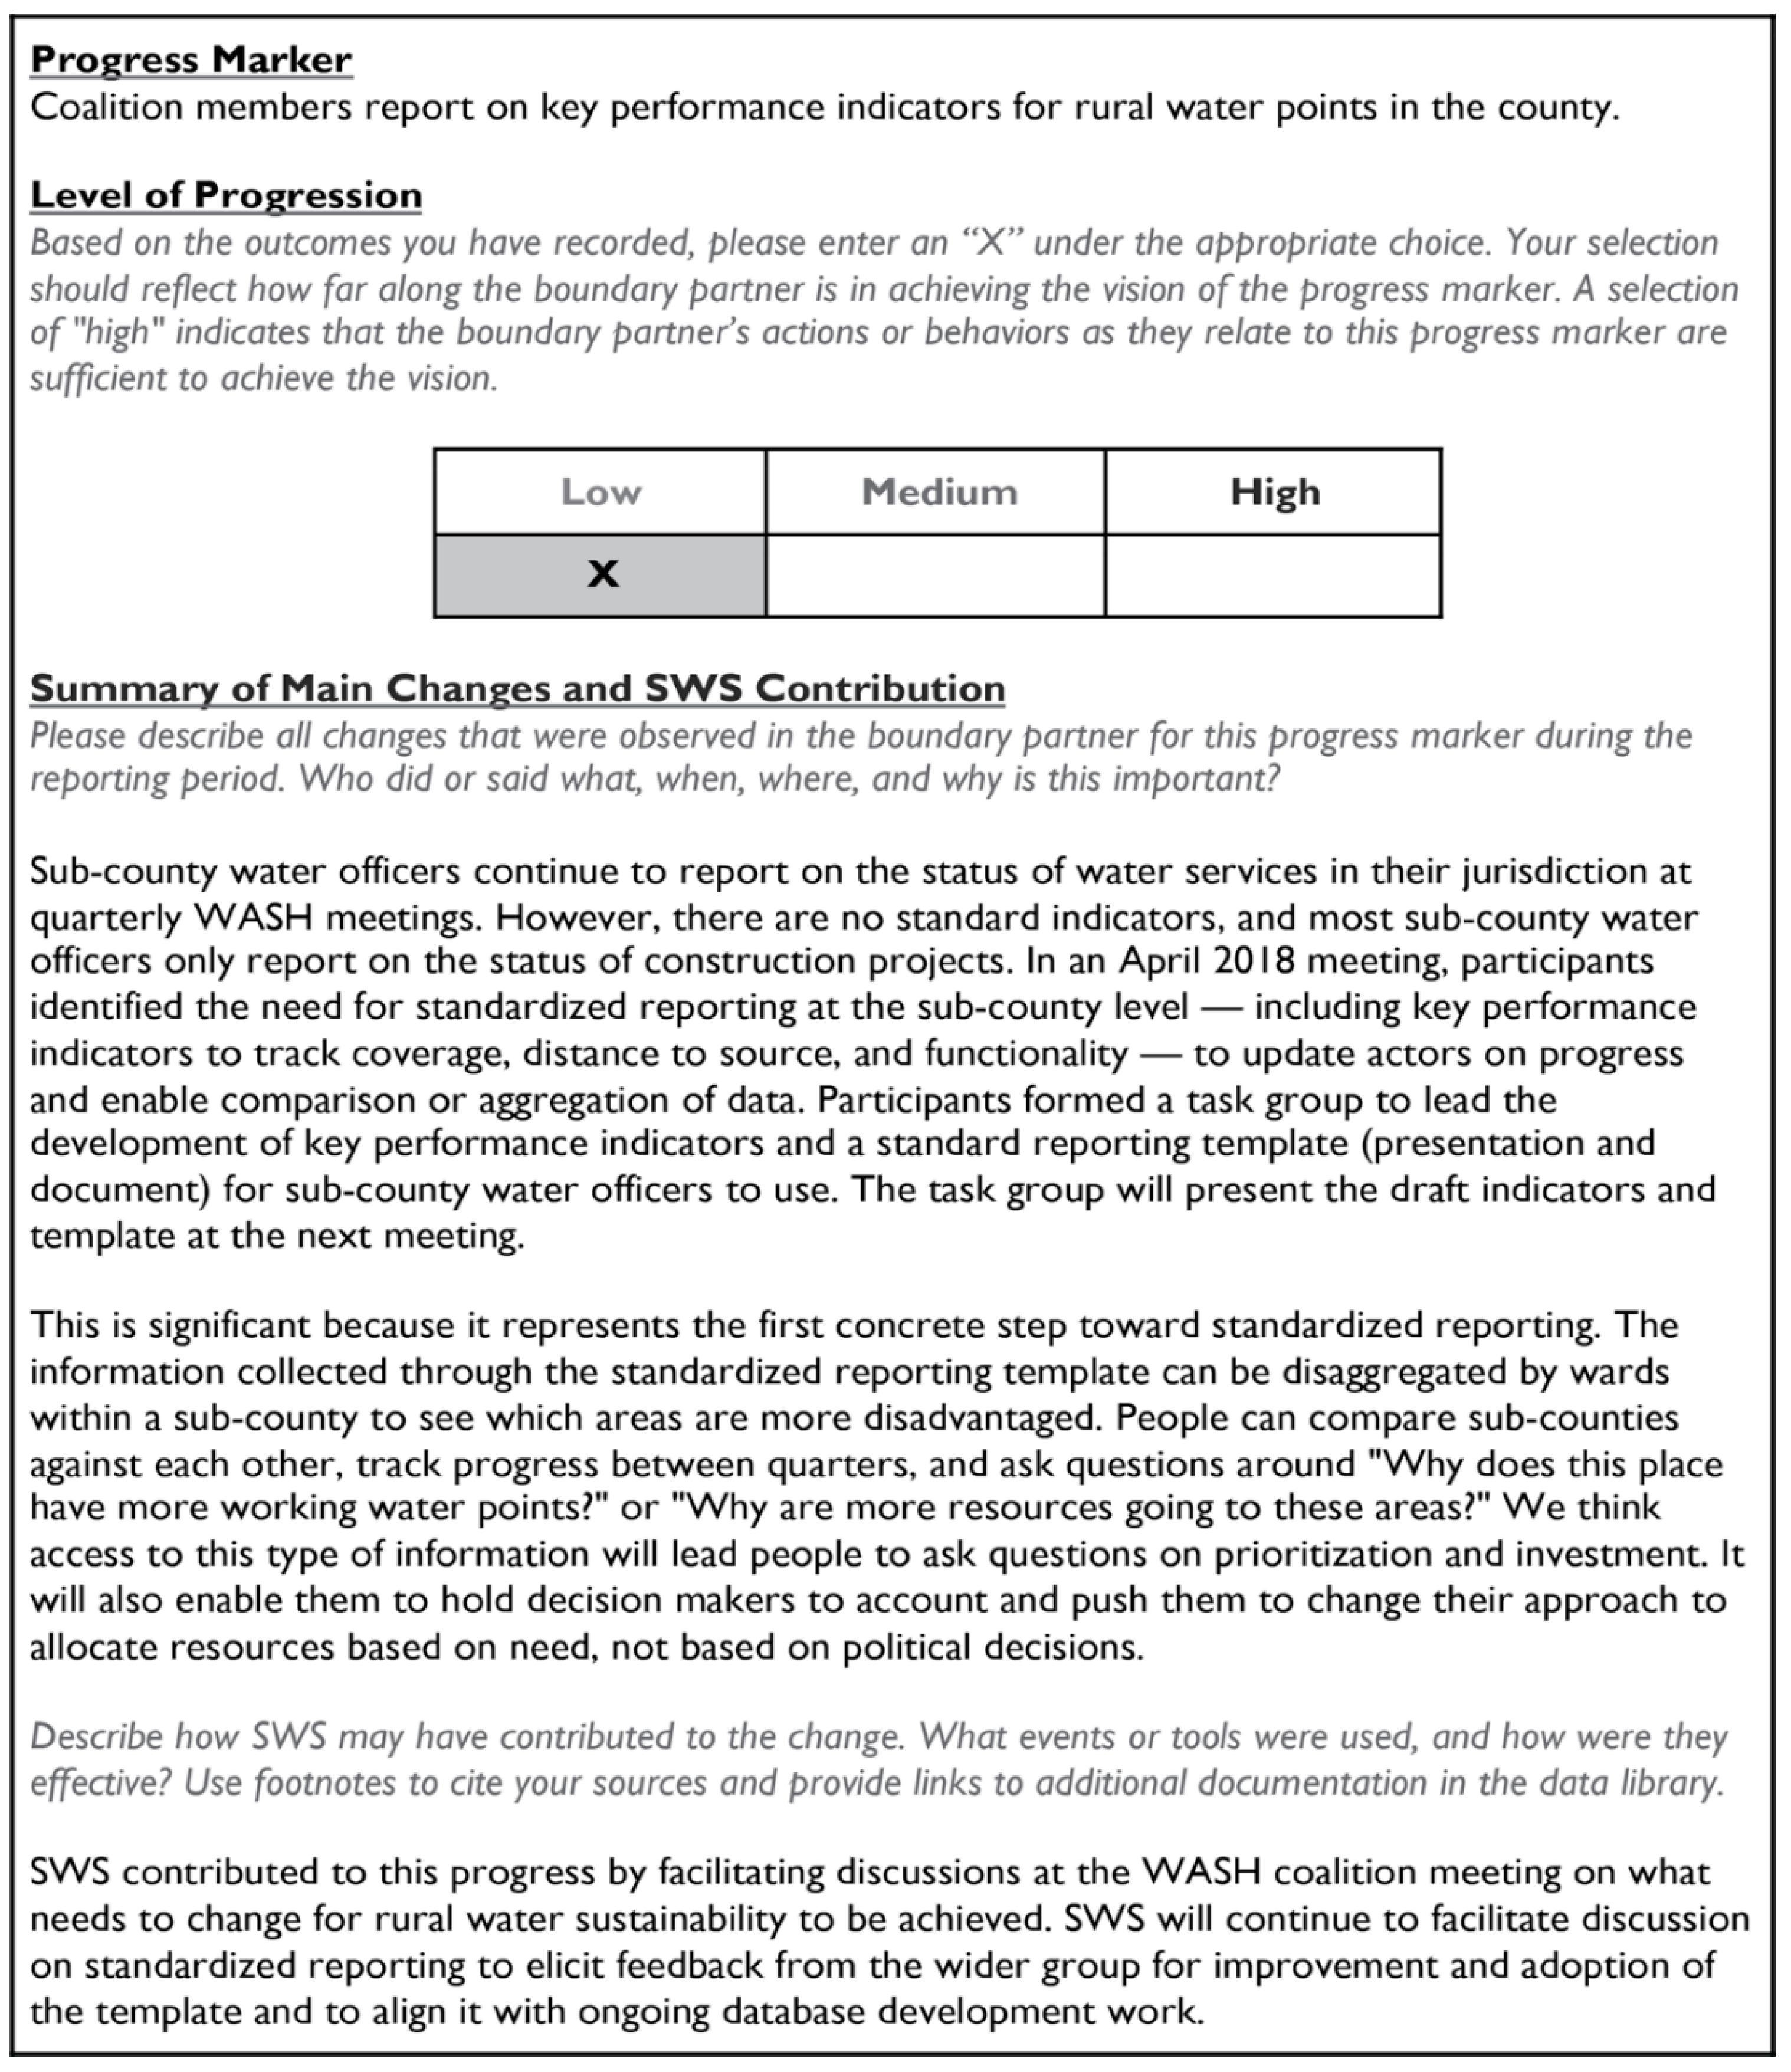
- Outcome Mapping: Outcome mapping is a process of setting desired progress markers for key actors and monitoring their achievement through the creation and analysis of regular project journaling. Through this, connections between individual actions, discussions, or interventions, as well as resulting impacts on broader systems components, can be explored, improving the understanding of how systems approaches work and what impacts can be realized through their application. This is being applied in Kitui County in Kenya, in two regions and two small towns in Ethiopia, and in four districts in Uganda;
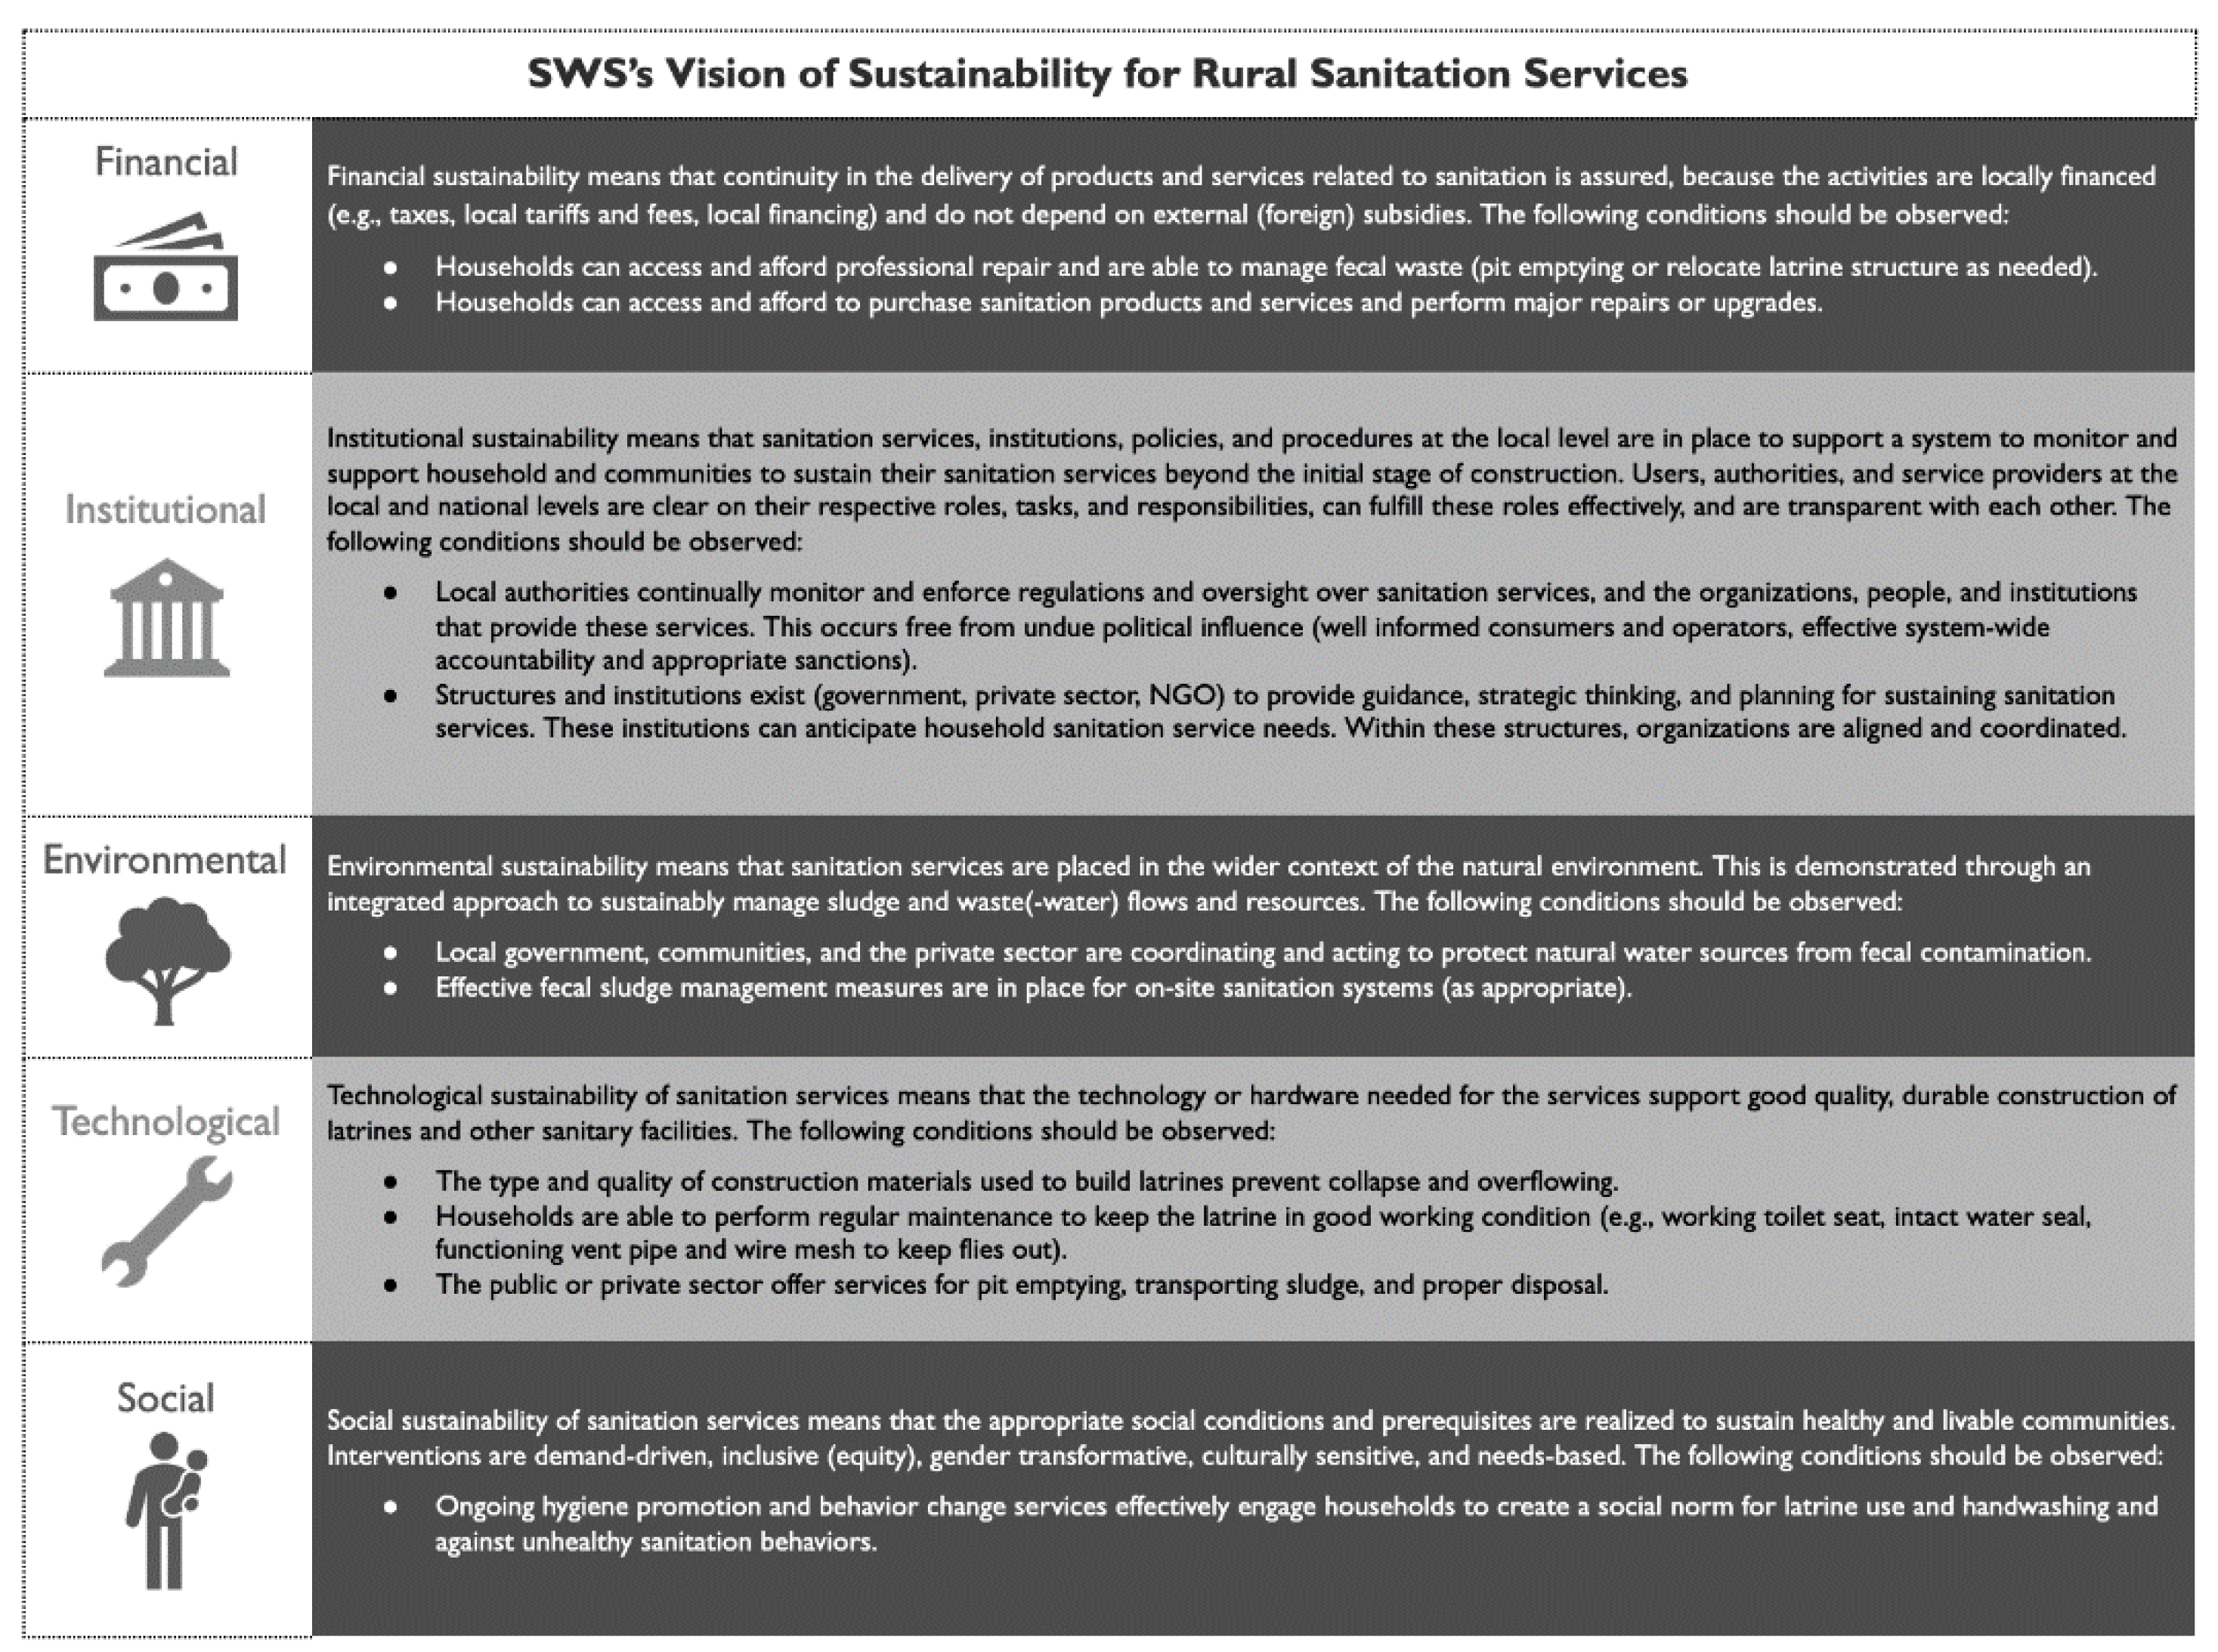
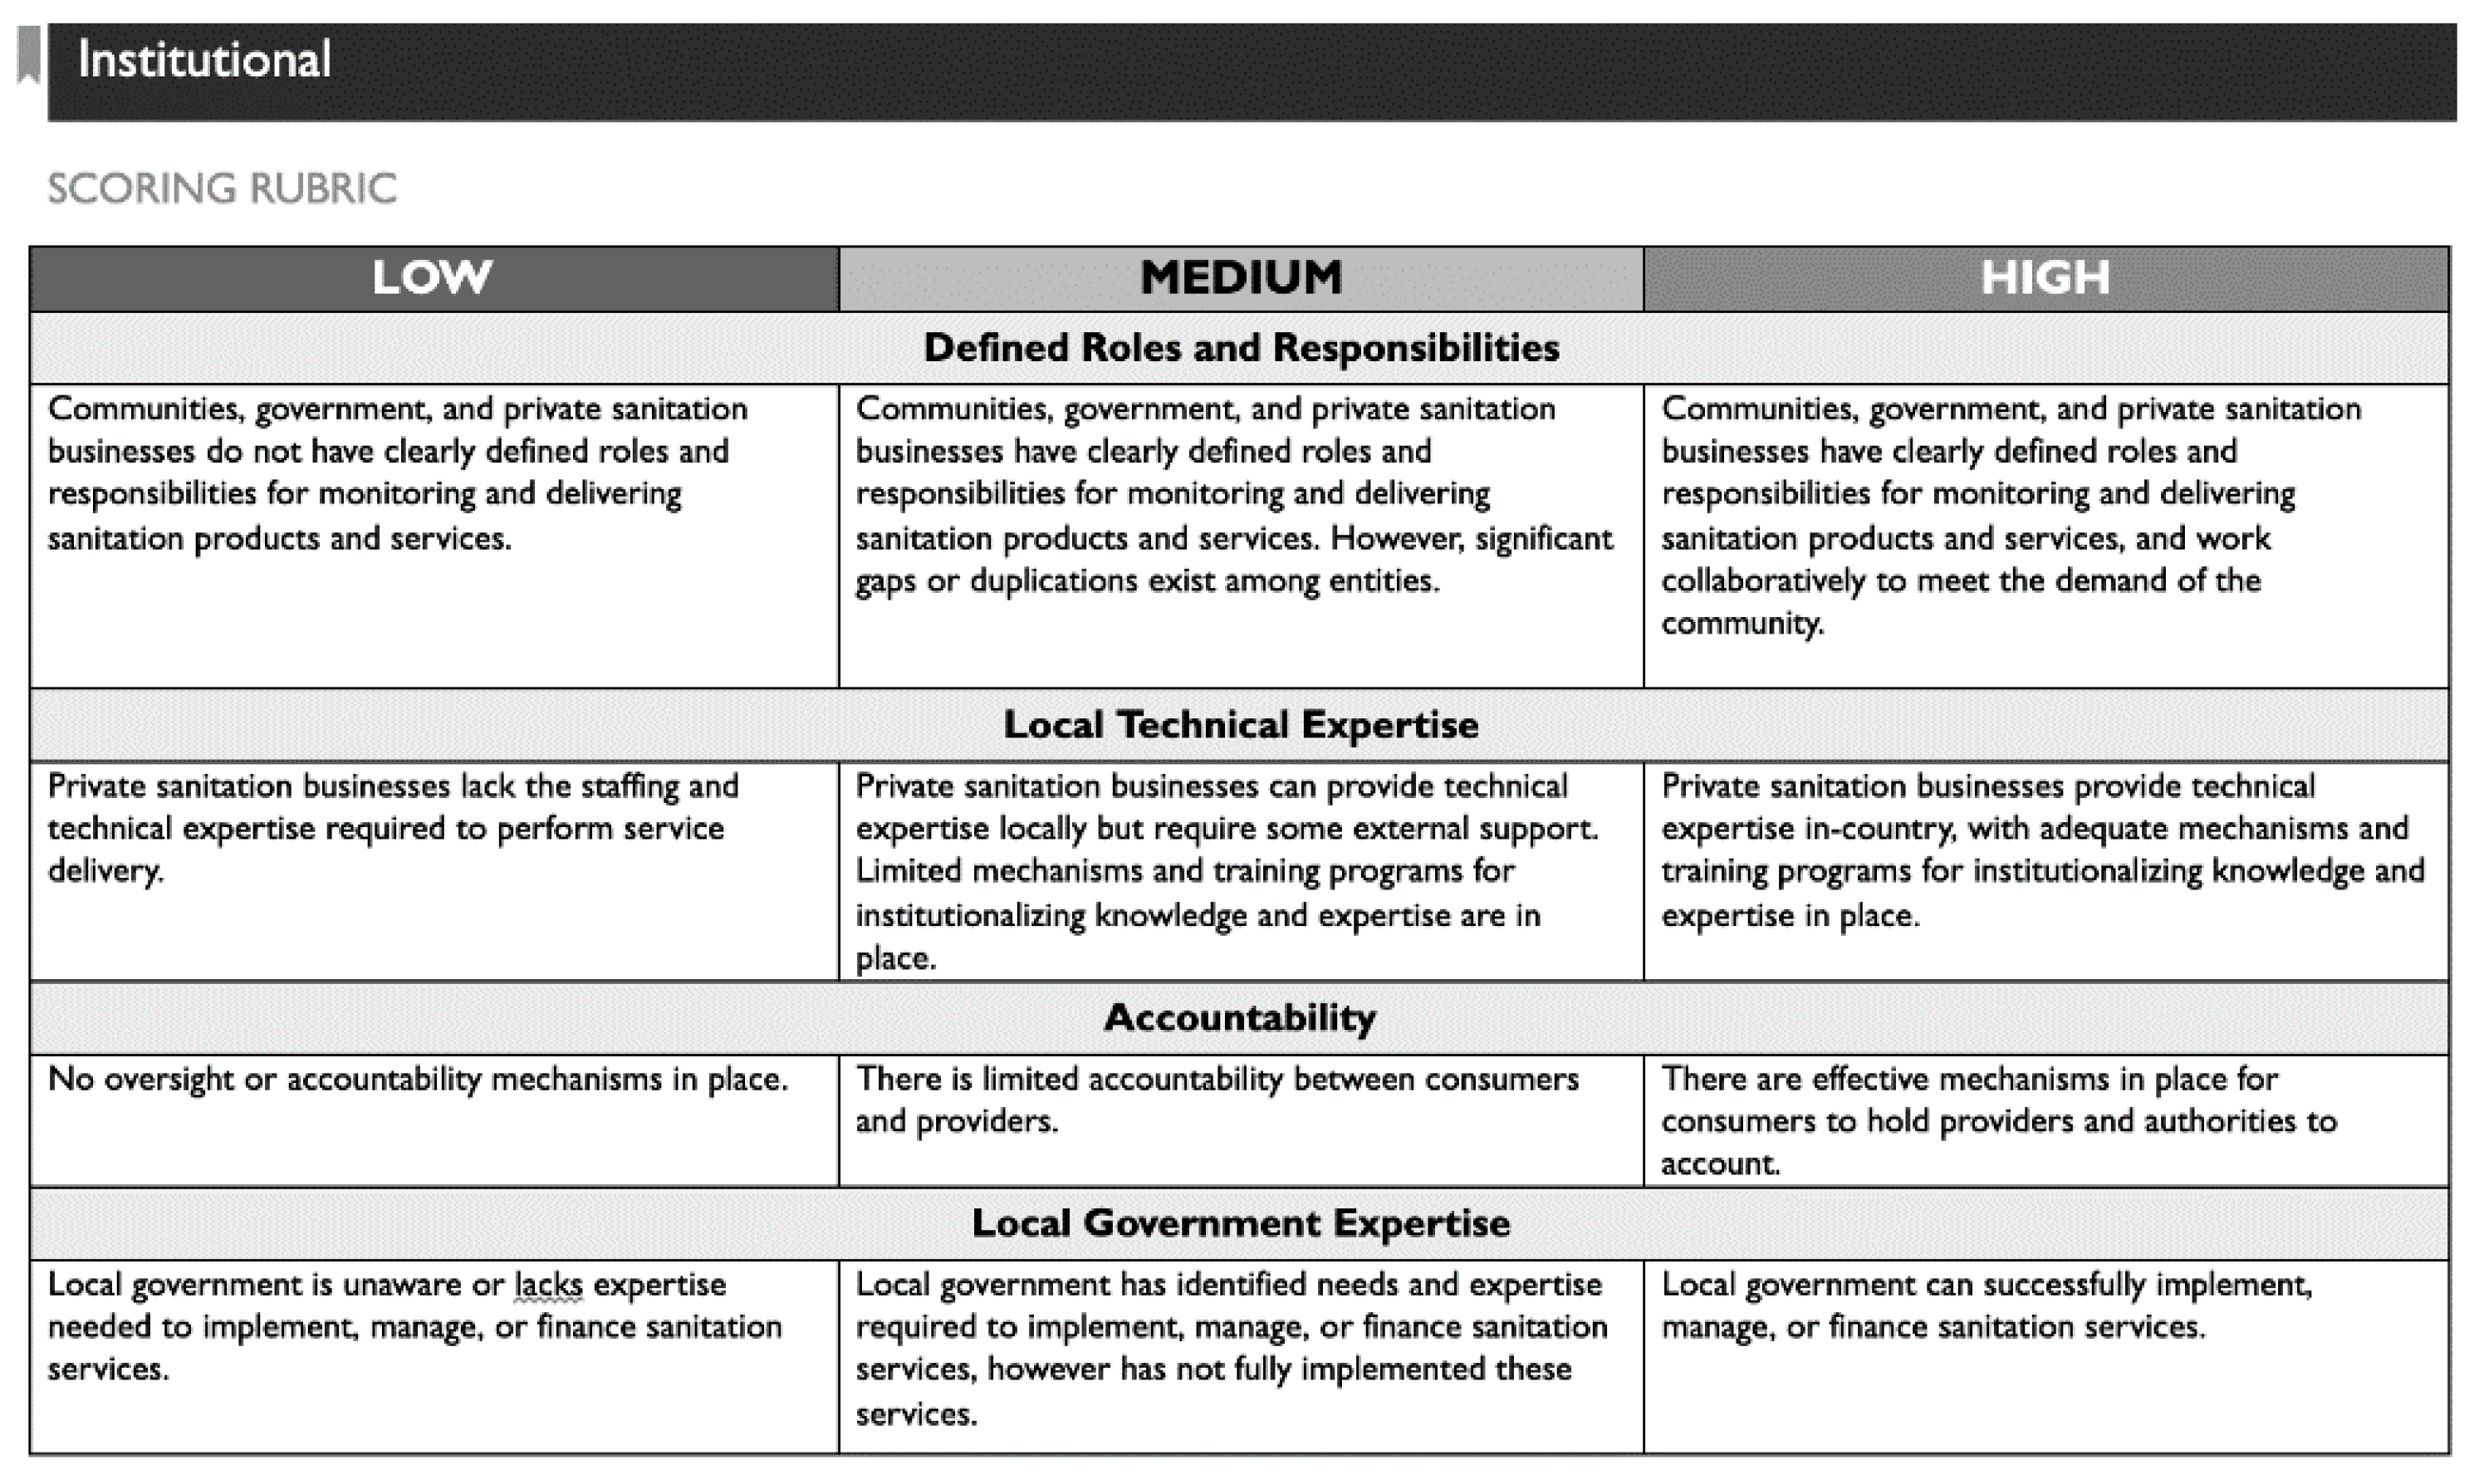
- System-Wide Assessments: System-wide assessments include those that explore system factors, as well as map and assess actor networks. System-wide assessments regularly evaluate broad shifts in the system over time, providing an overall indication of how systems are changing concurrently with an intervention.
2.4.1. Implementation Science
2.4.2. Outcome Mapping
2.4.3. System-Wide Assessments
System-Wide Factor Assessment
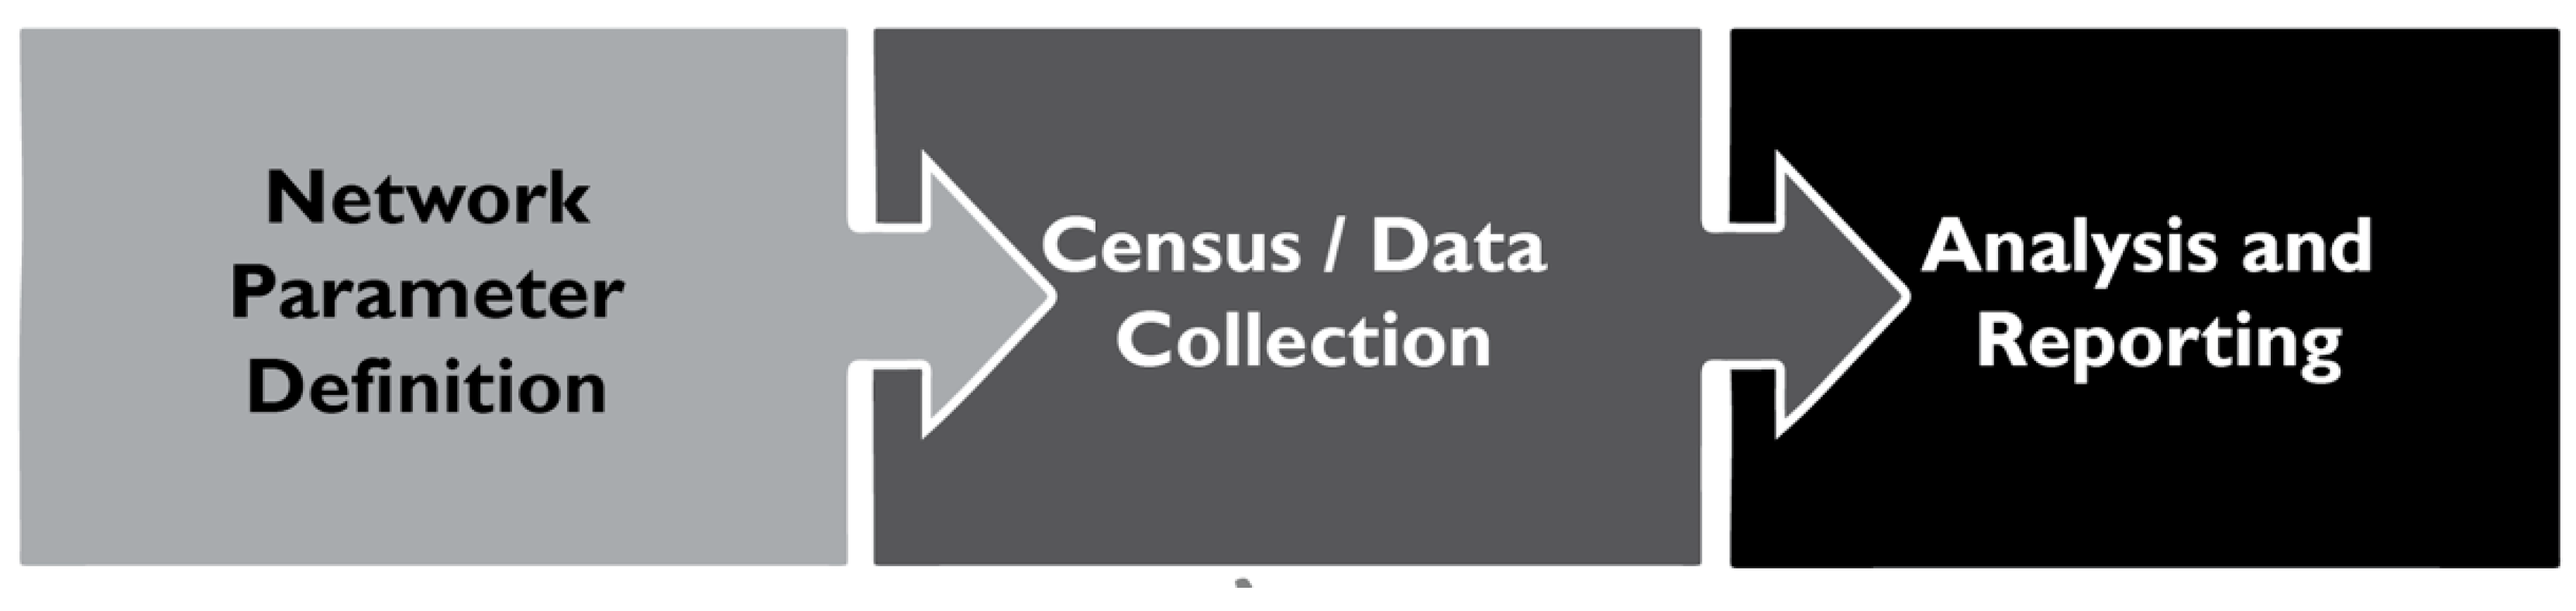
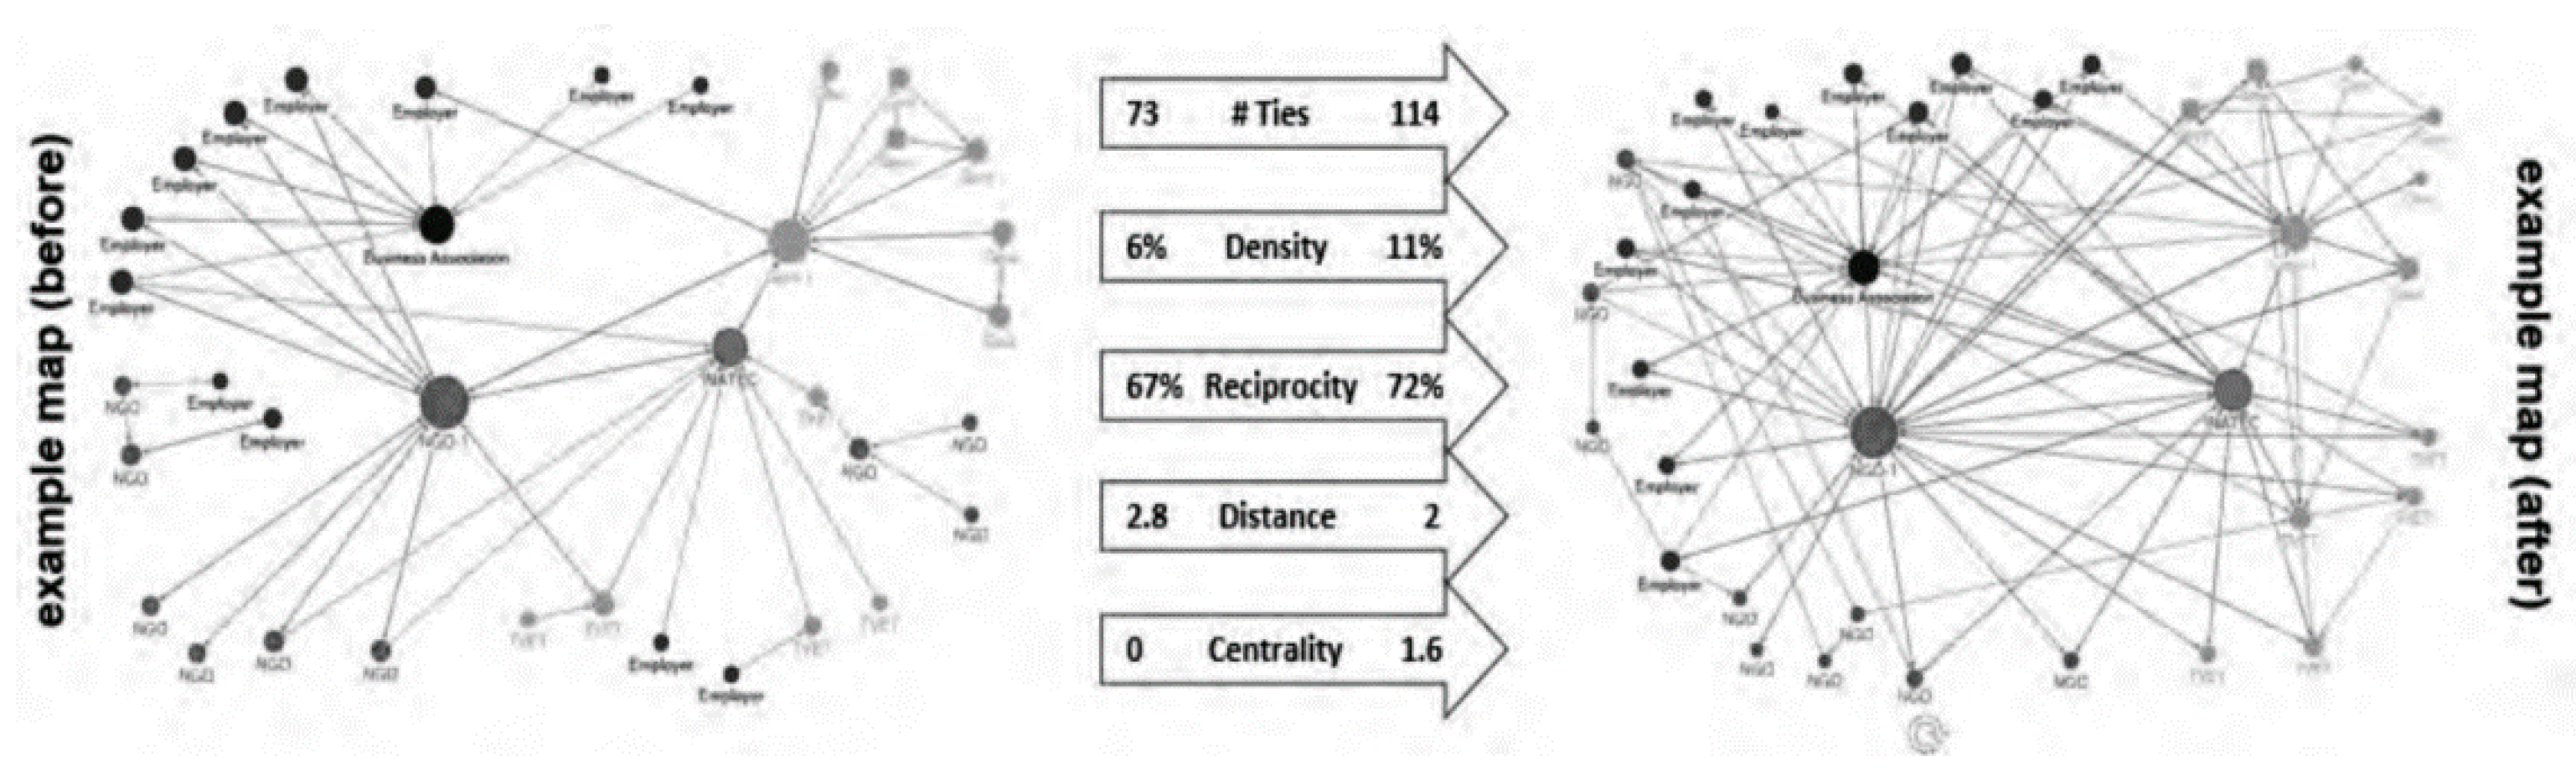
Social Network Analysis
- Network Parameter Definition: Overall network analysis criteria and parameters, such as the overall network boundaries, actor attributes and connection types explored, etc. are defined before data are collected to ensure clear study inputs and outputs;
- Census/Data Collection: Information is collected on each actor and relationship, primarily through standardized interviews, often supplemented by other documentation on actor relationships, such as data sharing or meeting attendee lists and minutes;
- Analysis and Reporting: Based on the information collected, network maps are created and analyzed for constraints and/or opportunities that can be addressed through interventions and/or measured over time. Illustrative constraint/opportunity examples include disconnects between actor groups or clusters, limited centrality of decision-makers, or poor information-sharing among relevant actors.
3. Discussion
Author Contributions
Funding
Acknowledgments
Conflicts of Interest
References
- Butterworth, J.; Warner, J.; Moriarty, P.; Smits, S.; Batchelor, C. Finding practical approaches to Integrated Water Resources Management. Water Altern. 2010, 3, 68–81. [Google Scholar]
- Moriarty, P.; Smits, S.; Butterworth, J.; Franceys, R. Trends in rural water supply: Towards a service delivery approach. Water Altern. 2013, 6, 329–349. [Google Scholar]
- Hope, R.; Foster, T.; Thomson, P. Reducing risks to rural water security in Africa. Ambio 2012, 41, 773–776. [Google Scholar] [CrossRef] [PubMed] [Green Version]
- Foster, T.; Willetts, J.; Lane, M.; Thomson, P.; Katuva, J.; Hope, R. Risk factors associated with rural water supply failure: A 30-year retrospective study of handpumps on the south coast of Kenya. Sci. Total Environ. 2018, 626, 156–164. [Google Scholar] [CrossRef] [PubMed]
- Nagel, C.; Beach, J.; Iribagiza, C.; Thomas, E.A. Evaluating Cellular Instrumentation on Rural Handpumps to Improve Service Delivery—A Longitudinal Study in Rural Rwanda. Environ. Sci. Technol. 2015, 49, 14292–14300. [Google Scholar] [CrossRef] [PubMed]
- Whaley, L.; Cleaver, F. Can ‘functionality’ save the community management model of rural water supply? Water Resour. Rural. Dev. 2017, 9, 56–66. [Google Scholar] [CrossRef]
- RWSN Executive Steering Committee. Myths of the Rural Water Supply Sector; Perspective No 4; RWSN: St Gallen, Switzerland, 2010. [Google Scholar]
- United Nations General Assembly. Resolution adopted by the General Assembly on 25 September 2015. In Proceedings of the Seventieth Session of the United Nations General Assembly, New York, NY, USA, 25 September 2015. [Google Scholar]
- Huston, A.; Moriarty, P. Building Strong WASH Systems for the SDGs: Understanding the WASH System and Its Building Blocks (Report No. IRC-WSS-WP-2018-01); IRC: The Hague, The Netherlands, 2018. [Google Scholar]
- Sustainable Wash Systems Learning Partnership (SWS). Available online: https://microsites.globalwaters.org/SWS (accessed on 28 August 2020).
- Wilson, R.; Geaneh, A.G.; Faris, K.; Admasu, A. ONE WASH National Programme: A Multi-Sectoral SWAp. Addis Ababa, Ethiopia. 2018. Available online: https://www.unicef.org/ethiopia/sites/unicef.org.ethiopia/files/2019-03/OWNP%20Phase%20II%20document.pdf (accessed on 28 August 2020).
- Ministry of Water and Environment. Directorate of Water Development, Rural Water Supply, and Sanitation. National Framework for Operation and Maintenance of Rural Water Infrastructure in Uganda. 2020. Available online: https://www.mwe.go.ug/library/national-framework-operation-and-maintenance-rural-water-infrastructure-uganda (accessed on 28 August 2020).
- Water Services Regulatory Board. Guideline for Provision of Water and Sanitation Services in Rural and Underserved Areas in Kenya. 2019. Available online: https://wasreb.go.ke/downloads/Guideline%20on%20Provision%20of%20Water%20for%20Rural%20and%20Underserved%20Areas.pdf (accessed on 28 August 2020).
- Drinking Water. Available online: https://washdata.org/monitoring/drinking-water (accessed on 28 August 2020).
- USAID. Local Systems: A Framework for Supporting Sustained Development. 2014. Available online: https://www.usaid.gov/sites/default/files/documents/1870/LocalSystemsFramework.pdf (accessed on 31 December 2019).
- USAID. Biodiversity How-to Guide 3: Defining Outcomes & Indicators for Monitoring, Evaluation and Learning in USAID Biodiversity Programming; USAID: Washington, DC, USA, 2016. [Google Scholar]
- USAID. The 5Rs Framework in the Program Cycle. Program Cycle Operational Policy (ADS 201). 2016. Available online: https://usaidlearninglab.org/sites/default/files/resource/files/5rs_techncial_note_ver_2_1_final.pdf (accessed on 28 August 2020).
- USAID. Water and Development Strategy: Implementation Field Guide. 2014. Available online: https://www.usaid.gov/sites/default/files/documents/1865/Strategy_Implementation_Guide_web.pdf (accessed on 28 August 2020).
- WaterAid. Beyond Building Blocks? Identifying and Monitoring Dynamic Drivers of System Performance. Available online: https://washmatters.wateraid.org/publications/beyond-building-blocks-identifying-and-monitoring-dynamic-drivers-of-sector (accessed on 27 November 2019).
- Britt, H. Discussion Note: Complexity-Aware Monitoring; USAID: Washington, DC, USA, 2016. [Google Scholar]
- USAID; Office of Learning Evaluation and Research (LER). Complexity-Aware Monitoring Discussion Note (Brief); USAID: Washington, DC, USA, 2018. [Google Scholar]
- Williams, B. All methods are wrong, some methods are useful. Syst. Think. 2011, 22, 2–7. [Google Scholar]
- USAID. SPACES MERL: Systems and Complexity White Paper. 2016. Available online: https://pdf.usaid.gov/pdf_docs/PA00M7QZ.pdf (accessed on 28 August 2020).
- Hummelbrunner, R.; Britt, H. Synchronizing Monitoring with the Pace of Change in Complexity: A Complexity-Aware Monitoring Principle; USAID: Washington, DC, USA, 2014. [Google Scholar]
- USAID. Systemic Thinking for Monitoring: Attending to Interrelationships, Perspectives, and Boundaries. 2014. Available online: https://usaidlearninglab.org/sites/default/files/resource/files/systemic_monitoring_ipb_2014-09-25_final-ak_1.pdf (accessed on 28 August 2020).
- Earl, S.; Carden, F.; Smutylo, T. Outcome Mapping: Building Learning and Reflection into Development Programs; IDRC Books: Ottawa, ON, Canada, 2014. [Google Scholar]
- Shelton, R.C.; Cooper, B.R.; Stirman, S.W. The sustainability of evidence-based interventions and practices in public health and health care. Annu. Rev. Public Health 2018, 39, 55–76. [Google Scholar] [CrossRef] [PubMed] [Green Version]
- Curran, G.M.; Bauer, M.; Mittman, B.; Pyne, J.M.; Stetler, C. Effectiveness-implementation hybrid designs: Combining elements of clinical effectiveness and implementation research to enhance public health impact. Med. Care 2012, 50, 217–226. [Google Scholar] [CrossRef] [PubMed] [Green Version]
- Thomas, E.A.; Needoba, J.; Kaberia, D.; Butterworth, J.; Adams, E.C.; Oduor, P.; Macharia, D.; Mitheu, F.; Mugo, R.; Nagel, C. Quantifying increased groundwater demand from prolonged drought in the East African Rift Valley. Sci. Total Environ. 2019, 666, 1265–1272. [Google Scholar] [CrossRef] [PubMed]
- Bernal, J.L.; Cummins, S.; Gasparrini, A. Interrupted time series regression for the evaluation of public health interventions: A tutorial. Int. J. Epidemiol. 2017, 46, 348–355. [Google Scholar] [CrossRef] [PubMed] [Green Version]
- Earl, S.; Carden, F. Learning from complexity: The international development research centre’s experience with outcome mapping. Develop. Pract. 2002, 12, 518–524. [Google Scholar] [CrossRef]
- Sanitation and Water for All: Five Building Blocks. Available online: https://www.sanitationandwaterforall.org/sites/default/files/2020-02/Five%20building%20blocks.pdf (accessed on 28 August 2020).
- WASH System Building Block Assessment Tool. Available online: https://www.ircwash.org/tools/wash-system-building-block-assessment-tool (accessed on 28 August 2020).
- WASH BAT: WASH Bottleneck Analysis Tool. Available online: https://www.washbat.org/ (accessed on 28 August 2020).
- UNICEF. Sustainability Checks: Guidance to Design and Implement Sustainability Monitoring in WASH. 2017. Available online: https://www.unicef.org/wash/files/WASH_Guidance-for-Sustainability-Checks_.pdf (accessed on 28 August 2020).
- WASH Alliance Sustainability Portal. Available online: https://wash-alliance.org/our-approach/sustainability (accessed on 28 August 2020).
- Harper, D. Using Social Network Analysis in WASH Programs. Sustainable WASH Systems Learning Partnership. 2020. Available online: https://www.globalwaters.org/sites/default/files/using_social_network_analysis_in_wash_programs.pdf (accessed on 28 August 2020).
- Fromer, R.; McDermott, M. Network Analysis and Systems Assessment in the Rural Sanitation and Hygiene Sector in Cambodia. Sustainable WASH Systems Learning Partnership. 2018. Available online: https://www.globalwaters.org/sites/default/files/SWS%20research%20brief_Cambodia_Network%20Analysis.pdf (accessed on 28 August 2020).
- LINC. Ethiopia Midterm Organizational Network Analysis Report. Sustainable WASH Systems Learning Partnership. 2020. Available online: https://www.globalwaters.org/sites/default/files/ethiopia_midterm_organizational_network_analysis_report.pdf (accessed on 28 August 2020).


© 2020 by the authors. Licensee MDPI, Basel, Switzerland. This article is an open access article distributed under the terms and conditions of the Creative Commons Attribution (CC BY) license (http://creativecommons.org/licenses/by/4.0/).
Share and Cite
Hollander, D.; Ajroud, B.; Thomas, E.; Peabody, S.; Jordan, E.; Javernick-Will, A.; Linden, K. Monitoring Methods for Systems-Strengthening Activities Toward Sustainable Water and Sanitation Services in Low-Income Settings. Sustainability 2020, 12, 7044. https://0-doi-org.brum.beds.ac.uk/10.3390/su12177044
Hollander D, Ajroud B, Thomas E, Peabody S, Jordan E, Javernick-Will A, Linden K. Monitoring Methods for Systems-Strengthening Activities Toward Sustainable Water and Sanitation Services in Low-Income Settings. Sustainability. 2020; 12(17):7044. https://0-doi-org.brum.beds.ac.uk/10.3390/su12177044
Chicago/Turabian StyleHollander, Daniel, Brittany Ajroud, Evan Thomas, Shawn Peabody, Elizabeth Jordan, Amy Javernick-Will, and Karl Linden. 2020. "Monitoring Methods for Systems-Strengthening Activities Toward Sustainable Water and Sanitation Services in Low-Income Settings" Sustainability 12, no. 17: 7044. https://0-doi-org.brum.beds.ac.uk/10.3390/su12177044