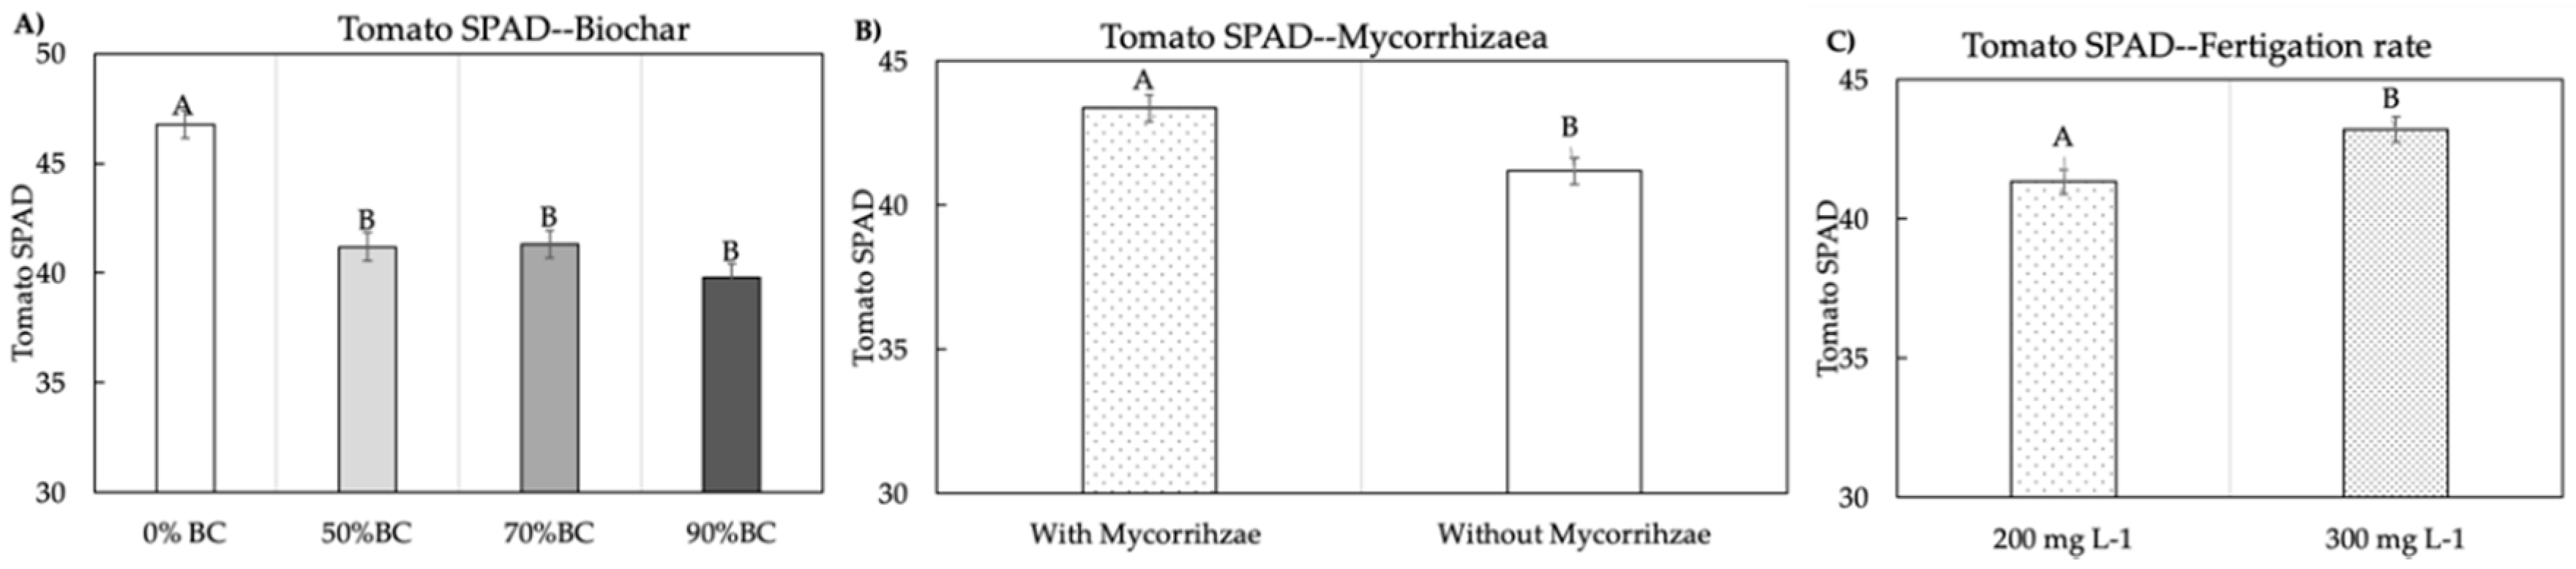
Figure 1.
The effects of % biochar rates (BC; A), mycorrhizae (B), and fertigation (C) on tomato soil-plant analyses development (SPAD). The same letter indicates not significantly different according to Tukey HSD multiple comparison at p ≤ 0.05.
Figure 1.
The effects of % biochar rates (BC; A), mycorrhizae (B), and fertigation (C) on tomato soil-plant analyses development (SPAD). The same letter indicates not significantly different according to Tukey HSD multiple comparison at p ≤ 0.05.
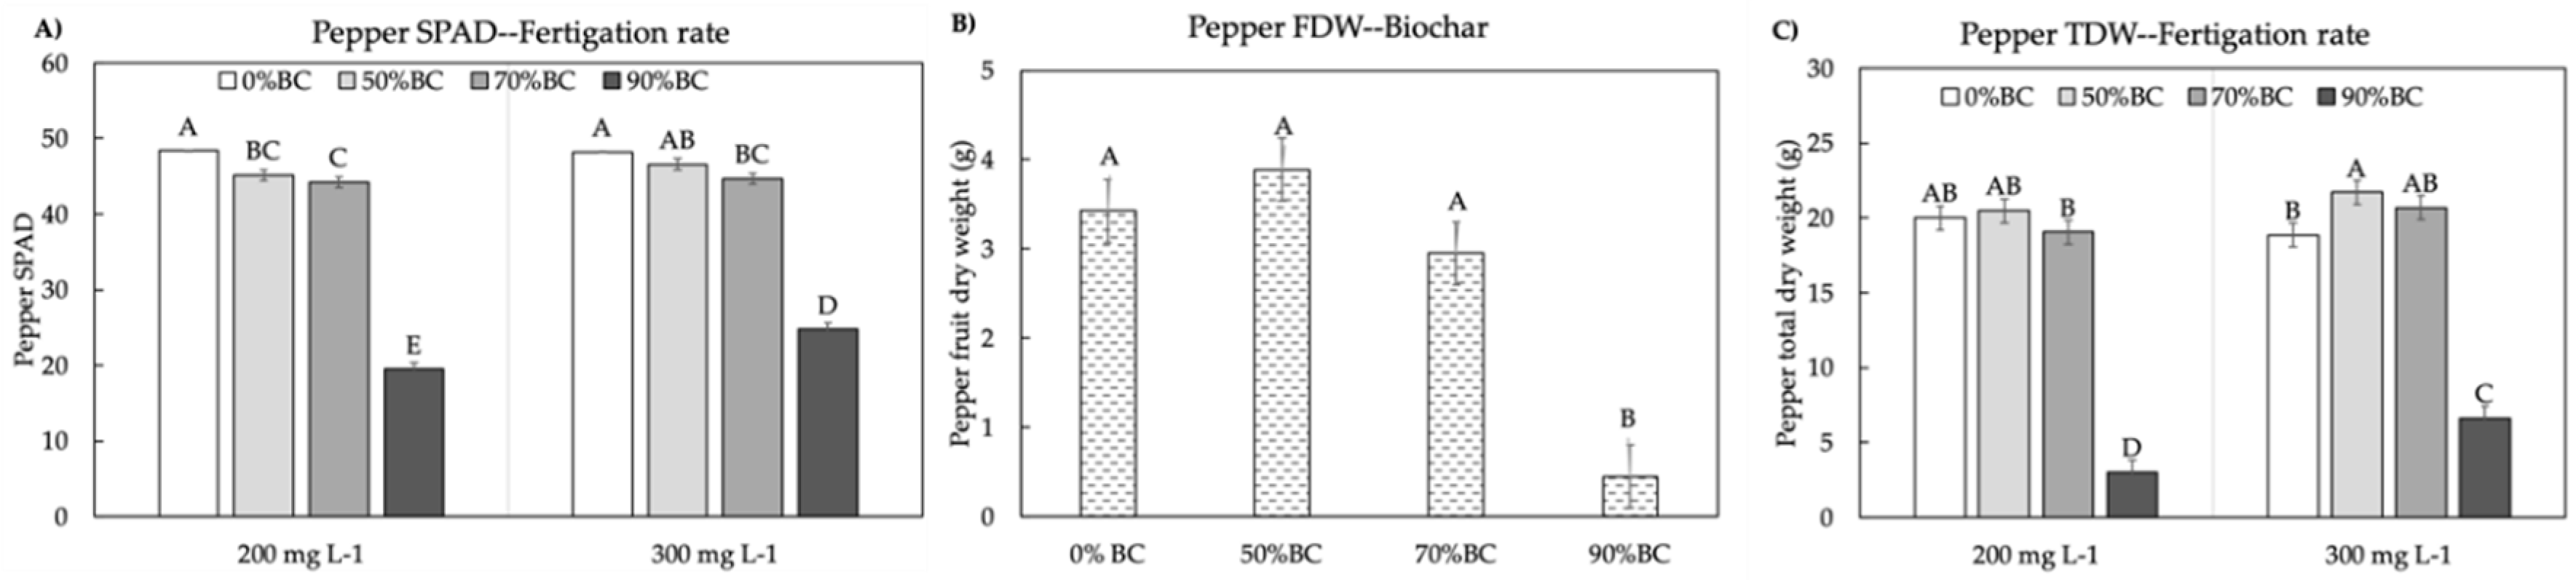
Figure 2.
The effects of biochar on pepper soil-plant analyses development (SPAD) (A), fruit dry weight (FDW; B) and total dry weight (TDW; C). The same letter indicates not significantly different according to Tukey HSD multiple comparison at p ≤ 0.05.
Figure 2.
The effects of biochar on pepper soil-plant analyses development (SPAD) (A), fruit dry weight (FDW; B) and total dry weight (TDW; C). The same letter indicates not significantly different according to Tukey HSD multiple comparison at p ≤ 0.05.
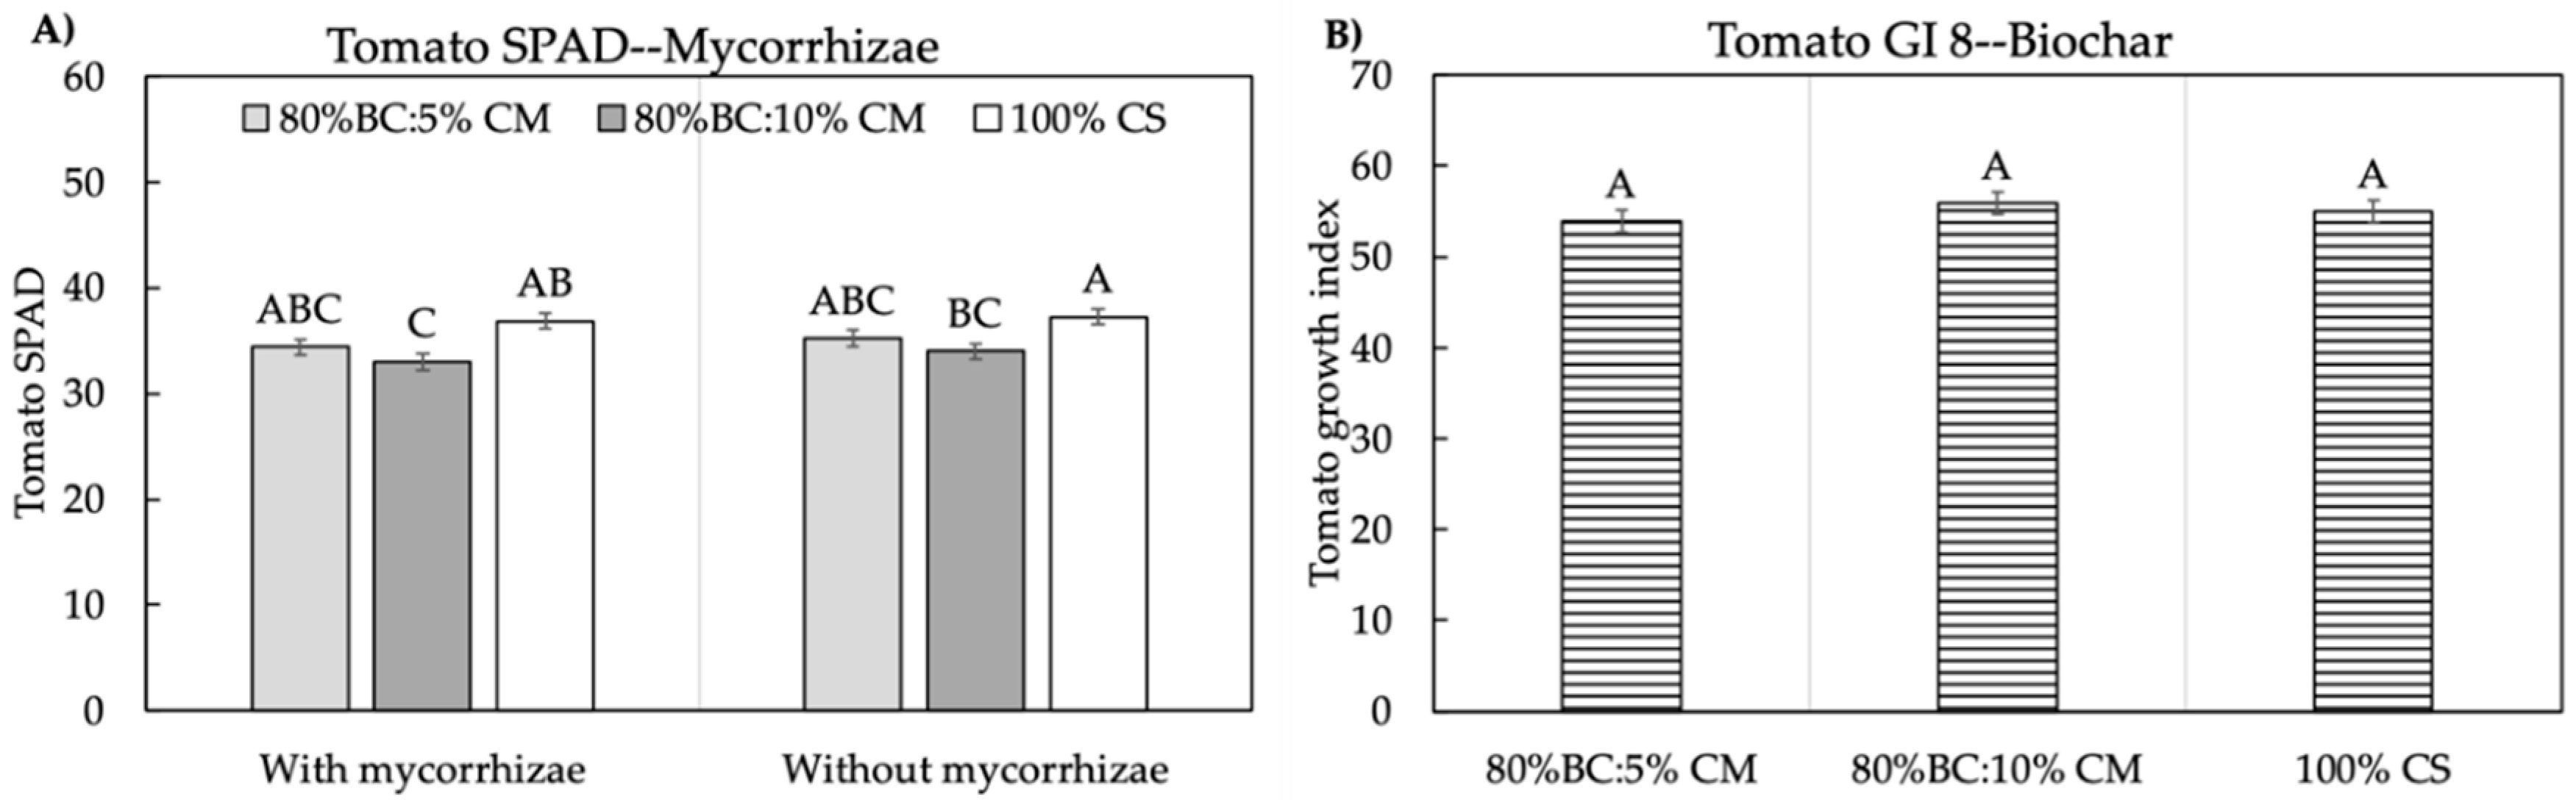
Figure 3.
The effects of mycorrhizae on tomato SPAD (A) and mixes on tomato growth index at the eighth week after transplanting (GI 8; B). The same letter indicates not significantly different according to Tukey HSD multiple comparison at p ≤ 0.05.
Figure 3.
The effects of mycorrhizae on tomato SPAD (A) and mixes on tomato growth index at the eighth week after transplanting (GI 8; B). The same letter indicates not significantly different according to Tukey HSD multiple comparison at p ≤ 0.05.
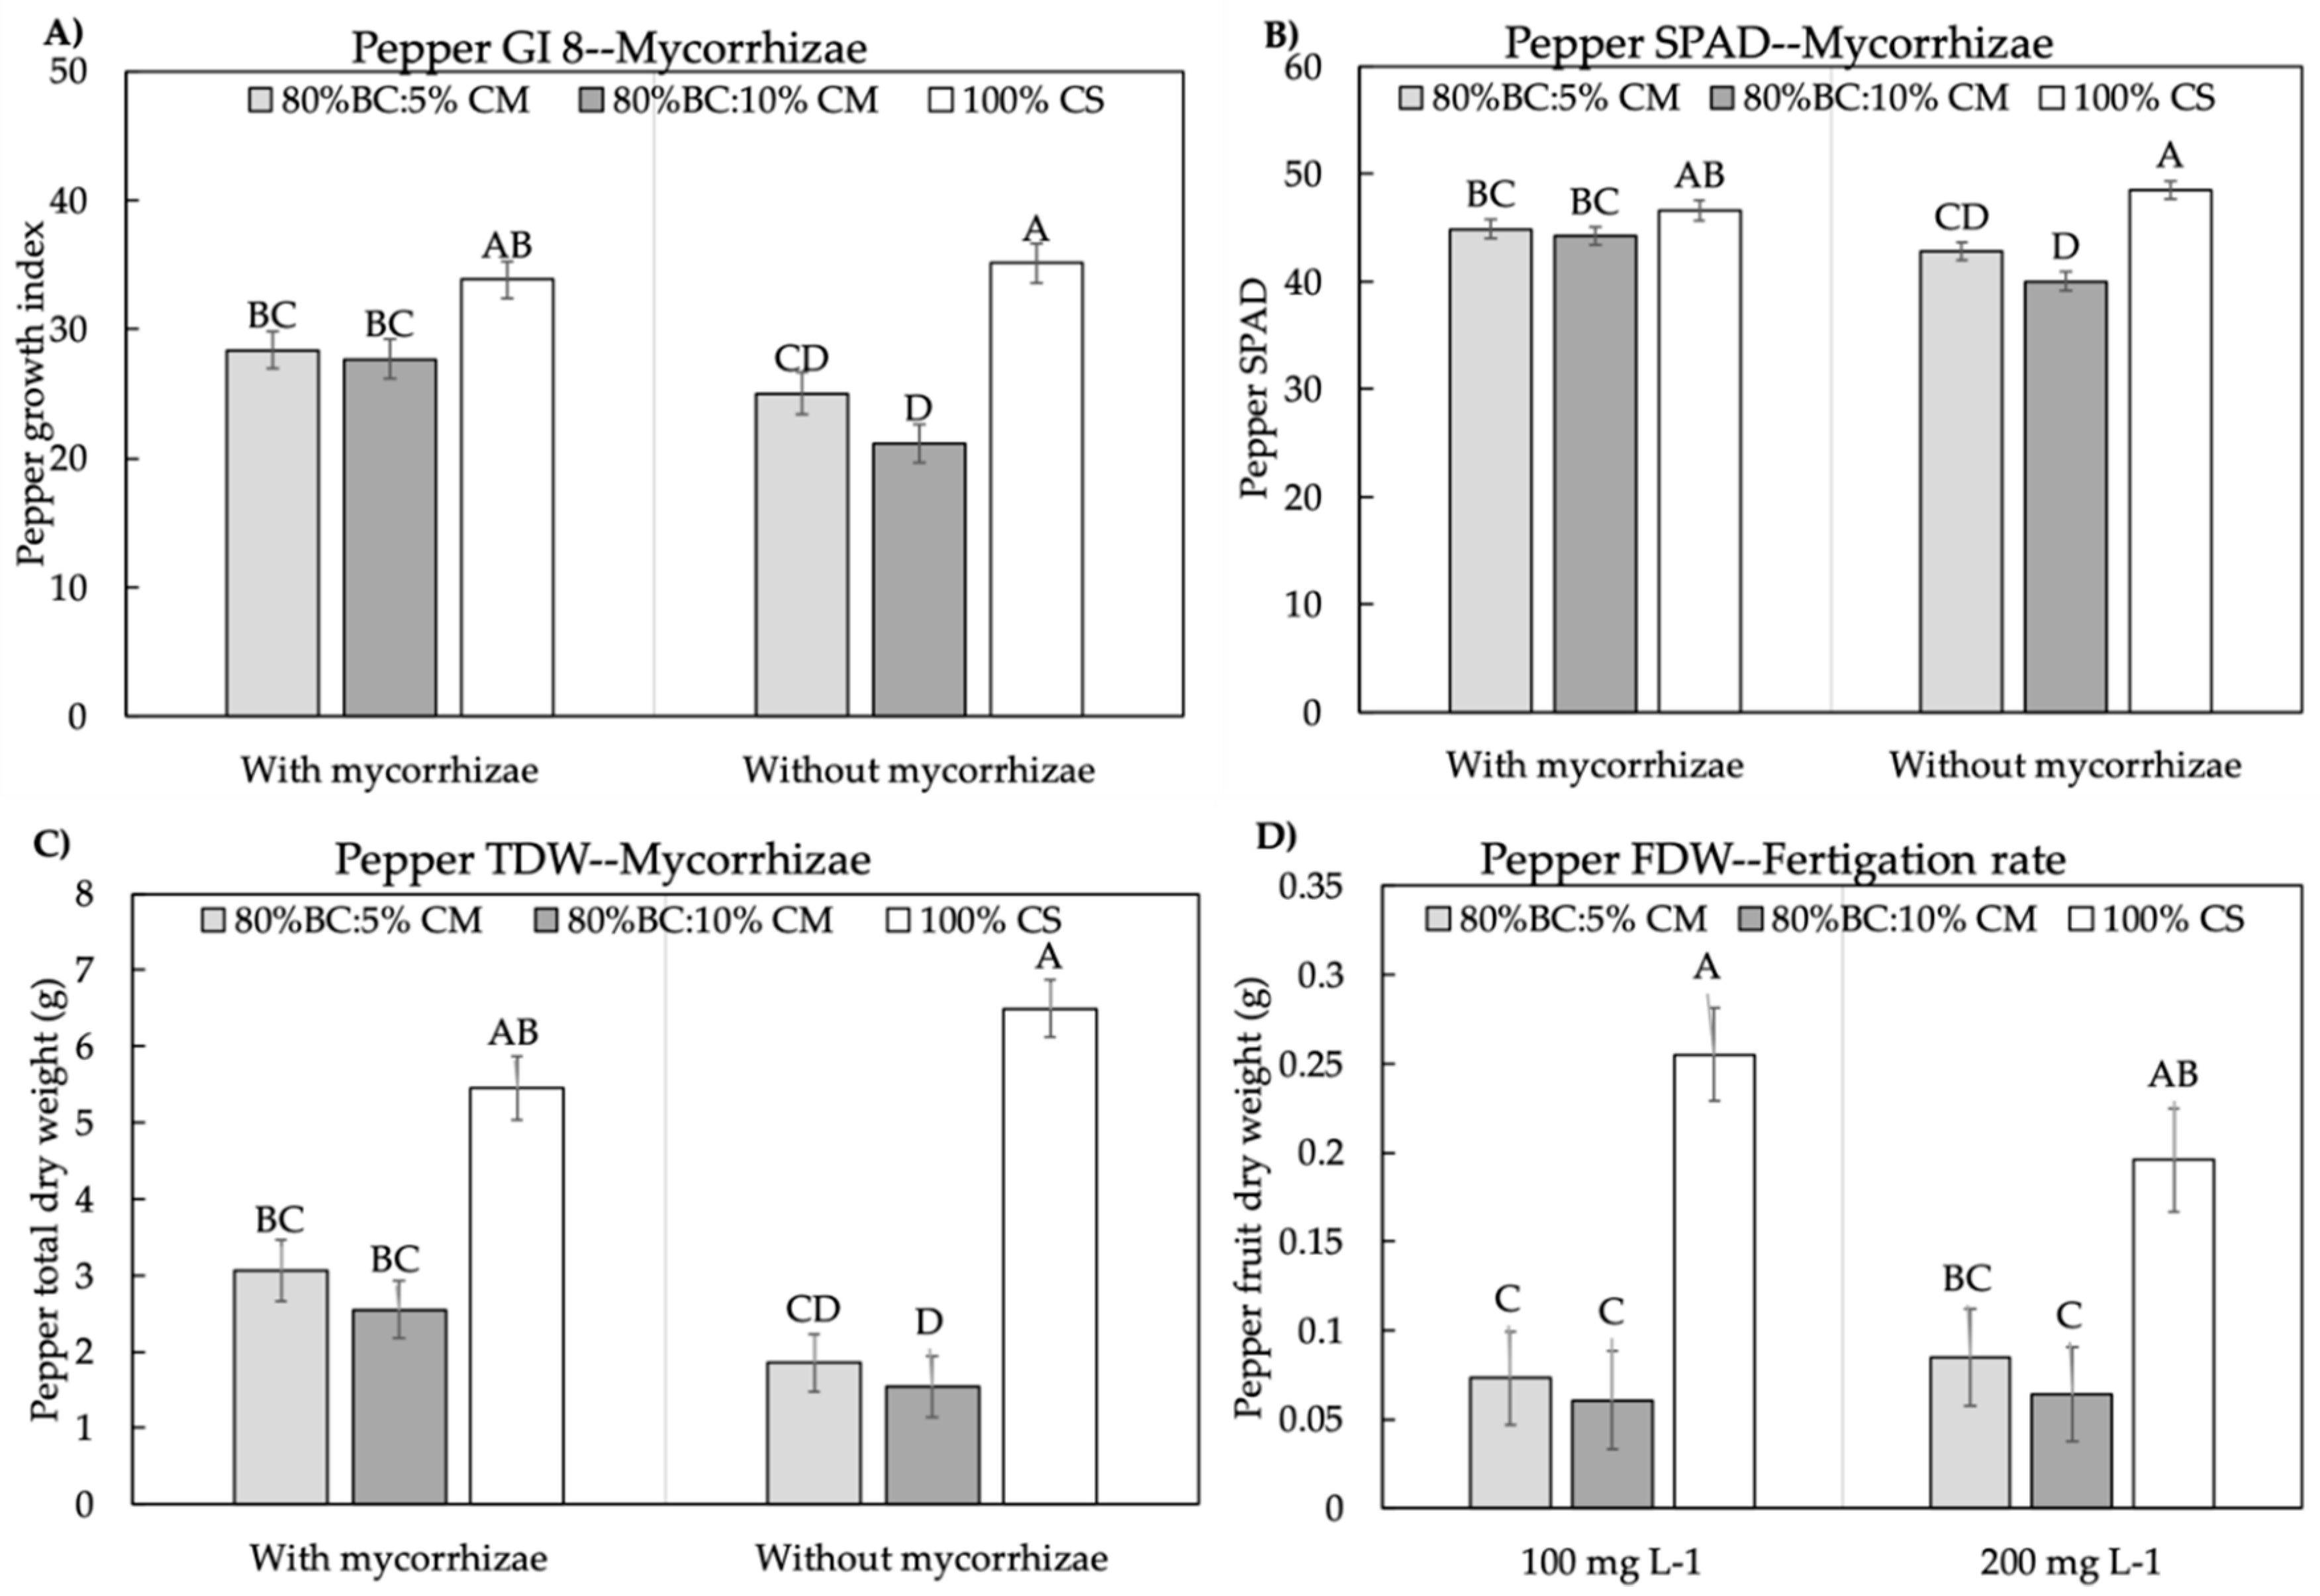
Figure 4.
The effects of mycorrhizae on pepper growth index at the eighth week after transplanting (GI 8; A), soil-plant analyses development (SPAD) (B), total dry weight (C), and the effects of mixes on pepper plant fruit dry weight (D). The same letter indicates not significantly different according to Tukey HSD multiple comparisons at p ≤ 0.05.
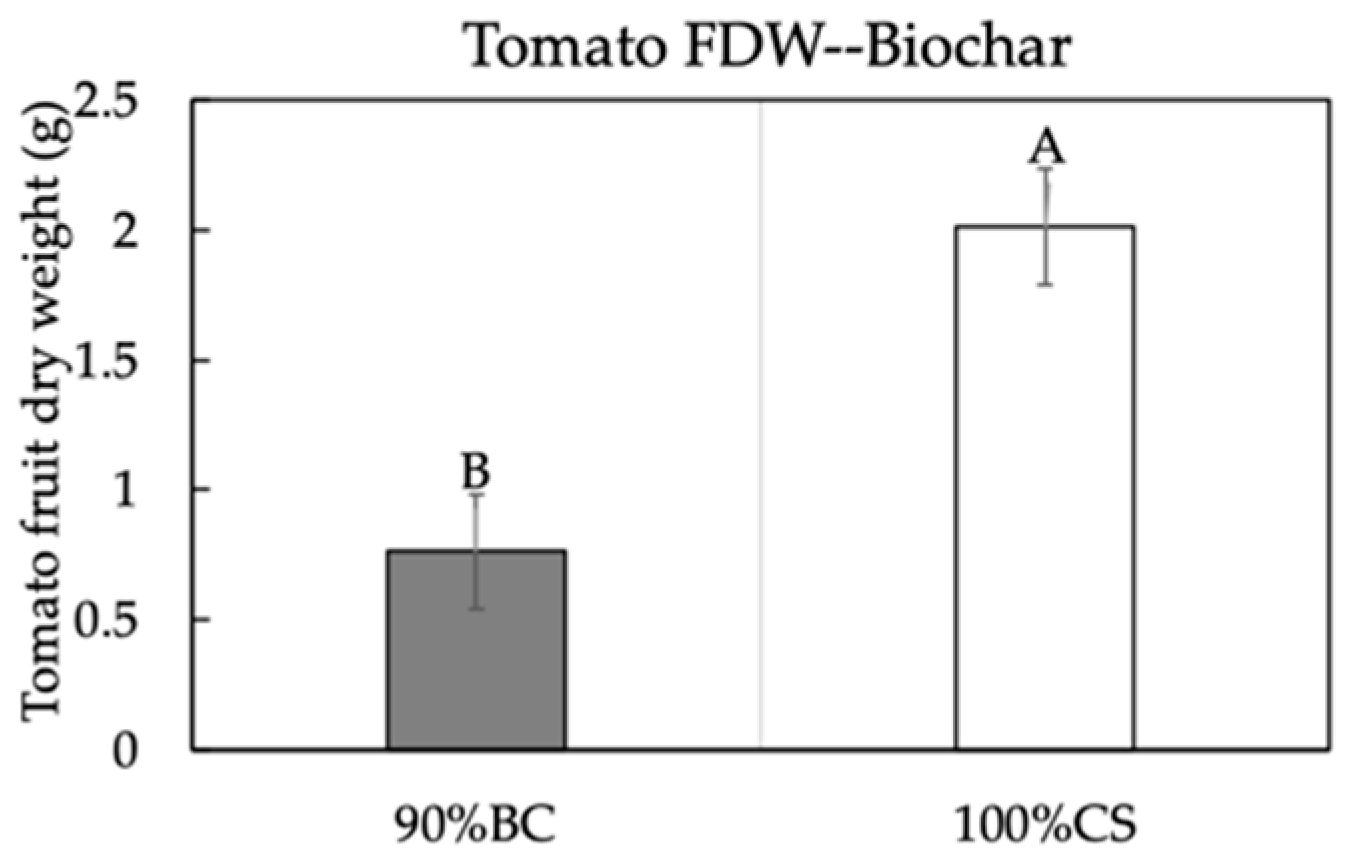
Figure 5.
The effects of biochar on tomato plants fruit dry weight (FDW). The same letter indicates not significantly different according to Tukey HSD multiple comparisons at p ≤ 0.05.
Figure 5.
The effects of biochar on tomato plants fruit dry weight (FDW). The same letter indicates not significantly different according to Tukey HSD multiple comparisons at p ≤ 0.05.
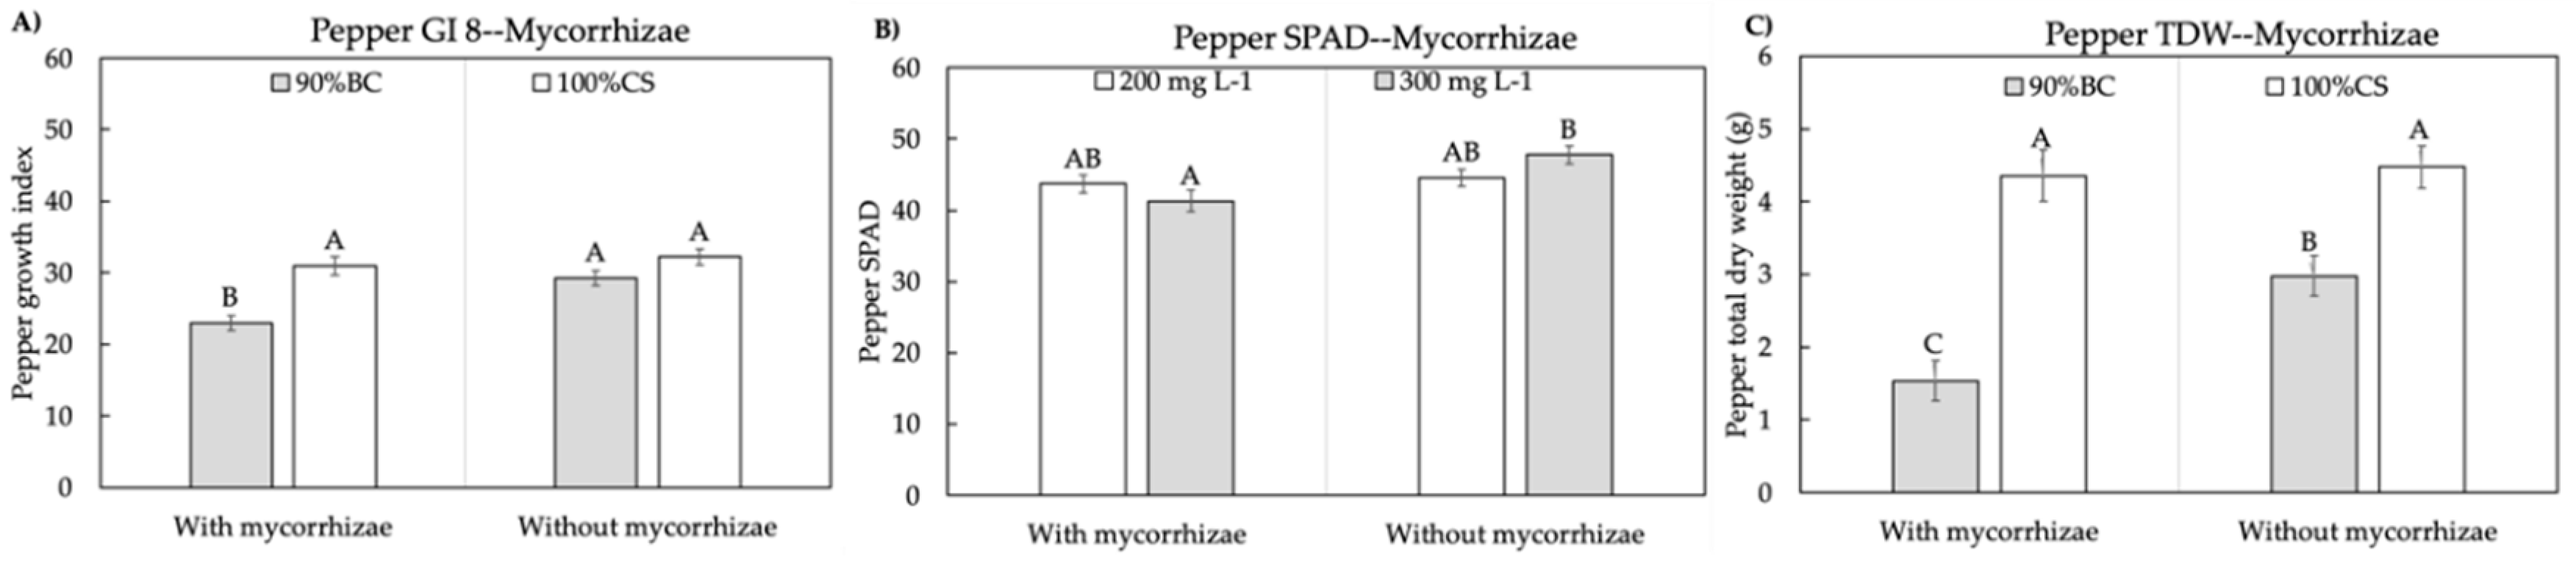
Figure 6.
The effects of mycorrhizae on pepper plants growth index at the eighth week after transplanting (GI 8; A), SPAD (B), and total dry weight (TDW; C). The same letter indicates not significantly different according to Tukey HSD multiple comparisons at p ≤ 0.05.
Figure 6.
The effects of mycorrhizae on pepper plants growth index at the eighth week after transplanting (GI 8; A), SPAD (B), and total dry weight (TDW; C). The same letter indicates not significantly different according to Tukey HSD multiple comparisons at p ≤ 0.05.
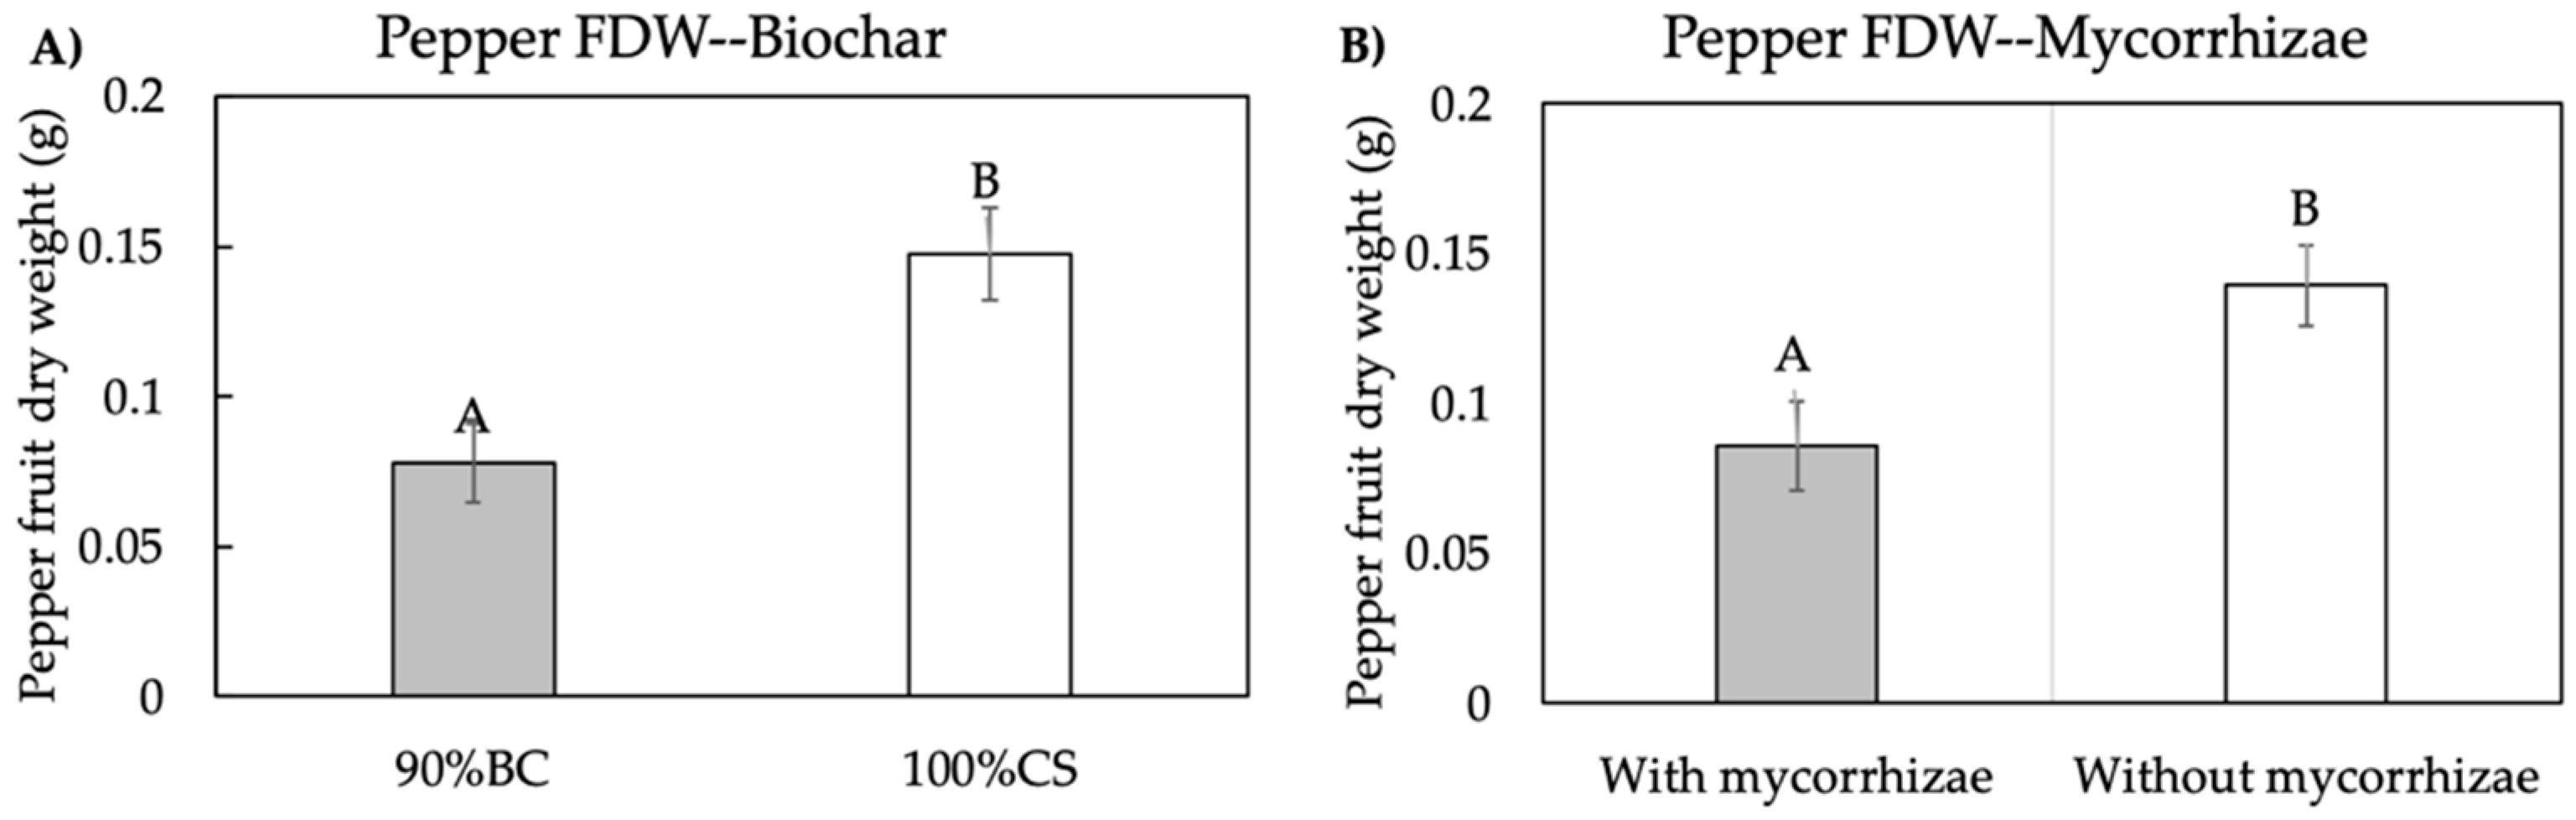
Figure 7.
The effects of biochar (A) and mycorrhizae (B) on pepper plant fruit dry weight (FDW). The same letter indicates not significantly different according to Tukey HSD multiple comparisons at p ≤ 0.05.
Figure 7.
The effects of biochar (A) and mycorrhizae (B) on pepper plant fruit dry weight (FDW). The same letter indicates not significantly different according to Tukey HSD multiple comparisons at p ≤ 0.05.
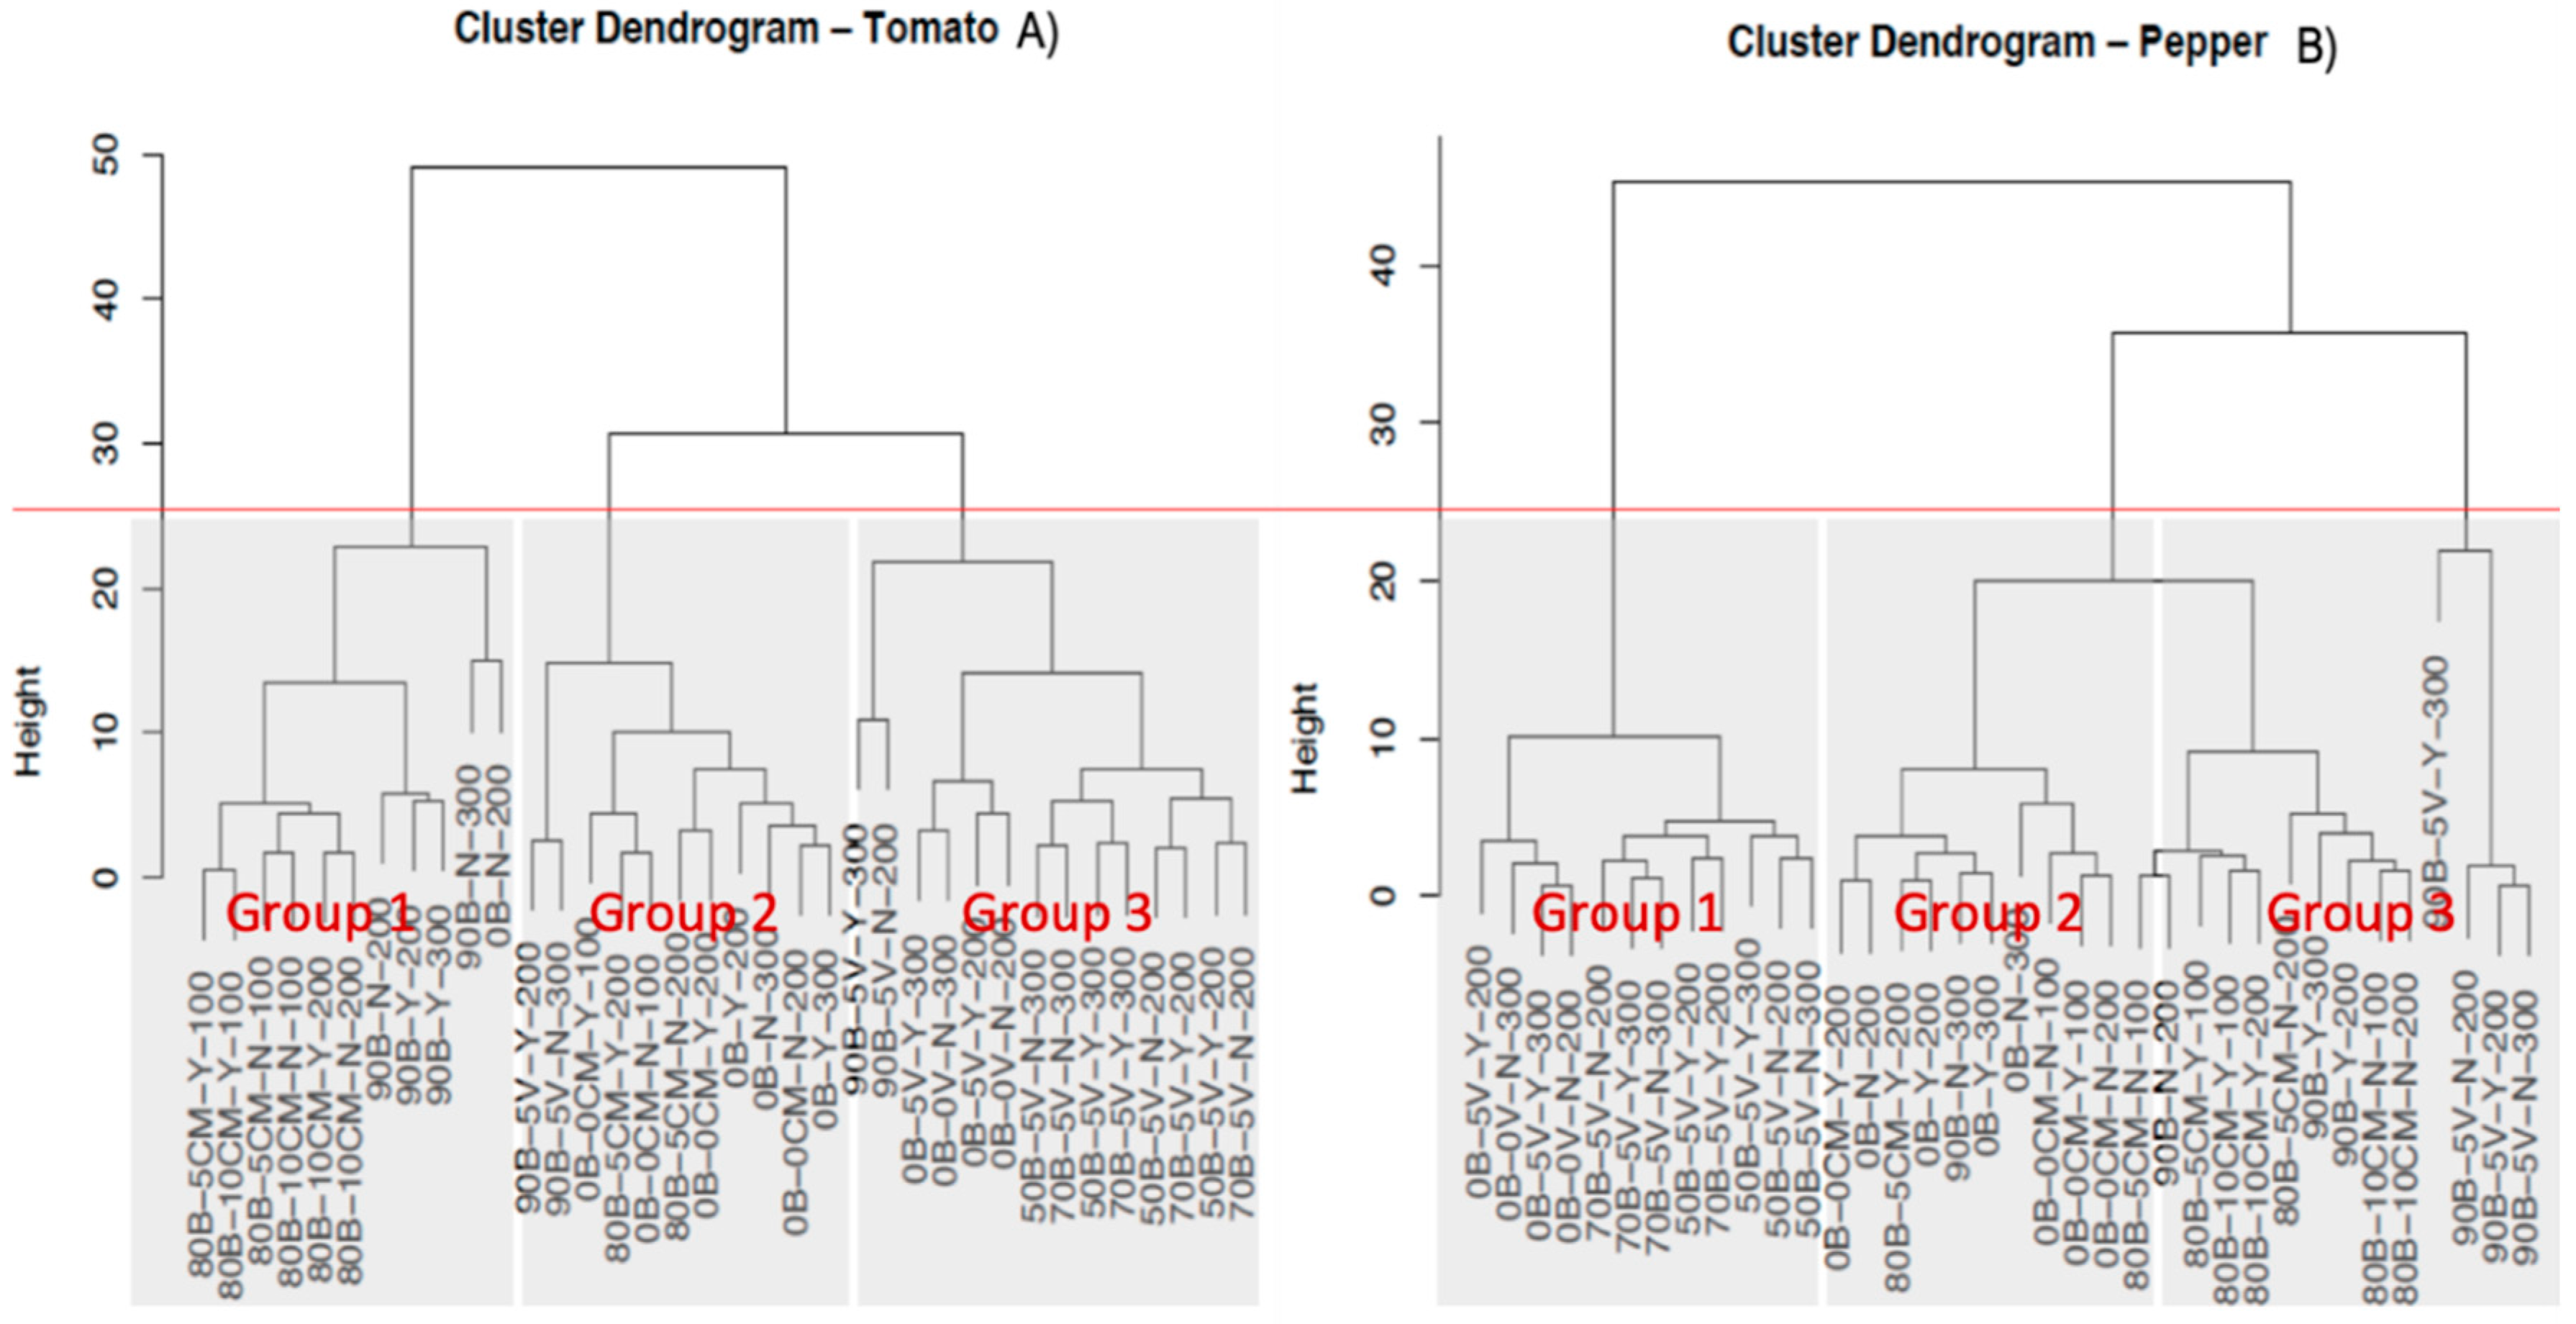
Figure 8.
The cluster dendrogram for tomato (A) and pepper (B) plants. Group 1, 2, and 3 in tomato (A) represent 11 treatments with high biochar rates (BC, 80% or 90%), 11 treatments with low composts rate (0% or 5%), and 14 treatments with BC−5% vermicompost (VC) mixes, respectively. Group 1, 2, and 3 in pepper (B) represent 12 treatments with BC-VC mixes, 20 treatments with composts (chicken manure compost (CM) and VC), and 4 treatments with 90% BC–5% VC mixes, respectively. Red line indicates the height at 25 in the cluster dendrogram.
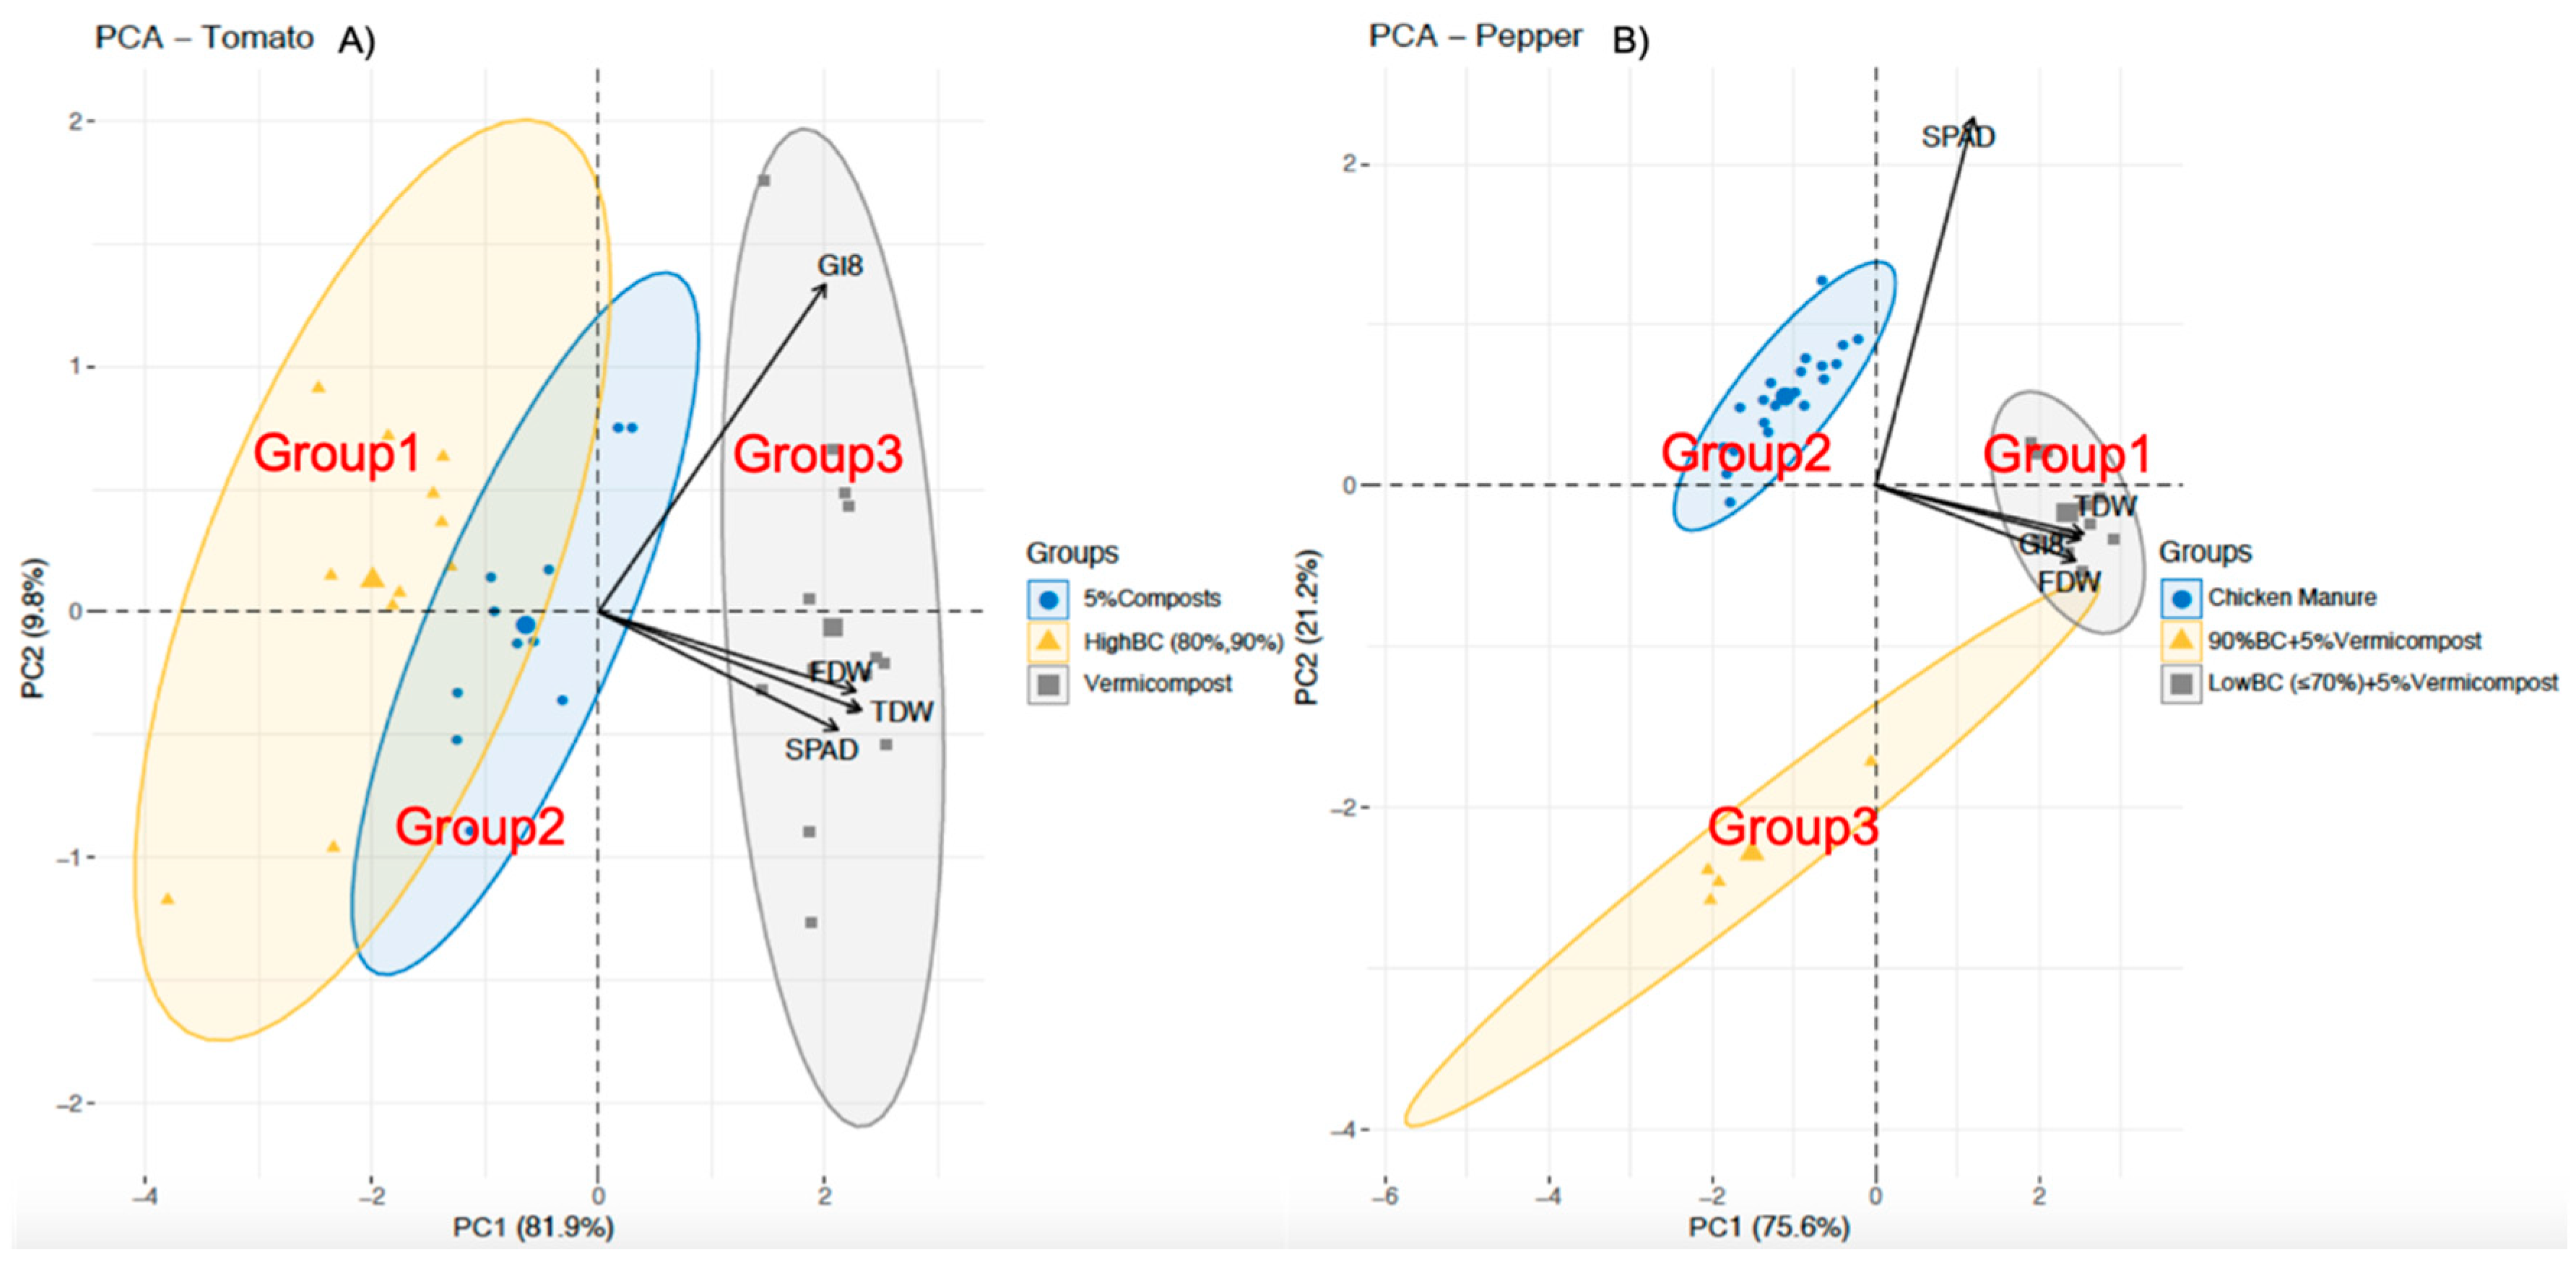
Figure 9.
Principal component analysis (PCA) depicting the relationships between selected variables and treatment factors with tomato (A) and pepper (B). Selected variables are displayed by arrows and include plant growth parameters—soil-plant analyses development (SPAD), growth index (GI), fruit dry weight (FDW), and total dry weight (TDW). Treatment factors are displayed by filled blue circles: 5% composts (group 2 for tomato; A), or chicken manure compost (CM, group 2 for pepper; B); orange triangle: high biochar 80%, 90% (BC, group 1 for tomato; A) or 90% BC + 5% vermicompost (VC, group 3 for pepper; B); and grey square: VC (group 3 for tomato; A) or low BC (≤70%) + 5% VC (group 1 for pepper; B).
Table 1.
Physical (total porosity (TP, %), container capacity (CC, %), air space (AS, %), and bulk density (BD, g cm
−3)) and chemical (pH, EC) properties of biochar, vermicompost, chicken manure, and commercial peat moss substrate used in this study according to previous studies [
24,
25].
Table 1.
Physical (total porosity (TP, %), container capacity (CC, %), air space (AS, %), and bulk density (BD, g cm
−3)) and chemical (pH, EC) properties of biochar, vermicompost, chicken manure, and commercial peat moss substrate used in this study according to previous studies [
24,
25].
| Components | pH | EC (ds m−1) | TP (%) | CC (%) | AS (%) | BD (g cm−3) | Reference |
|---|
| Biochar | 11.2 | 2.0 | 85 | 60 | 24 | 0.15 | [25] |
| Vermicompost | 4.8 | 6.7 | 75 | 72 | 3 | 0.38 | [25] |
| Chicken manure | 7.5 | 32.9 | 64 | 60 | 4 | 0.62 | [25] |
| Commercial Substrate | - | - | 84 | 63 | 22 | 0.11 | [24] |
Table 2.
Nutrient content of the biochar, vermicompost, and chicken manure used in this study according to the work conducted by Huang et al. [
25].
Table 2.
Nutrient content of the biochar, vermicompost, and chicken manure used in this study according to the work conducted by Huang et al. [
25].
| | N | P | K | Ca | Mg | S | Fe |
|---|
| Components | (%) | (mg kg−1) |
|---|
| Biochar | 0.23 | 456 | 6362 | 27,507 | 1299 | 231 | 2039 |
| Vermicompost | 2.43 | 4901 | 3714 | 25,841 | 3819 | 5996 | 4835 |
| Chicken manure | 2.03 | 17,315 | 28,565 | 71,239 | 11,513 | 7169 | 3703 |
Table 3.
List of treatments used in experiment 1 including biochar, vermicompost, and commercial peat moss-based substrate, mycorrhizae (Y/N = with/without), and fertigation rate (mg L−1 N).
Table 3.
List of treatments used in experiment 1 including biochar, vermicompost, and commercial peat moss-based substrate, mycorrhizae (Y/N = with/without), and fertigation rate (mg L−1 N).
| Treatment | Biochar (%, vol.) | Vermicompost (%, vol.) | Commercial Substrate (%, vol.) | Mycorrhizae | Fertigation (mg L−1 N) |
|---|
| 50 X:YY:200 | 50 | 5 | 45 | Y | 200 |
| 50:Y:300 | 50 | 5 | 45 | Y | 300 |
| 50:N:200 | 50 | 5 | 45 | N | 200 |
| 50:N:300 | 50 | 5 | 45 | N | 300 |
| 70:Y:200 | 70 | 5 | 25 | Y | 200 |
| 70:Y:300 | 70 | 5 | 25 | Y | 300 |
| 70:N:200 | 70 | 5 | 25 | N | 200 |
| 70:N:300 | 70 | 5 | 25 | N | 300 |
| 90:Y:200 | 90 | 5 | 5 | Y | 200 |
| 90:Y:300 | 90 | 5 | 5 | Y | 300 |
| 90:N:200 | 90 | 5 | 5 | N | 200 |
| 90:N:300 | 90 | 5 | 5 | N | 300 |
| 0:Y:200 | 0 | 5 | 95 | Y | 200 |
| 0:Y:300 | 0 | 5 | 95 | Y | 300 |
| 0:N:200 | 0 | 0 | 100 | N | 200 |
| 0:N:300 | 0 | 0 | 100 | N | 300 |
Table 4.
List of treatments used in experiment 2 including biochar, chicken manure compost, commercial peat moss-based substrate, mycorrhizae (Y/N = with/without), and fertigation rate (mg L−1 N).
Table 4.
List of treatments used in experiment 2 including biochar, chicken manure compost, commercial peat moss-based substrate, mycorrhizae (Y/N = with/without), and fertigation rate (mg L−1 N).
| Treatment | Biochar (%, vol.) | Chicken Manure (%, vol.) | Commercial Substrate (%, vol.) | Mycorrhizae | Fertigation (mg L−1 N) |
|---|
| 80-5X:YY:100 | 80 | 5 | 15 | Y | 100 |
| 80-5:Y:200 | 80 | 5 | 15 | Y | 200 |
| 80-5:N:100 | 80 | 5 | 15 | N | 100 |
| 80-5:N:200 | 80 | 5 | 15 | N | 200 |
| 80-10:Y:100 | 80 | 10 | 10 | Y | 100 |
| 80-10:Y:200 | 80 | 10 | 10 | Y | 200 |
| 80-10:N:100 | 80 | 10 | 10 | N | 100 |
| 80-10:N:200 | 80 | 10 | 10 | N | 200 |
| 0-0:Y:100 | 0 | 0 | 100 | Y | 100 |
| 0-0:Y:200 | 0 | 0 | 100 | Y | 200 |
| 0-0:N:100 | 0 | 0 | 100 | N | 100 |
| 0-0:N:200 | 0 | 0 | 100 | N | 200 |
Table 5.
List of treatments used in experiment 3 including biochar, commercial peat moss-based substrate, mycorrhizae (Y/N = with/without), and fertigation rate (mg L−1 N).
Table 5.
List of treatments used in experiment 3 including biochar, commercial peat moss-based substrate, mycorrhizae (Y/N = with/without), and fertigation rate (mg L−1 N).
| Treatment | Biochar (%, vol.) | Commercial Substrate (%, vol.) | Mycorrhizae | Fertigation (mg L−1 N) |
|---|
| 90X:YY:200 | 90 | 10 | Y | 200 |
| 90:Y:300 | 90 | 10 | Y | 300 |
| 90:N:200 | 90 | 10 | N | 200 |
| 90:N:300 | 90 | 10 | N | 300 |
| 0:Y:200 | 0 | 100 | Y | 200 |
| 0:Y:200 | 0 | 100 | Y | 300 |
| 0:N:300 | 0 | 100 | N | 200 |
| 0:N:300 | 0 | 100 | N | 300 |
Table 6.
A summary of the statistical significance of treatment factors on growth index at the eighth week after transplanting (GI 8), soil-plant analyses development (SPAD), fruit dry weight (FDW), and total dry weight (TDW) for tomato and pepper plants.
Table 6.
A summary of the statistical significance of treatment factors on growth index at the eighth week after transplanting (GI 8), soil-plant analyses development (SPAD), fruit dry weight (FDW), and total dry weight (TDW) for tomato and pepper plants.
| Tomato | GI 8 | SPAD | FDW | TDW | Pepper | GI 8 | SPAD | FDW | TDW |
|---|
| Significance X | | | | | Significance | | | | |
| Mix | *** | *** | *** | *** | Mix | *** | *** | *** | *** |
| MC | NS | ** | NS | NS | MC | ** | NS | NS | NS |
| F | NS | ** | NS | NS | F | NS | ** | NS | ** |
| Mix × MC | * | NS | * | ** | Mix × MC | NS | *** | NS | * |
| Mix × F | NS | NS | NS | NS | Mix × F | * | ** | NS | * |
| MC × F | NS | NS | NS | ** | MC × F | NS | * | NS | NS |
| Mix × MC × F | * | NS | ** | *** | Mix × MC × F | * | NS | NS | NS |
Table 7.
Growth index of tomato and pepper plant grown in Sunshine Mix #1 amended with biochar (0%, 50%, 70%; and 90%, vol.) at the eighth week after transplanting (GI 8), tomato fruit dry weight (FDW) and total dry weight (TDW) at two fertigation levels (200 mg L−1 and 300 mg L−1 N).
Table 7.
Growth index of tomato and pepper plant grown in Sunshine Mix #1 amended with biochar (0%, 50%, 70%; and 90%, vol.) at the eighth week after transplanting (GI 8), tomato fruit dry weight (FDW) and total dry weight (TDW) at two fertigation levels (200 mg L−1 and 300 mg L−1 N).
| Treatment | Tomato | Tomato | Tomato | Pepper |
|---|
| | GI 8 | FDW | TDW | GI WAT 8 |
| 0X:YY:200 | 63 ± 2 abcZ | 7.6 ± 1.0 abc | 33.2 ± 1.4 ab | 46 ± 2 ab |
| 0:Y:300 | 59 ± 2 bc | 7.2 ± 1.0 abc | 32.3 ± 1.4 ab | 46 ± 2 ab |
| 0:N:200 | 61 ± 2 bc | 4.4 ± 1.0 bc | 32.3 ± 1.4 ab | 47 ± 2 ab |
| 0:N:300 | 57 ± 2 c | 7.8 ± 1.0 abc | 34.1 ± 1.4 a | 45 ± 2 ab |
| 50:Y:200 | 62 ± 2 bc | 8.1 ± 1.0 ab | 35.9 ± 1.4 a | 53 ± 2 ab |
| 50:Y:300 | 63 ± 2 abc | 8.1 ± 1.0 ab | 37.9 ± 1.4 a | 53 ± 2 a |
| 50:N:200 | 67 ± 2 ab | 7.8 ± 1.0 abc | 36.8 ± 1.4 a | 50 ± 2 ab |
| 50:N:300 | 64 ± 2 abc | 9.8 ± 1.0 a | 38.1 ± 1.4 a | 52 ± 2 ab |
| 70:Y:200 | 67 ± 2 ab | 7.7 ± 1.0 abc | 35.6 ± 1.4 a | 52 ± 2 ab |
| 70:Y:300 | 62 ± 2 bc | 9.6 ± 1.0 a | 37.5 ± 1.4 a | 51 ± 2 ab |
| 70:N:200 | 64 ± 2 abc | 7.5 ± 1.0 abc | 34.7 ± 1.4 a | 50 ± 2 ab |
| 70:N:300 | 64 ± 2 abc | 9.9 ± 1.0 a | 39.1 ± 1.4 a | 50 ± 2 ab |
| 90:Y:200 | 63 ± 2 abc | 3.0 ± 1.0 c | 18.5 ± 1.4 d | 28 ± 2 c |
| 90:Y:300 | 68 ± 2 ab | 5.9 ± 1.0 abc | 32.4 ± 1.4 ab | 43 ± 2 b |
| 90:N:200 | 72 ± 2 a | 5.4 ± 1.0 abc | 26.6 ± 1.4 bc | 28 ± 2 c |
| 90:N:300 | 63 ± 2 abc | 4.0 ± 1.1 bc | 23.8 ± 1.6 cd | 27 ± 2 c |
Table 8.
A summary of the statistical significance of treatment factors on growth index at the eighth week after transplanting (GI 8), soil-plant analyses development (SPAD), fruit dry weight (FDW), and total dry weight (TDW) for tomato and pepper plants.
Table 8.
A summary of the statistical significance of treatment factors on growth index at the eighth week after transplanting (GI 8), soil-plant analyses development (SPAD), fruit dry weight (FDW), and total dry weight (TDW) for tomato and pepper plants.
| Tomato | GI 8 | SPAD | FDW | TDW | Pepper | GI 8 | SPAD | FDW | TDW |
|---|
| SignificanceX | | | | | Significance | | | | |
| Mix | NS | ** | *** | NS | Mix | *** | *** | *** | *** |
| MC | NS | *** | NS | ** | MC | * | * | NS | NS |
| F | NS | NS | NS | NS | F | NS | NS | NS | NS |
| Mix × MC | NS | * | NS | *** | Mix × MC | * | ** | NS | * |
| Mix × F | NS | NS | NS | NS | Mix × F | NS | NS | NS | NS |
| MC × F | NS | NS | NS | NS | MC × F | NS | NS | * | NS |
| Mix× MC× F | NS | NS | ** | ** | Mix × MC × F | NS | NS | NS | NS |
Table 9.
Fruit dry weight (FDW) and total plant dry weight (TDW) of tomato grown in Sunshine Mix #1 amended with biochar (80%, vol.) and chicken manure (5% and 10%, vol.) at two fertigation levels (100 mg L−1 and 200 mg L−1 N).
Table 9.
Fruit dry weight (FDW) and total plant dry weight (TDW) of tomato grown in Sunshine Mix #1 amended with biochar (80%, vol.) and chicken manure (5% and 10%, vol.) at two fertigation levels (100 mg L−1 and 200 mg L−1 N).
| Treatment | Tomato FDW | Tomato TDW |
|---|
| 80-5X:YY:100 | 1.0 ± 0.2 bZ | 11.9 ± 0.8 d |
| 80-5:Y:200 | 1.2 ± 0.2 ab | 16.3 ± 0.8 bc |
| 80-5:N:100 | 1.1 ± 0.2 b | 11.1 ± 0.8 d |
| 80-5:N:200 | 1.3 ± 0.2 ab | 17.4 ± 0.8 abc |
| 80-10:Y:100 | 0.8 ± 0.2 b | 11.9 ± 0.8 d |
| 80-10:Y:200 | 0.8 ± 0.2 b | 14.2 ± 0.8 cd |
| 80-10:N:100 | 1.0 ± 0.2 b | 12.0 ± 0.8 d |
| 80-10:N:200 | 0.9 ± 0.2 b | 14.7 ± 0.8 acd |
| 0-0:Y:100 | 1.5 ± 0.2 ab | 17.0 ± 0.8 bc |
| 0-0:Y:200 | 1.3 ± 0.2 ab | 19.3 ± 0.8 ab |
| 0-0:N:100 | 1.2 ± 0.2 ab | 15.9 ± 0.8 bc |
| 0-0:N:200 | 2.0 ± 0.2 a | 20.9 ± 0.8 a |
Table 10.
A summary of the statistical significance of treatment factors on growth index at the eighth week after transplanting (GI 8), soil-plant analyses development (SPAD), fruit dry weight (FDW), and total dry weight (TDW) for tomato and pepper plant.
Table 10.
A summary of the statistical significance of treatment factors on growth index at the eighth week after transplanting (GI 8), soil-plant analyses development (SPAD), fruit dry weight (FDW), and total dry weight (TDW) for tomato and pepper plant.
| Tomato | GI 8 | SPAD | FDW | TDW | Pepper | GI 8 | SPAD | FDW | TDW |
|---|
| Significance X | | | | | Significance | | | | |
| Mix | * | *** | *** | *** | Mix | *** | *** | *** | *** |
| MC | NS | ** | NS | ** | MC | ** | ** | * | * |
| F | NS | ** | NS | NS | F | NS | NS | NS | NS |
| Mix × MC | NS | NS | NS | NS | Mix × MC | * | NS | NS | * |
| Mix × F | NS | NS | NS | NS | Mix × F | NS | NS | NS | NS |
| MC × F | NS | NS | NS | NS | MC × F | NS | * | NS | NS |
| Mix × MC × F | ** | ** | NS | * | MC × F × Mix | NS | NS | NS | NS |
Table 11.
Growth index at the eighth week after transplanting (GI 8), soil-plant analyses development (SPAD), and total dry weight (TDW) of tomato plants grown in Sunshine Mix #1 amended with biochar (90% and 0%, vol.) and at two fertigation levels (200 mg L−1 and 300 mg L−1 N).
Table 11.
Growth index at the eighth week after transplanting (GI 8), soil-plant analyses development (SPAD), and total dry weight (TDW) of tomato plants grown in Sunshine Mix #1 amended with biochar (90% and 0%, vol.) and at two fertigation levels (200 mg L−1 and 300 mg L−1 N).
| Treatment | Tomato GI 8 | Tomato SPAD | Tomato TDW |
|---|
| 90X:YY:200 | 52.0 ± 3 abZ | 26 ± 2 cd | 12 ± 2 bc |
| 90:Y:300 | 57 ± 3 a | 28 ± 2 cd | 13 ± 2 bc |
| 90:N:200 | 56 ± 3 a | 24 ± 2 d | 10 ± 2 c |
| 90:N:300 | 41 ± 3 b | 23 ± 2 d | 7 ± 2 c |
| 0:Y:200 | 56 ± 3 a | 39 ± 2 a | 24 ± 2 a |
| 0:Y:200 | 56 ± 3 a | 35 ± 2 ab | 20 ± 2 a |
| 0:N:300 | 55 ± 3 a | 31 ± 2 bc | 19 ± 2 ab |
| 0:N:300 | 58 ± 3 a | 37 ± 2 ab | 21 ± 2 a |


