Article

The Burnout Assessment Tool (BAT): A Contribution to Italian Validation with Teachers’

Department of Human Sciences, University of Rome, LUMSA, 00193 Rome, Italy
*
Author to whom correspondence should be addressed.
Sustainability 2021, 13(16), 9065; https://0-doi-org.brum.beds.ac.uk/10.3390/su13169065
Submission received: 13 July 2021 / Revised: 5 August 2021 / Accepted: 9 August 2021 / Published: 13 August 2021

Abstract

:
This study aims to validate the Burnout Assessment Tool (BAT) adapted to the Italian education sector. Teacher burnout is physical and emotional pain, due to prolonged exposure to school-related stress factors. Previous research has abundantly proven that preventive assessment of teachers’ risk level for burnout may reduce adverse outcomes. In this regard, new assessment tools, able to bring together evidence from fifty years of research on this topic, were mainly used to monitor burnout-risk levels in the school context. For the present work, 846 Italian teachers (Female, 91.1%; M age = 47.52; SD = 9.94) were involved in the study. Confirmatory factor analysis supported a four-factor structure for the core dimensions (BAT-C; exhaustion, mental distance, emotional impairment, cognitive impairment), and a two-factor structure for the secondary dimensions (BAT-S; psychological distress, psychosomatic complaints). The Italian version of the BAT-C and BAT-S has shown good internal consistency (respectively, α = 0.900 and ω = 0.913; α = 0.845 and ω = 0.857) and validity (all correlations between variables showed a p value < 0.01). Our findings support the Italian adaptation of the original version of the BAT as a valid instrument for measuring teachers’ burnout through principal and secondary symptoms.

1. Introduction

1.1. Teachers and School-Related Burnout

Teacher burnout is the experience of physical and emotional pain towards job tasks, characterized by a loss of positive attitude, engagement, and commitment to one’s work [1]. Due to a prolonged exposure to school-related stress factors, teachers feel unable to face job demands [2]. Recently, Skaalvik and Skaalvik defined teacher’s stress as follows: “(it) is typically conceptualized as unpleasant emotions resulting from aspects of the work as a teacher” ([3], p. 1251). Since the early investigations on teachers’ burnout, this topic has received considerable attention globally, becoming a central element in the latest teacher assessment and learning survey [4]. In the final report, teachers’ stress emerged as a pervasive phenomenon among European countries, impacting the working environment in several manners.
Today, there is broad agreement regarding the effect of teachers’ burnout on their psychological and subjective well-being [5]. Several events may enhance teachers’ risk of the burnout experience. Among these, more common results referred to the following sources: students misbehavior, students with special education needs, conflicts with colleagues, time pressure, and workload [6,7,8,9]. Simultaneously, scholars have investigated whether and to what extent teachers’ burnout impacts students’ school adjustment [10]. Findings have shown that classroom climate, and student motivation and achievement were significantly affected by teachers’ burnout (e.g., [11]). Additionally, burned-out teachers show low performance, low job satisfaction, high risk of illness, and absenteeism (e.g., [12]). Furthermore, burned-out teachers report psychosomatic symptoms and cognitive impairments, which, in turn, significantly impact their general well-being [13].
Likewise, in recent decades, research focused on what factors may boost teachers’ resources (i.e., personal and school-related) to support their emotional exhaustion. Resilience, emotional intelligence, instructional practices, cooperative work-related behaviors, and adaptive coping strategies were the core of this approach (e.g., [14,15,16,17,18]). In this regard, many training programs for pre-service and in-service teachers have been developed and proven to reduce burnout risk [19,20,21]. In addition, a fundamental advancement in burnout research refers to the development of assessment tools that may reveal several levels of burnout risk associated with a myriad of personal and professional variables. The most studied variables have been: teachers’ age, gender, career, and education level (e.g., [22,23,24,25]). However, even considering individual differences (e.g., [26]), cross-culture studies support a shared idea that school-related burnout is a phenomenon profoundly linked to the helping professions, such as teaching (e.g., [27]).
Finally, extensive research on burned-out teachers revealed high social costs on at least three levels: the personal and psychological, the working environment, and the social and economic [4]. Furthermore, in the last two years, teachers faced new and challenging tasks regarding their practice, digital skills, and their relationships with students, which dramatically changed due to the transition from face-to-face to distant learning. Consequently, the European and various national policy agendas have focused on teachers’ well-being at work [13]. The central core of this perspective is the promotion of teaching sustainability. The more good practices in human resource management are employed to assure the health of school staff, the more teachers may efficiently serve as educators, which positively impacts student well-being. In this regard, it is expected that scholars, practitioners, and policymakers maintain interest in updated and clever tools to continue monitoring teachers’ burnout levels.

1.2. Two Assessment Generations

Two main instruments have been developed for teaching professions in the last fifty years: the Maslach Burnout Inventory Educator Survey (MBI-ES, [28]) and the Copenhagen Burnout Inventory (CBI, [29]). Even though the second is less frequently used than the MBI survey, the two tools respond to different concepts of burnout assessment, which deserves a deeper analysis.
The MBI-ES is considered the gold standard for evaluating occupational burnout [30,31]. Inspired by this tool, a myriad of other self-report questionnaires have been developed around the globe (see, for a review, [32]). However, the original version of the MBI remains ubiquitous in empirical research. It comprises three independent sub-scales, to evaluate emotional exhaustion, depersonalization (recently renamed cynicism), and reduced personal accomplishment (recently renamed professional efficacy) [2]. The first refers to negative emotions towards job tasks; the depersonalization sub-scale refers to the detachment from context, other people, and the working environment, in general. Finally, reduced-accomplishment sub-scale addresses the extent to which teachers feel inadequate to face challenging school–life events. However, the three-factor structure of the MBI-ES is far from definitively confirmed by evidence, as recently underlined by some scholars [33]. According to Kristensen and colleagues, depersonalization and personal accomplishment are erroneously incorporated in occupational burnout assessment [29].
Contrarily, findings worldwide have supported the central core of the emotional-exhaustion dimension of the MBI [34]. The emotional dimension of burnout captures the feeling of being overwhelmed, emotionally impaired, and depressed because of work routine [2]. Furthermore, with specific regard to teachers, several studies have confirmed that the earlier symptoms of burnout were those compounding within the emotional exhaustion scale, as also revealed by long-term research [35,36]. To sum up, findings of teachers’ emotional exhaustion report this dimension to be: (a) the first signal of teachers’ maladaptive feelings in the school context; (b) the predictive factor of teachers’ later experience of cynicism and reduced personal accomplishment; and (c) frequently correlated with other positive and negative dimensions (e.g., self-efficacy and absenteeism) [26,37].
The CBI is a recent self-report questionnaire, translated into several languages, and adopted to evaluate teachers’ burnout risk [29,38]. It consists of three sub-scales, which focus on emotional exhaustion, fatigue in maintaining positive relationships, and well-adjustment, in three contexts, private life, relationships with students, and school-related tasks. The personal burnout dimension addresses physical and psychological weakness and emotional exhaustion experienced by teachers in daily life, independently from their work environment. The great advantage of this sub-scale is the bringing together of two pieces of evidence from burnout research. First, evaluations of teachers’ experience of burnout as a generic and context-free occurrence, as it leads to understanding emotional exhaustion in different dimensions of life other than those related to work related [39]. Second, monitoring the intersecting effects between burnout and depression symptoms may account for the overlapping influence between the two experiences of suffering (e.g., [40]). The other two CBI dimensions specifically refer to the school context. The work-related burnout sub-scale aims to evaluate emotional and physical exhaustion in the working environment. Finally, with student-related burnout, the emphasis is on the teachers’ fatigue at maintaining positive and constructive relationships with their students.
The fundamental approach of the CBI is to overcome limits resulting from the extensive use of the MBI. More specifically, earlier research has underlined that reduced personal accomplishment clusters in an independent dimension of burnout assessment, as an effect of teachers’ state of suffering in their work context [41,42]. Other studies supported accounting for teachers’ depersonalization or cynicism as a coping strategy to protect themselves during emotionally challenging events [29]. Evidence concerning emotional exhaustion as the central core of the MBI tool led several scholars to use this sub-scale as the prominent and, indeed, only assessment of teachers’ burnout (e.g., [43,44]). Secondly, the CBI approach addressed the need to analyze emotional exhaustion related to the school context separately from that experienced in the life contexts, or of other workers.
To sum up, Shoman and colleagues have found that both the MBI and CBI tools have shown the best psychometric validation indexes compared with other existing occupational burnout measures [45], confirming that these remain two valid instruments to assess occupational burnout.

1.3. A New Complex Tool: The BAT

The Burnout Assessment Tool (BAT, [46]) was developed to bring together recent evidence on the complex picture of workers’ burnout experience. More specifically, the authors of the BAT underlined three flaws with the MBI. First, the fact that MBI does not include reduced cognitive performance, such as diminished concentration, attention, and working memory. As reported by Deligkaris and colleagues [47], reduced cognitive performance is indeed attributable to burnout.
Second, the answers to some questionnaire items (e.g., “I don’t really care what happens” from some recipients” and “I feel that I am treated as if I were an impersonal object” from others) are misrepresented, thus lessening the reliability of the MBI [32]. Specifically, participants are more likely to tick “sporadically” or “never”, instead of “very often” or “always” due to the extreme wording of these items. More among these psychometric problems, items associated with personal accomplishment are positively worded, whereas depersonalization and exhaustion scales are negatively worded. As a consequence, a low professional efficacy score underscores burnout syndrome. Moreover, the correlations between exhaustion and depersonalization are usually higher than the association between either the former or the latter and professional efficacy [48]. On the other hand, the correlations are higher when accomplishment is measured through negatively worded items [49].
Furthermore, the results reported by De Beer and Bianchi [50] suggest a two-factor model, such that the first factor combined depersonalization and exhaustion, and the second included personal accomplishment factors. According to the authors, the two-factor model best fit the data. This finding, in turn, brought into question the role of personal accomplishment in the burnout construct. These results are consistent with those obtained by Maslach and colleagues [51], as exhaustion and cynicism are negative factors, whereas personal accomplishment is positive.
Third, the MBI does not provide a single burnout score because it was not designed to identify people with acute burnout symptoms, but rather peoples’ connection with their profession at various levels [52]. Moreover, cut-off values have not been clinically validated in most countries [53], thus preventing the employment of this questionnaire as a personal assessment tool for clinical diagnosis. Hence, the MBI cannot be used to differentiate burned-out from non-burned-out subjects.
To overcome these shortcomings, Schaufeli and colleagues [54] developed the BAT, a questionnaire consisting of four core subdimensions: exhaustion, characterized by a loss of energy that is affective both mentally and physically; emotional impairment, referring to strong emotional reaction and a sense of being overwhelmed by one’s feelings; cognitive impairment, including both issues in remembering information and a lack of attention; and, finally, mental distance, characterized by work reluctance due to psychological distance from one’s work.
Likewise, the BAT includes two secondary subdimensions: first, psychological complaints, refers to the non-physical consequences of psychological problems. Second, psychosomatic complaints are physical problems (e.g., palpitations, headaches, and sickness) caused or intensified by psychological issues. Including all of these dimensions in a unique instrument allows researchers and practitioners to simultaneously assess the emotional, psychological, and psychosomatic dimensions involved in the burnout experience. Furthermore, a self-report questionnaire is a valuable tool for school staff, involving periodic intervention to monitor the education sector’s well-being and prevent illness.
The BAT, developed by Schaufeli and colleagues [46], showed the best fit with a second-order model, in which the primary and secondary symptoms were separated from each other. The fit indexes were acceptable (CFI = 0.91; TLI = 0.90; RMSEA = 0.06), the Cronbach’s alphas were higher than 0.90, and convergent and discriminant validity were confirmed by assessing the correlations between the dimensions of the BAT, work engagement, workaholism, and job boredom.
Burnout is considered an occupational disease in Belgium and the Netherlands, where the BAT has been extensively investigated [55]. Whereas, in Italy, burnout isn’t on the list of occupational diseases [55,56], but is listed by the National Institute Against Accidents and Occupational Diseases (INAIL) among its “mental and behavioural disorders”. Furthermore, there is no validated tool that allows measuring, with certainty, the clinical values of a burnout syndrome. This underscores the need to develop an Italian version of the BAT, thereby assessing the onset of burnout symptoms in the Italian school context.
Over the past year there has been a growing number of studies in which BAT was used to assess the onset of burnout symptoms (e.g., [57]). De Beer and colleagues [58] offered a comprehensive overview of the BAT across seven nations (i.e., Belgium, Netherlands, Austria, Germany, Finland, Ireland, and Japan). They found that it can be used to evaluate burnout symptoms internationally. The Japanese version of the BAT has recently been validated by Sakakibara and colleagues [59], showing the same factorial structure, acceptable fit indexes, good reliability, and adequate discriminant and convergent validity as the original version. The worldwide spread of BAT underscores the need for a questionnaire that can be used as a burnout screening tool in occupational settings, given the detrimental role of burnout for both organizational effectiveness and employee health. The current study aims to validate the Italian version of the BAT by assessing its psychometric characteristics.

1.4. Aim and Hypotheses

This study aimed to validate the Italian version of the Burnout Assessment Tool (BAT), developed by Schaufeli and colleagues [46], with a sample of Italian teachers. The current study’s central aim was to confirm the BAT’s structural factors, assuming the six subscales to also have good fit indexes, in the Italian context, for both models tested (Hypothesis 1). Second, the authors expect both the BAT subscales and the global score to confirm satisfactory internal reliability of the BAT, with cut-off values of at least 0.70 [60], for both Cronbach’s alpha [61] and McDonald’s omega [62] (Hypothesis 2). Third, the study aims to assess the criterion validity of the BAT, assuming that each of its subscales will positively correlate with the emotional exhaustion subscale of the MBI (Hypothesis 3). Furthermore, the study aims to assess the discriminant validity of the BAT, assuming that each of its subscales will correlate negatively with measures of well-being (WHO-5) and engagement (UWES-3) (Hypothesis 4).

2. Materials and Methods

2.1. Participants

The study involved 846 Italian teachers, of an age range of 19 to 68 years (M age = 47.52 years, SD = 9.94), of whom 75 were men (8.9%) and 771 were women (91.1%). The criteria for inclusion in the study were that the participants be Italian teachers and voluntarily agreed to participate.

2.2. Procedure

The present cross-sectional study was conducted in Italy between March and April 2021, using convenience sampling. The data was collected using an online gathering method, as part of a teacher training-course internship. The teachers participating in the internship collected data from colleagues in their schools. Participants were informed of the research objectives and gave their informed consent for procedures for gathering and processing data before participating in the study. Teachers were assured that participation was voluntary and that their responses would remain anonymous. This study, indeed, was conducted under the requirements of privacy and informed consent laid down by current Italian law (Law Decree DL-196/2003). The research project was accepted by the Ethics Committee for Scientific Research (CERS) of LUMSA University, and the study was conducted under the Declaration of Helsinki.

2.3. Measures

Burnout Assessment Tool (BAT): the BAT [46] consists of the BAT-C and BAT-S. The BAT-C includes 23 items, measuring four core dimensions of burnout: exhaustion (eight items), mental distance (five items), emotional impairment (five items), and cognitive impairment (five items). The BAT-S includes ten items, measuring secondary symptoms, namely: psychological distress (five items) and psychosomatic complaints (five items). All items were scored on a five-point Likert scale, ranging from “never” (1) to “always” (5). Responses were summed and averaged for each subscale; scoring ranged between one and five. Total BAT scores can assess level of burnout, while independent scores on its six dimensions (core symptoms and secondary symptoms) can provide more information. In this study α = 0.924, and the Italian translation of the measure was borrowed from the official BAT website (https://burnoutassessmenttool.be/project_eng/, accessed on 15 February 2021).
Maslach Burnout Inventory—Educators Survey (MBI-ES): the MBI-ES [28] was used to confirm the BAT’s convergent and discriminant validities. MBI is a self-report questionnaire, consisting of 22 items that evaluate burnout on a seven-point rating scale. MBI subscales include emotional exhaustion (EE; nine items), depersonalization (DP; five items), and personal accomplishment (PA; eight items). All items were scored on a seven-point Likert scale ranging from “never” (0) to “every day” (6). Responses were summed and averaged for each subscale. For this study, only the emotional exhaustion (EE) scale was used. This scale describes the feeling of being exhausted by the job and is evaluated with a score ranging from 0 to 54. In this study, participants completed the Italian version of the MBI for social–educational services [63]. In this study α = 0.926.
World Health Organization Well-Being Index (WHO-5): The World Health Organization’s Five Well-Being Index (WHO-5; [64]) is a self-report questionnaire for the global assessment of well-being [65]. The WHO-5 includes five items, each rated on a six-point scale, from “all of the time” (0) to “at no time” (5). Therefore, total scores range from 0 (absence of well-being) to 25 (maximal well-being), with high scores indicating an increased sense of well-being. The authors chose the WHO-5 as a convenient tool, having already used it to investigate the well-being of workers in the Italian context [66]. In this study α = 0.890.
Utrecht Work Engagement Scale (UWES-3): The Utrecht Work Engagement Scale (UWES-3; [67]) is a short scale for assessing engagement. The UWES-3 is composed of three items, each evaluating a different factor: (1) “At my work, I feel bursting with energy” (vigor); (2): “I am enthusiastic about my job” (dedication); (3) “I am immersed in my work” (absorption). Each item is rated on a seven-point Likert scale from “never” (0) to “always” (6). Alphas were acceptable (>0.70) in five national samples of the original study. In this study α = 0.838.
Additionally, a set of questions was administered to obtain sociodemographic and occupational information. The following variables were assessed: age, gender, level of education, school level, and the years of service.

2.4. Data Analysis

First, the authors performed an item analysis using SPSS 27 [68] to investigate the items’ psychometric properties (mean, standard deviation, skewness, and kurtosis) to support the robustness of the analyses. Regarding the interpretation of asymmetry and kurtosis values, the authors considered values | 1 | (e.g., [69,70]), | 2 | (e.g., [60]) and | 3 | (e.g., [71]) as optimal. Furthermore, the scientific literature [72] indicates | 7 | as the maximum acceptable cut-off of kurtosis in a sample size greater than 300 subjects [73].
Second, in line with recommendations for measures development [71], we used confirmatory factor analysis (CFA), using Mplus 8.3 [74], to evaluate the factorial validity of the BAT. CFA is a form of psychometric assessment used in cases in which the factor structure of a measure has already been previously assessed, and researchers need to test the number of factors, their relations, and the loadings of indicators on a different sample [75]. The degree of overlap between the “real” matrix and the reproduced matrix of covariance of the a priori hypothesized structural model is compared [73], to evaluate the goodness of fit of the indexes. This strategy of analysis was based on a multistage approach. We chose to compare the two models that fitted the data significantly better in the original study [46]: Model 6, which, of all models, fitted the data significantly better, and Model 8, which was closest to the theoretical framework for which both core and secondary symptoms refer to burnout as an underlying psychological condition. Model 6 is a correlated factor model and assumes that six latent factors can be distinct. Whereas Model 8 is a second-order model and assumes that the four core factors (exhaustion, mental distance, emotional impairment, and cognitive impairment) are best represented by a single general factor (the core of burnout). In comparison, the other two factors (psychological distress and psychosomatic complaints) are best captured by a second general factor (secondary symptoms). For the Italian version of the BAT, Model 1 (M1) was a correlated six-factor CFA model with six different components (i.e., exhaustion, mental distance, emotional impairment, cognitive impairment, psychological distress, and psychosomatic complaints) were correlated, thus reproducing Model 6 in the original validation paper. Model 2 (M2) of the Italian version instead was a second-order CFA model, in which burnout is considered a syndrome comprising a core dimension and a secondary-symptoms dimension, thus reproducing Model 8 in the original validation paper. In line with recommendations regarding testing dimensionality with CFA [76,77,78], the fit indices of the two models were evaluated using systematic fit assessment procedures. Such techniques include the chi-square test of exact fit (χ2), comparative fit index (CFI; ≥0.95 for good; ≥0.90 for acceptable; [77,79,80,81]), Tucker–Lewis index (TLI; ≥0.95 for good, ≥0.90 for acceptable; [77,79,80,81]), standardized root mean square residual (SRMR; ≤ 0.05 for good, ≤ 0.10 for acceptable; [77,79,80,81]), the root mean square error of approximation (RMSEA; ≤0.06 for good, ≤0.08 for acceptable; [77,79,80,82,83,84,85] with its 90% confidence interval ([77,86], Akaike information criterion (AIC, [87]), Bayesian information criterion (BIC, [88]) and sample size-adjusted Bayesian information criterion (SAMPLE-ADJ BIC, [89]) (when comparing two or more models, the best model is the one with the lowest information criteria, [90]).
Third, the authors verified the internal consistency reliability, i.e., the degree to which the set of items in the scale covary, relative to their sum score, was calculated [91,92,93]. For this aim, Cronbach’s alpha (α, [61]) and McDonald’s omega (ω, [62]) coefficients were used. Both coefficients are interpreted according to the following cutoff values [60]: excellent, α ≥ 0.9, good, α ≥ 0.8, acceptable, α ≥ 0.7, questionable, α ≥ 0.6, poor, α ≥ 0.5, and unacceptable, α ≤ 0.5. Finally, the construct validity was evaluated via convergent and discriminant validity, confirming that the BAT was related to other measures. Figure 1 shows a graphical representation of the two models (M1 and M2).

3. Results

The participants in the study were 846 teachers (91.1% female,) aged between 19 and 68 years old (M = 47.52, SD = 9.94). Table 1 shows the respondents’ characteristics. About 73% of participants held a university degree or postgraduate qualification, while about 27% had only a high school diploma.
Participants were employed in kindergartens (16.08%), primary schools (48.22%), lower secondary (middle) schools (23.76%), and high schools (11.94%). The years of service ranged from 0 to 50 (M = 16.74, SD = 11.18).
Table 2 shows the descriptive findings.
The items show acceptable skewness and kurtosis values. Only one item, which reported a kurtosis value of 6.745, presented a minor violation to the most rigorous cutoff of | 3 | [71]. This value is to be considered acceptable given the sample size [72]. Therefore, it was found to have a general normal distribution for all indicators.

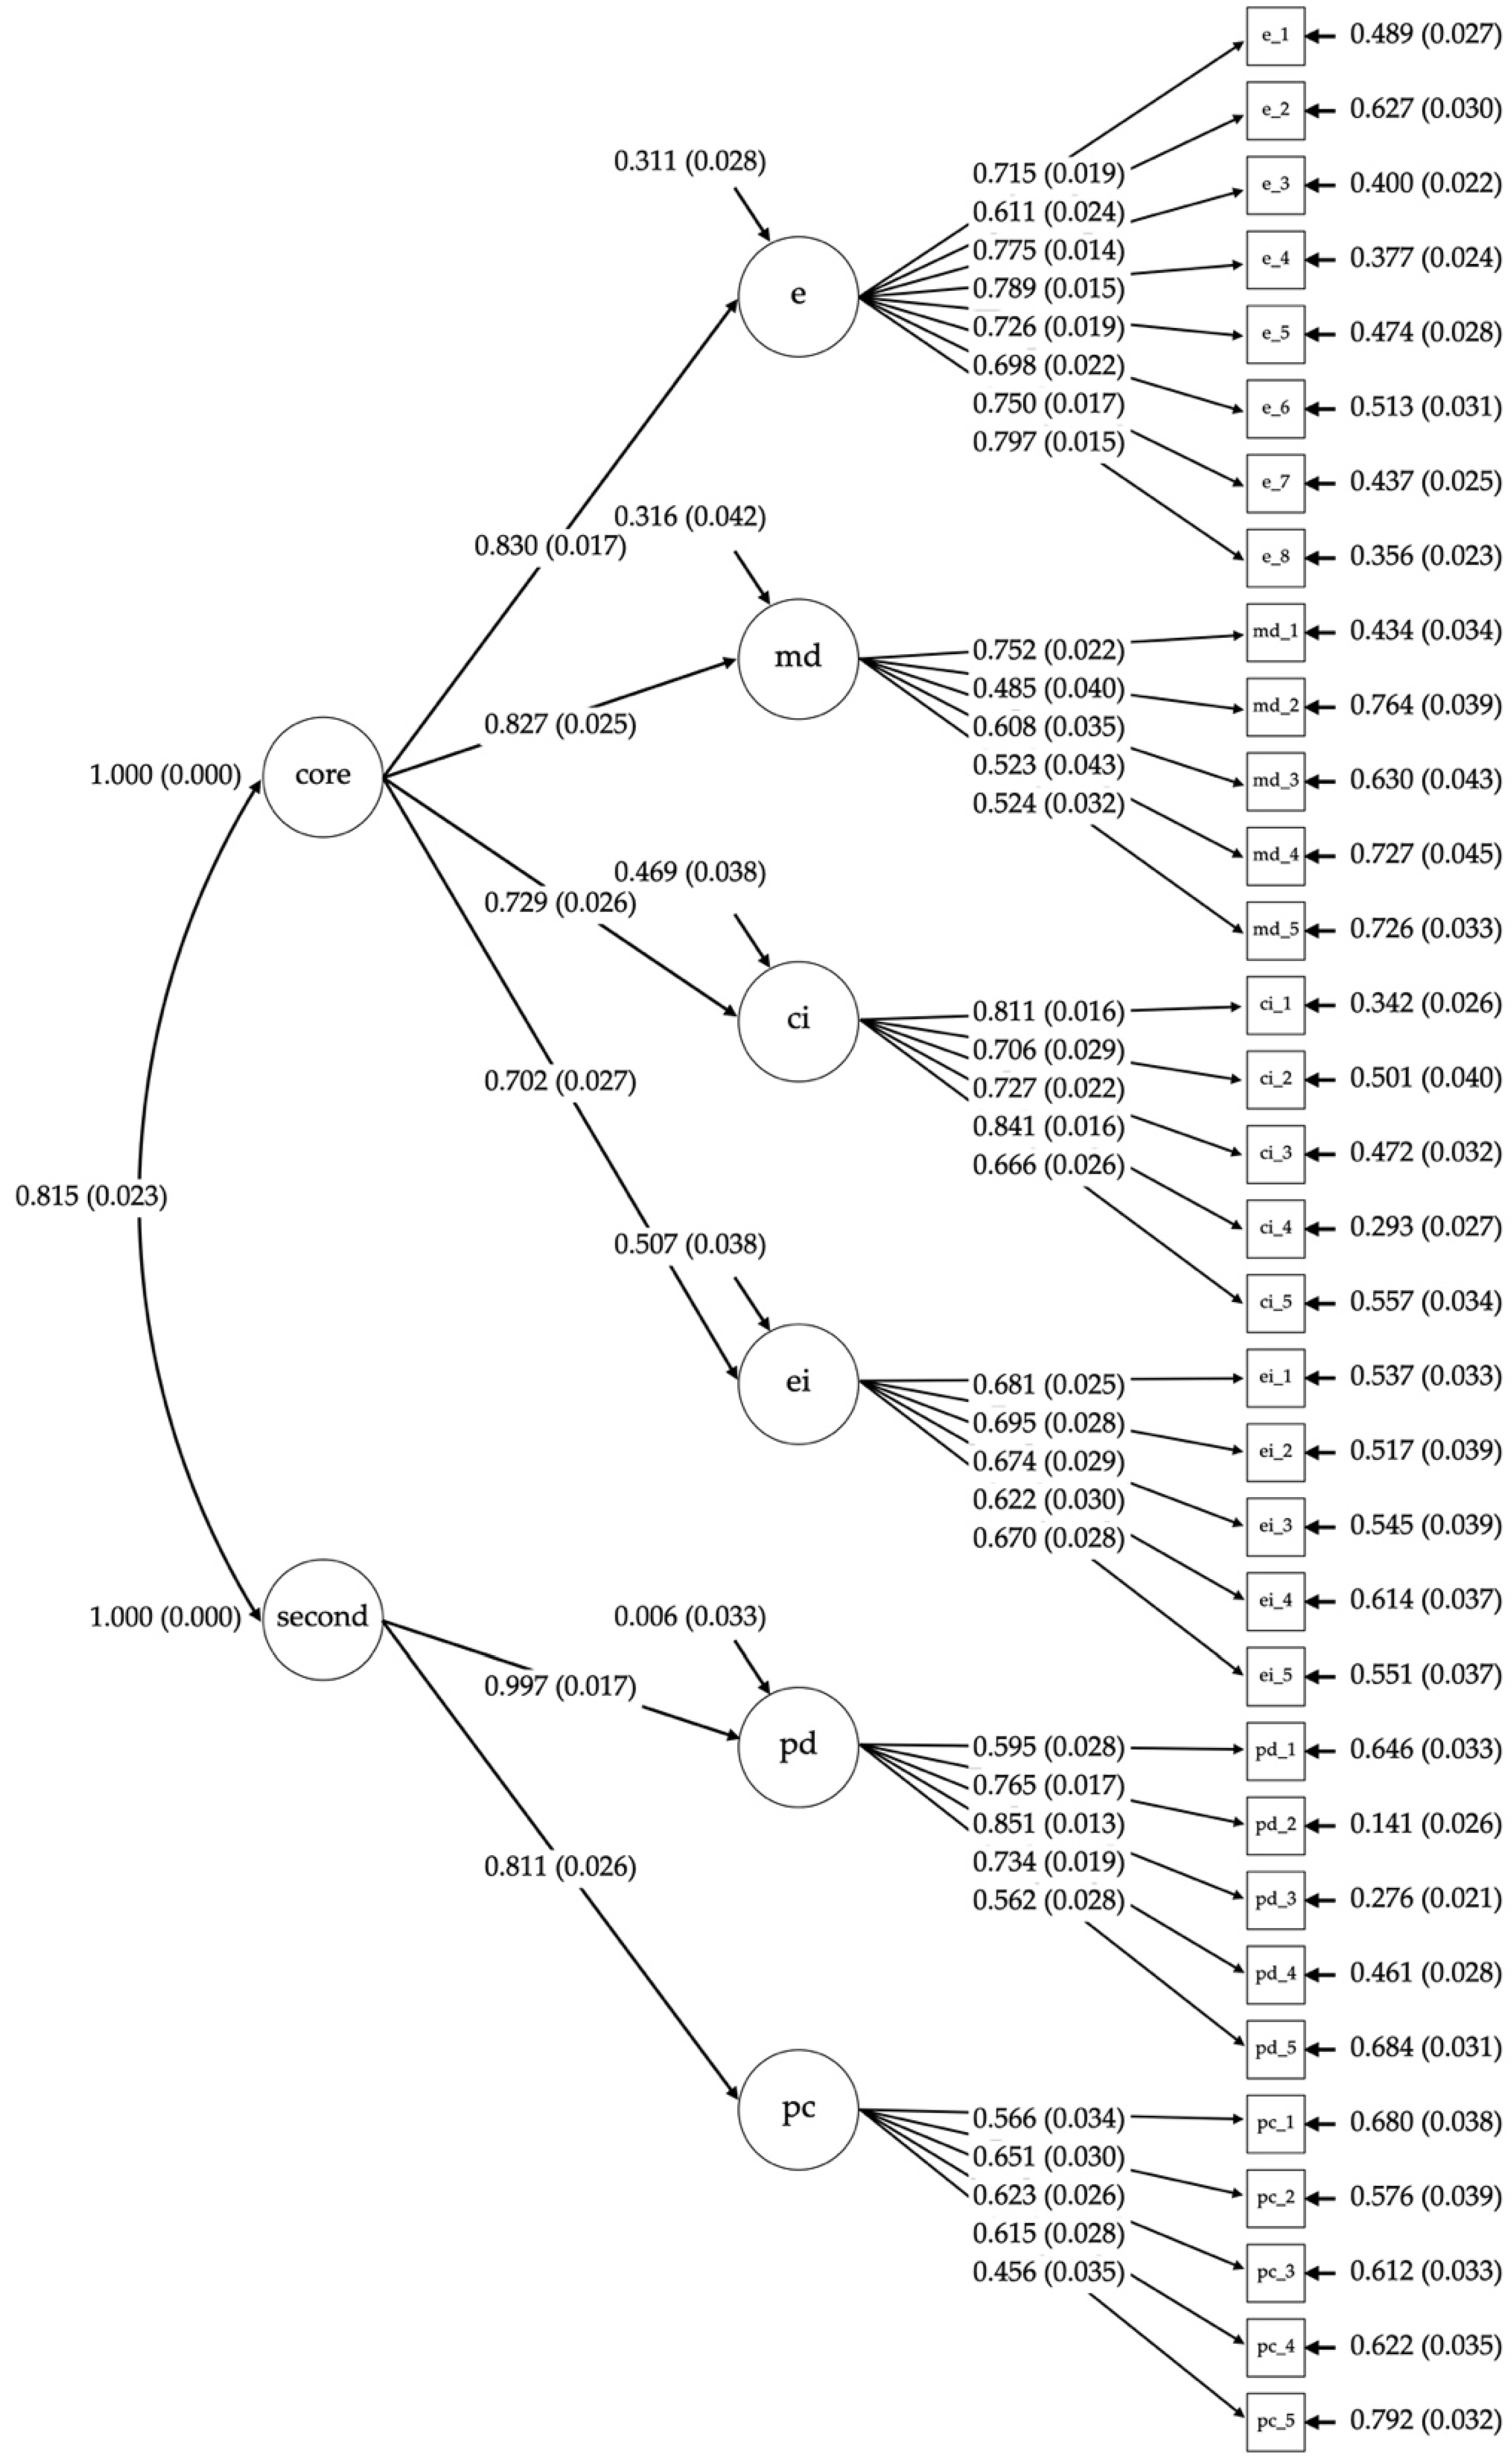
3.1. Factorial Validity

We tested two models: a correlated six-factor model (M1) and a second-order model (M2). Both the CFA of M1 and M2 show a good fit to the data, as reported in Table 3.
The correlated six-factor confirmatory factor analysis showed good or acceptable indices of fit to our data (MLM χ2(480) = 1280.194, p < 0.001, RMSEA = 0.046, 90% CI [0.043, 0.050], CFI = 0.914, TLI = 0.906 and SRMR = 0.048, AIC was 20936.087, BIC was 21466.219 and SAMPLE-ADJ BIC was 21104.216. Likewise, the second-order model also showed good or acceptable indexes of fit (MLM χ2(488) = 1376.245, p < 0.001, RMSEA = 0.049, 90% CI [0.046, 0.052], CFI = 0.905, TLI = 0.897 and SRMR = 0.054, AIC was 21038.56, BIC was 21531.489 and SAMPLE-ADJ BIC was 21194.89.
As better models are expected to have lower AIC, BIC, and SABIC values [90], M1 shows a better fit to the data than M2. Figure 1 shows a graphical representation of the two models (M1 and M2).

3.2. Reliability

Table 4 shows the internal consistency of each burnout dimension, as assessed by using Cronbach’s alpha (α, [61]) and McDonald’s omega (ω, [62]).
Cronbach’s α showed values between acceptable and excellent for all subscales of the BAT. Specifically, we observed α = 0.901 for the exhaustion subscale, α = 0.722 for the mental distance subscale, α = 0.861 for the cognitive impairment subscale, α = 0.802 for the emotional impairment subscale, α = 0.827 for the psychological distress subscale and α = 0.732 for the psychosomatic complaints subscale. Cronbach’s α value for the BAT-C was 0.900, while for the BAT-S was 0.845.
Cronbach’s alpha is widely used to assess the internal consistency reliability of scales [92,93]. Despite this, it is shown to be representative only when the assumptions of the essentially tau-equivalent model are satisfied ([94,95,96,97]; for a review, see [98]). However, the requirements of tau-equivalence (equal item variance) are often violated for psychological scales [94] for various reasons, particularly: (1) that the true score variance is constant across all items is an unrealistic perspective [94]; (2) unidimensionality between items’ true scores does not allow perfect intercorrelations in psychological scales, since few of them are truly unidimensional, but always tend towards a certain degree of multidimensionality [99]; and (3) moreover, multiple response formats across items may contribute to violating tau-equivalence [100]. For these reasons, Cronbach’s α is regarded by methodologists as an inappropriate measure of internal consistency reliability (see [98]). In light of this evidence, we used a second index, namely omega [62], that proved to be a more sensible index of internal consistency [96,100,101,102,103,104]. Omega, indeed, not only performs well, but even outperforms alpha, when the assumptions of the essentially tau-equivalent model are not satisfied [104]. As reported in Table 4, McDonald’s ω showed slightly better scores than Cronbach’s α, confirming the satisfactory internal reliability of the scale.
In fact, McDonald’s ω showed slightly better scores than Cronbach’s α, which were satisfactory for all subscales of the BAT. Specifically, we observed ω = 0.902 for the exhaustion subscale, ω = 0.725 for the mental distance subscale, ω = 0.863 for the cognitive impairment subscale, ω = 0.803 for the emotional impairment subscale, ω = 0.835 for the psychological distress subscale and ω = 0.734 for the psychosomatic complaints subscale. McDonald’s ω value for the BAT-C was 0.913, while for the BAT-S was 0.857.

3.3. Construct Validity

Following the item analysis, assuming that the data were normally distributed, we calculated the Pearson correlation coefficients among all scales (see Table 5).
Regarding the relationships between the dimensions of BAT and emotional exhaustion scale of MBI-ES [28], Pearson correlation analysis showed that the MBI emotional exhaustion scale was positively correlated with all dimensions of BAT: exhaustion (r = 0.709, p ≤ 0.01), mental distance (r = 0.649, p ≤ 0.01), emotional impairment (r = 0.493, p ≤ 0.01), cognitive impairment (r = 0.541, p ≤ 0.01), psychological distress (r = 0.679, p ≤ 0.01) and psychosomatic complaints (r = 0.524, p ≤ 0.01). Furthermore, the Pearson correlation analysis showed that the total BAT score was positively correlated with emotional exhaustion scale of Maslach Burnout Inventory (r = 0.792, p ≤ 0.01).
Regarding the World Health Organization Well-Being Index [64], the analysis highlighted significant negative correlations with the BAT scores: exhaustion (r = −0.614, p ≤ 0.01), mental distance (r = −0.497, p ≤ 0.01), emotional impairment (r = −0.422, p ≤ 0.01), cognitive impairment (r = −0.380, p ≤ 0.01), psychological distress (r = −0.607, p ≤ 0.01) and psychosomatic complaints (r = −0.465, p ≤ 0.01). Furthermore, the Pearson correlation analysis showed that the WHO was negatively correlated with the total BAT score (r = −0.669, p ≤ 0.01) and with emotional exhaustion scale of Maslach Burnout Inventory (r = −0.634, p ≤ 0.01).
Finally, with regards to the Utrecht Work Engagement Scale [51], the analysis highlighted significant negative correlations with the BAT scores: exhaustion (r = −0.499, p ≤ 0.01), mental distance (r = −0.558, p ≤ 0.01), emotional impairment (r = −0.378, p ≤ 0.01), cognitive impairment (r = −0.348, p ≤ 0.01), psychological distress (r = −0.427, p ≤ 0.01) and psychosomatic complaints (r = −0.330, p ≤ 0.01). Furthermore, Pearson-correlation analysis showed that the UWES−3 was negatively correlated, with total BAT score (r = −0.552, p ≤ 0.01) and with emotional exhaustion scale of Maslach Burnout Inventory (r = −0.585, p ≤ 0.01), while it was positively correlated with World Health Organization Well-Being Index (r = 0.640, p ≤ 0.01).

4. Discussion

The current study aimed to contribute to the validation of the Italian version of the Burnout Assessment Tool (BAT; [46]) with data collected from a sample of Italian teachers. Specifically, its psychometric properties were evaluated through item analysis, factorial validity, reliability, and construct validity. Details about the obtained results are discussed below.
Concerning the item analysis, the findings show that, except for the kurtosis value of one item (Item 4 of the mental distance factor: “I feel indifferent about my job”), the items’ psychometric properties suggested a general normal distribution for all of the indicators. Therefore, we decided not to delete the abovementioned item for the following reasons. First, according to Hair and colleagues [105] and Byrne [106], data is to be considered normal if kurtosis is between −7 and +7. In our study, Item 4 of the mental distance subscale presented a kurtosis value of 6.745, thus falling within the recommended range. Moreover, the internal consistency of the mental distance subscale (including Item 4), measured by Cronbach’s alpha [61] and McDonald’s omega [62], indicated an acceptable fit (0.722 and 0.725, respectively). Finally, when performing reliability on the mental distance subscale, excluding Item 4, omega values decrease and results are barely acceptable (from 0.725 to 0.683). Since this study aims to contribute to validate the BAT in the Italian context following as much as possible the original tool presented by Schaufeli and colleagues [46], the authors opted to maintain the original item structure.
For factorial validity, CFA analyses were conducted, focusing on the two models that fit the data better in the original study of Schaufeli and colleagues [46]. Our Model 1 (equivalent to Model 6 of the original research) was a correlated six-factors CFA model, where all the six latent burnout dimensions (exhaustion, mental distance, emotional impairment, cognitive impairment, psychological distress, and psychosomatic complaints) were correlated. Besides, our Model 2 (equivalent to Model 8 of the original study) was a second-order CFA model where burnout encompasses a core dimension and a secondary symptoms dimension. Specifically, exhaustion, mental distance, emotional impairment, and cognitive impairment were best represented by the core dimension, while psychological distress and psychosomatic complaints were best represented by the secondary symptoms dimension. Both the tested models have excellent fit indices, and results from the models’ comparison with AIC, BIC, and SAMPLE-ADJ BIC showed that Model 1 fits the data better than Model 2. This datum is similar to the one obtained by Schaufeli and colleagues [46] in their validation study. Even though the correlated six-factor model had the best fit to the data, the authors decided to opt for the second-order factor model for methodological and theoretical reasons. Firstly, and echoing Verbraak and colleagues’ findings [107], the latent correlations of their correlated six-factor model revealed that the four core dimensions were more correlated with each other than with the secondary symptoms, except for the correlation between exhaustion and psychological distress.
Furthermore, Schaufeli and colleagues [46] posited that the second-order factor model and the distinction between core and secondary symptoms had a better fit with the theoretical conceptualization of the burnout construct, as well as with the consideration of burnout as a syndrome [54]. In any case, to support this thesis and further motivate their choice, they reported several papers that showed that the second-order factor model fitted well to the data and was invariant across different national representative samples and taking into consideration age and gender [58,59,108]. Thus, based on these assumptions and considering our study’s aim and hypotheses, we decided to follow Schaufeli and colleagues’ suggestions and chose Model 2, namely the second-order factor model.
Concerning reliability, Cronbach’s alpha and McDonald’s omega, related to both the BAT subscales and the global score, confirmed satisfactory internal reliability of the scale. Indeed, all the obtained scores ranged from acceptable to excellent, according to George and Mallery’s cut-off values [60].
Moreover, to verify the construct validity, the BAT dimensions and total score were correlated with measures like the emotional exhaustion scale of the MBI, UWES, and WHO-5.
Regarding the association between BAT dimensions and MBI’s emotional exhaustion, the correlation matrix showed that they are all significantly and positively related. Specifically, the magnitude of the correlation was higher for the relationship between the emotional exhaustion dimension of the MBI and both the global score and exhaustion dimension of the BAT.
In line with previous findings (e.g., [59]), this datum is not surprising, considering that the scale aims to measure the same construct (i.e., burnout) using a self-report approach on a Likert scale, and that the exhaustion dimension is widely considered representative of the burnout phenomena (e.g., [34]). Nonetheless, the different and lower associations of MBI’s emotional exhaustion with other BAT dimensions, such as emotional impairment and psychosomatic complaints (see Table 5), suggested that MBI and BAT are convergent measures, but differ from each other when considering their respective dimensions. Therefore, this evidence further supports BAT’s multidimensionality and sheds light on the different facets of a complex phenomenon, like burnout, that could not be reduced to its mere exhaustion component.
Our findings show that BAT and its dimensions were inversely related to WHO-5 and UWES, supporting the discriminant validity of the scale. On the negative association with the well-being index (WHO-5), the more teachers in our sample were burnt-out, the less they declared feeling well in the two weeks prior to administering the test. This result is in line with previous findings (e.g., [6,109]) and highlights the correlation between excessive strain and teachers’ well-being. Moreover, the challenges related to the new digital teaching practices and obliged distance-learning might have played a pivotal role in exacerbating this negative association.
Concerning the negative link between BAT and engagement (UWES), our results corroborate the evidence that the two constructs could be considered distinct, despite sharing similarities [59,110,111]. The literature in this field has reported contrasting results on the association between burnout and engagement, usually considering them to be two sides of the same coin and overlapping constructs (e.g., [112]). Nonetheless, most of these studies have explored the relationship by measuring burnout with scales other than BAT. Considering our results and the magnitude of our correlations (the highest was r= −0.55 for BAT global score and r= −0.55 for mental distance dimension), further studies should be conducted to deepen this association and clarify the possible overlap/distinction taking into account the new burnout tool.
In sum, the present study provides preliminary evidence concerning the factorial validity, reliability, and construct validity of the BAT in the Italian context. These results track and confirm those obtained by Schaufeli and colleagues in their validation study with a representative sample of the Flemish worker population [46]. Furthermore, these findings enrich the results of De Beer and colleagues [58], who demonstrated the robustness of the BAT and its measurement invariance concerning seven representative countries (six European countries and Japan). Despite this, Italy was not among the countries in the previous study (in detail, Belgium, Austria, Finland, Germany, Ireland, Netherlands). To date, there is no available data regarding the condition of Italian workers through the use of BAT, as it has not been possible to collect it.
On the other hand, the authors themselves, within the limits of their study, suggest enriching the research on this tool by exploring the conditions of different countries in the light of existing cultural differences. Finally, congruent with the study using the Japanese version of the BAT by Sakakibara and colleagues [59], our findings further support the multi-faceted nature of the burnout construct. Overcoming the internal limitations of the gold standard MBI tool, the BAT could be considered a good alternative tool for measuring burnout in the Italian teachers’ population, and therefore offers a wide range of interrelated measures of burnout dimensions to compare with different countries.

Limitations and Future Directions

The current study has several limitations that should be addressed.
First, the data collection was carried out in the continuing challenging period, wherein teaching methods have profoundly changed, job insecurities have become more pronounced, and the relationship with students has compulsorily switched to a digital mode to which many teachers are not accustomed. Therefore, some results related to the study variables were likely conditioned by contingencies that accentuated the negative experiences related to teaching. Moreover, the sample was not gender-balanced and this could have affected the results. Although the sample shows a gender disparity that reflects reality (the percentage of female teachers is 78% in Italy, higher than that of other OECD countries [4]), in future studies, it would be interesting to examine the BAT in the Italian context with a more balanced sample of teachers and to test its invariance by considering age and gender, as De Beer and colleagues have done [58]. Furthermore, the generalizability of the data obtained in this study should be regarded cautiously. Ours was a convenience sample, with disproportionately many teachers of primary schools (64.3%) than secondary school (35.7%). New studies are hoped to overcome this limit.
Furthermore, and echoing Sakakibara and colleagues [59], there is a need to establish nation-specific cut-offs for screening burnout risk. Indeed, the cut-offs settled in the original study [54] lead to considering the burnout phenomenon as being strictly related to the specific working condition of employees. In this regard, it would be interesting to determine the cut-offs calculated for the Italian sample.

5. Conclusions

The current study represents a contribution to the validation of the Italian version of the Burnout Assessment Tool (BAT; [46]) in data collected from a sample of teachers. Our findings related to item analysis, factorial validity, reliability, and construct validity to provide evidence that the Burnout Assessment Tool is a valid and reliable scale for measuring burnout in the Italian context. Unlike the MBI and CBI, the BAT offers a more complex insight into the syndrome, bringing together different facets of burnout experience.
Specifically, the possibility of measuring various burnout symptoms in such a comprehensive way also allows for applying much more targeted interventions, primarily focused on those aspects that are particularly problematic at a given moment. Taking the secondary symptoms as an example (though this is also valid for the other BAT dimensions), they were very often subtended by other measures, and it became challenging to frame them in a more complex framework, such as burnout. Through the BAT, instead, it is possible, based on various levels of severity given by the scores to the individual dimensions (and this would become even more valid through the establishment of specific cut-offs), to act preventively and promptly to try to stem, as much as possible, the phenomenon ‘in the bud’.
Furthermore, the latest Teacher Assessment and Learning Survey (TALIS) results revealed that half of the Italian teachers who took part in the survey have not received formal training on using technology for instructional purposes. As a result, many of them do not feel ready to use it [113]. In this regard, the significant changes due to the pandemic period (e.g., the intensive use of electronic devices, the distance in the teaching-learning relationships) may have increased teachers’ stress levels. Since this teaching condition is new and utterly distinct from those previously experienced, a multi-faceted tool, such as the BAT, may further support sustainability in human resource management.

Author Contributions

Conceptualization, C.F. and G.A.; methodology, G.A. and I.B.; formal analysis, G.A. and I.B.; writing—original draft preparation, G.A., I.B., P.C., L.R., C.F.; writing—review and editing, G.A., I.B., P.B., P.C., L.R., C.F.; supervision, C.F. and P.B. All authors have read and agreed to the published version of the manuscript.

Funding

This research received no external funding.

Institutional Review Board Statement

The study was conducted according to the guidelines of the Declaration of Helsinki and approved by the Ethics Committee of the University of Rome, LUMSA, Italy.

Informed Consent Statement

Informed consent was obtained from all subjects involved in the study.

Data Availability Statement

The data presented in this study are available on request from the corresponding author.

Conflicts of Interest

The authors declare no conflict of interest.

References

  1. Kyriacou, C. Teacher Stress and Burnout: Methodological Perspectives. In International Encyclopedia of the Social & Behavioral Sciences, 2nd ed.; Wright, J.D., Ed.; Elsevier Inc.: Amsterdam, The Netherlands, 2015; pp. 72–74. ISBN 9780080970875. [Google Scholar]
  2. Maslach, C.; Jackson, S.E. The measurement of experienced burnout. J. Organ. Behav. 1981, 2, 99–113. [Google Scholar] [CrossRef]
  3. Skaalvik, E.M.; Skaalvik, S. Job demands and job resources as predictors of teacher motivation and well-being. Soc. Psychol. Educ. 2018, 21, 1251–1275. [Google Scholar] [CrossRef] [Green Version]
  4. Organisation for Economic Cooperation and Development. TALIS 2018 Results (Volume I): Teachers and School Leaders as Lifelong Learners; OECD Publishing: Paris, France, 2019. [Google Scholar]
  5. Hakanen, J.J.; Bakker, A.B.; Schaufeli, W.B. Burnout and work engagement among teachers. J. Sch. Psychol. 2006, 43, 495–513. [Google Scholar] [CrossRef]
  6. De Stasio, S.; Fiorilli, C.; Benevene, P.; Uusitalo-Malmivaara, L.; Chiacchio, C. Di Burnout in special needs teachers at kindergarten and primary school: Investigating the role of personal resources and work wellbeing. Psychol. Sch. 2017, 54, 472–486. [Google Scholar] [CrossRef]
  7. Purvanova, R.K.; Muros, J.P. Gender differences in burnout: A meta-analysis. J. Vocat. Behav. 2010, 77, 168–185. [Google Scholar] [CrossRef]
  8. Skaalvik, E.M.; Skaalvik, S. Teacher self-efficacy and perceived autonomy: Relations with teacher engagement, job satisfaction, and emotional exhaustion. Psychol. Rep. 2014, 114, 68–77. [Google Scholar] [CrossRef]
  9. Soini, K.; Korhonen-Kurki, K.; Asikainen, H. Transactional learning and sustainability co-creation in a university-business collaboration. Int. J. Sustain. High. Educ. 2019, 20, 965–984. [Google Scholar] [CrossRef]
  10. Fiorilli, C.; Farina, E.; Buonomo, I.; Costa, S.; Romano, L.; Larcan, R.; Petrides, K.V. Trait emotional intelligence and school burnout: The mediating role of resilience and academic anxiety in high-school. Int. J. Environ. Res. Public Health 2020, 17, 3058. [Google Scholar] [CrossRef]
  11. Rappleye, J.; Komatsu, H.; Uchida, Y.; Krys, K.; MarkUSA, H. ‘Better policies for better lives’? Constructive critique of the OECD’s (mis) measure of student well-being. J. Educ. Policy 2020, 35, 258–282. [Google Scholar] [CrossRef]
  12. Laybourn, S.; Frenzel, A.C.; Fenzl, T. Teacher procrastination, emotions, and stress: A qualitative study. Front. Psychol. 2019, 10, 2325. [Google Scholar] [CrossRef] [Green Version]
  13. European Commission/EACEA/Eurydice. Teachers in Europe: Careers, Development and Well-Being; Eurydice Report; Publications Office of the European Union: Luxembourg, 2021. [Google Scholar]
  14. Buonomo, I.; Fiorilli, C.; Benevene, P. The Impact of emotions and hedonic balance on teachers’ self-efficacy: Testing the bouncing back effect of positive emotions. Front. Psychol. 2019, 10, 1670. [Google Scholar] [CrossRef] [Green Version]
  15. Fiorilli, C.; Benevene, P.; De Stasio, S.; Buonomo, I.; Romano, L.; Pepe, A.; Addimando, L. Teachers’ Burnout: The Role of Trait Emotional Intelligence and Social Support. Front. Psychol. 2019, 10, 2743. [Google Scholar] [CrossRef]
  16. Herman, K.C.; Hickmon-Rosa, J.; Reinke, W.M. Empirically derived profiles of teacher stress, burnout, self-efficacy, and coping and associated student outcomes. J. Posit. Behav. Interv. 2018, 20, 90–100. [Google Scholar] [CrossRef] [Green Version]
  17. Kanayama, M.; Suzuki, M.; Yuma, Y. Longitudinal burnout-collaboration patterns in Japanese medical care workers at special needs schools: A latent class growth analysis. Psychol. Res. Behav. Manag. 2016, 9, 139. [Google Scholar] [CrossRef] [Green Version]
  18. Kyriacou, C. Teacher stress: Directions for future research. Educ. Rev. 2001, 53, 27–35. [Google Scholar] [CrossRef]
  19. Kyriacou, C. Teacher stress: From prevalence to resilience. In Handbook of Stress in the Occupations; Langan-Fox, J., Cooper, C.L., Eds.; Edward Elgar Publishing: Cheltenham, UK, 2011; pp. 161–173. [Google Scholar]
  20. Lambert, R.; McCarthy, C. Understanding Teacher Stress in an Age of Accountability: A Volume in Research on Stress and Coping in Education; IAP Information Age Publishing, Inc.: Charlotte, NC, USA, 2006. [Google Scholar]
  21. Leiter, M.P.; Bakker, A.B.; Maslach, C. Burnout at Work: A Psychological Perspective; Psychology Press: Hove, East Sussex, UK, 2014; ISBN 1317909801. [Google Scholar]
  22. Benevene, P.; De Stasio, S.; Fiorilli, C. Well-Being of School Teachers in Their Work Environment. Front. Psychol. 2020, 11, 1239. [Google Scholar] [CrossRef]
  23. Klassen, R.M.; Chiu, M.M. Effects on teachers’ self-efficacy and job satisfaction: Teacher gender, years of experience, and job stress. J. Educ. Psychol. 2010, 102, 741. [Google Scholar] [CrossRef]
  24. Van Droogenbroeck, F.; Spruyt, B.; Vanroelen, C. Burnout among senior teachers: Investigating the role of workload and interpersonal relationships at work. Teach. Teach. Educ. 2014, 43, 99–109. [Google Scholar] [CrossRef]
  25. Skaalvik, E.M.; Skaalvik, S. Dimensions of teacher burnout: Relations with potential stressors at school. Soc. Psychol. Educ. 2017, 20, 775–790. [Google Scholar] [CrossRef]
  26. Pyhältö, K.; Pietarinen, J.; Haverinen, K.; Tikkanen, L.; Soini, T. Teacher burnout profiles and proactive strategies. Eur. J. Psychol. Educ. 2020, 36, 219–242. [Google Scholar] [CrossRef] [Green Version]
  27. Buonomo, I.; Fatigante, M.; Fiorilli, C. Teachers’ burnout profile: Risk and protective factors. Open Psychol. J. 2017, 10, 190–201. [Google Scholar] [CrossRef] [Green Version]
  28. Maslach, C.; Jackson, S.E.; Schwab, R.L. Maslach Burnout Inventory-Educators Survey (MBI-ES). In MBI Manual, 3rd ed.; Consulting Psychologists Press: Palto Alto, CA, USA, 1996. [Google Scholar]
  29. Kristensen, T.S.; Borritz, M.; Villadsen, E.; Christensen, K.B. The Copenhagen Burnout Inventory: A new tool for the assessment of burnout. Work Stress 2005, 19, 192–207. [Google Scholar] [CrossRef]
  30. West, C.P.; Dyrbye, L.N.; Satele, D.V.; Sloan, J.A.; Shanafelt, T.D. Concurrent validity of single-item measures of emotional exhaustion and depersonalization in burnout assessment. J. Gen. Intern. Med. 2012, 27, 1445–1452. [Google Scholar] [CrossRef]
  31. Williamson, K.; Lank, P.M.; Cheema, N.; Hartman, N.; Lovell, E.O. Emergency Medicine Education Research Alliance (EMERA). Comparing the Maslach burnout inventory to other well-being instruments in emergency medicine residents. J. Grad. Med. Educ. 2018, 10, 532–536. [Google Scholar] [CrossRef] [PubMed] [Green Version]
  32. Worley, J.A.; Vassar, M.; Wheeler, D.L.; Barnes, L.L.B. Factor structure of scores from the maslach burnout inventory: A review and meta-analysis of 45 exploratory and confirmatory factor-analytic studies. Educ. Psychol. Meas. 2008, 68, 797–823. [Google Scholar] [CrossRef]
  33. Szigeti, R.; Balázs, N.; Bikfalvi, R.; Urbán, R. Burnout and depressive symptoms in teachers: Factor structure and construct validity of the Maslach Burnout inventory-educators survey among elementary and secondary school teachers in Hungary. Stress Health 2017, 33, 530–539. [Google Scholar] [CrossRef]
  34. Jennett, H.K.; Harris, S.L.; Mesibov, G.B. Commitment to philosophy, teacher efficacy, and burnout among teachers of children with autism. J. Autism Dev. Disord. 2003, 33, 583–593. [Google Scholar] [CrossRef]
  35. Leung, D.Y.P.; Lee, W.W.S. Predicting intention to quit among Chinese teachers: Differential predictability of the components of burnout. Anxiety Stress Coping 2006, 19, 129–141. [Google Scholar] [CrossRef]
  36. Skaalvik, E.M.; Skaalvik, S. Teacher self-efficacy and teacher burnout: A study of relations. Teach. Teach. Educ. 2010, 26, 1059–1069. [Google Scholar] [CrossRef]
  37. Skaalvik, C. Self-efficacy for instructional leadership: Relations with perceived job demands and job resources, emotional exhaustion, job satisfaction, and motivation to quit. Soc. Psychol. Educ. 2020, 23, 1343–1366. [Google Scholar] [CrossRef]
  38. Fiorilli, C.; De Stasio, S.; Benevene, P.; Fioredistella Iezzi, D.; Pepe, A.; Albanese, O. Copenhagen Burnout Inventory (CBI): A validation study in an Italian teacher group. TPM Test. Psychom. Methodol. Appl. Psychol. 2015, 22. [Google Scholar] [CrossRef]
  39. Schaufeli, W.B.; Leiter, M.P.; Maslach, C. Burnout: 35 years of research and practice. Career Dev. Int. 2009, 14, 204–220. [Google Scholar] [CrossRef] [Green Version]
  40. Bianchi, R.; Schonfeld, I.S.; Laurent, E. Burnout-depression overlap: A review. Clin. Psychol. Rev. 2015, 36, 28–41. [Google Scholar] [CrossRef] [Green Version]
  41. Schaufeli, W.B.; Taris, T.W. The conceptualization and measurement of burnout: Common ground and worlds apart. Work Stress 2005, 19, 256–262. [Google Scholar] [CrossRef]
  42. Schutte, N.; Toppinen, S.; Kalimo, R.; Schaufeli, W. The factorial validity of the Maslach Burnout Inventory-General Survey (MBI-GS) across occupational groups and nations. J. Occup. Organ. Psychol. 2000, 73, 53–66. [Google Scholar] [CrossRef]
  43. Pines, A.; Aronson, E. Career Burnout: Causes and Cures; Free Press: New York, NY, USA, 1988; ISBN 0029253519. [Google Scholar]
  44. Shirom, A. Reflections on the study of burnout. Work Stress 2005, 19, 263–270. [Google Scholar] [CrossRef]
  45. Shoman, Y.; Marca, S.C.; Bianchi, R.; Godderis, L.; van der Molen, H.F.; Canu, I.G. Psychometric properties of burnout measures: A systematic review. Epidemiol. Psychiatr. Sci. 2021, 30, e8. [Google Scholar] [CrossRef] [PubMed]
  46. Schaufeli, W.B.; Desart, S.; De Witte, H. Burnout Assessment Tool (BAT)—Development, validity, and reliability. Int. J. Environ. Res. Public Health 2020, 17, 9495. [Google Scholar] [CrossRef]
  47. Deligkaris, P.; Panagopoulou, E.; Montgomery, A.J.; Masoura, E. Job burnout and cognitive functioning: A systematic review. Work Stress 2014, 28, 107–123. [Google Scholar] [CrossRef]
  48. Schaufeli, W.B.; Van Dierendonck, D. Handleiding van de Utrechtse Burnout Schaal—UBOS [Test Manual: Utrecht Burnout Scale—UBOS]; Swets & Zeitlinger: Lisse, The Netherlands, 2000. [Google Scholar]
  49. Schaufeli, W.B.; Salanova, M. Work engagement: An emerging psychological concept and its implications for organizations. In Managing Social and Ethical Issues in Organizations; Gilliland, S.W., Steiner, D.D., Skarlicki, D.P.S., Eds.; IAP: Greenwich, CT, USA, 2007; pp. 135–177. [Google Scholar]
  50. De Beer, L.T.; Bianchi, R. Confirmatory factor analysis of the maslach burnout Inventory. Eur. J. Psychol. Assess. 2017, 35, 217–224. [Google Scholar] [CrossRef]
  51. Schaufeli, W.B.; Bakker, A.B. Job demands, job resources, and their relationship with burnout and engagement: A multi-sample study. J. Organ. Behav. 2004, 25, 293–315. [Google Scholar] [CrossRef] [Green Version]
  52. Maslach, C.; Jackson, S.E.; Leiter, M.P.; Schaufeli, W.B.; Schwab, R.L. Maslach Burnout Inventory Manual, 4th ed.; Mind Garden: Palo Alto, CA, USA, 2017. [Google Scholar]
  53. Schaufeli, W.B. Work engagement in Europe. Research Unit Occupational & Organizational Psychology and Professional Learning; Internal Report; KU Leuven: Leuven, Belgium, 2018; Volume 47, pp. 99–106. [Google Scholar]
  54. Schaufeli, W.B.; De Witte, H.; Desart, S. Manual Burnout Assessment Tool (BAT)—Version 2.0; Unpublished Internal Report; KU Leuven: Leuven, Belgium, 2020. [Google Scholar]
  55. Lastovkova, A.; Carder, M.; Rasmussen, H.M.; Sjoberg, L.; de Groene, G.J.; Sauni, R.; Vevoda, J.; Vevodova, S.; Lasfargues, G.; Svartengren, M. Burnout syndrome as an occupational disease in the European Union: An exploratory study. Ind. Health 2018, 56, 160–165. [Google Scholar] [CrossRef] [Green Version]
  56. Salerno, S. Burnout as an Occupational Disease: A Gender Issue. In Health and Social Care Systems of the Future: Demographic Changes, Digital Age and Human Factors HEPS 2019. Advances in Intelligent Systems and Computing; Cotrim, T., Serranheira, F., Sousa, P., Hignett, S., Albolino, S., Tartaglia, R., Eds.; Springer: Cham, Switzerland, 2019; Volume 1012. [Google Scholar]
  57. Spagnoli, P.; Buono, C.; Kovalchuk, L.S.; Cordasco, G.; Esposito, A. Perfectionism and burnout during the COVID-19 crisis: A two-wave cross-lagged study. Front. Psychol. 2021, 11, 4087. [Google Scholar] [CrossRef]
  58. De Beer, L.T.; Schaufeli, W.B.; De Witte, H.; Hakanen, J.J.; Shimazu, A.; Glaser, J.; Seubert, C.; Bosak, J.; Sinval, J.; Rudnev, M. Measurement invariance of the Burnout Assessment Tool (BAT) across seven cross-national representative samples. Int. J. Environ. Res. Public Health 2020, 17, 5604. [Google Scholar] [CrossRef]
  59. Sakakibara, K.; Shimazu, A.; Toyama, H.; Schaufeli, W.B. Validation of the Japanese Version of the Burnout Assessment Tool. Front. Psychol. 2020, 11, 1819. [Google Scholar] [CrossRef]
  60. George, D.; Mallery, P. SPSS® for Windows® Step By Step: A Simple Guide and Reference; Allyn & Bacon, Pearson Education: Boston, MA, USA, 1999. [Google Scholar]
  61. Cronbach, L.J. Coefficient alpha and the internal structure of tests. Psychometrika 1951, 16, 297–334. [Google Scholar] [CrossRef] [Green Version]
  62. McDonald, R.P. Test Theory: A Unified Treatment; Lawrence Erlbaum Associates, Inc.: Mahwah, NJ, USA, 1999. [Google Scholar]
  63. Sirigatti, S.; Stefanile, C. The Maslach Burnout Inventory: Adattamento e Taratura per l’Italia; Organizzazioni Speciali: Firenze, Italy, 1993. [Google Scholar]
  64. Bech, P. Measuring the dimension of psychological general well-being by the WHO-5. Qual. Life Newsl. 2004, 32, 15–16. [Google Scholar]
  65. Topp, C.W.; Østergaard, S.D.; Søndergaard, S.; Bech, P. The WHO-5 Well-Being Index: A systematic review of the literature. Psychother. Psychosom. 2015, 84, 167–176. [Google Scholar] [CrossRef] [PubMed]
  66. Greco, E.; Cedrone, F.; De Sio, S. Benessere nei Luoghi di Lavoro: Valutazione della Percezione Attraverso la Somministrazione del Questionario WHO-5 Well-Being Index; Franco Angeli: Milano, Italy, 2017. [Google Scholar]
  67. Schaufeli, W.B.; Shimazu, A.; Hakanen, J.; Salanova, M.; De Witte, H. An ultra-short measure for work engagement. Eur. J. Psychol. Assess. 2017, 35, 577–591. [Google Scholar] [CrossRef]
  68. IBM Corporation. IBM SPSS Statistics for Macintosh, Version 27.0; Computer Software; IBM Corporation: Armonk, NY, USA, 2020. [Google Scholar]
  69. Tabachnick, C.; Fidell, L.S. Using Multivariate Statistics, 6th ed.; Prentice Hall: New York, NY, USA, 2013. [Google Scholar]
  70. West, S.G.; Finch, J.F.; Curran, P.J. Structural equation models with non-normal variables: Problems and remedies. In Structural Equation Modeling: Concepts, Issues and Applications; Hoyle, R.H., Ed.; Sage: Newbery Park, CA, USA, 1995; pp. 56–75. [Google Scholar]
  71. Brown, M.W. Confirmatory Factor Analysis for Applied Research; Guildford Press: New York, NY, USA, 2006. [Google Scholar]
  72. Kim, H.-Y. Statistical notes for clinical researchers: Assessing normal distribution (2) using skewness and kurtosis. Restor. Dent. Endod. 2013, 38, 52–54. [Google Scholar] [CrossRef]
  73. Kline, R.B. Principles and Practice for Structural Equation Modelling, 3rd ed.; Guildford Press: New York, NY, USA, 2010. [Google Scholar]
  74. Mutheén, L.K.; Mutheén, B.O. Mplus 8.3; Computer Software; Muthén & Muthén: Los Angeles, CA, USA, 2019. [Google Scholar]
  75. Ruscio, J.; Roche, B. Determining the number of factors to retain in an exploratory factor analysis using comparison data of known factorial structure. Psychol. Assess. 2012, 24, 282. [Google Scholar] [CrossRef] [Green Version]
  76. Cheung, G.W.; Rensvold, R.B. Evaluating goodness-of-fit indexes for testing measurement invariance. Struct. Equ. Model. 2002, 9, 233–255. [Google Scholar] [CrossRef]
  77. Hu, L.; Bentler, P.M. Cutoff criteria for fit indexes in covariance structure analysis: Conventional criteria versus new alternatives. Struct. Equ. Model. Multidiscip. J. 1999, 6, 1–55. [Google Scholar] [CrossRef]
  78. McDonald, R.P.; Ho, M.-H.R. Principles and practice in reporting structural equation analyses. Psychol. Methods 2002, 7, 64. [Google Scholar] [CrossRef]
  79. Bentler, P.M. Comparative fit indexes in structural models. Psychol. Bull. 1990, 107, 238. [Google Scholar] [CrossRef]
  80. Bentler, P.M.; Bonett, D.G. Significance tests and goodness of fit in the analysis of covariance structures. Psychol. Bull. 1980, 88, 588. [Google Scholar] [CrossRef]
  81. Tucker, L.R.; Lewis, C. A reliability coefficient for maximum likelihood factor analysis. Psychometrika 1973, 38, 1–10. [Google Scholar] [CrossRef]
  82. Browne, M.W.; Cudeck, R. Alternative ways of assessing model fit. Sociol. Methods Res. 1992, 21, 230–258. [Google Scholar] [CrossRef]
  83. Cochran, W.G. The χ2 test of goodness of fit. Ann. Math. Stat. 1952, 23, 315–345. [Google Scholar] [CrossRef]
  84. Jöreskog, K.G.; Sörbom, D. LISREL 8: Structural Equation Modeling with the SIMPLIS Command Language; Scientific Software International: Lincolnwood, IL, USA, 1993; ISBN 0894980335. [Google Scholar]
  85. Kline, P. The Handbook of Psychological Testing; Psychology Press: Hove, East Sussex, UK, 2000; ISBN 0415211581. [Google Scholar]
  86. Marsh, H.W.; Hau, K.-T.; Grayson, D. Goodness of fit evaluation. In Contemporary Psychometrics; Maydeu Olivares, A., McArdle, J., Eds.; Erlbaum: Mahwah, NJ, USA, 2005; pp. 275–340. [Google Scholar]
  87. Akaike, H. Information theory and an extension of the maximum likelihood principle. In Selected Papers of Hirotugu Akaike; Parzen, E., Tanabe, K., Kitagawa, G., Eds.; Springer: New York, NY, USA, 1998; pp. 199–213. [Google Scholar]
  88. Schwarz, G. Estimating the Dimension of a Model. Ann. Stat. 1978, 6, 461–464. [Google Scholar] [CrossRef]
  89. Sclove, S.L. Application of model-selection criteria to some problems in multivariate analysis. Psychometrika 1987, 52, 333–343. [Google Scholar] [CrossRef]
  90. Nylund, K.L.; Asparouhov, T.; Muthén, B.O. Deciding on the number of classes in latent class analysis and growth mixture modeling: A Monte Carlo simulation study. Struct. Equ. Model. A Multidiscip. J. 2007, 14, 535–569. [Google Scholar] [CrossRef]
  91. DeVellis, R.F. Scale Development: Theory and Applications; Sage Publications: Newbury Park, CA, USA, 2016; ISBN 1506341551. [Google Scholar]
  92. Raykov, T.; Marcoulides, G.A. Introduction to Psychometric Theory; Routledge: London, UK, 2011; ISBN 1136900039. [Google Scholar]
  93. Sexton, J.B.; Helmreich, R.L.; Neilands, T.B.; Rowan, K.; Vella, K.; Boyden, J.; Roberts, P.R.; Thomas, E.J. The Safety Attitudes Questionnaire: Psychometric properties, benchmarking data, and emerging research. BMC Health Serv. Res. 2006, 6, 1–10. [Google Scholar] [CrossRef] [Green Version]
  94. Green, S.B.; Yang, Y. Commentary on coefficient alpha: A cautionary tale. Psychometrika 2009, 74, 121–135. [Google Scholar] [CrossRef]
  95. McDonald, R.P. The dimensionality of tests and items. Br. J. Math. Stat. Psychol. 1981, 34, 100–117. [Google Scholar] [CrossRef]
  96. Revelle, W.; Zinbarg, R.E. Coefficients alpha, beta, omega, and the glb: Comments on Sijtsma. Psychometrika 2009, 74, 145–154. [Google Scholar] [CrossRef]
  97. Shevlin, M.; Miles, J.N.V.; Davies, M.N.O.; Walker, S. Coefficient alpha: A useful indicator of reliability? Pers. Individ. Dif. 2000, 28, 229–237. [Google Scholar] [CrossRef]
  98. Dunn, T.J.; Baguley, T.; Brunsden, V. From alpha to omega: A practical solution to the pervasive problem of internal consistency estimation. Br. J. Psychol. 2014, 105, 399–412. [Google Scholar] [CrossRef] [PubMed] [Green Version]
  99. Sočan, G. Assessment of reliability when test items are not essentially τ-equivalent. Dev. Surv. Methodol. 2000, 15, 23–35. [Google Scholar]
  100. Graham, J.M. Congeneric and (essentially) tau-equivalent estimates of score reliability: What they are and how to use them. Educ. Psychol. Meas. 2006, 66, 930–944. [Google Scholar] [CrossRef]
  101. Raykov, T. Scale reliability, Cronbach’s coefficient alpha, and violations of essential tau-equivalence with fixed congeneric components. Multivariate Behav. Res. 1997, 32, 329–353. [Google Scholar] [CrossRef]
  102. Zinbarg, R.E.; Revelle, W.; Yovel, I. Estimating ωh for structures containing two group factors: Perils and prospects. Appl. Psychol. Meas. 2007, 31, 135–157. [Google Scholar] [CrossRef]
  103. Zinbarg, R.E.; Yovel, I.; Revelle, W.; McDonald, R.P. Estimating generalizability to a latent variable common to all of a scale’s indicators: A comparison of estimators for ω h. Appl. Psychol. Meas. 2006, 30, 121–144. [Google Scholar] [CrossRef] [Green Version]
  104. Zinbarg, R.E.; Revelle, W.; Yovel, I.; Li, W. Cronbach’s, α Revelle’s β and McDonald’s ω H: Their relations with each other and two alternative conceptualizations of reliability. Psychometrika 2005, 70, 123–133. [Google Scholar] [CrossRef]
  105. Hair, J.; Black, W.C.; Babin, B.J.; Anderson, R.E. Multivariate Data Analysis, 7th ed.; Pearson Educational International: Upper Saddle River, NJ, USA, 2010. [Google Scholar]
  106. Byrne, B.M. Structural Equation Modeling with AMOS: Basic Concepts, Applications, and Programming; Routledge: New York, NY, USA, 2010. [Google Scholar]
  107. Verbraak, M.; Kleyweg, J.; van de Griendt, J.; Hoogduin, K. Nadere verkenning van de psychometrische kwaliteiten van de BurnOut-Neurasthenie Klachten Schaal (BO-NKS): Wat valt er te meten? Directieve Therapie 2008, 28, 187–211. [Google Scholar] [CrossRef]
  108. Hadzibajramović, E.; Schaufeli, W.; De Witte, H. A Rasch analysis of the Burnout Assessment Tool (BAT). PLoS ONE 2020, 15, e0242241. [Google Scholar] [CrossRef]
  109. Fiorilli, C.; Pepe, A.; Buonomo, I.; Albanese, O. At-risk teachers: The association between burnout levels and emotional appraisal processes. Open Psychol. J. 2017, 10, 127–139. [Google Scholar] [CrossRef] [Green Version]
  110. Schaufeli, W.; Salanova, M. Burnout, boredom and engagement at the workplace. In People at Work: An Introduction to Contemporary Work Psychology; Peeters, M., de Jonge, J., Taris, T., Eds.; Wiley-Blackwell: Chichester, UK, 2014; pp. 293–320. [Google Scholar]
  111. Schaufeli, W.B.; Taris, T.W.; Van Rhenen, W. Workaholism, burnout, and work engagement: Three of a kind or three different kinds of employee well-being? Appl. Psychol. 2008, 57, 173–203. [Google Scholar] [CrossRef] [Green Version]
  112. Taris, T.W.; Ybema, J.F.; Beek, I. van Burnout and engagement: Identical twins or just close relatives? Burn. Res. 2017, 5, 3–11. [Google Scholar] [CrossRef]
  113. Organisation for Economic Cooperation and Development. TALIS 2018 Results (Volume II): Teachers and School Leaders as Valued Professionals; OECD Publishing: Paris, France, 2019. [Google Scholar]
Figure 1. Results of confirmatory factor analysis of two models.
Sustainability 13 09065 g001
Table 1. Demographic characteristics of the study participants (N = 846).
M ± SDn%
Age (years)47.52 ± 9.94
Gender
women 77191.1
men 758.9
Education
high School 22726.8
graduation 34640.9
post-graduate specialization 27332.2
Working school level
kindergarten 13616.08
primary school 40848.22
lower secondary (middle) school 20123.76
high school 10111.94
Years of service16.74 ± 11.18
Note: M, mean; SD, standard deviation.
Table 2. Exploratory descriptive statistics of items included in the BAT (N = 846).
SkewnessKurtosis
StatisticStandard ErrorStatisticStandard Error
BAT_E_1−0.0220.084−0.3890.168
BAT_E_20.0160.084−0.4670.168
BAT_E_30.0470.084−0.6150.168
BAT_E_40.3510.084−0.4920.168
BAT_E_50.7620.0840.1240.168
BAT_E_60.9080.0840.2800.168
BAT_E_70.6390.084−0.1770.168
BAT_E_80.1170.084−0.4800.168
BAT_MD_11.1620.0840.8700.168
BAT_MD_21.3740.0840.0540.168
BAT_MD_31.8920.0841.7620.168
BAT_MD_42.9190.0846.7450.168
BAT_MD_50.5080.084−0.4260.168
BAT_CI_10.9320.0840.6350.168
BAT_CI_20.2810.084−1.7540.168
BAT_CI_30.9590.0840.5390.168
BAT_CI_41.0620.0840.8570.168
BAT_CI_50.9860.0840.3410.168
BAT_EI_10.9010.0840.5930.168
BAT_EI_20.4120.084−1.7150.168
BAT_EI_30.7420.0840.2330.168
BAT_EI_41.3200.084−0.1430.168
BAT_EI_51.3750.0841.1460.168
BAT_PD_10.8990.0840.0210.168
BAT_PD_20.1970.084−0.5610.168
BAT_PD_30.2470.084−0.4440.168
BAT_PD_41.3170.0841.0090.168
BAT_PD_50.8220.084−0.0270.168
BAT_PC_10.8950.084−1.0690.168
BAT_PC_20.9070.084−0.1540.168
BAT_PC_30.4610.084−0.6950.168
BAT_PC_40.1710.084−0.9040.168
BAT_PC_51.0160.0840.9100.168
Note. BAT_E, exhaustion; BAT_MD, mental distance; BAT_CI, cognitive impairment; BAT_EI, emotional impairment; BAT_PD, psychological distress; BAT_PC, psychosomatic complaints.
Table 3. Summary of goodness-of-fit indexes for different models of BAT (N = 846).
M1 RMSEA 90% CI
χ²pdfCFITLISRMRRMSEALowerUpperAICBICSAMPLE-ADJ BIC
1280.1940.004800.9140.9060.0480.0460.0430.05020,936.08721,466.21921,104.216
M2 RMSEA 90% CI
χ²pdfCFITLISRMRRMSEALowerUpperAICBICSAMPLE-ADJ BIC
1376.2450.004880.9050.8970.0540.0490.0460.05221,038.5621,531.48921,194.89
Note. M1, Model 1—correlated six-factor CFA model; M2, Model 2 s-order CFA model; χ2, chi-square; p, p-value; df, degree of freedom; CFI, comparative fit index; TLI, Tucker–Lewis index; SRMR, standardized root mean squared residual; RMSEA, root mean square error of approximation; CI, confidence interval; AIC, Akaike information criterion; BIC, Bayesian information criterion; SAMPLE-ADJ BIC, sample size-adjusted Bayesian information criterion.
Table 4. Results of the Cronbach’s α and McDonald’s ω of the internal consistencies of questionnaire dimensions (N = 846).
Cronbach’s α of Original VersionCronbach’s α of Italian VersionMcDonald’s ω of Italian Version
core symptoms (BAT-C)0.950.9000.913
secondary symptoms (BAT-S)0.900.8450.857
exhaustion0.920.9010.902
mental distance0.910.7220.725
cognitive impairment0.920.8610.863
emotional impairment0.900.8020.803
psychological distress0.810.8270.835
psychosomatic complaints0.850.7320.734
Table 5. Means. standard deviations. internal consistencies (Cronbach’s α; McDonald’s ω) and correlations of the variables used in the study (N = 846).
RangeMeanSDBATBAT_EBAT_MDBAT_EIBAT_CIBAT_PDBAT_PCMBI_EEWHO
BAT1–51.95630.51511
BAT_E1–52.42270.755470.857 **
BAT_MD1–51.53620.505300.737 **0.605 **
BAT_EI1–51.59100.577050.713 **0.518 **0.516 **
BAT_CI1–51.57970.551330.682 **0.422 **0.515 **0.551 **
BAT_PD1–52.29080.816970.844 **0.634 **0.509 **0.475 **0.514 **
BAT_PC1–52.03760.709730.724 **0.494 **0.384 **0.378 **0.367 **0.661 **
MBI_EE0–610.703310.420200.792 **0.709 **0.649 **0.493 **0.541 **0.679 **0.524 **
WHO0–516.29794.83245−0.669 **−0.614 **−0.497 **−0.422 **−0.380 **−0.607 **−0.465 **−0.634 **
UWES0–614.84163.10464−0.552 **−0.499 **−0.558 **−0.378 **−0.348 **−0.427 **−0.330 **−0.585 **0.640 **
Note. SD, standard deviation. ** p < 0.01.
Publisher’s Note: MDPI stays neutral with regard to jurisdictional claims in published maps and institutional affiliations.

