Prevalence and Genetic Diversity of Rotaviruses among under-Five Children in Ethiopia: A Systematic Review and Meta-Analysis


Abstract
:1. Introduction
2. Review Questions
- Is the pooled prevalence of rotavirus infection among under-five children with acute gastroenteritis different in Ethiopia compared to other African countries and geographic regions?
- Are dominant rotavirus genotypes currently circulating in Ethiopia different from those in other countries or enriched for strains of zoonotic origin?
3. Methods
3.1. Review Protocol Development
3.2. Search Strategy
3.3. Selection Criteria of Studies
- The study participants must be children with acute diarrhea/gastroenteritis;
- The age of the study participants must be under-five years of age and
- Rotavirus positive and negative results must be reported.
3.4. Study Selection and Quality Assessment
3.5. Data Extraction
3.6. Statistical Analysis
4. Results
4.1. Characteristics of Individual Studies
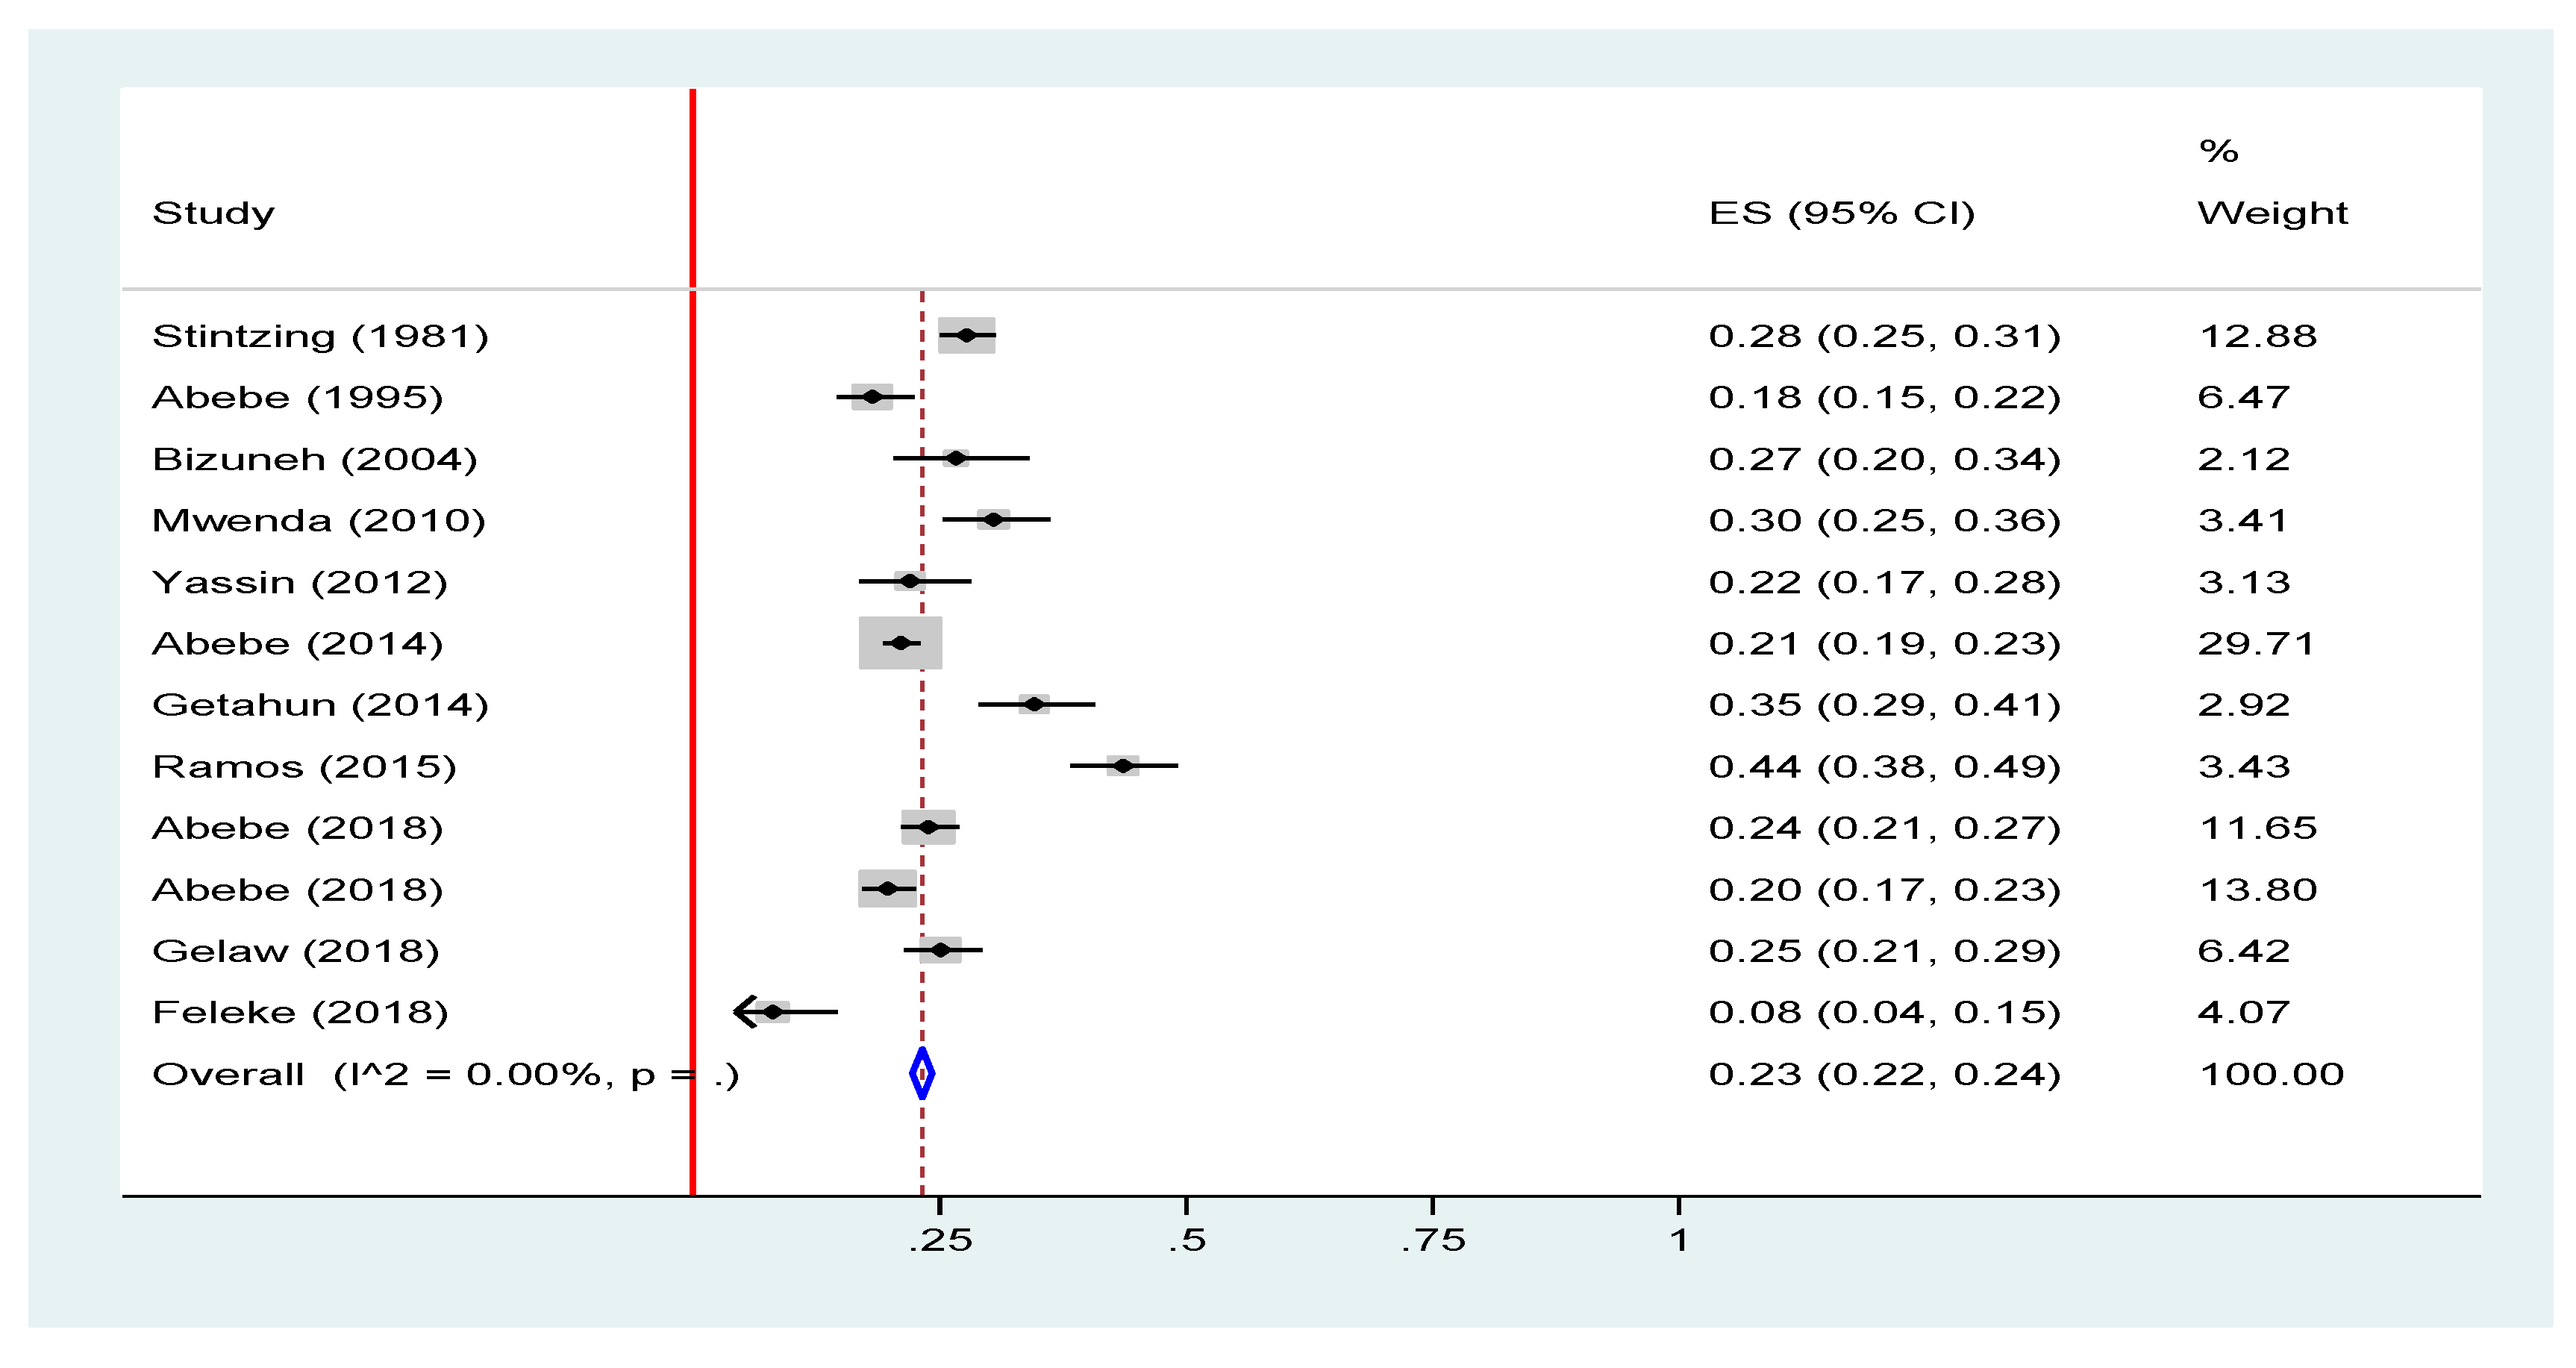
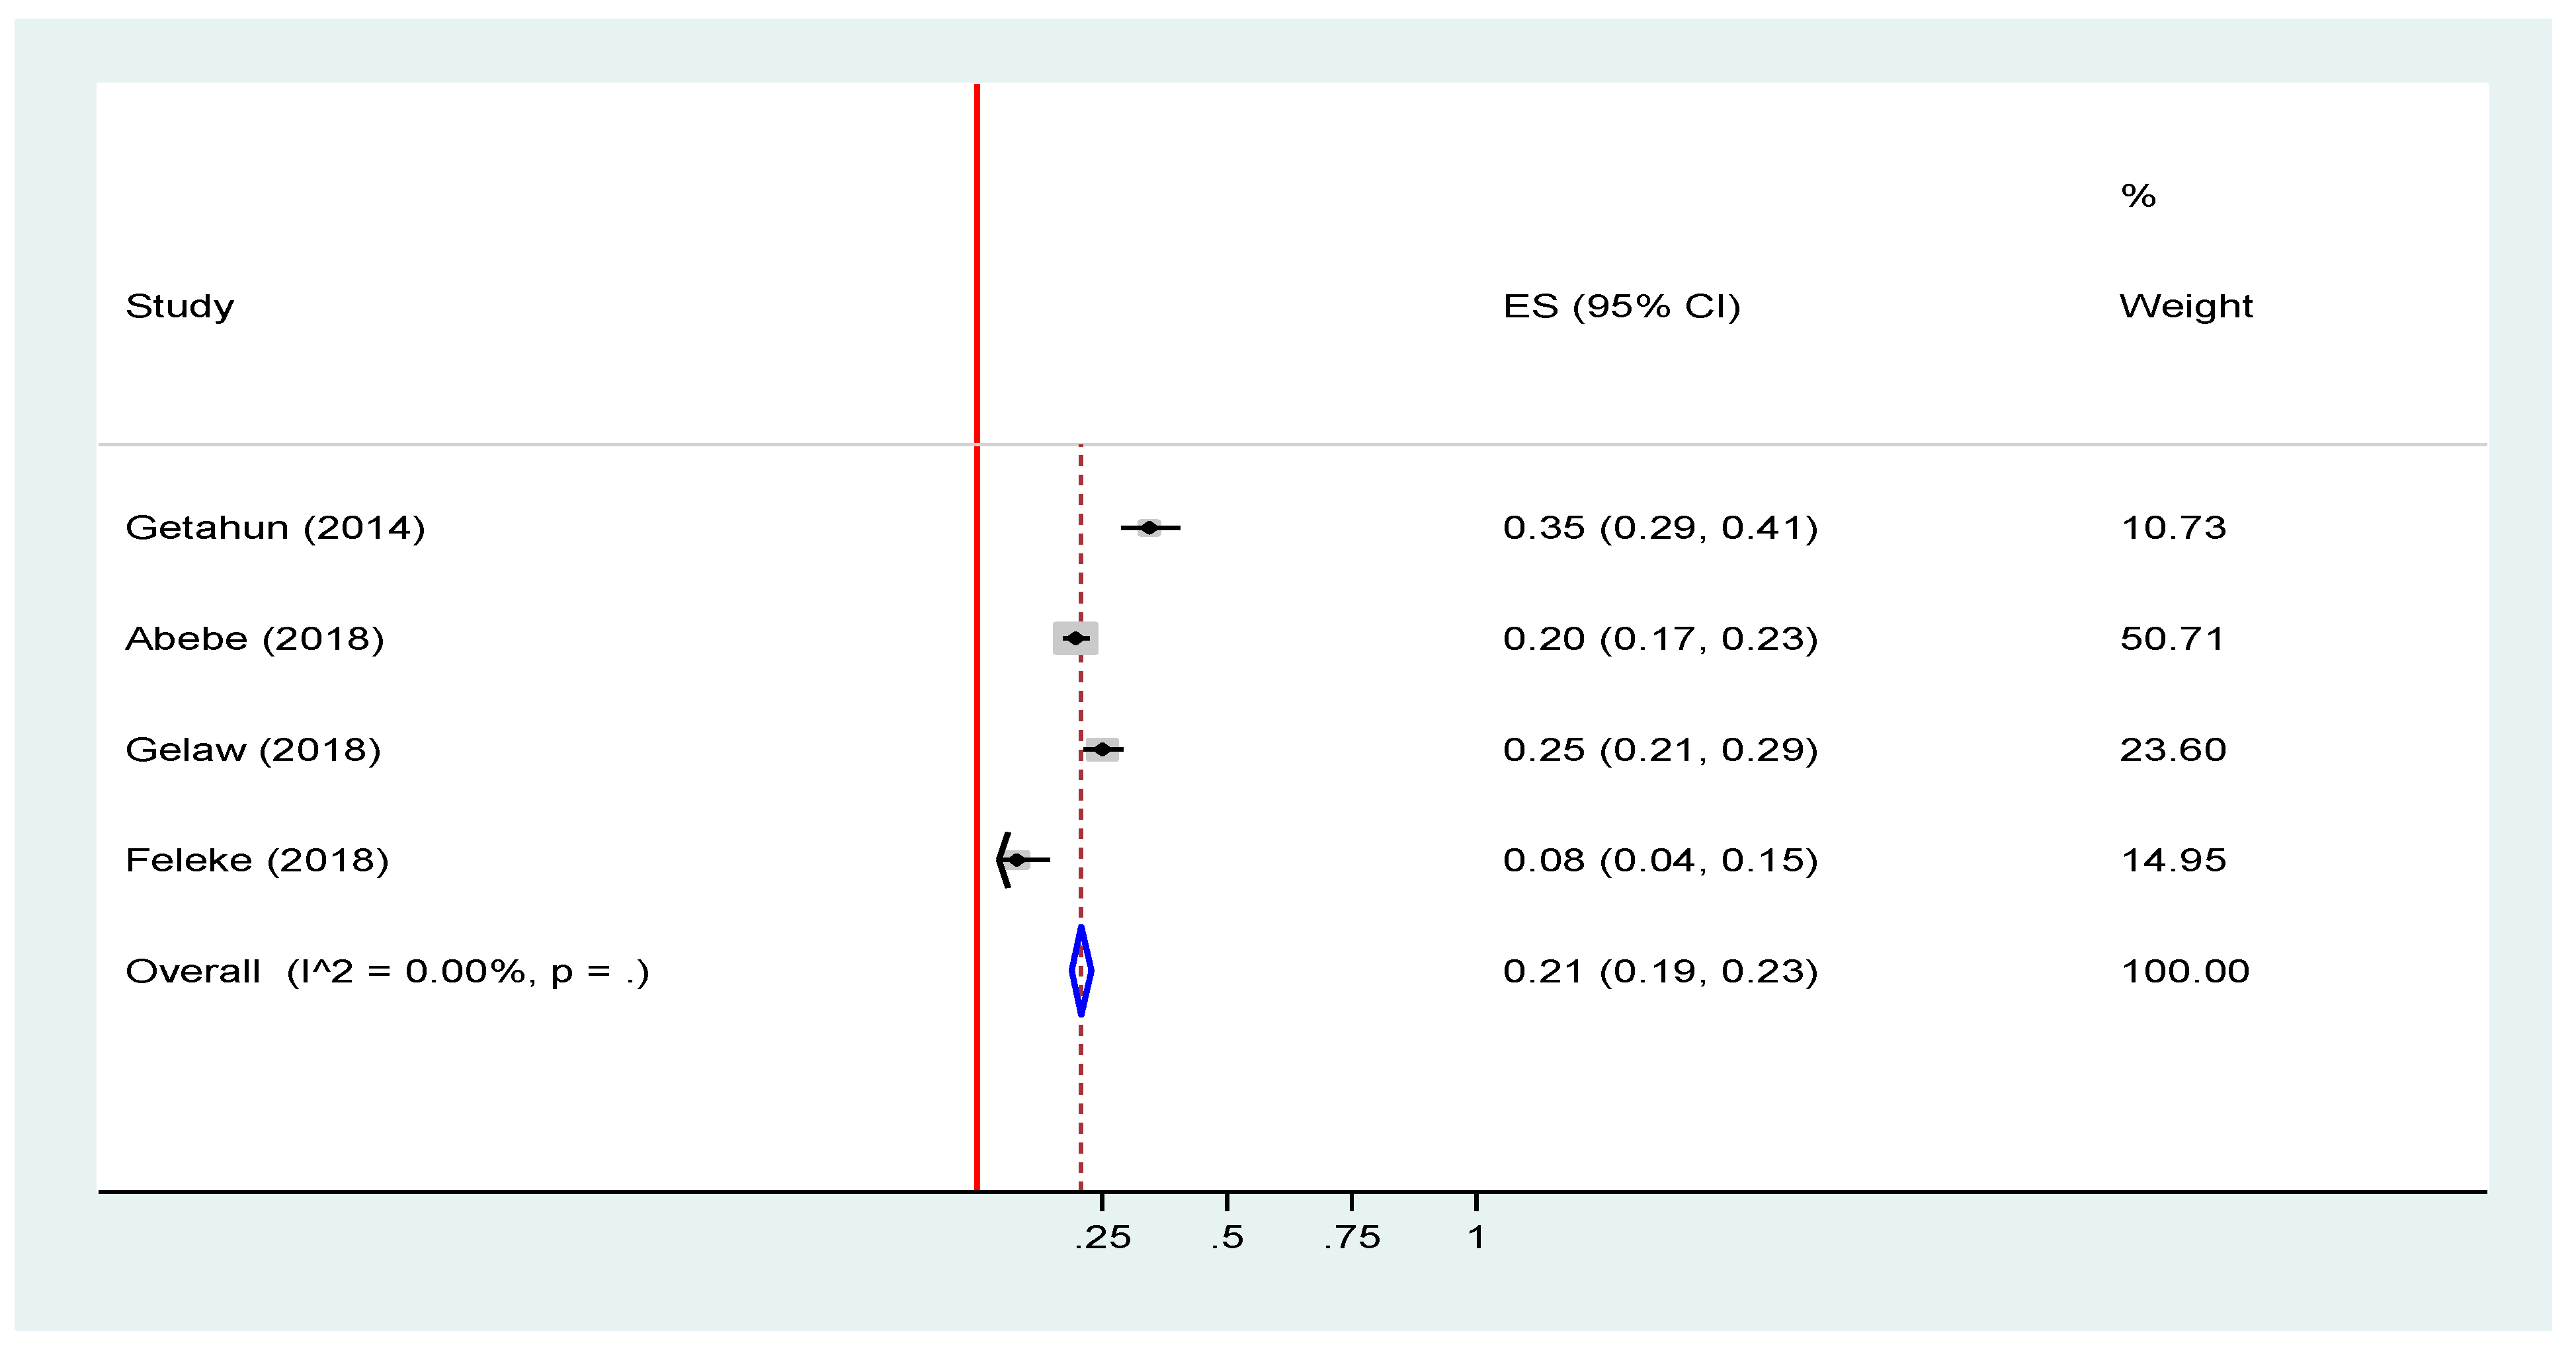
4.2. Prevalence of Rotavirus Infection among under-Five Children in Ethiopia
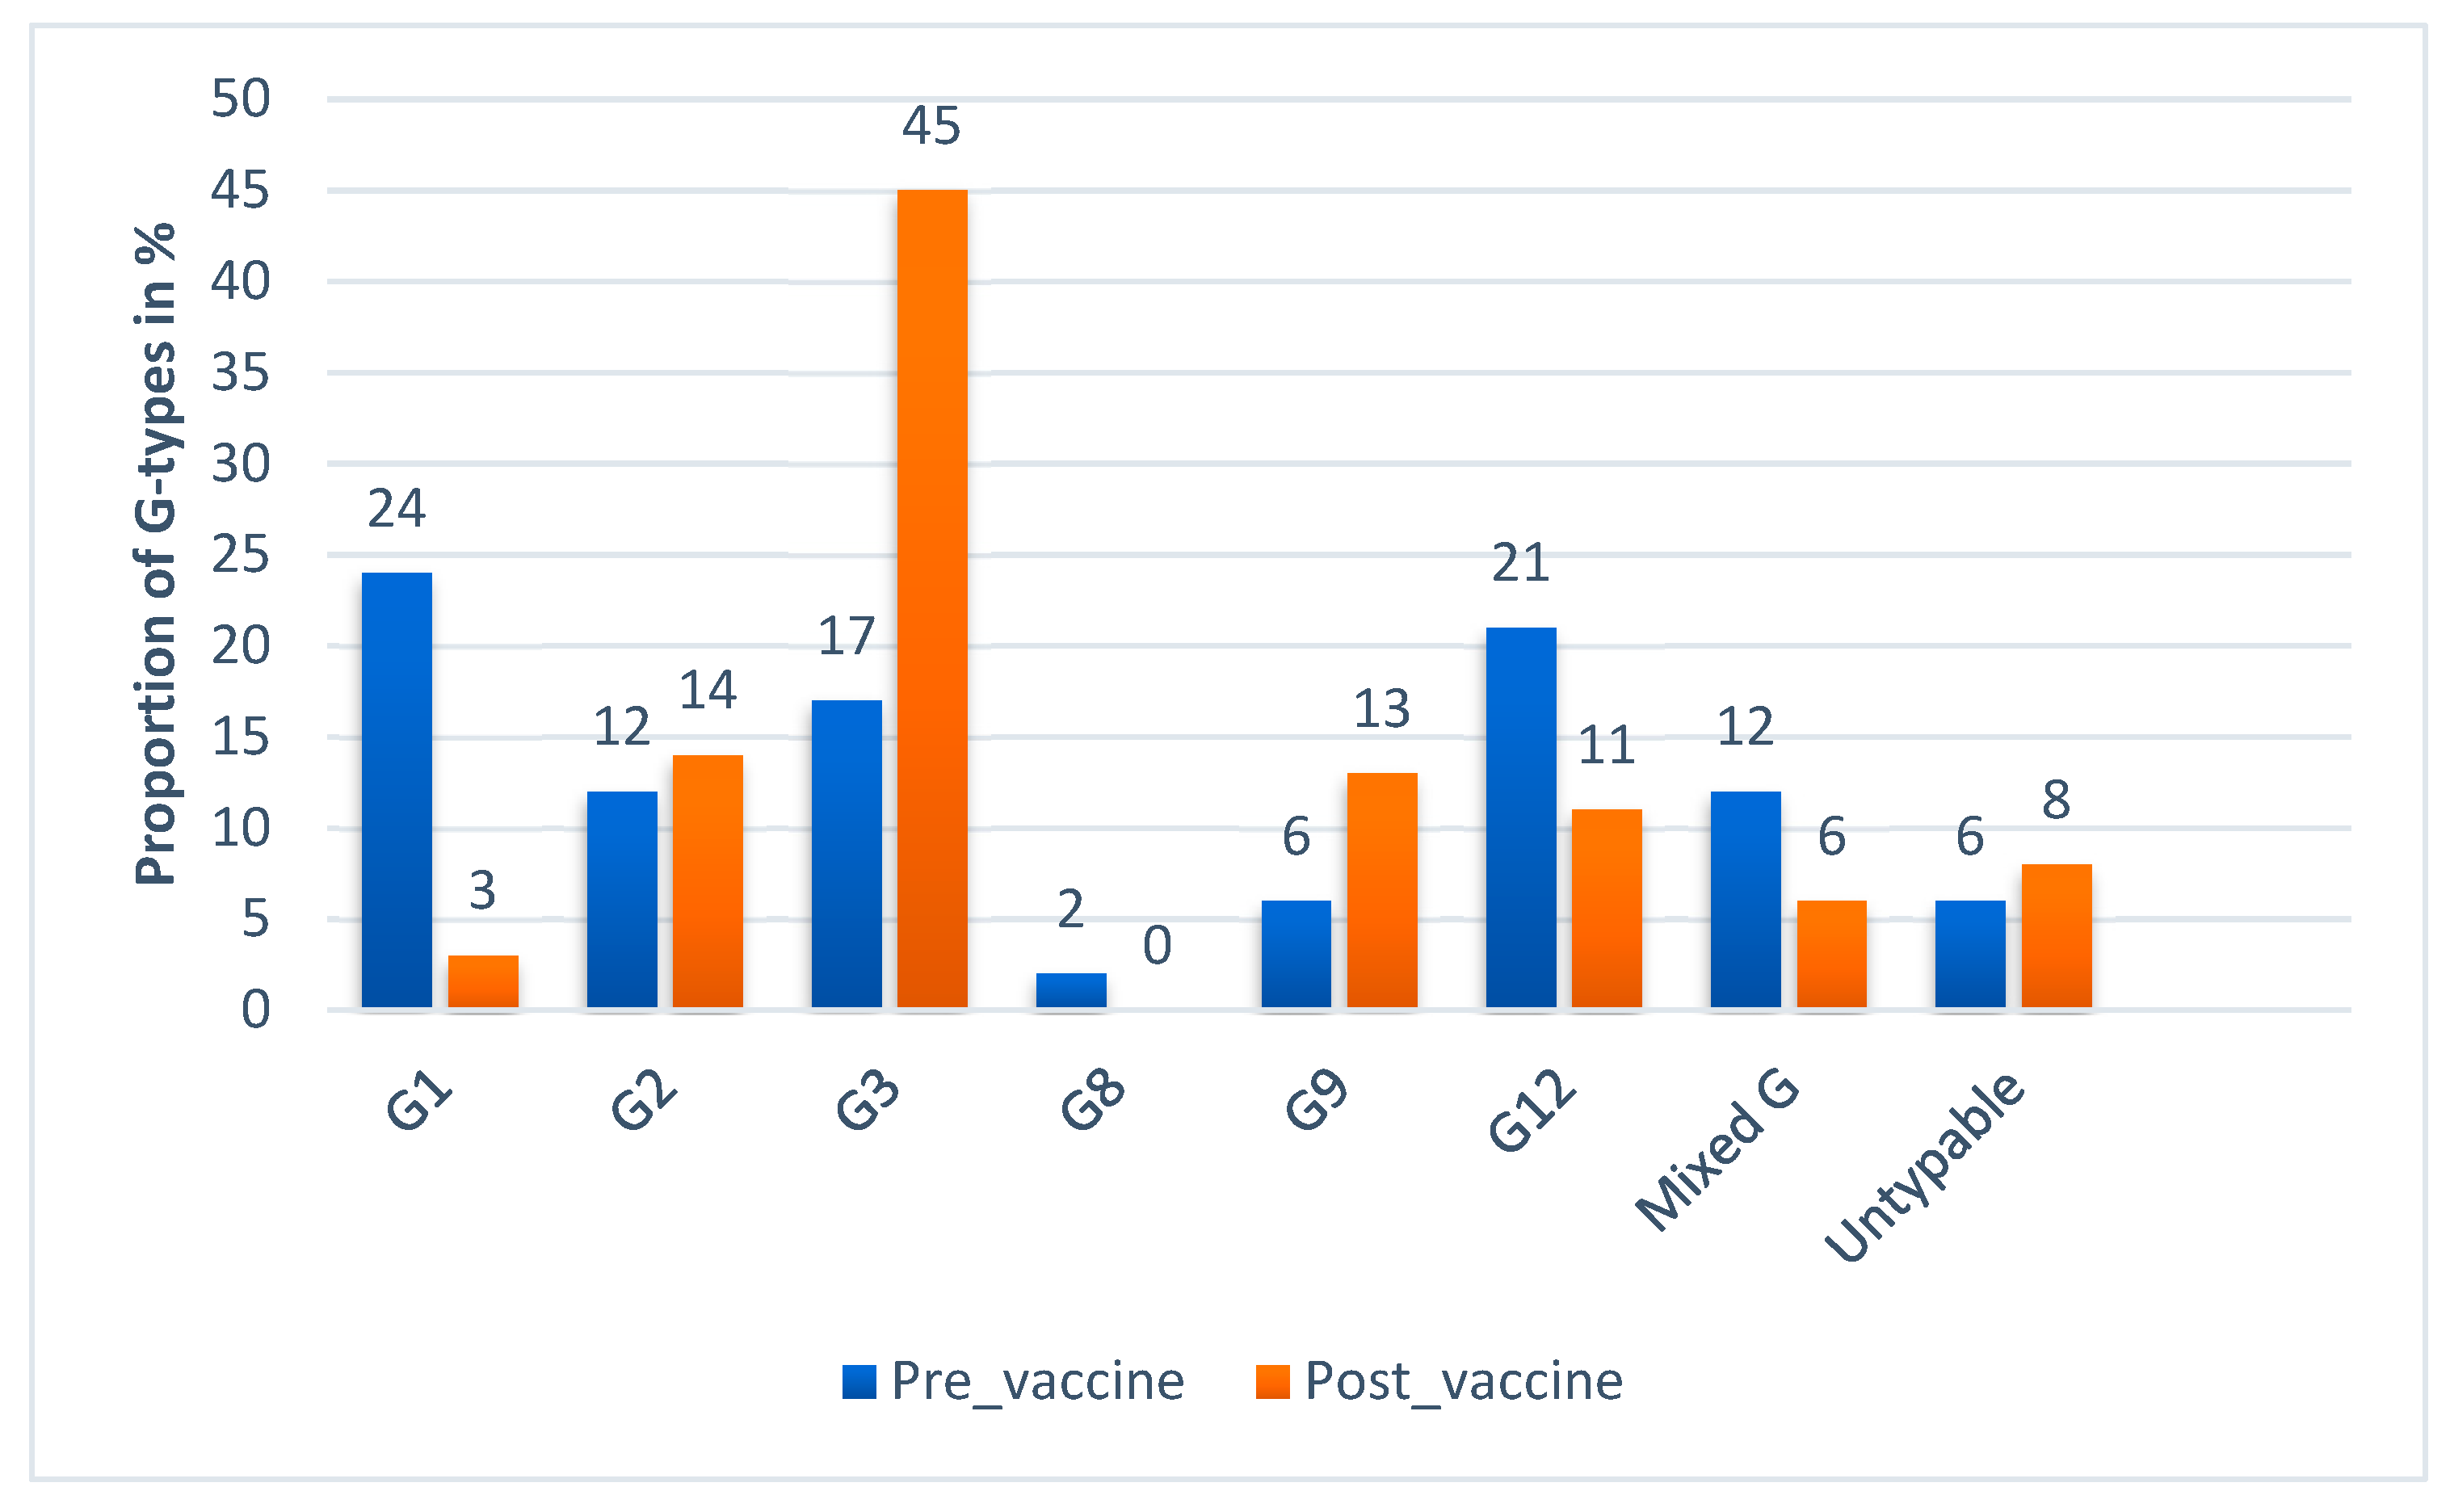
4.3. Genotype Diversity of Rotavirus in Ethiopia
5. Discussion
6. Limitations of the Review Study
7. Conclusions and Recommendations
Author Contributions
Funding
Acknowledgments
Conflicts of Interest
Abbreviations
| EIA | enzyme immune assay |
| ELISA | enzyme linked immune assay |
| JBI | Joanna Briggs Institute |
| NSP | non-structural protein |
| RT-PCR | reverse transcription polymerase chain reaction |
| VP | viral protein |
References
- World Health Organization. Causes of Child Mortality: Global Health Observatory Data. Available online: https://www.who.int/gho/child_health/mortality/causes/en/ (accessed on 25 May 2019).
- Walker, C.L.F.; Perin, J.; Aryee, M.J.; Boschi-Pinto, C.; Black, R.E. Diarrhea incidence in low-and middle-income countries in 1990 and 2010: A systematic review. BMC Public Health 2012, 12, 220. [Google Scholar]
- Centers for Disease Control and Prevention. Rotavirus surveillance—Worldwide, 2009. Morb. Mort. Wkly. Rep. 2011, 60, 514. [Google Scholar]
- Tate, J.E.; Burton, A.H.; Boschi-Pinto, C.; Parashar, U.D.; WHO-Coordinated, G.R.S.N.; Agocs, M.; Serhan, F.; de Oliveira, L.; Mwenda, J.M.; Mihigo, R. Global, regional, and national estimates of rotavirus mortality in children <5 years of age, 2000–2013. Clin. Infec. Dis. 2016, 62, S96–S105. [Google Scholar]
- Estes, M.K.; Greenberg, H.B. Rotaviruses. In Fields Virology, 6th ed.; Knipe, D.M., Howley, P.M., Cohen, J.I., Griffin, D.E., Lamb, R.A., Martin, M.A., Racaniello, V.R., Roizman, B., Eds.; Wolters Kluwer Health/Lippincott Williams & Wilkins: Philadelphia, PA, USA, 2013; pp. 1347–1401. [Google Scholar]
- World Health Organization. Rotavirus vaccines: WHO position paper—January 2013. Wkly. Epi. Rec. 2013, 88, 49–64. [Google Scholar]
- Matthijnssens, J.; Ciarlet, M.; McDonald, S.M.; Attoui, H.; Bányai, K.; Brister, J.R.; Buesa, J.; Esona, M.D.; Estes, M.K.; Gentsch, J.R. Uniformity of rotavirus strain nomenclature proposed by the Rotavirus Classification Working Group (RCWG). Arch. Virol. 2011, 156, 1397–1413. [Google Scholar] [CrossRef] [Green Version]
- Tcheremenskaia, O.; Marucci, G.; De Petris, S.; Ruggeri, F.M.; Dovecar, D.; Sternak, S.L.; Matyasova, I.; Dhimolea, M.K.; Mladenova, Z.; Fiore, L. Molecular epidemiology of rotavirus in Central and Southeastern Europe. J. Clin. Microbiol. 2007, 45, 2197–2204. [Google Scholar] [CrossRef] [Green Version]
- Santos, N.; Hoshino, Y. Global distribution of rotavirus serotypes/genotypes and its implication for the development and implementation of an effective rotavirus vaccine. Rev. Med. Virol. 2005, 15, 29–56. [Google Scholar] [CrossRef]
- Rahman, M.; Matthijnssens, J.; Yang, X.; Delbeke, T.; Arijs, I.; Taniguchi, K.; Iturriza-Gómara, M.; Iftekharuddin, N.; Azim, T.; Van Ranst, M. Evolutionary history and global spread of the emerging G12 human rotaviruses. J. Virol. 2007, 81, 2382–2390. [Google Scholar] [CrossRef] [Green Version]
- Taniguchi, K.; Urasawa, T.; Kobayashi, N.; Gorziglia, M.; Urasawa, S. Nucleotide sequence of VP4 and VP7 genes of human rotaviruses with subgroup I specificity and long RNA pattern: Implication for new G serotype specificity. J. Virol. 1990, 64, 5640–5644. [Google Scholar]
- Neves, M.A.; Pinheiro, H.H.; Silva, R.S.; Linhares, A.C.; Silva, L.D.; Gabbay, Y.B.; Silva, M.C.; Loureiro, E.C.; Soares, L.S.; Mascarenhas, J.D.A.P. High prevalence of G12P[8] rotavirus strains in Rio Branco, Acre, Western Amazon, in the post-rotavirus vaccine introduction period. J. Med. Virol. 2016, 88, 782–789. [Google Scholar] [CrossRef]
- Seheri, M.; Nemarude, L.; Peenze, I.; Netshifhefhe, L.; Nyaga, M.M.; Ngobeni, H.G.; Maphalala, G.; Maake, L.L.; Steele, A.D.; Mwenda, J.M. Update of rotavirus strains circulating in Africa from 2007 through 2011. Pediatr. Infect. Dis. J. 2014, 33, S76–S84. [Google Scholar] [CrossRef] [PubMed]
- Desselberger, U. Differences of rotavirus vaccine effectiveness by country: Likely causes and contributing factors. Pathogens 2017, 6, 65. [Google Scholar] [CrossRef] [PubMed] [Green Version]
- Federal Ministry of Health. Ethiopian National Expanded Programme on Immunization: Comprhencive Munlti-Year Plan 2016–2020 EPI; Federal Ministry of Health: Addis Ababa, Ethiopia, 2015; p. 28.
- Abebe, A.; Teka, T.; Kassa, T.; Seheri, M.; Beyene, B.; Teshome, B.; Kebede, F.; Habtamu, A.; Maake, L.; Kassahun, A.; et al. Hospital-based surveillance for rotavirus gastroenteritis in children younger than 5 years of age in Ethiopia: 2007-2012. Pediatr. Infect. Dis. J. 2014, 33 (Suppl. S1), S28–S33. [Google Scholar] [CrossRef] [Green Version]
- Stintzing, G.; Back, E.; Tufvesson, B.; Johnsson, T.; Wadstrom, T.; Habte, D. Seasonal fluctuations in the occurrence of enterotoxigenic bacteria and rotavirus in paediatric diarrhoea in Addis Ababa. Bull. World Health Organ. 1981, 59, 67–73. [Google Scholar] [PubMed]
- Mekonen, G.; Kassu, D.; Almaz, A. Prevalence of Rota Virus and Associated Risk factors among under Five Children with Gastroenteritis in Selected Health Facilities of Addis Ababa, Ethiopia; Addis Ababa University Addis Ababa: Ethiopia, East Africa, 2014. [Google Scholar]
- Abebe, A.; Getahun, M.; Mapaseka, S.L.; Beyene, B.; Assefa, E.; Teshome, B.; Tefera, M.; Kebede, F.; Habtamu, A.; Haile-Mariam, T.; et al. Impact of rotavirus vaccine introduction and genotypic characteristics of rotavirus strains in children less than 5years of age with gastroenteritis in Ethiopia: 2011–2016. Vaccine 2018, 36, 7043–7047. [Google Scholar] [CrossRef] [PubMed]
- Abebe, A.; Abebe, S.; Giday, M.; Taffesse, B.B. Rotavirus infection in under-five children in Yekatit 12 hospital. Ethiop. J. Health. Dev. 1995, 9, 71–75. [Google Scholar]
- Gelaw, A.; Pietsch, C.; Liebert, U.G. Molecular epidemiology of rotaviruses in Northwest Ethiopia after national vaccine introduction. Infect. Genet. Evol. 2018, 65, 300–307. [Google Scholar] [CrossRef]
- Feleke, H.; Medhin, G.; Abebe, A.; Beyene, B.; Kloos, H.; Asrat, D. Enteric pathogens and associated risk factors among under-five children with and without diarrhea in Wegera District, Northwestern Ethiopia. Pan. Afr. Med. J. 2018, 29, 72. [Google Scholar] [CrossRef]
- Bizuneh, T.; S/Mariam, Z.; Abebe, A.; Lema, E. Rotavirus infection in under-five children in Jimma Hospital, Southwest Ethiopia. Ethiop. J. Health. Dev. 2004, 18, 19–24. [Google Scholar] [CrossRef]
- Ramos, J.M.; Alegria, I.; Tessema, D.; Mohamed, N.; Tissiano, G.; Fano, H.; Yohannes, T.; Gosa, A.; Tesfamariam, A.; Reyes, F. Epidemiology of rotavirus diarrhea among children aged less than 5 years in rural Southern Ethiopia. Arch. Virol. 2015, 46, 434–443. [Google Scholar] [CrossRef]
- Yassin, M.A.; Kirby, A.; Mengistu, A.A.; Arbide, I.; Dove, W.; Beyer, M.; Cunliffe, N.A.; Cuevas, L.E. Unusual norovirus and rotavirus genotypes in Ethiopia. Paediatr. Int. Child. Health. 2012, 32, 51–55. [Google Scholar] [CrossRef] [PubMed]
- Mwenda, J.M.; Ntoto, K.M.; Abebe, A.; Enweronu-Laryea, C.; Amina, I.; Mchomvu, J.; Kisakye, A.; Mpabalwani, E.M.; Pazvakavambwa, I.; Armah, G.E. Burden and epidemiology of rotavirus diarrhea in selected African countries: Preliminary results from the African Rotavirus Surveillance Network. J. Inf. Dis. 2010, 202, S5–S11. [Google Scholar] [CrossRef] [PubMed] [Green Version]
- Linhares, A.C.; Stupka, J.A.; Ciapponi, A.; Bardach, A.E.; Glujovsky, D.; Aruj, P.K.; Mazzoni, A.; Rodriguez, J.A.; Rearte, A.; Lanzieri, T.M.; et al. Burden and typing of rotavirus group A in Latin America and the Caribbean: Systematic review and meta-analysis. Rev. Med. Virol. 2011, 21, 89–109. [Google Scholar] [CrossRef] [PubMed]
- Monavari, S.H.R.; Hadifar, S.; Mostafaei, S.; Miri, A.; Keshavarz, M.; Babaei, F.; Moghoofei, M. Epidemiology of Rotavirus in the Iranian Children: A Systematic Review and Meta-analysis. J. Glob. Infect. Dis. 2017, 9, 66–72. [Google Scholar] [CrossRef]
- Moradi-Lakeh, M.; Shakerian, S.; Yaghoubi, M.; Esteghamati, A.; Shokraneh, F.; Baradaran, H.R.; Ghanaee, R.M. Rotavirus Infection in Children with Acute Gastroenteritis in Iran: A Systematic Review and Meta-analysis. Int. J. Prev. Med. 2014, 5, 1213–1223. [Google Scholar]
- Liu, N.; Xu, Z.; Li, D.; Zhang, Q.; Wang, H.; Duan, Z.J. Update on the disease burden and circulating strains of rotavirus in China: A systematic review and meta-analysis. Vaccine 2014, 32, 4369–4375. [Google Scholar] [CrossRef]
- Sanchez-Padilla, E.; Grais, R.F.; Guerin, P.J.; Steele, A.D.; Burny, M.E.; Luquero, F.J. Burden of disease and circulating serotypes of rotavirus infection in sub-Saharan Africa: Systematic review and meta-analysis. Lancet Infect. Dis. 2009, 9, 567–576. [Google Scholar] [CrossRef] [Green Version]
- Ouermi, D.; Soubeiga, D.; Nadembega, W.; Sawadogo, P.; Zohoncon, T.; Obiri-Yeboah, D.; Djigma, F.; Nordgren, J.; Simpore, J. Molecular epidemiology of rotavirus in children under five in Africa (2006–2016): A systematic review. Pak. J. Biol. Sci. 2017, 20, 59–69. [Google Scholar]
- Li, Y.; Wang, S.M.; Zhen, S.S.; Chen, Y.; Deng, W.; Kilgore, P.E.; Wang, X.Y. Diversity of rotavirus strains causing diarrhea in <5 years old Chinese children: A systematic review. PLoS ONE 2014, 9, e84699. [Google Scholar] [CrossRef]
- Seheri, L.; Magagula, N.; Peenze, I.; Rakau, K.; Ndadza, A.; Mwenda, J.; Weldegebriel, G.; Steele, A.; Mphahlele, M. Rotavirus strain diversity in Eastern and Southern African countries before and after vaccine introduction. Vaccine 2018, 36, 7222–7230. [Google Scholar] [CrossRef]
- Japhet, M.O.; Adesina, O.A.; Famurewa, O.; Svensson, L.; Nordgren, J. Molecular epidemiology of rotavirus and norovirus in Ile-Ife, Nigeria: High prevalence of G12P [8] rotavirus strains and detection of a rare norovirus genotype. J. Med. Virol. 2012, 84, 1489–1496. [Google Scholar] [CrossRef] [PubMed]
- Burke, R.M.; Tate, J.E.; Barin, N.; Bock, C.; Bowen, M.D.; Chang, D.; Gautam, R.; Han, G.; Holguin, J.; Huynh, T. Three Rotavirus Outbreaks in the Postvaccine Era—California, 2017. Morb. Mort. Wkly. Rep. 2018, 67, 470. [Google Scholar] [CrossRef] [PubMed] [Green Version]
- European Centre for Disease Prevention and Control. Disease Factsheet about Rotavirus. Available online: https://www.ecdc.europa.eu/en/rotavirus-infection/facts (accessed on 1 December 2019).


| No. | Author | Year | Vaccination | Region | Design | Setting | Lab Method | Rotavirus Cases | Sample Size | Proportion (%) | Samples Genotyped | Reference |
|---|---|---|---|---|---|---|---|---|---|---|---|---|
| 1 | Abebe | 2014 | Pre-Vaccine | Addis Ababa | Sentinel surveillance | Facility Based | EIA and RT-PCR | 388 | 1841 | 21.08 | 215 | [16] |
| 2 | Stintzing | 1981 | Pre-Vaccine | Addis Ababa | Cross-sectional | Facility Based | IE | 267 | 962 | 27.75 | [17] | |
| 3 | Getahun | 2014 | Post-Vaccine | Addis Ababa | Cross-sectional | Facility Based | EIA | 85 | 246 | 34.55 | [18] | |
| 4 | Abebe * | 2018 | Pre-Vaccine | Addis Ababa | Sentinel surveillance | Facility Based | EIA and RT-PCR | 188 | 788 | 23.86 | 156 | [19] |
| 5 | Abebe * | 2018 | Post-Vaccine | Addis Ababa | Sentinel surveillance | Facility Based | EIA and RT-PCR | 161 | 815 | 19.75 | 141 | [19] |
| 6 | Abebe | 1995 | Pre-Vaccine | Addis Ababa | Cross-sectional | Facility Based | EIA | 65 | 358 | 18.16 | [20] | |
| 7 | Gelaw | 2018 | Post-Vaccine | Amhara | Cross-sectional | Facility Based | RT_PCR | 113 | 450 | 25.11 | 113 | [21] |
| 8 | Feleke | 2018 | Post-Vaccine | Amhara | Cross-sectional | Community Based | EIA | 9 | 112 | 8.04 | [22] | |
| 9 | Bizuneh | 2004 | Pre-Vaccine | Oromia | Cross-sectional | Facility Based | EIA | 41 | 154 | 26.62 | [23] | |
| 10 | Ramos | 2015 | Pre-Vaccine | Oromia | Cross-sectional | Facility Based | EIA | 137 | 314 | 43.63 | [24] | |
| 11 | Yassin | 2012 | Pre-Vaccine | SNNPR | Cross-sectional | Facility Based | EIA and RT-PCR | 44 | 200 | 22.00 | 42 | [25] |
| 12 | Mwenda | 2010 | Pre-Vaccine | Addis Ababa | Sentinel surveillance | Facility Based | EIA and RT-PCR | 82 | 269 | 30.48 | 52 | [26] |
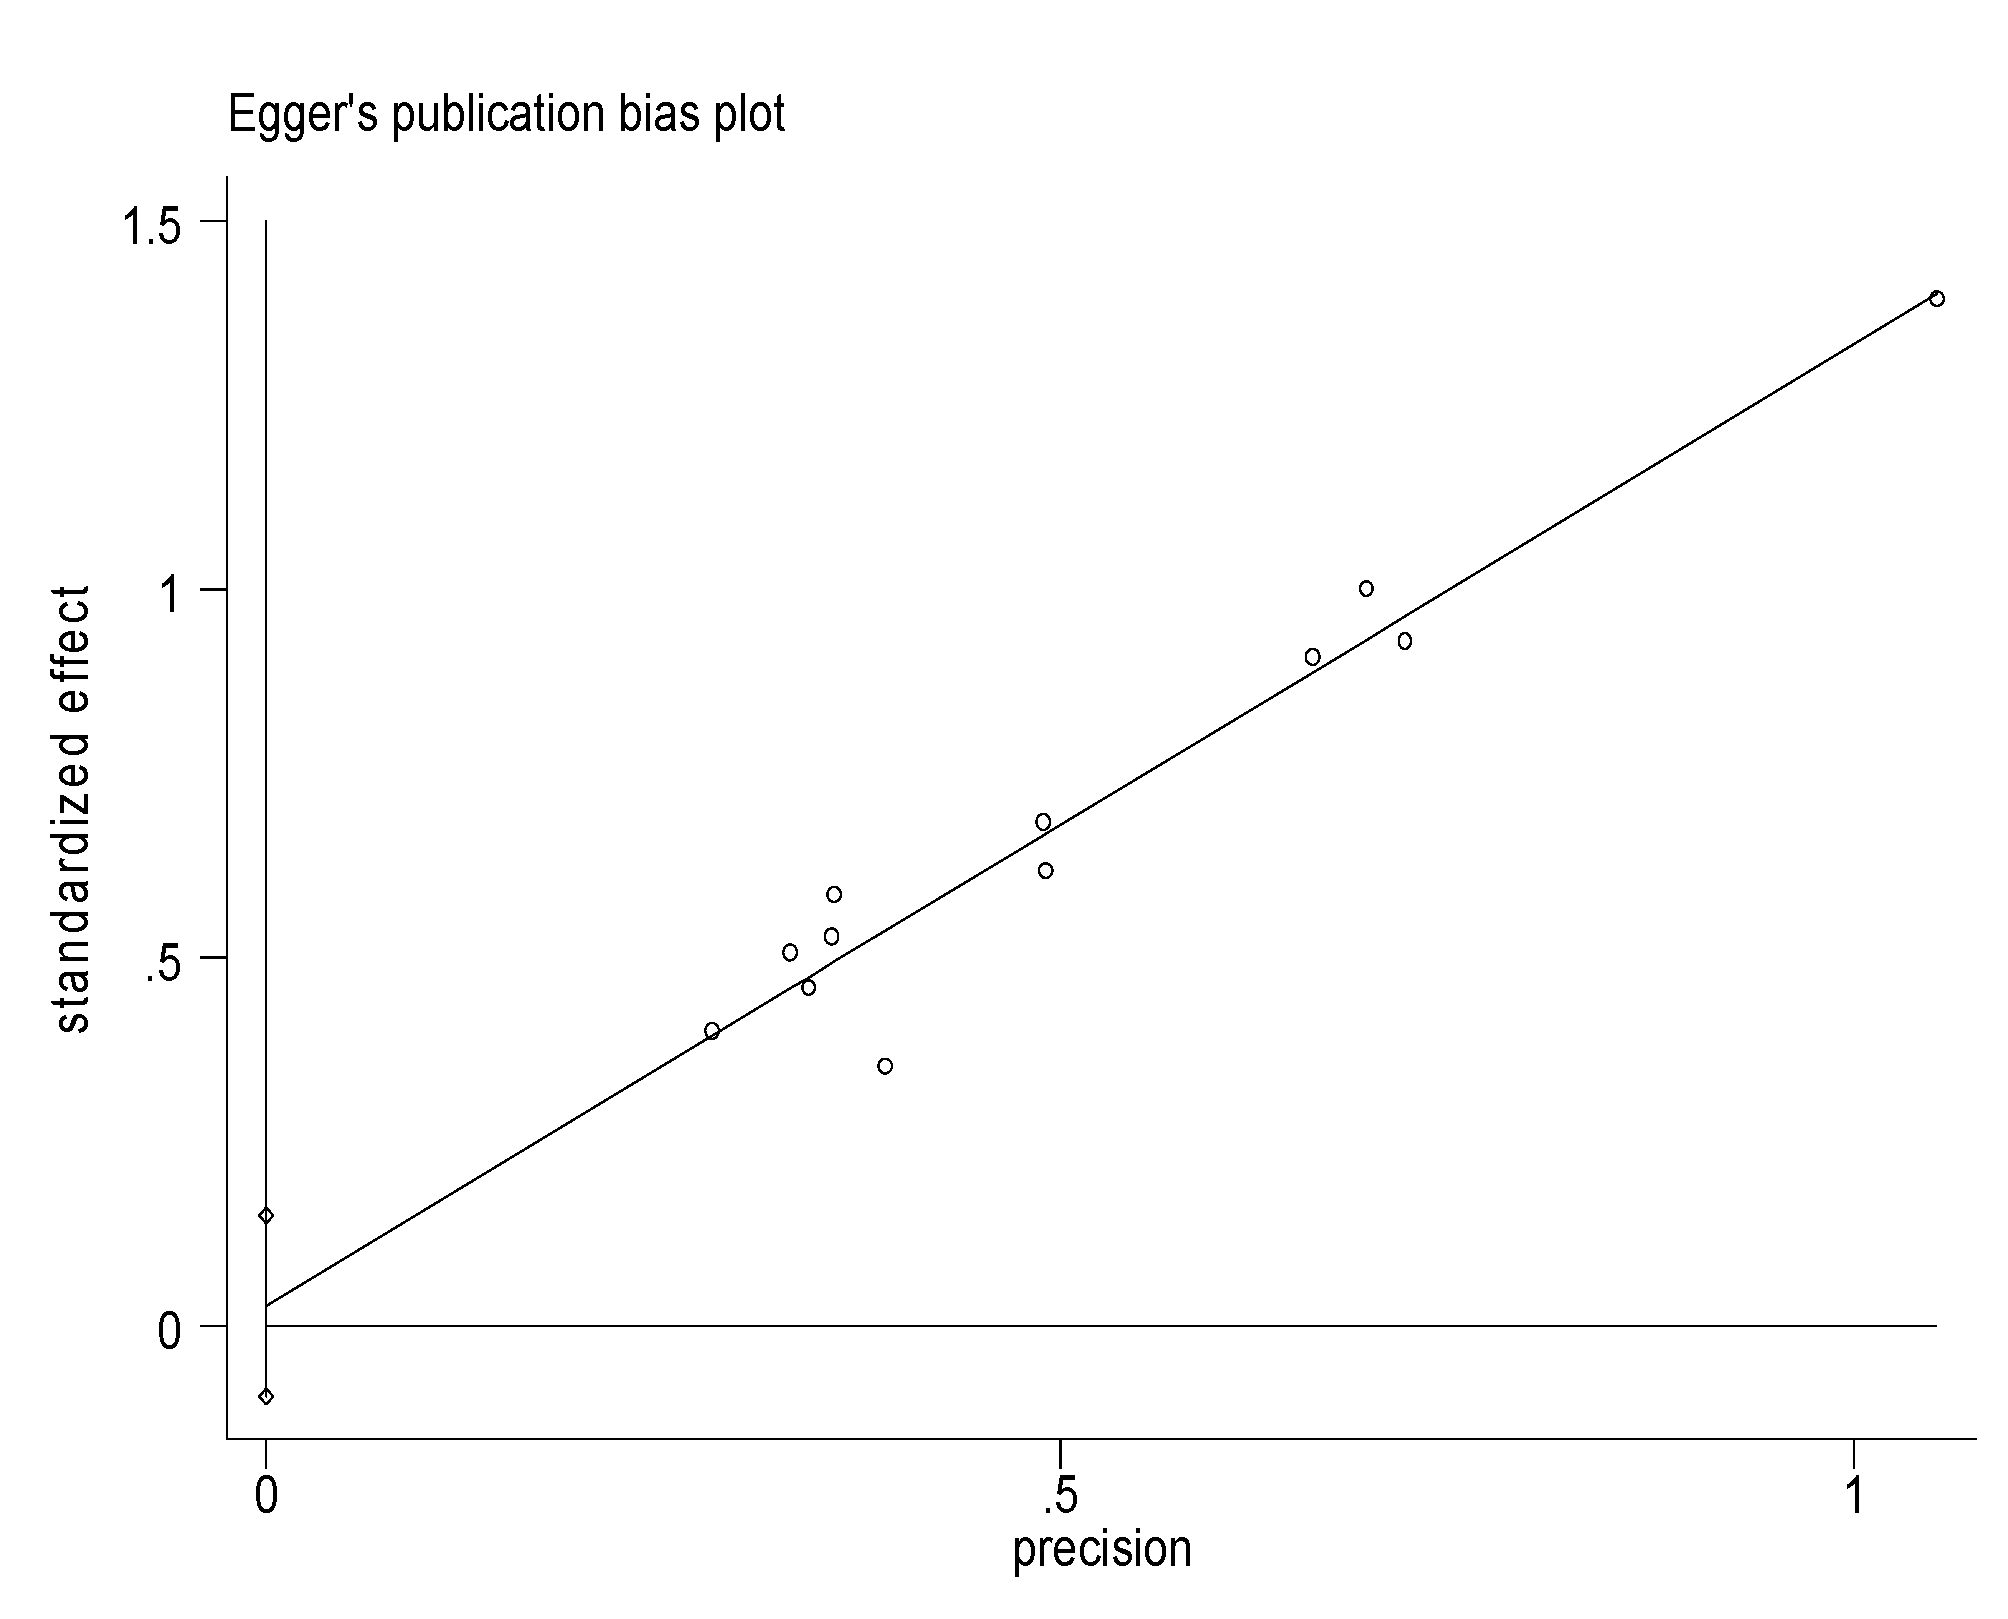
| Standard Effect | Coefficient | Standard Error | t | P>|t| | [95% Confidence Interval] |
|---|---|---|---|---|---|
| Slope | 3.002352 | 0.2271448 | 13.22 | 0.000 | 2.496242–3.508463 |
| Bias | 0.0649642 | 0.1265539 | 0.51 | 0.619 | −0.2170154–0.3469438 |
| G/P Combinations | Pre-Vaccine Introduction Number (%) | Post-Vaccine Introduction Number (%) | Overall Number (%) | References |
|---|---|---|---|---|
| G1P[4] | 1 (0.22) | 0 (0) | 1 (0.14) | [19] |
| G1P[6] | 21 (4.51) | 2 (0.79) | 23 (3.2) | [16,19,26] |
| G1P[8] | 92 (19.78) | 6 (2.36) | 98 (13.6) | [16,19,25,26] |
| G2P[4] | 49 (10.54) | 36 (14.17) | 85 (11.8) | [16,19,21,25,26] |
| G2P[6] | 7 (1.5) | 0 (0) | 7 (1.0) | [16] |
| G3P[6] | 78 (16.77) | 24 (9.45) | 102 (14.2) | [16,19,21,25,26] |
| G3P[8] | 2 (0.43) | 91 (35.83) | 93 (12.9) | [19,21] |
| G8P[6] | 9 (1.94) | 0 (0) | 9 (1.3) | [25,26] |
| G8P[8] | 1 (0.22) | 0 (0) | 1 (0.14) | [26] |
| G9P[4] | 0 (0) | 1 (0.39) | 1 (0.14) | [19] |
| G9P[6] | 9 (1.94) | 0 (0) | 9 (1.3) | [16,19] |
| G9P[8] | 18 (3.87) | 31 (12.2) | 49 (6.8) | [16,19,21,25] |
| G12P[4] | 0 (0) | 2 (0.79) | 2 (0.27) | [19] |
| G12P[6] | 10 (2.15) | 1 (0.39) | 11 (1.5) | [16,19,25] |
| G12P[8] | 86 (18.49) | 25 (9.94) | 111 (15.4) | [16,19,21,25,26] |
| Mixed-G/P | 54 (11.61) | 15 (3.91) | 69 (9.6) | [16,19,26] |
| Untypable | 28 (6.02) | 20 (7.87) | 48 (6.7) | [16,19,26] |
| Total | 465 (100) | 254 (100) | 719 (100) |
© 2020 by the authors. Licensee MDPI, Basel, Switzerland. This article is an open access article distributed under the terms and conditions of the Creative Commons Attribution (CC BY) license (http://creativecommons.org/licenses/by/4.0/).
Share and Cite
Damtie, D.; Melku, M.; Tessema, B.; Vlasova, A.N. Prevalence and Genetic Diversity of Rotaviruses among under-Five Children in Ethiopia: A Systematic Review and Meta-Analysis. Viruses 2020, 12, 62. https://0-doi-org.brum.beds.ac.uk/10.3390/v12010062
Damtie D, Melku M, Tessema B, Vlasova AN. Prevalence and Genetic Diversity of Rotaviruses among under-Five Children in Ethiopia: A Systematic Review and Meta-Analysis. Viruses. 2020; 12(1):62. https://0-doi-org.brum.beds.ac.uk/10.3390/v12010062
Chicago/Turabian StyleDamtie, Debasu, Mulugeta Melku, Belay Tessema, and Anastasia N. Vlasova. 2020. "Prevalence and Genetic Diversity of Rotaviruses among under-Five Children in Ethiopia: A Systematic Review and Meta-Analysis" Viruses 12, no. 1: 62. https://0-doi-org.brum.beds.ac.uk/10.3390/v12010062