Metabolomic Profiling of the Immune Stimulatory Effect of Eicosenoids on PMA-Differentiated THP-1 Cells

 , , and
Abstract
:1. Introduction
2. Materials and Methods
2.1. Sample Preparation
2.2. Cell Culture and Differentiation
2.3. Cell Viability Assay
2.4. Cytokine Production
2.5. Enzyme-Linked Immunosorbent Assay (ELISA)
2.6. Metabolite Extraction
2.7. LC-MS Conditions
2.8. Data Extraction and Statistical Analysis
3. Results
3.1. Cytotoxicity of Eicosenoid Compounds against PMA-Differentiated THP-1 Cells
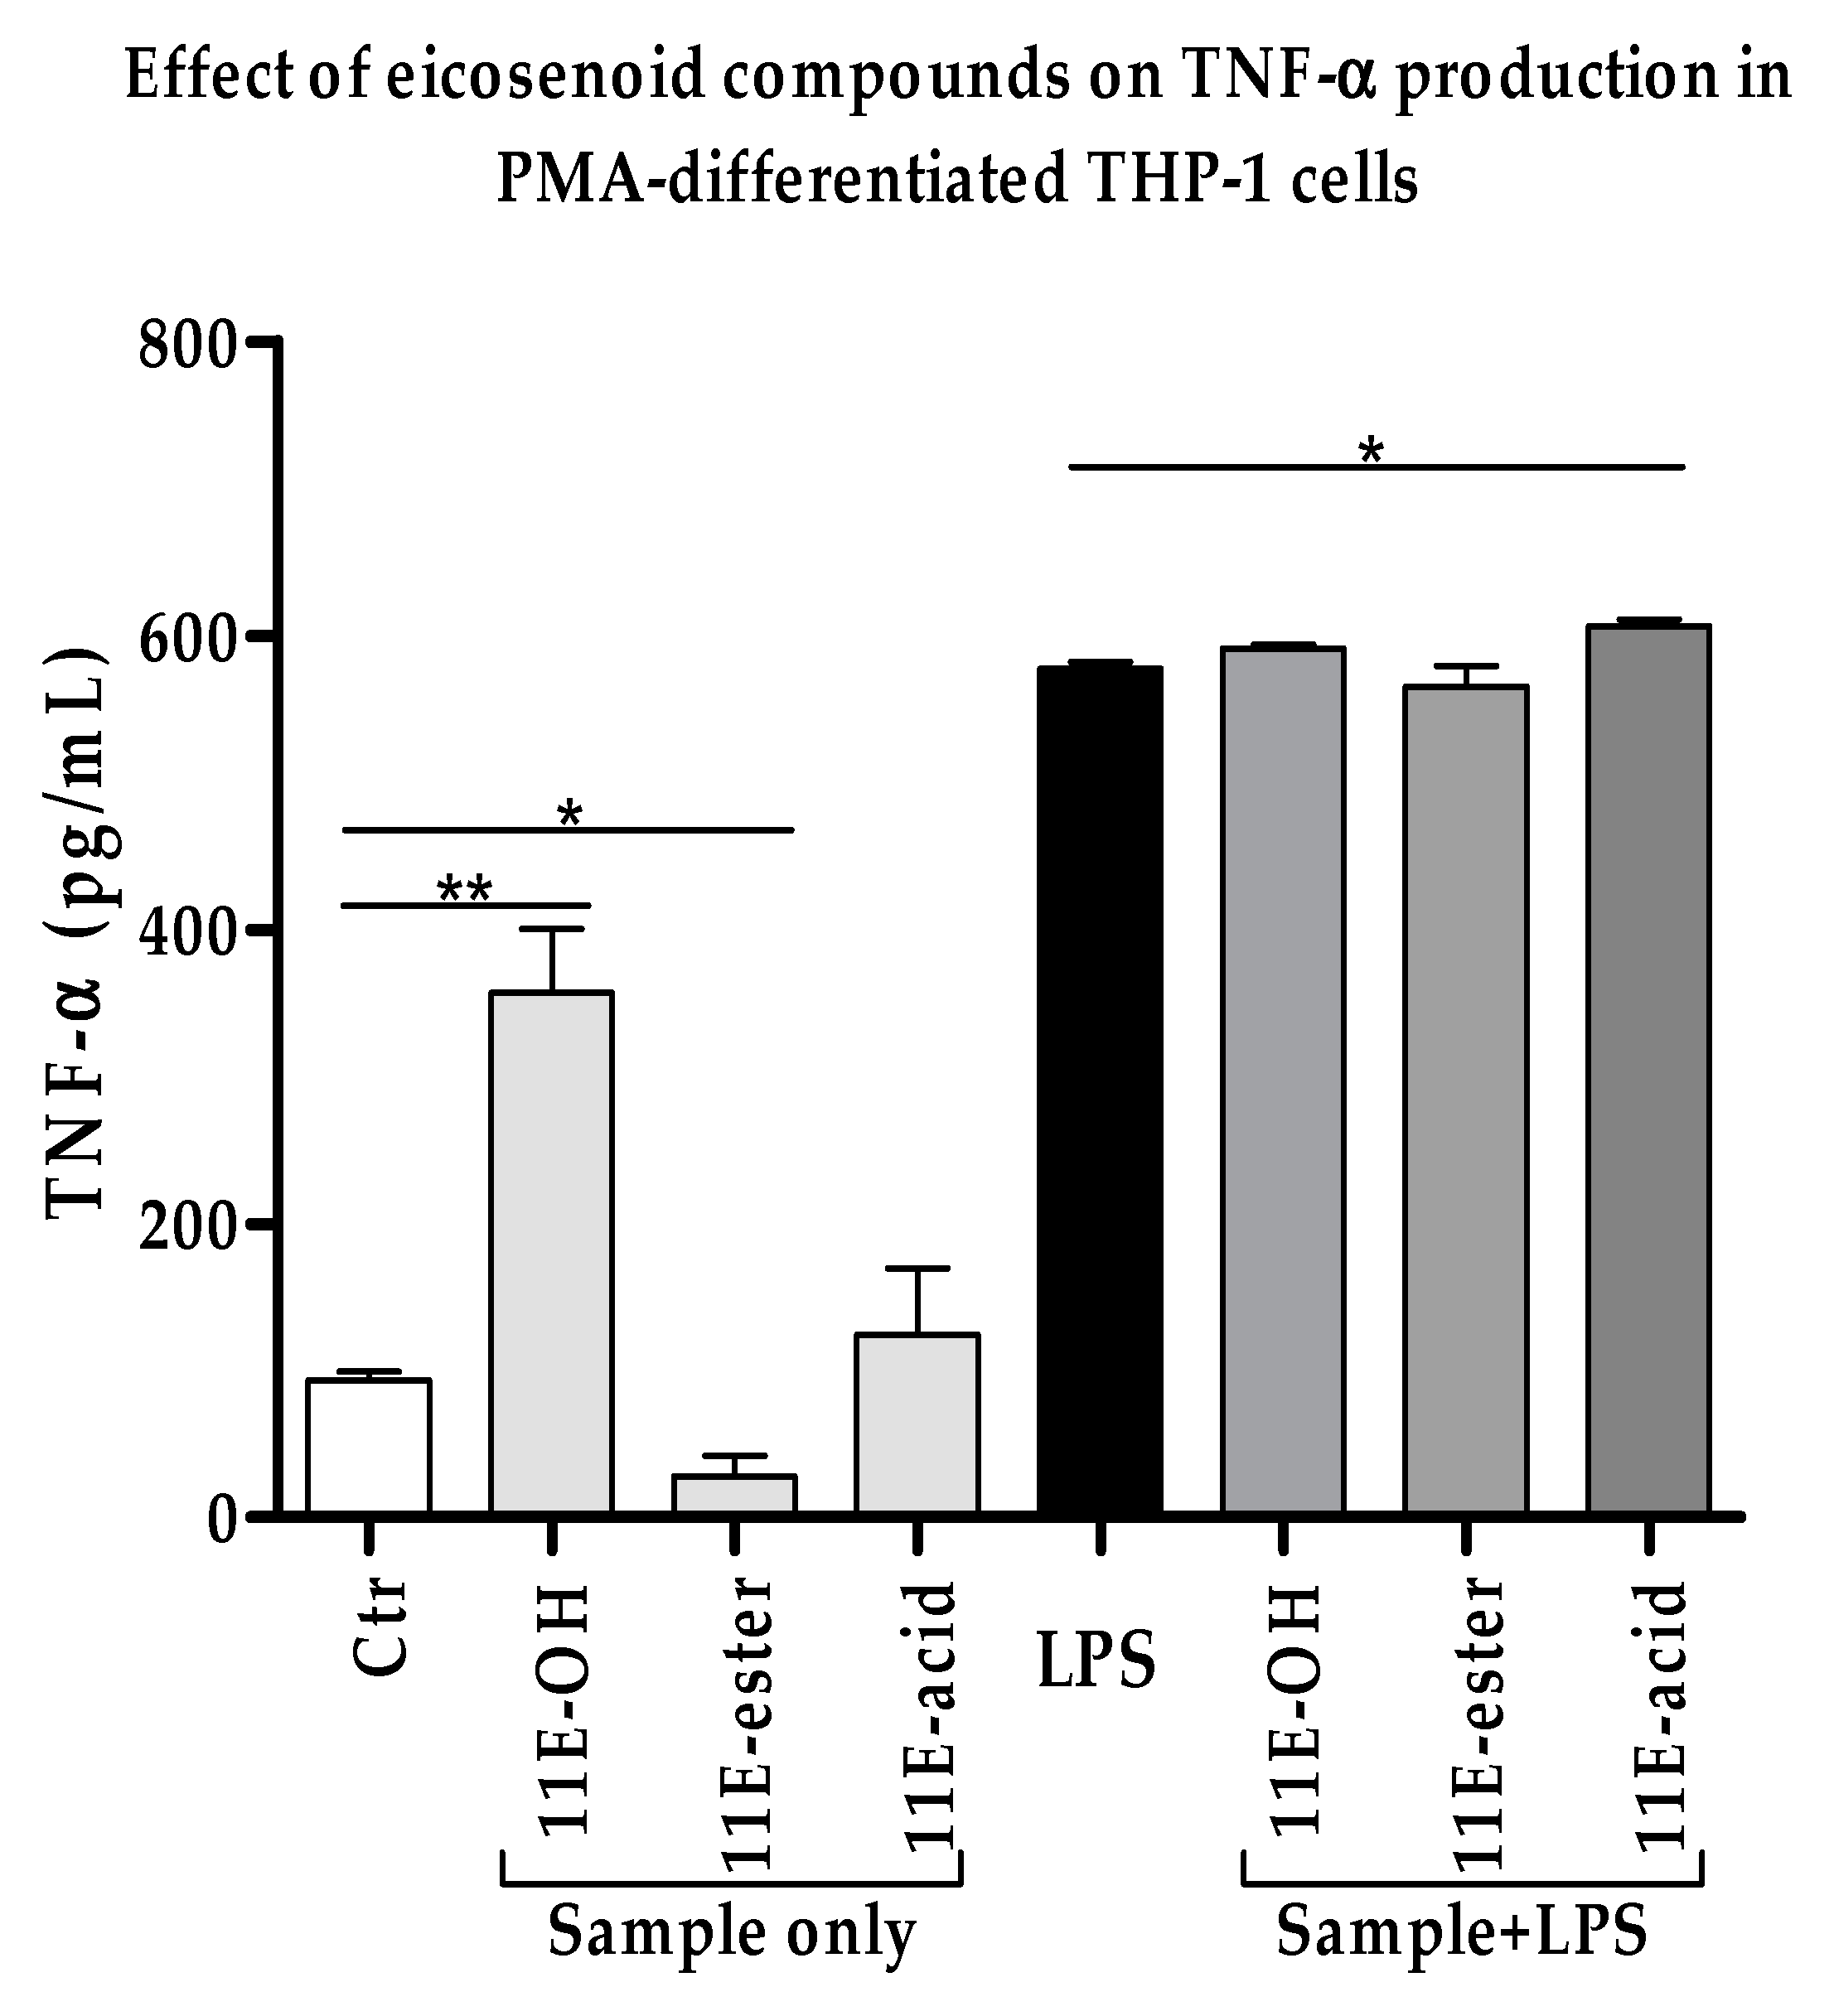
3.2. Effect of Eicosenoid Compounds on Pro-Inflammatory TNF-α Cytokine Production
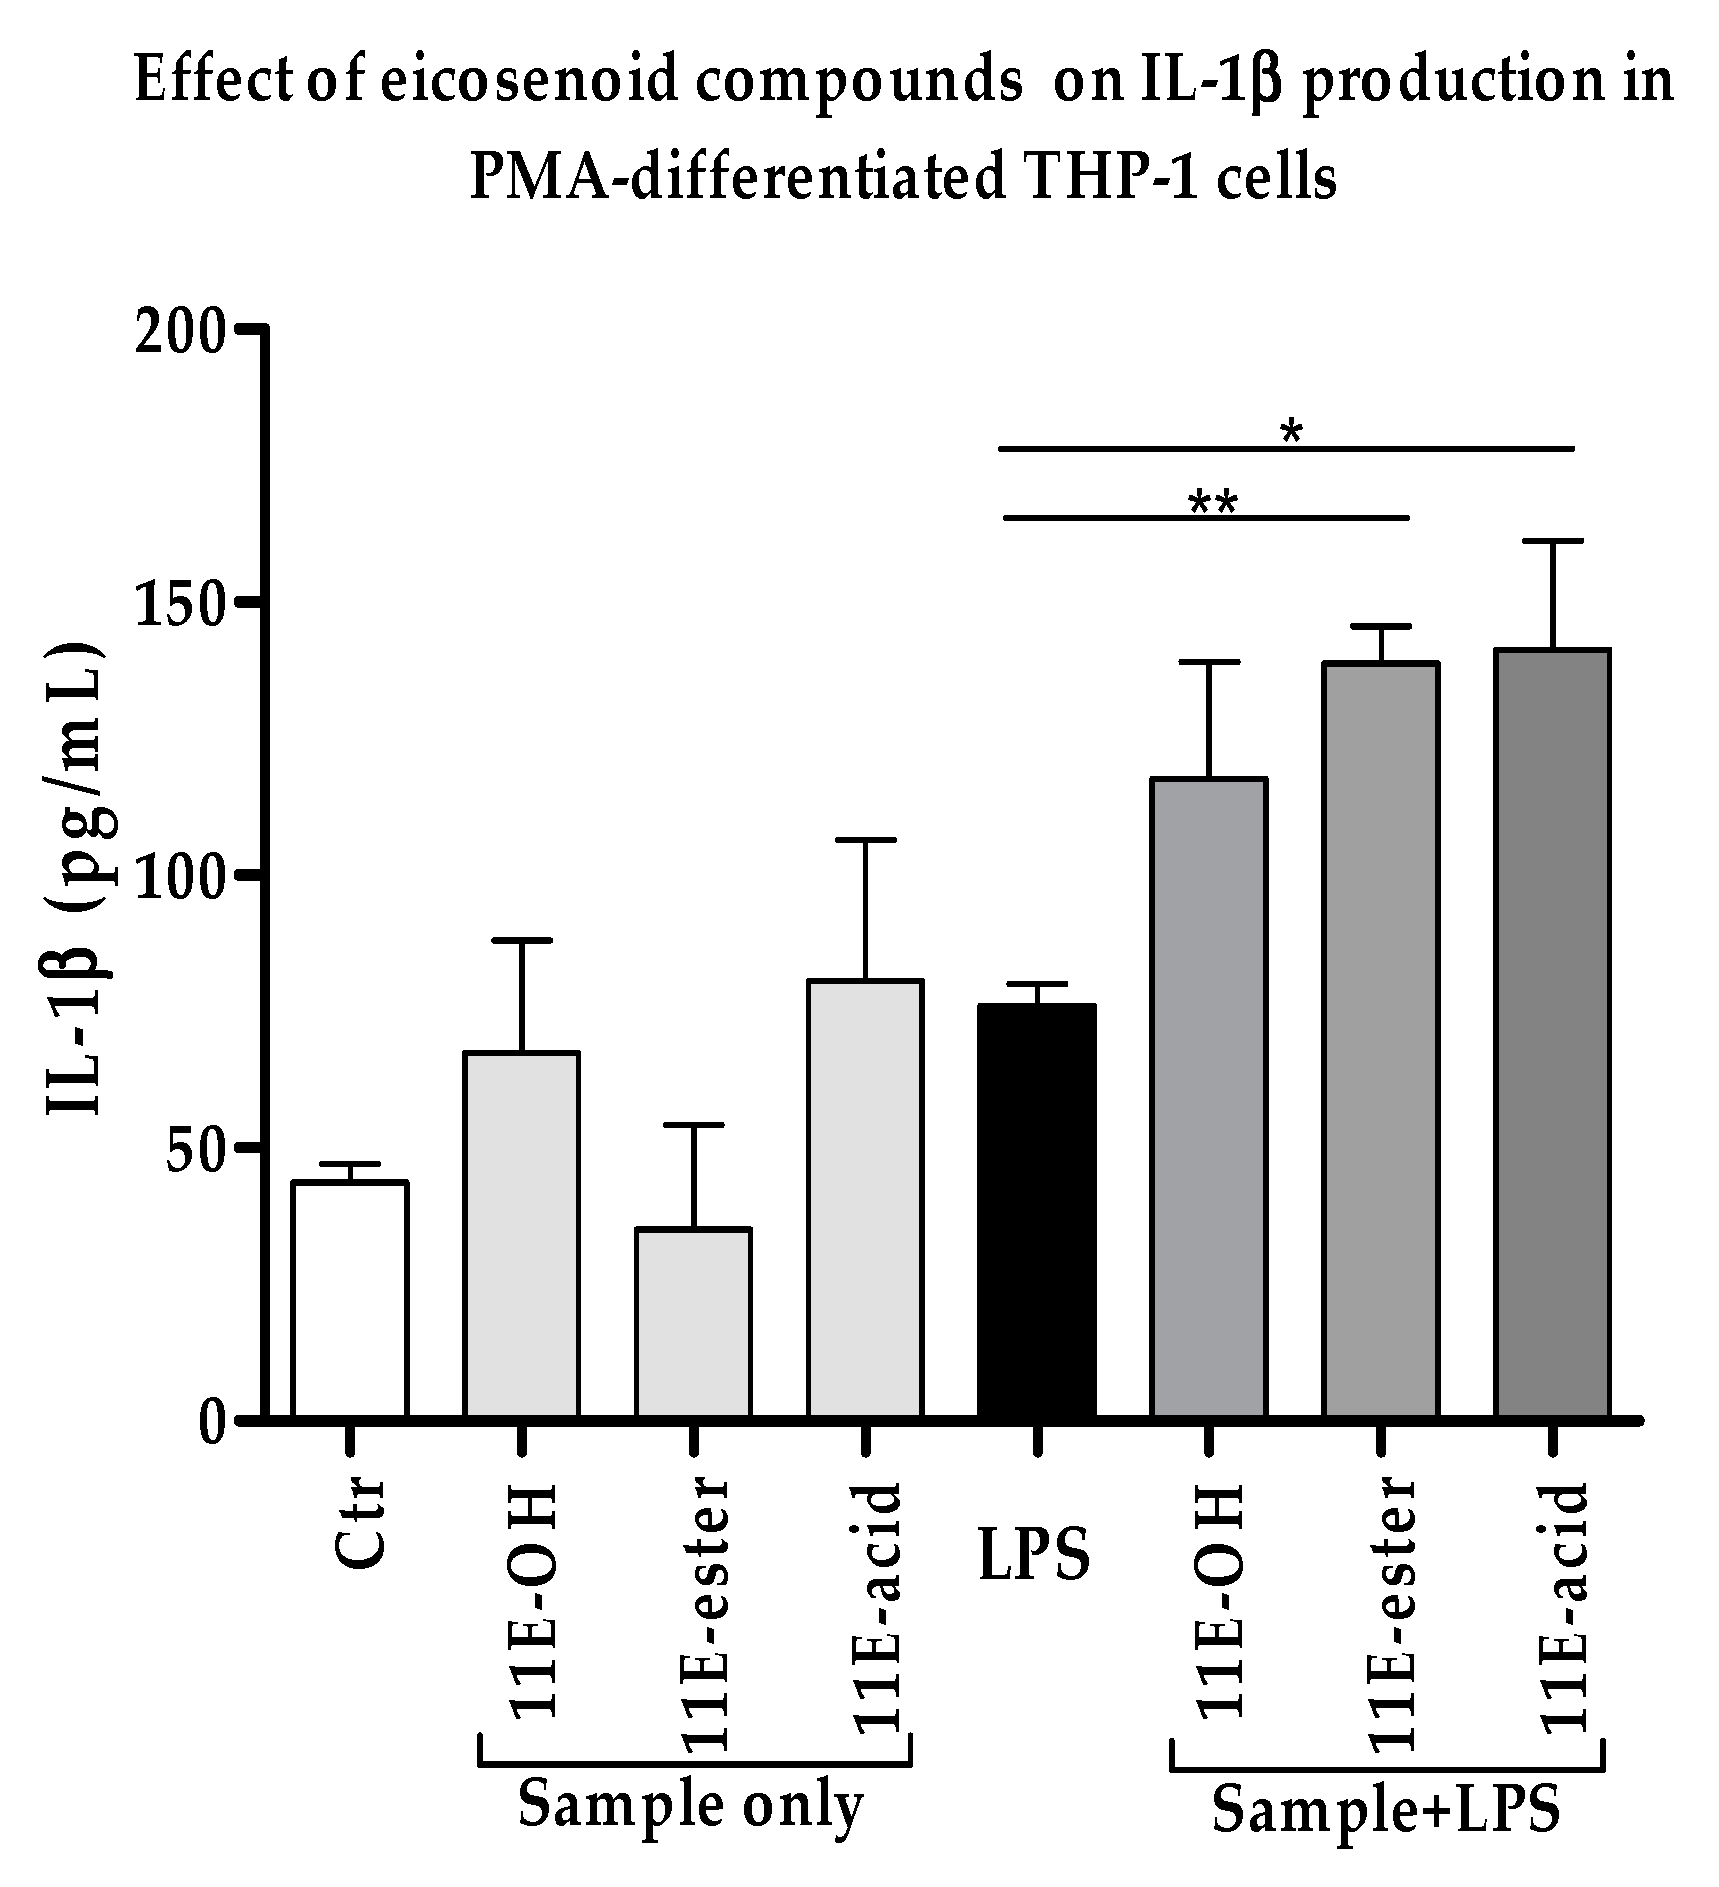
3.3. Effect of Eicosenoid Compounds on Pro-Inflammatory IL-1β Cytokine Production
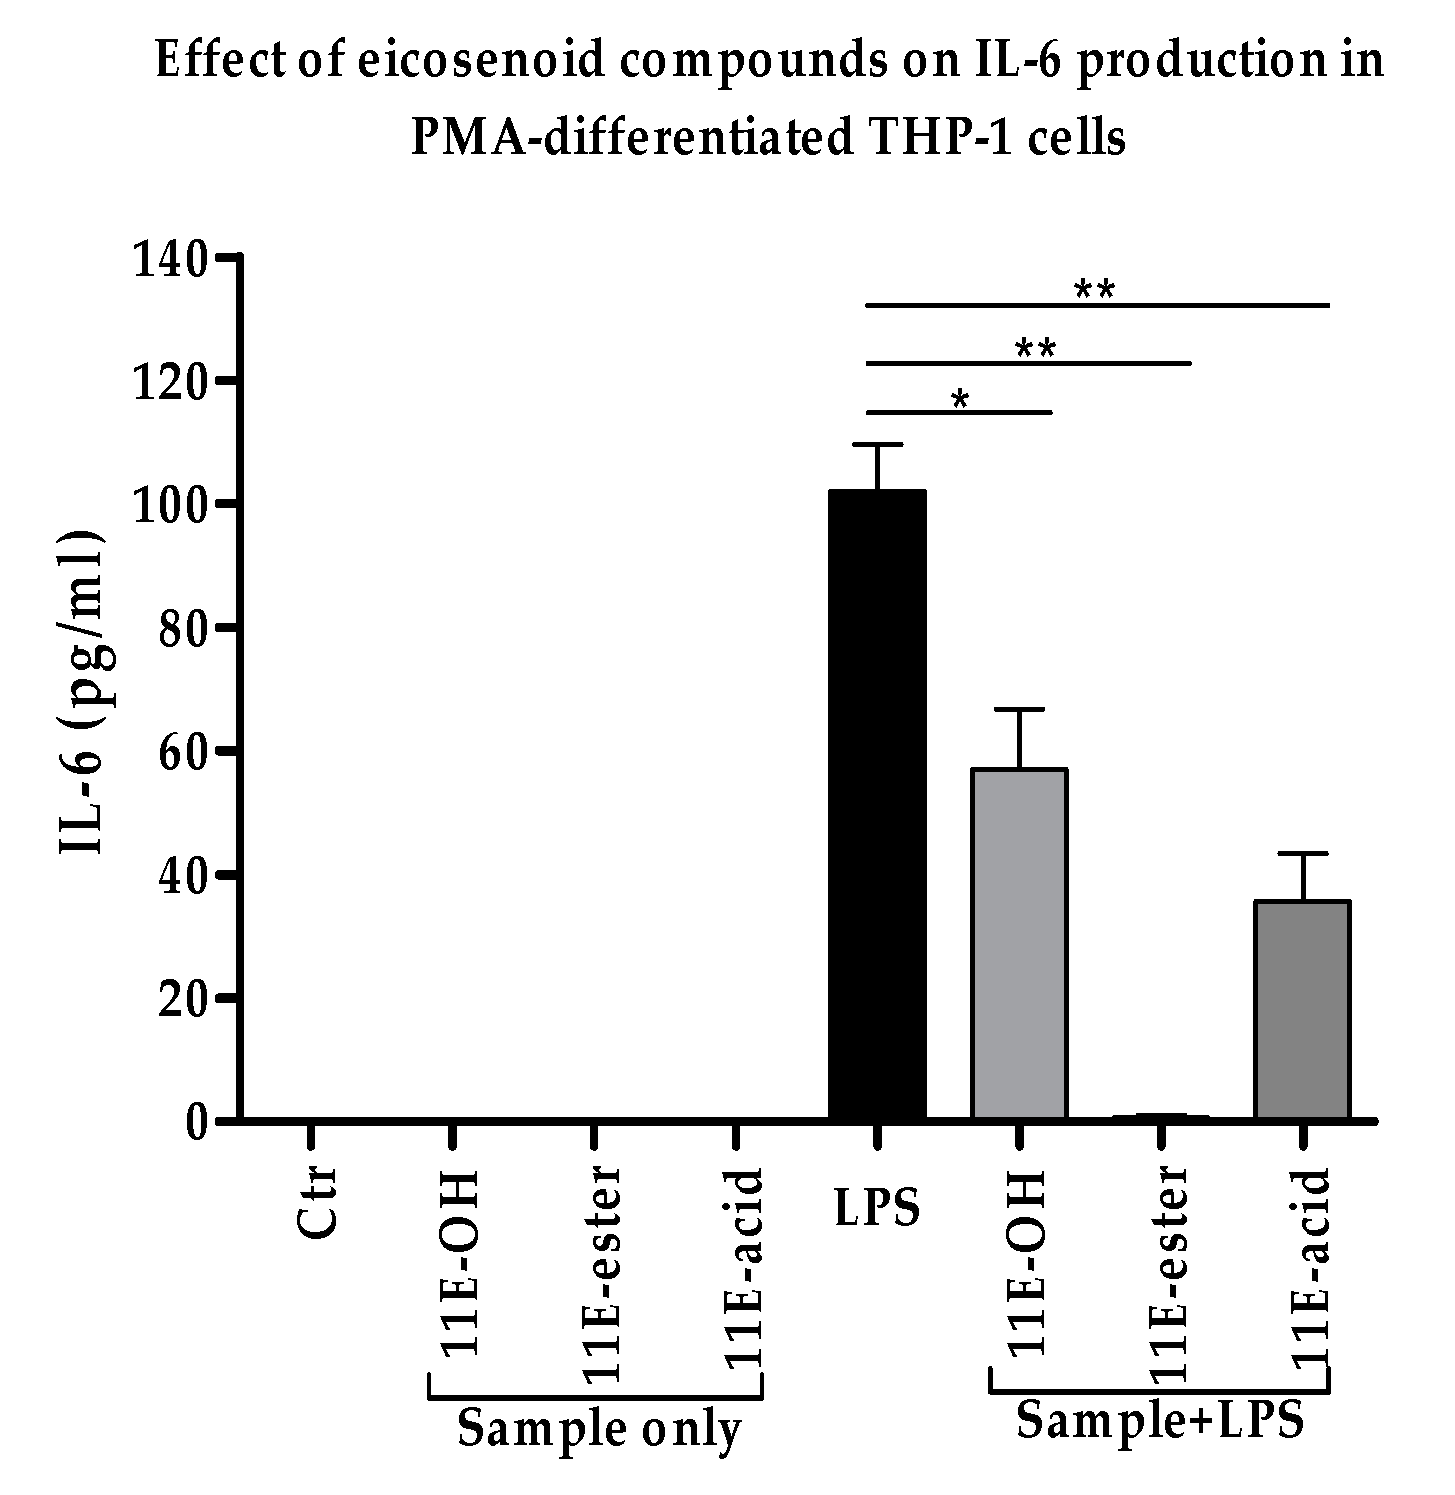
3.4. Effect of Eicosenoid Compounds on Pro-Inflammatory IL-6 Cytokine Production
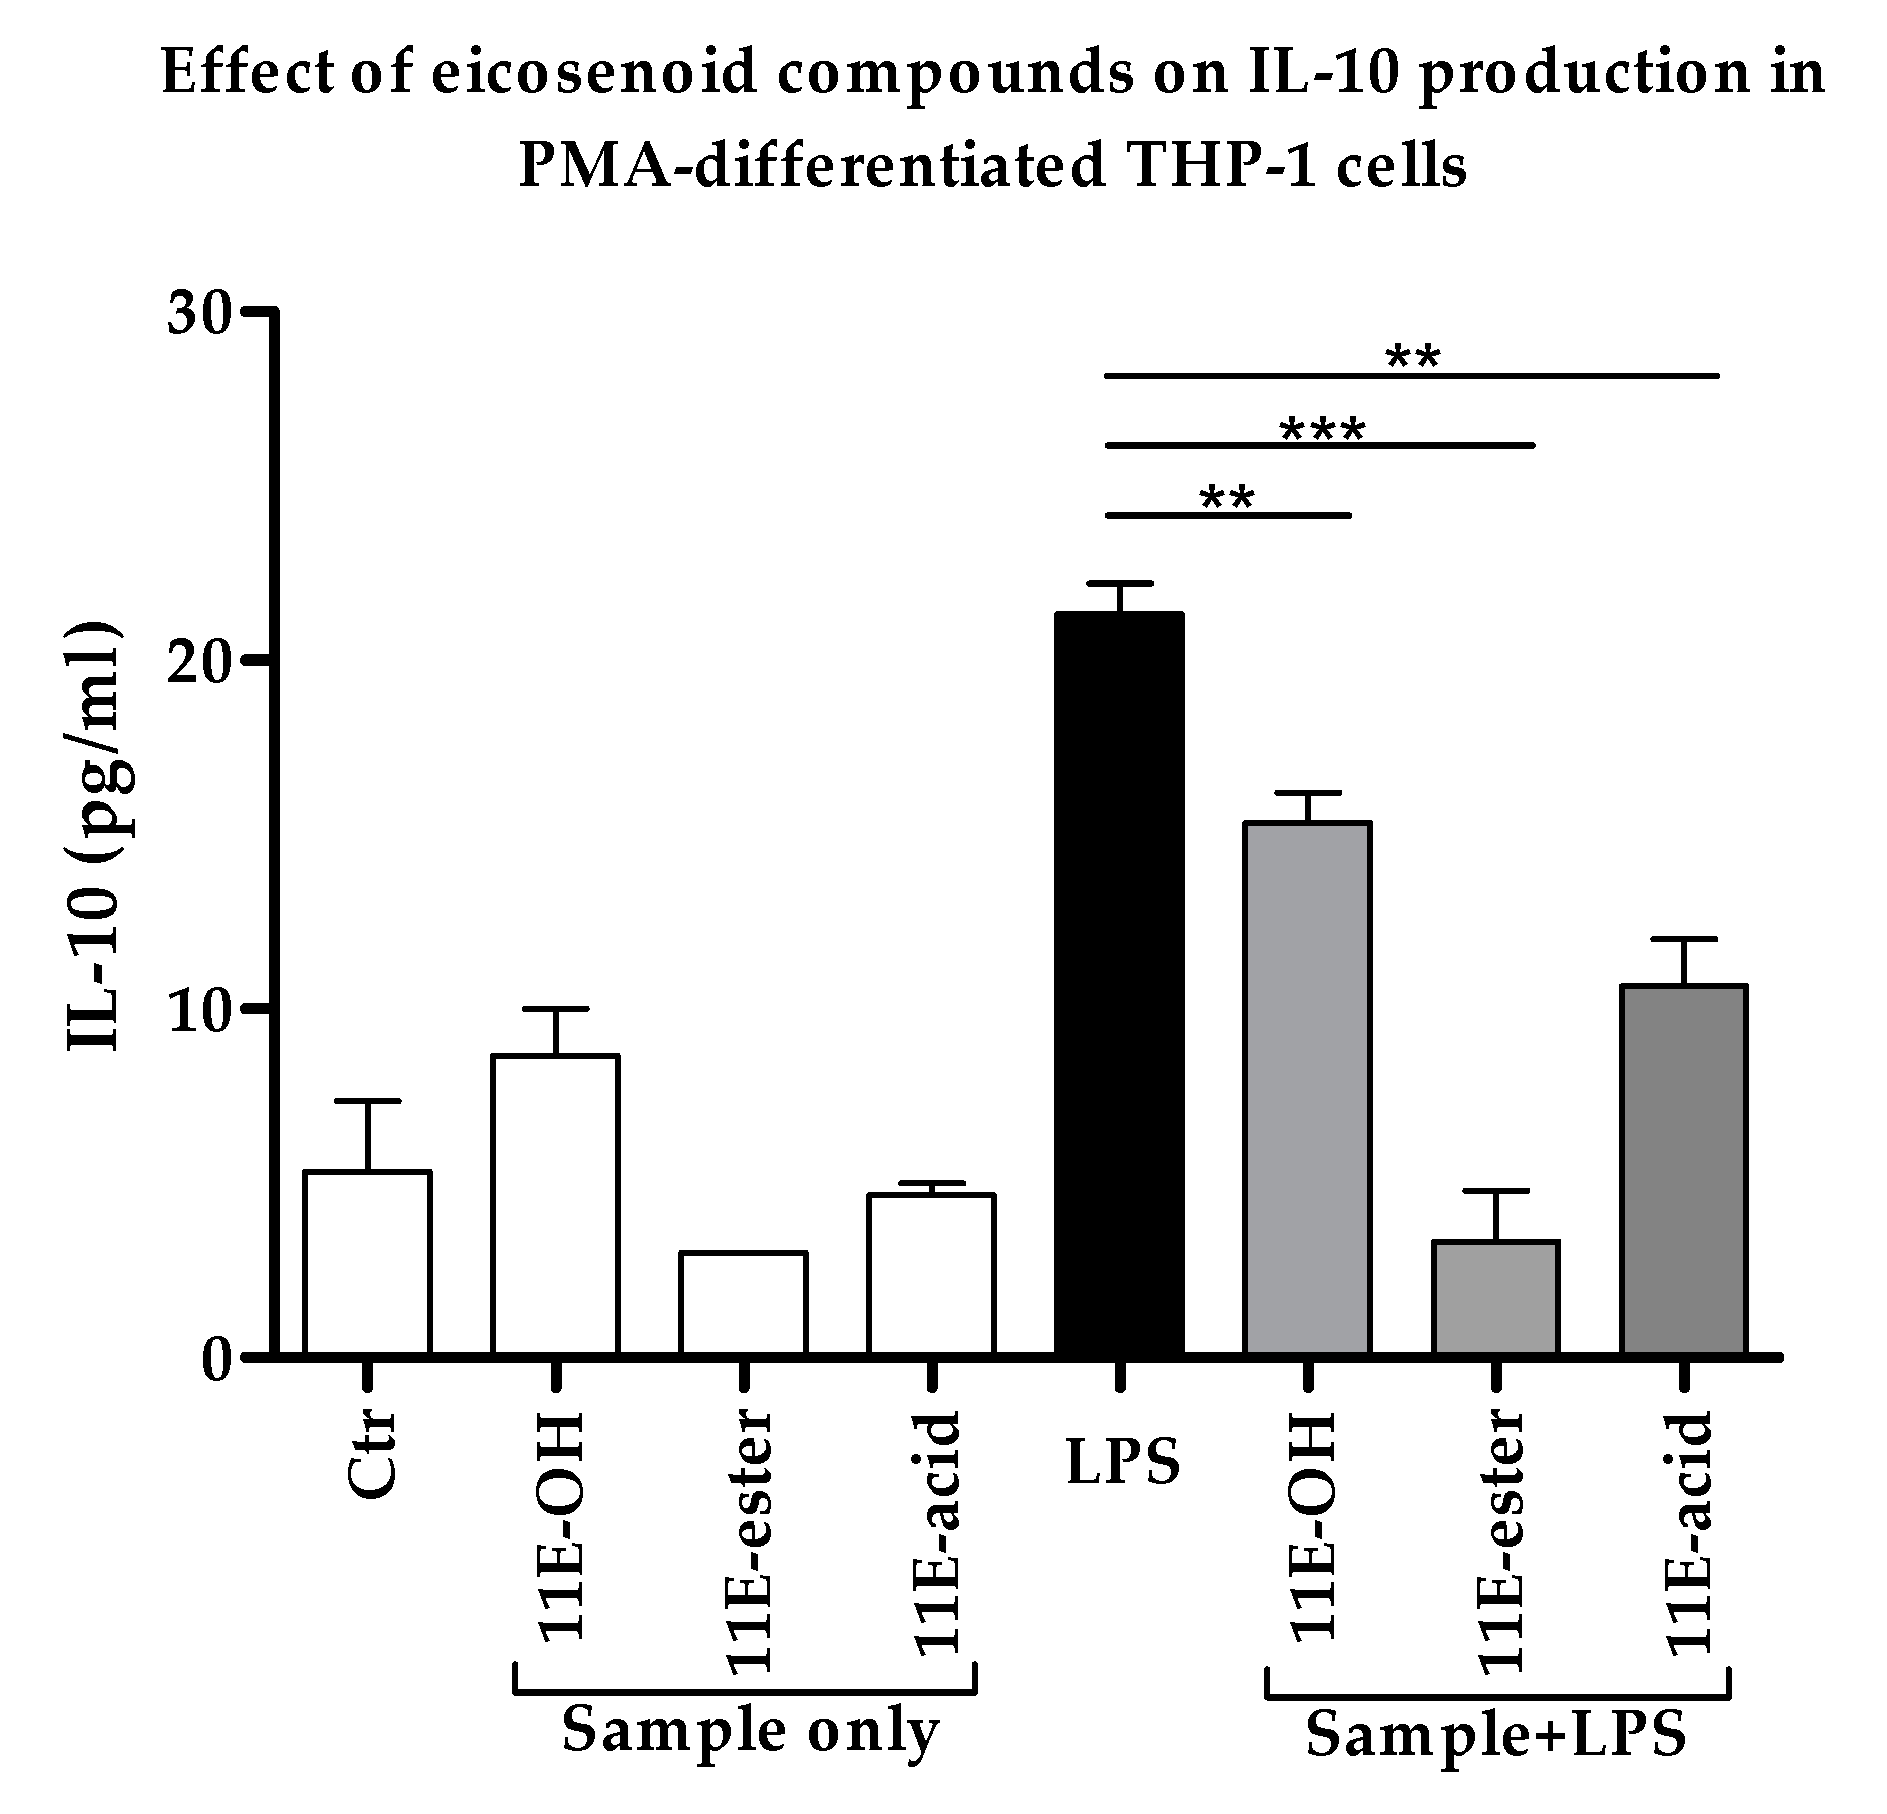
3.5. Effect of Eicosenoid Compounds on Anti-Inflammatory Il-10 Cytokine Production
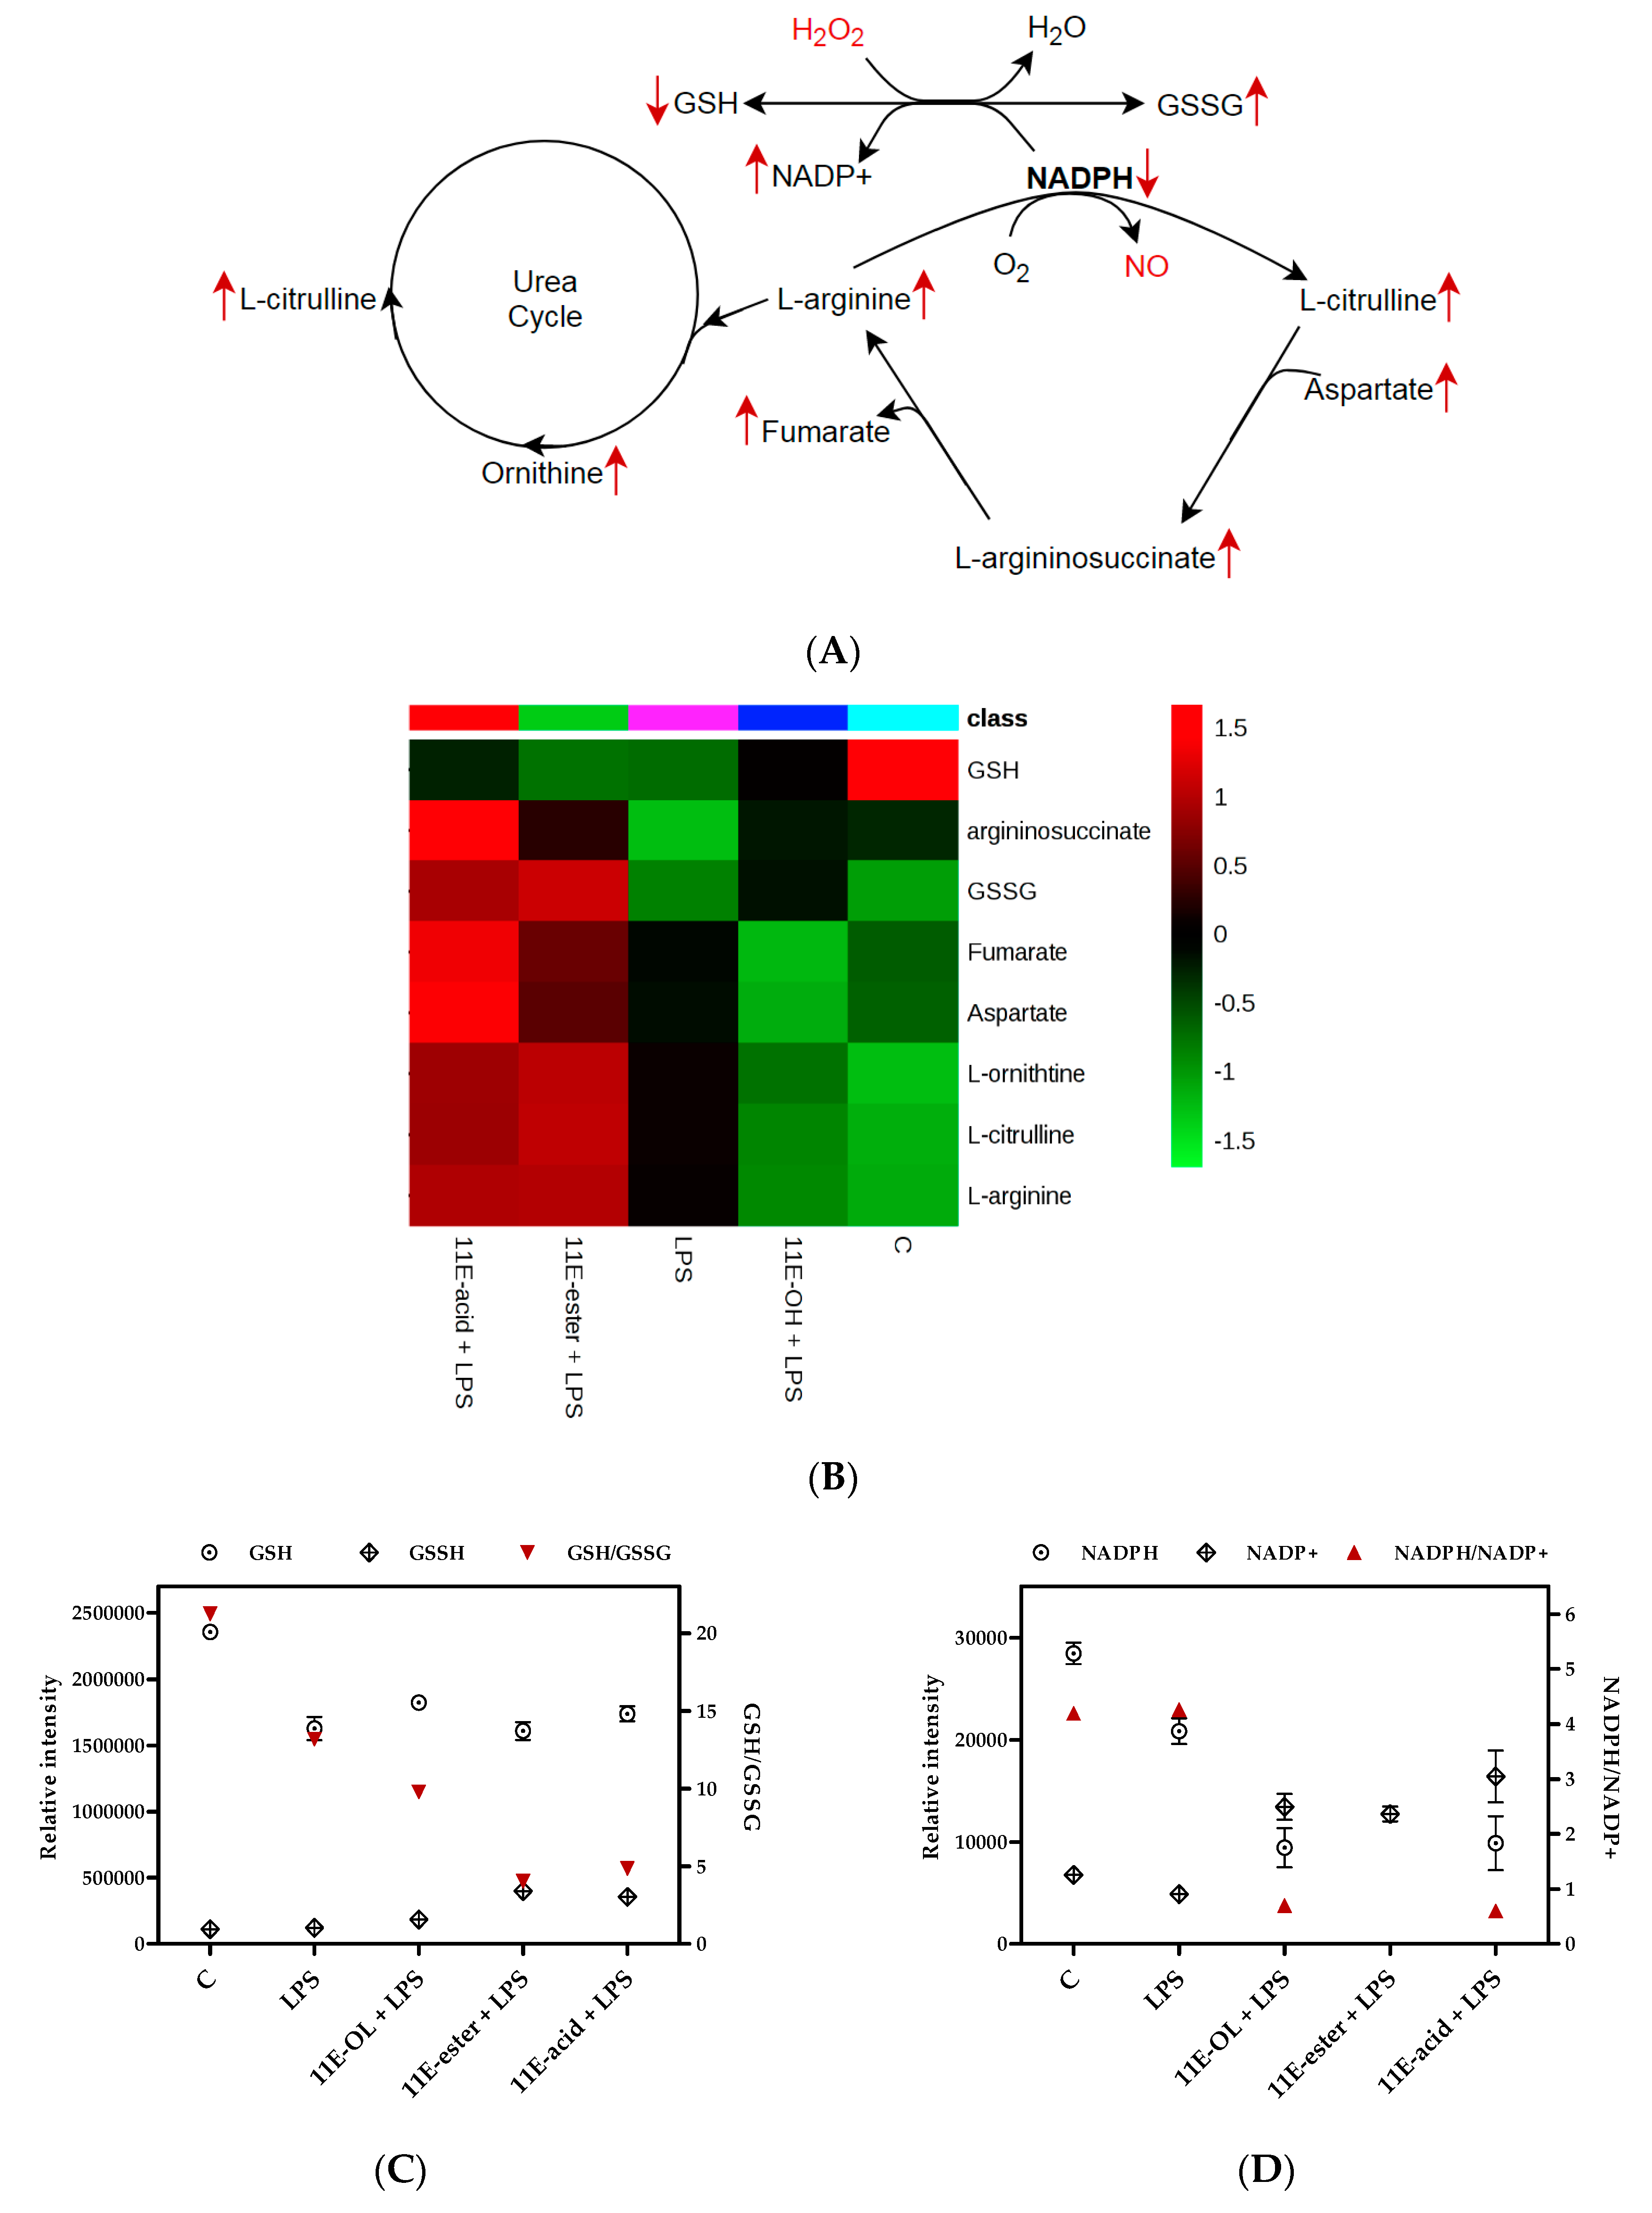
3.6. Effect of Eicosenoid Compounds on Polar THP-1 Cell Metabolites
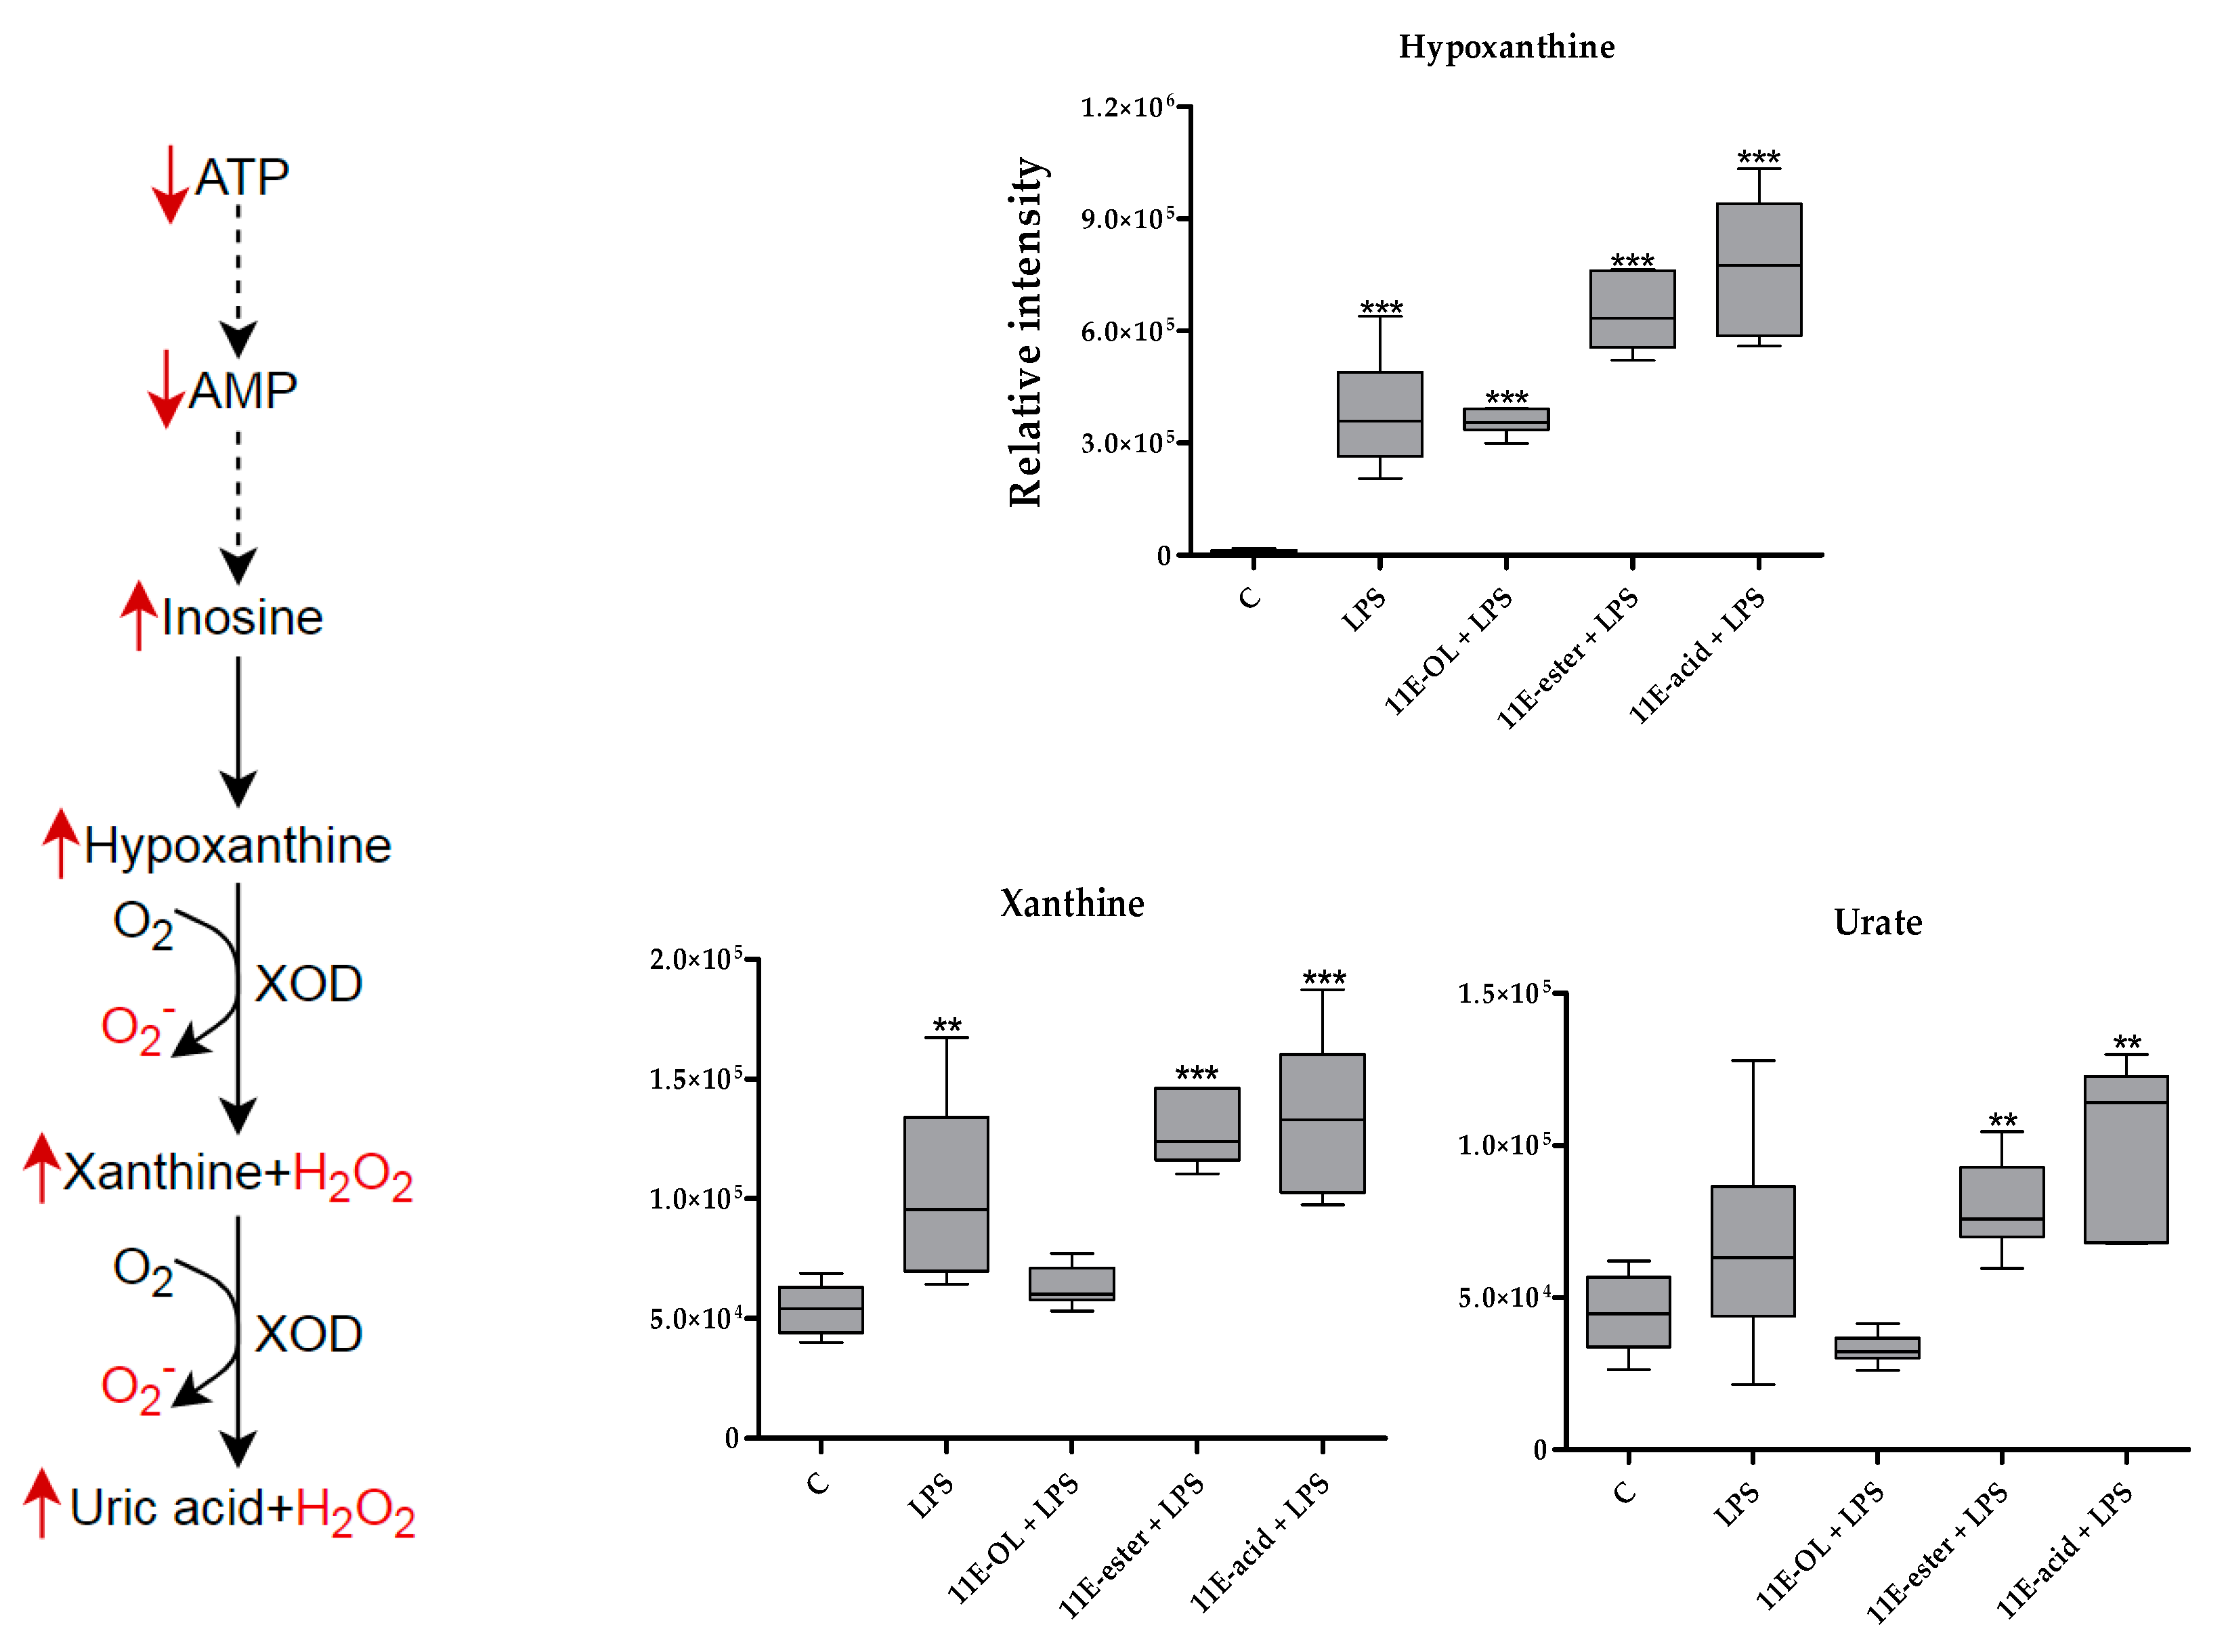
3.7. Effect of Eicosenoid Compounds on Lipophilic Metabolites
4. Discussion
5. Conclusions
Supplementary Materials
Author Contributions
Funding
Acknowledgments
Conflicts of Interest
References
- Reed, S.G.; Orr, M.T.; Fox, C.B. Key roles of adjuvants in modern vaccines. Nat. Med. 2013, 1919, 1597–1608. [Google Scholar] [CrossRef] [PubMed]
- McKee, A.S.; Marrack, P. Old and new adjuvants. Curr. Opin. Immunol. 2017, 47, 44–51. [Google Scholar] [CrossRef] [PubMed]
- Garçon, N.; Leroux-Roels, G.; Cheng, W.-F. Vaccine adjuvants. Perspect. Vaccinol. 2011, 11, 89–113. [Google Scholar] [CrossRef]
- Coffman, R.L.; Sher, A.; Seder, R.A. Vaccine adjuvants: Putting innate immunity to work. Immunity 2010, 33, 492–503. [Google Scholar] [CrossRef] [PubMed]
- McKee, A.S.; Munks, M.W.; Marrack, P. How do adjuvants work? Important considerations for new generation adjuvants. Immunity 2007, 27, 687–690. [Google Scholar] [CrossRef] [PubMed]
- McCartney, S.; Vermi, W.; Gilfillan, S.; Cella, M.; Murphy, T.L.; Schreiber, R.D.; Murphy, K.M.; Colonna, M. Distinct and complementary functions of MDA5 and TLR3 in poly (I:C)-mediated activation of mouse NK cells. J. Exp. Med. 2009, 206, 2967–2976. [Google Scholar] [CrossRef] [PubMed]
- Tritto, E.; Mosca, F.; de Gregorio, E. Mechanism of action of licensed vaccine adjuvants. Vaccine 2009, 27, 3331–3334. [Google Scholar] [CrossRef] [PubMed]
- De Gregorio, E.; D’Oro, U.; Wack, A. Immunology of TLR-independent vaccine adjuvants. Curr. Opin. Immunol. 2009, 21, 339–345. [Google Scholar] [CrossRef]
- Fraser, C.K.; Diener, K.R.; Brown, M.P.; Hayball, J.D. Improving vaccines by incorporating immunological coadjuvants. Expert Rev. Vaccines 2007, 6, 559–578. [Google Scholar] [CrossRef]
- Akira, S.; Uematsu, S.; Takeuchi, O. Pathogen recognition and innate immunity. Cell 2006, 124, 783–801. [Google Scholar] [CrossRef]
- Steinhagen, F.; Kinjo, T.; Bode, C.; Klinman, D.M. TLR-based immune adjuvants. Vaccine 2011, 29, 3341–3355. [Google Scholar] [CrossRef] [PubMed] [Green Version]
- GALANOS, C.; Lüderitz, O.; Rietschel, E.T.; Westphal, O.; Brade, H.; Brade, L.; Freudenberg, M.; Schade, U.; Imoto, M.; Yoshimura, H.; et al. Synthetic and natural Escherichia coli free lipid A express identical endotoxic activities. Eur. J. Biochem. 1985, 148, 1–5. [Google Scholar] [CrossRef]
- Guy, B. The perfect mix: Recent progress in adjuvant research. Nat. Rev. Microbiol. 2007, 5, 505–517. [Google Scholar] [CrossRef] [PubMed]
- El-Wahed, A.A.A.; Khalifa, S.A.; Sheikh, B.Y.; Farag, M.A.; Saeed, A.; Larik, F.A.; Koca-Caliskan, U.; AlAjmi, M.F.; Hassan, M.; Wahabi, H.A.; et al. Bee Venom Composition: From Chemistry to Biological Activity, in Studies in Natural Products Chemistry; Elsevier: Amsterdam, The Netherlands, 2018; pp. 459–484. [Google Scholar]
- Hider, R.C. Honeybee venom: A rich source of pharmacologically active peptides. Endeavour 1988, 12, 60–65. [Google Scholar] [CrossRef]
- Alonezi, S.; Tusiimire, J.; Wallace, J.; Dufton, M.J.; Parkinson, J.A.; Young, L.; Clements, C.J.; Park, J.K.; Jeon, J.W.; Ferro, V.; et al. Metabolomic profiling of the synergistic effects of melittin in combination with cisplatin on ovarian cancer cells. Metabolites 2017, 7, 14. [Google Scholar] [CrossRef]
- Alqarni, A.; Ferro, V.; Parkinson, J.; Dufton, M.; Watson, D. Effect of Melittin on Metabolomic Profile and Cytokine Production in PMA-Differentiated THP-1 Cells. Vaccines 2018, 6, 72. [Google Scholar] [CrossRef] [PubMed]
- Tusiimire, J.; Wallace, J.; Woods, N.; Dufton, M.J.; Parkinson, J.A.; Abbott, G.; Clements, C.J.; Young, L.; Park, J.K.; Jeon, J.W.; et al. Effect of Bee Venom and Its Fractions on the Release of Pro-Inflammatory Cytokines in PMA-Differentiated U937 Cells Co-Stimulated with LPS. Vaccines 2016, 4, 11. [Google Scholar] [CrossRef]
- Pickett, J.A.; Williams, I.H.; Martin, A.P. (Z)-11-eicosen-1-ol, an important new pheromonal component from the sting of the honey bee, Apis mellifera L. (Hymenoptera, Apidae). J. Chem. Ecol. 1982, 8, 163–175. [Google Scholar] [CrossRef]
- Free, J. The stimuli releasing the stinging response of honeybees. Anim. Behav. 1961, 9, 193–196. [Google Scholar] [CrossRef]
- Tannahill, G.; Curtis, A.M.; Adamik, J.; Palsson-Mcdermott, E.M.; McGettrick, A.F.; Goel, G.; Frezza, C.; Bernard, N.J.; Kelly, B.; Foley, N.H.; et al. Succinate is an inflammatory signal that induces IL-1β through HIF-1α. Nature 2013, 496, 238–242. [Google Scholar] [CrossRef]
- Lampropoulou, V.; Sergushichev, A.; Bambouskova, M.; Nair, S.; Vincent, E.E.; Loginicheva, E.; Cervantes-Barragan, L.; Ma, X.; Huang, S.C.C.; Griss, T.; et al. Itaconate links inhibition of succinate dehydrogenase with macrophage metabolic remodeling and regulation of inflammation. Cell Metab. 2016, 24, 158–166. [Google Scholar] [CrossRef] [PubMed]
- Rattigan, K.M.; Pountain, A.W.; Regnault, C.; Achcar, F.; Vincent, I.M.; Goodyear, C.S.; Barrett, M.P. Metabolomic profiling of macrophages determines the discrete metabolomic signature and metabolomic interactome triggered by polarising immune stimuli. PLoS ONE 2018, 13, e0194126. [Google Scholar] [CrossRef] [PubMed]
- O′Neill, L.A.; Kishton, R.J.; Rathmell, J. A guide to immunometabolism for immunologists. Nat. Rev. Immunol. 2016, 16, 553–565. [Google Scholar] [CrossRef] [PubMed] [Green Version]
- Zhang, R.; Watson, D.G.; Wang, L.; Westrop, G.D.; Coombs, G.H.; Zhang, T. Evaluation of mobile phase characteristics on three zwitterionic columns in hydrophilic interaction liquid chromatography mode for liquid chromatography-high resolution mass spectrometry based untargeted metabolite profiling of Leishmania parasites. J. Chromatogr. A 2014, 1362, 168–179. [Google Scholar] [CrossRef] [PubMed] [Green Version]
- Scheltema, R.A.; Jankevics, A.; Jansen, R.C.; Swertz, M.A.; Breitling, R. PeakML/mzMatch: A file format, Java library, R library, and tool-chain for mass spectrometry data analysis. Anal. Chem. 2011, 83, 2786–2793. [Google Scholar] [CrossRef] [PubMed]
- Sakagami, H.; Uesawa, Y.; Masuda, Y.; Tomomura, M.; Yokose, S.; Miyashiro, T.; Murai, J.; Takao, K.; Kanamoto, T.; Terakubo, S.; et al. Quantitative structure–cytotoxicity relationship of newly synthesized piperic acid esters. Anticancer Res. 2017, 37, 6161–6168. [Google Scholar] [PubMed]
- Murias, M.; Jäger, W.; Handler, N.; Erker, T.; Horvath, Z.; Szekeres, T.; Nohl, H.; Gille, L. Antioxidant, prooxidant and cytotoxic activity of hydroxylated resveratrol analogues: Structure–activity relationship. Biochem. Pharmacol. 2005, 69, 903–912. [Google Scholar] [CrossRef] [PubMed]
- Scheller, J.; Chalaris, A.; Schmidt-Arras, D.; Rose-John, S. The pro-and anti-inflammatory properties of the cytokine interleukin-6. Biochim. Biophys. Acta 2011, 1813, 878–888. [Google Scholar] [CrossRef] [PubMed]
- Balto, K.; Sasaki, H.; Stashenko, P. Interleukin-6 deficiency increases inflammatory bone destruction. Infect. Immun. 2001, 69, 744–750. [Google Scholar] [CrossRef]
- Grivennikov, S.; Karin, E.; Terzic, J.; Mucida, D.; Yu, G.Y.; Vallabhapurapu, S.; Scheller, J.; Rose-John, S.; Cheroutre, H.; Eckmann, L.; et al. IL-6 and Stat3 are required for survival of intestinal epithelial cells and development of colitis-associated cancer. Cancer Cell 2009, 15, 103–113. [Google Scholar] [CrossRef]
- Stumhofer, J.S.; Silver, J.S.; Laurence, A.; Porrett, P.M.; Harris, T.H.; Turka, L.A.; Ernst, M.; Saris, C.J.; O’Shea, J.J.; Hunter, C.A. Interleukins 27 and 6 induce STAT3-mediated T cell production of interleukin 10. Nat. Immunol. 2007, 8, 1363–1371. [Google Scholar] [CrossRef] [PubMed]
- Jin, J.-O.; Han, X.; Yu, Q. Interleukin-6 induces the generation of IL-10-producing Tr1 cells and suppresses autoimmune tissue inflammation. J. Autoimmun. 2013, 40, 28–44. [Google Scholar] [CrossRef] [PubMed] [Green Version]
- Mukhopadhyay, S.; Peiser, L.; Gordon, S. Activation of murine macrophages by Neisseria meningitidis and IFN-γ in vitro: Distinct roles of class A scavenger and Toll-like pattern recognition receptors in selective modulation of surface phenotype. J. Leukoc. Biol. 2004, 76, 577–584. [Google Scholar] [CrossRef] [PubMed]
- Li, H.; Poulos, T.L. Structure–function studies on nitric oxide synthases. J. Inorg. Biochem. 2005, 99, 293–305. [Google Scholar] [CrossRef] [PubMed]
- Satriano, J. Arginine pathways and the inflammatory response: Interregulation of nitric oxide and polyamines. Amino Acids 2004, 26, 321–329. [Google Scholar] [CrossRef]
- Alqarni, A.M.; Niwasabutra, K.; Sahlan, M.; Fearnley, H.; Fearnley, J.; Ferro, V.A.; Watson, D.G. Propolis Exerts an Anti-Inflammatory Effect on PMA-Differentiated THP-1 Cells via Inhibition of Purine Nucleoside Phosphorylase. Metabolites 2019, 9, 75. [Google Scholar] [CrossRef]
- Kelly, B.; Neill, L.A.J. Metabolic reprogramming in macrophages and dendritic cells in innate immunity. Cell Res. 2015, 25, 771–784. [Google Scholar] [CrossRef] [Green Version]
- Freemerman, A.J.; Johnson, A.R.; Sacks, G.N.; Milner, J.J.; Makowski, L.; Kirk, E.L.; Troester, M.A.; Macintyre, A.N.; Goraksha-Hicks, P.; Rathmell, J.C. Metabolic reprogramming of macrophages: Glucose transporter 1 (GLUT1)-mediated glucose metabolism drives a proinflammatory phenotype. J. Biol. Chem. 2014, 289, 7884–7896. [Google Scholar] [CrossRef]
- Haschemi, A.; Kosma, P.; Gille, L.; Evans, C.R.; Burant, C.F.; Starkl, P.; Knapp, B.; Haas, R.; Schmid, J.A.; Jandl, C.; et al. The Sedoheptulose Kinase CARKL Directs Macrophage Polarization through Control of Glucose Metabolism. Cell Metab. 2012, 15, 813–826. [Google Scholar] [CrossRef] [Green Version]
- Blagih, J.; Jones, R.G. Polarizing Macrophages through Reprogramming of Glucose Metabolism. Cell Metab. 2012, 15, 793–795. [Google Scholar] [CrossRef] [Green Version]
- Rodríguez-Prados, J.C.; Través, P.G.; Cuenca, J.; Rico, D.; Aragone, J.; Martín-Sanz, P.; Cascante, M.; Boscá, L. Substrate fate in activated macrophages: A comparison between innate, classic, and alternative activation. J. Immunol. 2010, 185, 605–614. [Google Scholar] [CrossRef] [PubMed]
- Infantino, V.; Iacobazzi, V.; Palmieri, F.; Menga, A. ATP-citrate lyase is essential for macrophage inflammatory response. Biochem. Biophys. Res. Commun. 2013, 440, 105–111. [Google Scholar] [CrossRef] [PubMed]
- Weinberg, S.E.; Sena, L.A.; Chandel, N.S. Mitochondria in the regulation of innate and adaptive immunity. Immunity 2015, 42, 406–417. [Google Scholar] [CrossRef] [PubMed]
- Strelko, C.L.; Lu, W.; Dufort, F.J.; Seyfried, T.N.; Chiles, T.C.; Rabinowitz, J.D.; Roberts, M.F. Itaconic acid is a mammalian metabolite induced during macrophage activation. J. Am. Chem. Soc. 2011, 133, 16386–16389. [Google Scholar] [CrossRef] [PubMed]
- Mills, E.L.; Ryan, D.G.; Prag, H.A.; Dikovskaya, D.; Menon, D.; Zaslona, Z.; Jedrychowski, M.P.; Costa, A.S.; Higgins, M.; Hams, E.; et al. Itaconate is an anti-inflammatory metabolite that activates Nrf2 via alkylation of KEAP1. Nature 2018, 556, 113–117. [Google Scholar] [CrossRef] [PubMed]
- Michelucci, A.; Cordes, T.; Ghelfi, J.; Pailot, A.; Reiling, N.; Goldmann, O.; Binz, T.; Wegner, A.; Tallam, A.; Rausell, A.; et al. Immune-responsive gene 1 protein links metabolism to immunity by catalyzing itaconic acid production. Proc. Natl. Acad. Sci. USA 2013, 110, 7820–7825. [Google Scholar] [CrossRef] [Green Version]
- Sies, H. Oxidative stress: Oxidants and antioxidants. Exp. Physiol. 1997, 82, 291–295. [Google Scholar] [CrossRef]
- Rahman, I.; MacNee, W. Oxidative stress and regulation of glutathione in lung inflammation. Eur. Respir. J. 2000, 16, 534–554. [Google Scholar] [CrossRef]
- Ghezzi, P. Role of glutathione in immunity and inflammation in the lung. Int. J. Gen. Med. 2011, 4, 105–113. [Google Scholar] [CrossRef] [Green Version]
- Fan, J.; Kamphorst, J.J.; Shlomi, T.; Thompson, C.B.; Rabinowitz, J.D. Quantitative flux analysis reveals folate-dependent NADPH production. Nature 2014, 510, 298–302. [Google Scholar] [CrossRef] [Green Version]
- Moreno-Sánchez, R.; Marín-Hernández, Á.; Gallardo-Pérez, J.C.; Vázquez, C.; Rodríguez-Enríquez, S.; Saavedra, E. Control of the NADPH supply and GSH recycling for oxidative stress management in hepatoma and liver mitochondria. Biochim. Biophys. Acta Bioenerg. 2018, 1859, 1138–1150. [Google Scholar] [CrossRef] [PubMed]
- Kalkan, I.H.; Suher, M. The relationship between the level of glutathione, impairment of glucose metabolism and complications of diabetes mellitus. Pak. J. Med. Sci. 2013, 29, 938–942. [Google Scholar] [CrossRef]
- Margonis, K.; Fatouros, I.G.; Jamurtas, A.Z.; Nikolaidis, M.G.; Douroudos, I.; Chatzinikolaou, A.; Mitrakou, A.; Mastorakos, G.; Papassotiriou, I.; Taxildaris, K.; et al. Oxidative stress biomarkers responses to physical overtraining: Implications for diagnosis. Free Radic. Biol. Med. 2007, 43, 901–910. [Google Scholar] [CrossRef] [PubMed]
- El Kasmi, K.C.; Stenmark, K.R. Contribution of metabolic reprogramming to macrophage plasticity and function. Semin. Immunol. 2015, 27, 267–275. [Google Scholar] [CrossRef] [PubMed] [Green Version]
- Neill, L.A.J. A critical role for citrate metabolism in LPS signalling. Biochem. J. 2011, 438, e5–e6. [Google Scholar] [CrossRef] [PubMed] [Green Version]
- Alorainy, M. Effect of allopurinol and vitamin E on rat model of rheumatoid arthritis. Int. J. Health Sci. 2008, 2, 59–67. [Google Scholar]
- Arpaia, E.; Benveniste, P.; Di Cristofano, A.; Gu, Y.; Dalal, I.; Kelly, S.; Hershfield, M.; Pandolfi, P.P.; Roifman, C.M.; Cohen, A. Mitochondrial Basis for Immune Deficiency: Evidence from Purine Nucleoside Phosphorylase–deficient Mice. J. Exp. Med. 2000, 191, 2197–2208. [Google Scholar] [CrossRef] [PubMed]
- Newsholme, P.; Gordon, S.; Newsholme, E.A. Rates of utilization and fates of glucose, glutamine, pyruvate, fatty acids and ketone bodies by mouse macrophages. Biochem. J. 1987, 242, 631–636. [Google Scholar] [CrossRef] [Green Version]
- Malandrino, M.I.; Fucho, R.; Weber, M.; Calderon-Dominguez, M.; Mir, J.F.; Valcarcel, L.; Escoté, X.; Gómez-Serrano, M.; Peral, B.; Salvadó, L.; et al. Enhanced fatty acid oxidation in adipocytes and macrophages reduces lipid-induced triglyceride accumulation and inflammation. Am. J. Physiol. Endocrinol. Metab. 2015, 308, E756–E769. [Google Scholar] [CrossRef] [Green Version]
- Namgaladze, D.; Lips, S.; Leiker, T.J.; Murphy, R.C.; Ekroos, K.; Ferreiros, N.; Geisslinger, G.; Brüne, B. Inhibition of macrophage fatty acid β-oxidation exacerbates palmitate-induced inflammatory and endoplasmic reticulum stress responses. Diabetologia 2014, 57, 1067–1077. [Google Scholar] [CrossRef]
- Feingold, K.R.; Wang, Y.; Moser, A.; Shigenaga, J.K.; Grunfeld, C. LPS decreases fatty acid oxidation and nuclear hormone receptors in the kidney. J. Llipid Res. 2008, 49, 2179–2187. [Google Scholar] [CrossRef] [PubMed] [Green Version]
- Wanders, R.J.; Waterham, H.R. Biochemistry of mammalian peroxisomes revisited. Annu. Rev. Biochem. 2006, 75, 295–332. [Google Scholar] [CrossRef] [PubMed]
- Li, P.; Spann, N.J.; Kaikkonen, M.U.; Lu, M.; Fox, J.N.; Bandyopadhyay, G.; Talukdar, S.; Xu, J.; Lagakos, W.S.; Patsouris, D.; et al. NCoR Repression of LXRs Restricts Macrophage Biosynthesis of Insulin-Sensitizing Omega 3 Fatty Acids. Cell 2013, 155, 200–214. [Google Scholar] [CrossRef] [PubMed] [Green Version]
- Dennis, E.A.; Norris, P.C. Eicosanoid storm in infection and inflammation. Nat. Rev. Immunol. 2015, 15, 511–523. [Google Scholar] [CrossRef] [PubMed] [Green Version]
- Lewis, J.G.; Adams, D.O. Enhanced Release of Hydrogen Peroxide and Metabolites of Arachidonic Acid by Macrophages from SENCAR Mice following Stimulation with Phorbol Esters. Cancer Res. 1986, 46, 5696–5700. [Google Scholar] [PubMed]
- Dröge, W.; Schulze-Osthoff, K.L.A.U.S.; Mihm, S.; Galter, D.; Schenk, H.E.; Eck, H.P.; Roth, S.; Gmünder, H. Functions of glutathione and glutathione disulfide in immunology and immunopathology. FASEB J. 1994, 8, 1131–1138. [Google Scholar] [CrossRef] [PubMed]


| Synthetic Compounds | IC50 (µg/mL) | Selected Final Concentration (µg/mL) | |
|---|---|---|---|
| Group ID | Chemical Name | ||
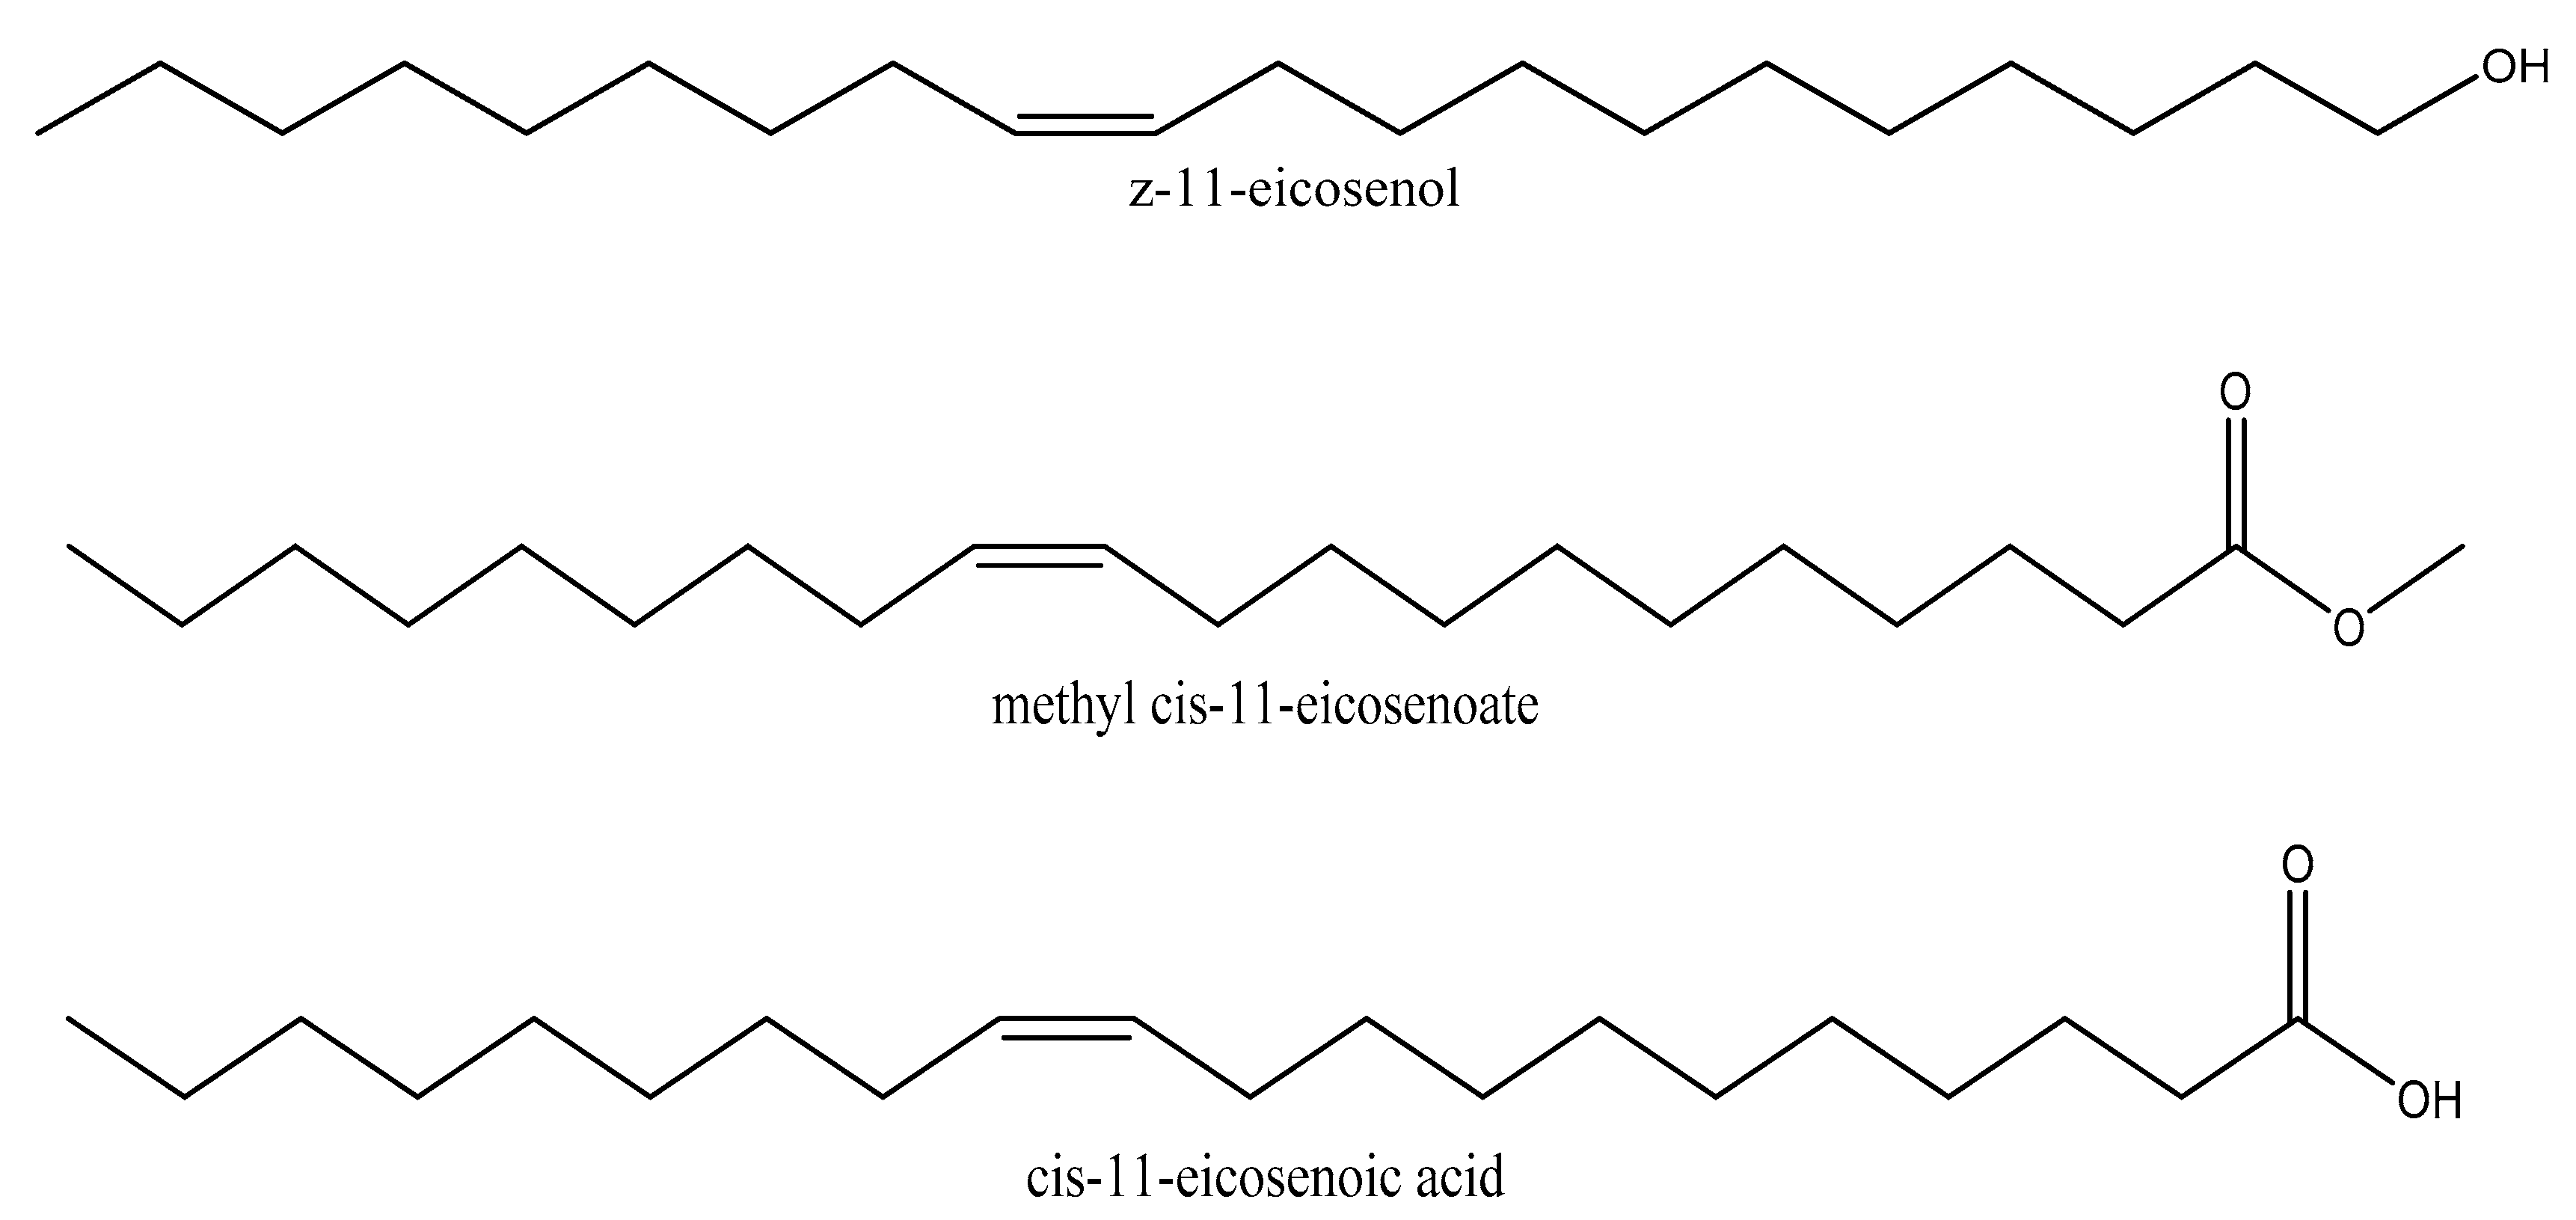
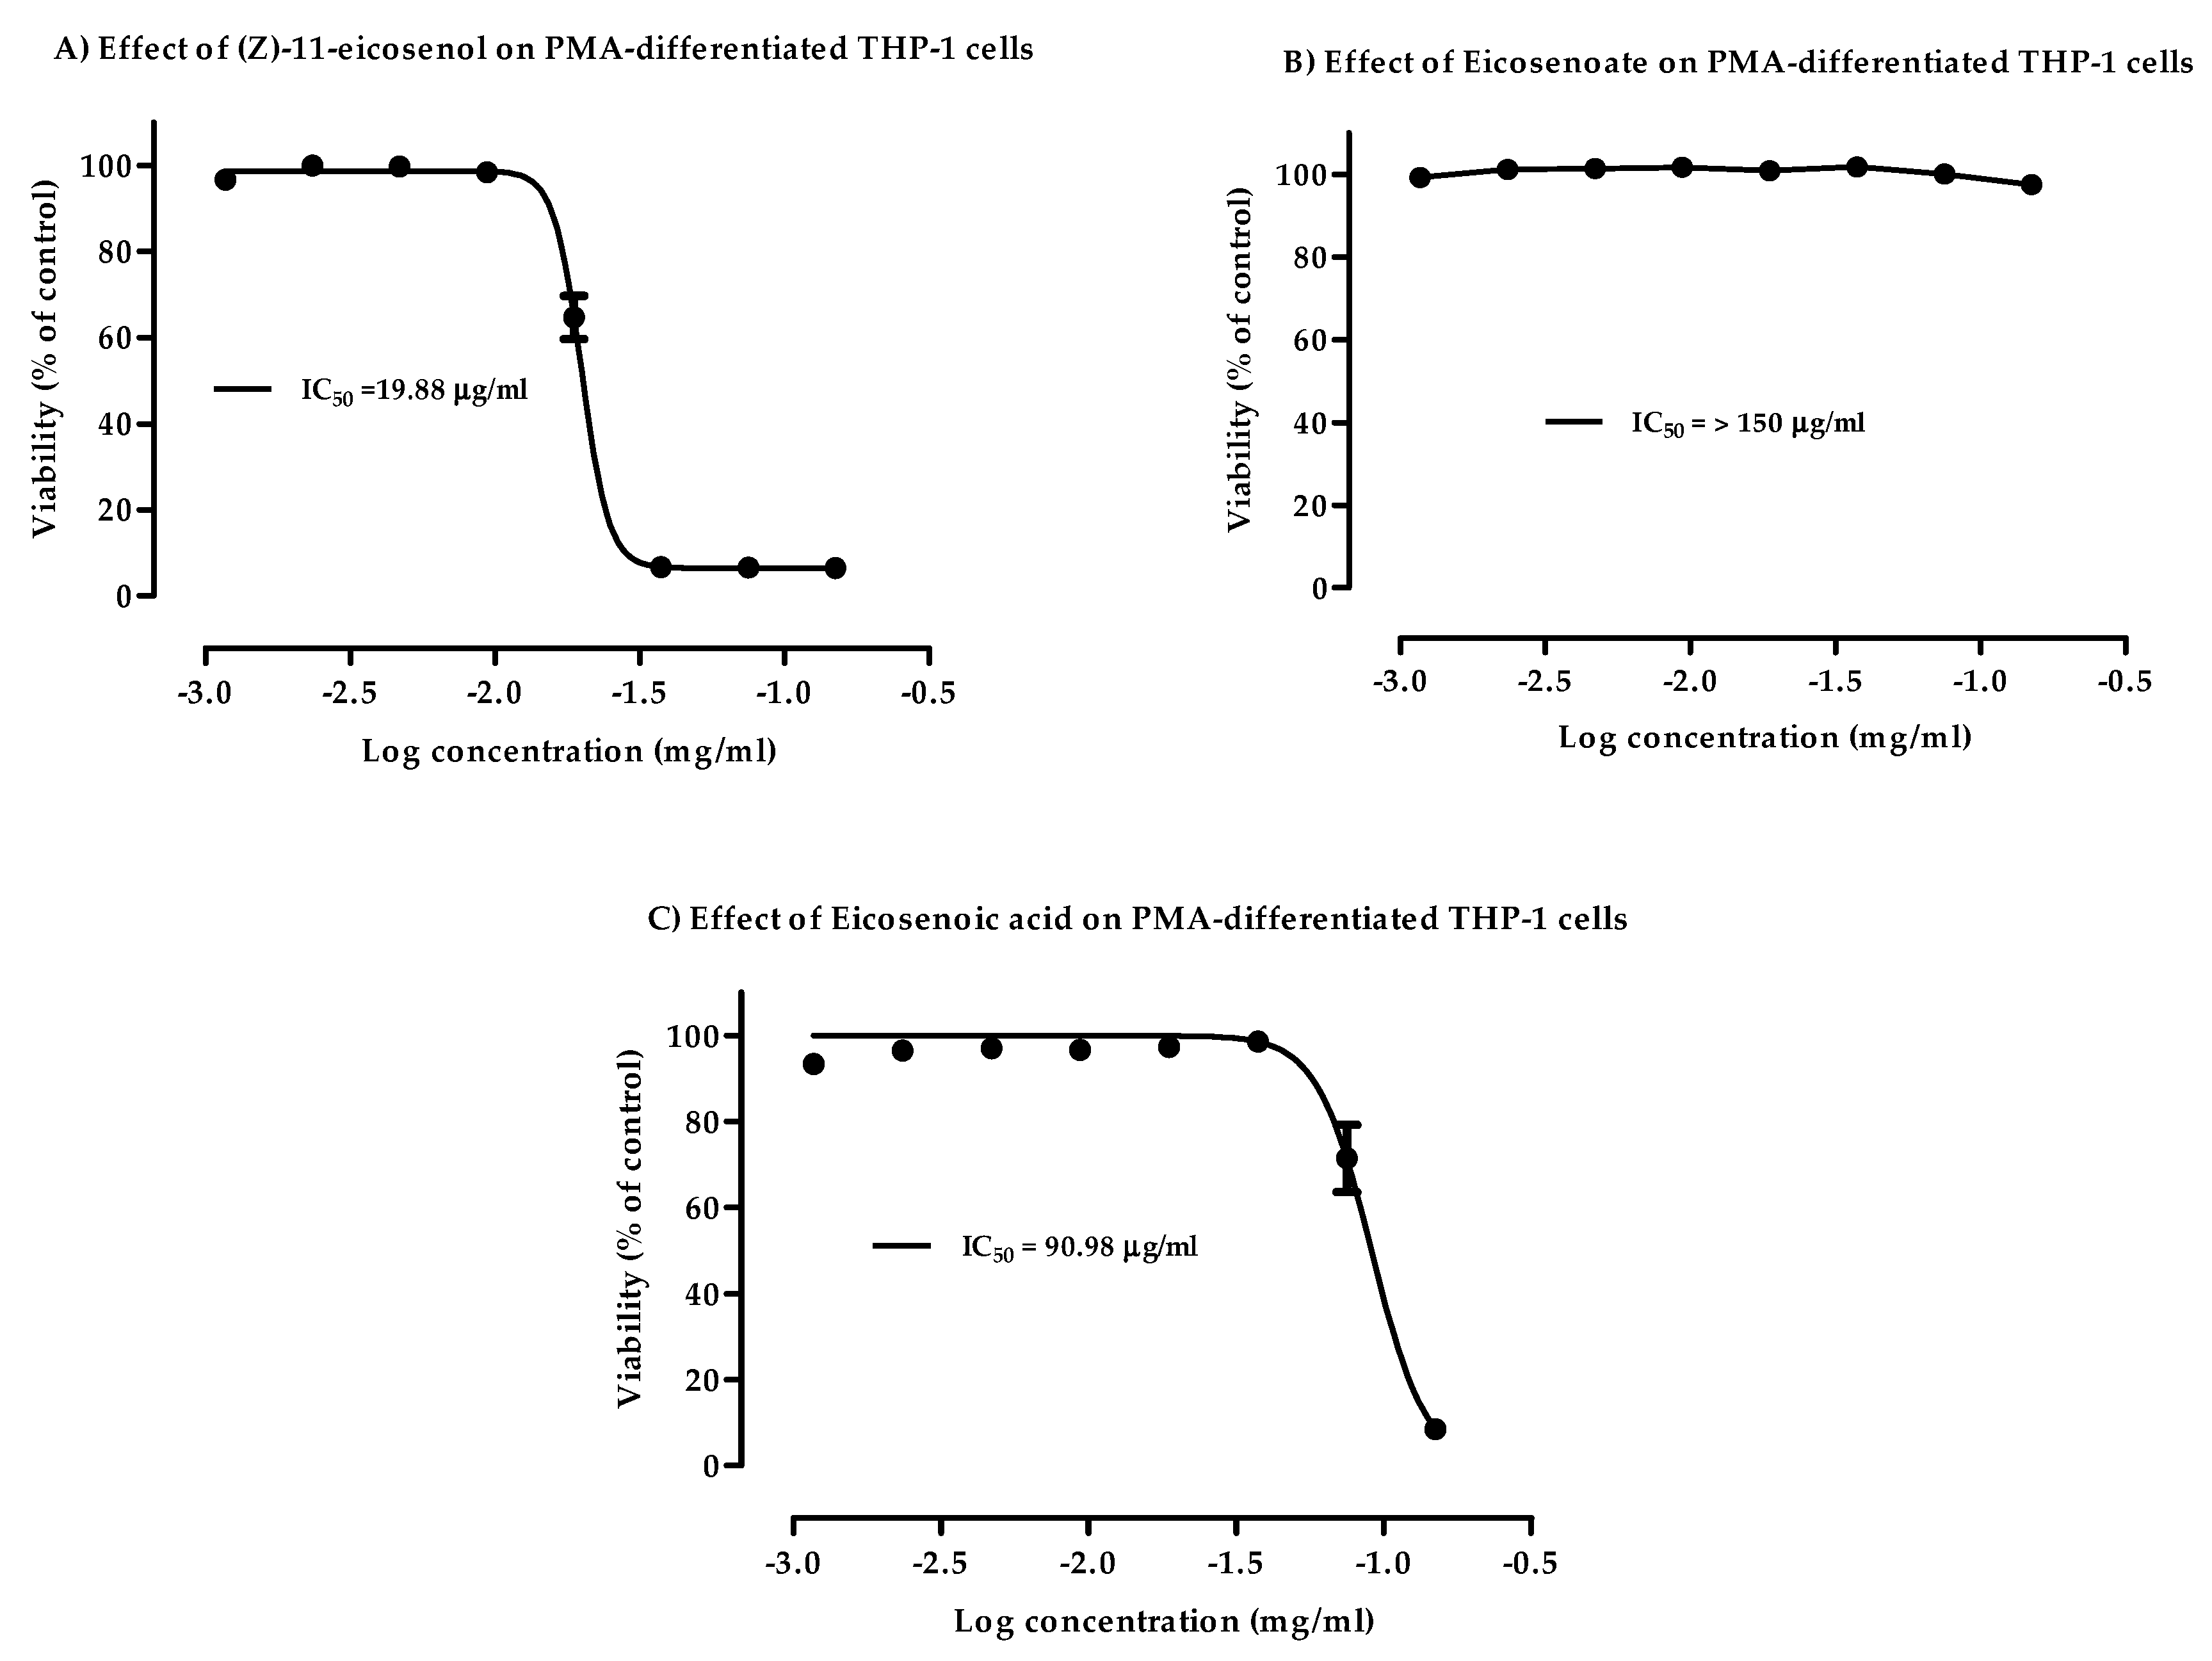
| 11E-OH | (Z)-11-eicosenol | 19.88 | 9.0 |
| 11E-ester | methyl cis-11-eicosenoate | >150 | 150 |
| 11E-acid | cis-11-eicosenoic acid | 90.98 | 40.0 |
| Mass | Rt | Putative Metabolite | LPS/C | 11E-OH + LPS/C | 11E-Ester + LPS/C | 11E-Acid + LPS/C | ||||
|---|---|---|---|---|---|---|---|---|---|---|
| Ratio | p Value | Ratio | p Value | Ratio | p Value | Ratio | p Value | |||
| Arginine and Proline Metabolism | ||||||||||
| 129.090 | 15.79 | 4-Guanidinobutanal | 1.523 | 0.030 | 1.580 | 0.008 | 0.880 | ns | 1.539 | 0.010 |
| 111.032 | 20.00 | Pyrrole-2-carboxylate | 1.200 | 0.012 | 1.384 | <0.001 | 1.068 | ns | 1.260 | 0.003 |
| 189.064 | 14.09 | N-Acetyl-l-glutamate * | 0.547 | 0.007 | 0.599 | 0.001 | 1.139 | ns | 0.757 | 0.031 |
| 132.054 | 14.39 | N-Carbamoylsarcosine | 1.100 | ns | 1.051 | ns | 1.395 | 0.003 | 1.367 | 0.011 |
| 240.122 | 16.51 | Homocarnosine | 1.382 | 0.049 | 0.900 | ns | 1.593 | <0.001 | 1.866 | <0.001 |
| 211.036 | 15.28 | Phosphocreatine * | 0.944 | ns | 0.970 | ns | 1.723 | 0.001 | 1.285 | 0.024 |
| 113.059 | 9.94 | Creatinine | 1.625 | ns | 0.939 | ns | 2.104 | <0.001 | 2.199 | <0.001 |
| 130.122 | 26.73 | Agmatine | 1.509 | 0.021 | 1.041 | ns | 2.149 | <0.001 | 1.884 | <0.001 |
| 129.043 | 10.08 | Oxoproline * | 1.732 | 0.013 | 0.850 | ns | 2.331 | <0.001 | 2.525 | <0.001 |
| 175.096 | 16.21 | L-Citrulline * | 1.554 | 0.011 | 0.923 | ns | 2.379 | <0.001 | 2.180 | <0.001 |
| 246.133 | 18.71 | N2-(d-1-Carboxyethyl)-l-arginine | 2.225 | 0.008 | 1.233 | ns | 3.317 | <0.001 | 3.245 | <0.001 |
| 290.122 | 16.97 | N-(l-Arginino)succinate | 0.794 | ns | 1.022 | ns | 1.153 | ns | 1.596 | 0.015 |
| 115.063 | 13.07 | l-Proline * | 1.102 | ns | 0.897 | ns | 0.995 | ns | 1.208 | 0.036 |
| 174.112 | 26.73 | l-Arginine * | 1.593 | 0.022 | 1.089 | ns | 2.172 | <0.001 | 2.160 | <0.001 |
| 132.090 | 26.73 | l-Ornithine * | 1.834 | 0.003 | 1.223 | ns | 2.665 | <0.001 | 2.501 | <0.001 |
| Glycolysis/TCA cycle | ||||||||||
| 260.030 | 16.93 | d-Glucose 1-phosphate * | 1.231 | ns | 1.450 | <0.001 | 0.833 | ns | 1.508 | 0.001 |
| 180.063 | 15.08 | d-Glucose * | 3.076 | <0.001 | 1.901 | <0.001 | 3.638 | <0.001 | 3.309 | <0.001 |
| 339.996 | 18.13 | d-Fructose 1,6-bisphosphate * | 1.789 | <0.001 | 1.930 | <0.001 | 2.217 | <0.001 | 1.734 | <0.001 |
| 260.030 | 16.10 | d-Fructose 6-phosphate * | 1.580 | <0.001 | 1.716 | <0.001 | 1.515 | <0.001 | 1.653 | <0.001 |
| 169.998 | 16.16 | d-Glyceraldehyde 3-phosphate * | 0.600 | <0.001 | 0.441 | <0.001 | 0.519 | <0.001 | 0.404 | <0.001 |
| 185.993 | 16.75 | 3-Phospho-d-glycerate | 0.775 | ns | 1.849 | ns | 0.886 | ns | 0.934 | ns |
| 169.998 | 15.33 | Glycerone phosphate | 1.244 | ns | 2.368 | 0.014 | 1.804 | <0.001 | 1.293 | 0.023 |
| 177.943 | 15.96 | Pyrophosphate | 0.832 | 0.002 | 0.946 | ns | 1.040 | ns | 1.015 | ns |
| 97.977 | 15.96 | Orthophosphate | 0.768 | 0.003 | 0.912 | ns | 1.031 | ns | 1.036 | ns |
| 192.027 | 18.13 | Citrate * | 1.594 | <0.001 | 1.187 | 0.021 | 1.939 | <0.001 | 1.904 | <0.001 |
| 134.022 | 15.88 | (S)-Malate * | 1.116 | ns | 0.943 | ns | 0.869 | 0.002 | 1.124 | ns |
| 174.016 | 18.13 | cis-Aconitate * | 1.265 | ns | 0.984 | ns | 1.662 | 0.001 | 1.633 | 0.001 |
| 192.027 | 19.36 | Isocitrate * | 1.388 | ns | 1.493 | ns | 2.417 | 0.002 | 1.788 | 0.014 |
| 116.011 | 15.02 | Fumarate * | 1.186 | ns | 0.831 | ns | 1.445 | 0.002 | 1.826 | <0.001 |
| 118.027 | 14.98 | Succinate * | 1.557 | 0.002 | 1.170 | ns | 1.346 | 0.005 | 1.819 | 0.001 |
| 131.070 | 14.97 | Creatine * | 1.437 | 0.001 | 1.061 | ns | 3.014 | <0.001 | 1.365 | 0.002 |
| 809.126 | 12.49 | Acetyl-CoA | 0.730 | 0.006 | 0.907 | ns | 1.001 | ns | 0.995 | ns |
| 665.125 | 13.44 | NADH * | 0.553 | <0.001 | 0.642 | <0.001 | 1.330 | ns | 0.752 | 0.008 |
| 663.109 | 14.39 | NAD+ * | 0.490 | <0.001 | 0.499 | <0.001 | 0.683 | <0.001 | 0.548 | <0.001 |
| 506.995 | 16.67 | ATP * | 0.689 | 0.002 | 0.769 | 0.001 | 0.584 | <0.001 | 0.724 | 0.001 |
| 427.030 | 15.30 | ADP * | 0.598 | <0.001 | 0.671 | <0.001 | 0.638 | <0.001 | 0.762 | <0.001 |
| 443.024 | 18.01 | GDP * | 0.772 | 0.011 | 0.978 | ns | 1.004 | ns | 0.931 | ns |
| 522.990 | 19.36 | GTP * | 0.975 | ns | 1.385 | 0.003 | 1.297 | 0.002 | 1.051 | ns |
| Oxidative Stress/Pentose Phosphate Pathway | ||||||||||
| 370.007 | 18.36 | d-Sedoheptulose 1,7-bisphosphate | 1.475 | 0.002 | 1.817 | <0.001 | 1.565 | <0.001 | 1.513 | <0.001 |
| 232.035 | 15.75 | d-Ribitol 5-phosphate * | 0.683 | 0.007 | 0.744 | ns | 0.563 | 0.002 | 0.862 | 0.027 |
| 276.025 | 17.73 | 6-Phospho-d-gluconate * | 1.606 | 0.006 | 1.480 | 0.004 | 0.568 | 0.001 | 0.921 | ns |
| 196.058 | 13.26 | d-Gluconic acid * | 0.886 | ns | 0.800 | <0.001 | 0.795 | 0.002 | 0.925 | ns |
| 150.053 | 13.64 | d-Ribose | 1.307 | 0.017 | 0.899 | ns | 1.286 | 0.018 | 1.289 | 0.011 |
| 290.040 | 16.33 | d-Sedoheptulose 7-phosphate | 1.481 | 0.001 | 2.016 | <0.001 | 1.654 | <0.001 | 1.884 | <0.001 |
| 230.019 | 15.35 | d-Ribulose 5-phosphate | 1.566 | ns | 4.634 | 0.030 | 1.410 | 0.010 | 1.438 | 0.007 |
| 230.019 | 15.75 | d-Ribose 5-phosphate * | 1.525 | <0.001 | 1.516 | <0.001 | 1.796 | <0.001 | 1.230 | <0.001 |
| 745.091 | 17.14 | NADPH * | 0.733 | 0.002 | 0.331 | <0.001 | 00.00 | n/a | 0.347 | 0.004 |
| 743.076 | 16.87 | NADP+ * | 0.722 | 0.024 | 1.983 | <0.001 | 1.879 | <0.001 | 2.419 | 0.001 |
| 152.068 | 13.11 | Xylitol * | 1.423 | 0.001 | 1.063 | ns | 0.907 | ns | 1.189 | 0.049 |
| 196.058 | 13.89 | d-Mannonate | 2.006 | ns | 0.860 | ns | 2.406 | <0.001 | 2.454 | <0.001 |
| 166.048 | 13.43 | d-Xylonate | 1.673 | 0.019 | 0.929 | ns | 3.156 | <0.001 | 2.964 | <0.001 |
| 150.053 | 13.64 | d-Ribose | 1.307 | 0.017 | 0.899 | ns | 1.286 | 0.018 | 1.289 | 0.011 |
| 307.084 | 14.37 | Glutathione | 0.691 | <0.001 | 0.774 | <0.001 | 0.683 | <0.001 | 0.738 | <0.001 |
| 612.152 | 17.52 | Glutathione disulfide * | 1.113 | ns | 1.679 | 0.003 | 3.605 | <0.001 | 3.221 | <0.001 |
| Purine Metabolism | ||||||||||
| 363.058 | 19.36 | Guanosine 3’-phosphate | 0.909 | ns | 1.551 | 0.005 | 1.406 | 0.001 | 1.043 | ns |
| 168.028 | 12.41 | Urate * | 1.487 | ns | 0.738 | ns | 1.778 | 0.003 | 2.285 | 0.001 |
| 268.081 | 11.11 | Inosine * | 1.804 | 0.004 | 5.853 | <0.001 | 12.553 | <0.001 | 9.126 | <0.001 |
| 283.092 | 12.83 | Guanosine * | 1.454 | ns | 4.991 | <0.001 | 16.908 | <0.001 | 4.976 | <0.001 |
| 136.038 | 10.39 | Hypoxanthine * | 33.258 | <0.001 | 31.216 | <0.001 | 56.447 | <0.001 | 67.586 | <0.001 |
| 284.075 | 12.01 | Xanthosine * | 1.564 | 0.004 | 1.306 | 0.020 | 1.651 | 0.003 | 1.825 | 0.001 |
| 152.033 | 11.31 | Xanthine * | 1.907 | 0.005 | 1.171 | ns | 2.376 | <0.001 | 2.492 | <0.001 |
| 363.058 | 16.78 | GMP * | 1.016 | ns | 1.100 | ns | 0.809 | ns | 1.201 | 0.006 |
| 363.058 | 19.36 | Guanosine 3’-phosphate | 0.909 | ns | 1.551 | 0.005 | 1.406 | 0.001 | 1.043 | ns |
| 283.092 | 12.83 | Guanosine * | 1.454 | ns | 4.991 | <0.001 | 16.908 | <0.001 | 4.976 | <0.001 |
| 347.063 | 13.89 | AMP * | 0.656 | <0.001 | 0.660 | 0.001 | 0.326 | <0.001 | 0.680 | <0.001 |
| Pyrimidine Metabolism | ||||||||||
| 483.968 | 17.92 | UTP * | 0.355 | <0.001 | 0.440 | <0.001 | 0.393 | <0.001 | 0.417 | <0.001 |
| 308.041 | 13.81 | dUMP | 0.357 | <0.001 | 0.394 | <0.001 | 0.548 | <0.001 | 0.394 | <0.001 |
| 482.984 | 18.48 | CTP * | 0.473 | <0.001 | 0.596 | <0.001 | 0.688 | <0.001 | 0.492 | <0.001 |
| 403.018 | 17.14 | CDP * | 0.363 | <0.001 | 0.440 | <0.001 | 0.822 | ns | 0.541 | <0.001 |
| 323.052 | 15.35 | CMP * | 0.763 | 0.001 | 0.882 | 0.040 | 1.148 | ns | 0.999 | ns |
| 128.058 | 10.57 | 5,6-Dihydrothymine | 1.664 | ns | 0.698 | 0.006 | 1.395 | 0.007 | 2.075 | 0.033 |
| 126.043 | 15.31 | Thymine | 1.439 | 0.031 | 1.125 | ns | 1.995 | <0.001 | 1.893 | 0.001 |
| 125.059 | 10.93 | 5-Methylcytosine | 1.826 | ns | 1.021 | ns | 2.013 | <0.001 | 2.139 | 0.002 |
| 244.069 | 12.15 | Pseudouridine | 1.780 | 0.007 | 1.058 | ns | 2.266 | <0.001 | 2.134 | <0.001 |
| 243.085 | 12.15 | Cytidine * | 3.051 | 0.009 | 1.812 | ns | 4.662 | <0.001 | 4.849 | <0.001 |
| 176.043 | 16.65 | N-Carbamoyl-l-aspartate | 0.576 | <0.001 | 0.446 | <0.001 | 0.295 | <0.001 | 0.351 | <0.001 |
| 324.036 | 15.18 | UMP * | 0.417 | <0.001 | 0.412 | <0.001 | 0.475 | <0.001 | 0.482 | <0.001 |
| 404.002 | 16.59 | UDP * | 0.218 | <0.001 | 0.347 | <0.001 | 0.413 | <0.001 | 0.350 | <0.001 |
| 536.044 | 16.19 | UDP-d-xylose | 0.593 | <0.001 | 0.699 | 0.001 | 1.017 | ns | 0.745 | 0.002 |
| 580.034 | 18.96 | UDP-glucuronate | 0.615 | <0.001 | 0.736 | <0.001 | 0.701 | <0.001 | 0.664 | <0.001 |
| 566.055 | 16.31 | UDP-glucose * | 0.539 | <0.001 | 0.662 | <0.001 | 0.628 | <0.001 | 0.620 | <0.001 |
| Tryptophan Metabolism | ||||||||||
| 175.063 | 10.37 | Indole-3-acetate | 1.537 | <0.001 | 1.545 | <0.001 | 0.417 | <0.001 | 1.527 | <0.001 |
| 236.079 | 10.37 | l-Formylkynurenine | 1.507 | 0.002 | 1.431 | <0.001 | 0.418 | <0.001 | 1.453 | <0.001 |
| 191.058 | 10.37 | 5-Hydroxyindoleacetate * | 1.512 | <0.001 | 1.506 | <0.001 | 0.523 | <0.001 | 1.547 | <0.001 |
| 208.085 | 11.15 | l-Kynurenine * | 1.483 | ns | 1.114 | ns | 1.565 | 0.003 | 2.087 | <0.001 |
| 220.085 | 9.99 | 5-Hydroxy-l-tryptophan isomer | 8.354 | <0.001 | 7.721 | <0.001 | 1.655 | 0.007 | 8.798 | <0.001 |
| 205.074 | 7.56 | Indolelactate | 2.315 | 0.009 | 1.399 | ns | 2.267 | <0.001 | 3.333 | <0.001 |
| 117.058 | 11.92 | Indole * | 1.413 | 0.011 | 1.216 | ns | 3.554 | <0.001 | 2.257 | <0.001 |
| 204.090 | 11.91 | l-Tryptophan * | 1.311 | ns | 1.050 | ns | 3.194 | <0.001 | 2.019 | 0.003 |
| Miscellaneous | ||||||||||
| 146.069 | 15.31 | l-Glutamine * | 1.445 | 0.001 | 1.105 | ns | 1.965 | <0.001 | 1.889 | <0.001 |
| 147.053 | 14.71 | d-Glutamate * | 1.035 | ns | 0.777 | 0.002 | 1.259 | 0.002 | 1.355 | 0.003 |
| 301.056 | 14.93 | N-Acetyl-d-glucosamine 6-phosphate * | 0.785 | 0.006 | 0.755 | <0.001 | 0.642 | <0.001 | 0.878 | ns |
| 103.100 | 20.65 | Choline * | 1.277 | ns | 1.336 | 0.002 | 1.268 | 0.005 | 1.944 | <0.001 |
| 141.019 | 15.91 | Ethanolamine phosphate * | 0.869 | ns | 0.987 | ns | 0.555 | <0.001 | 0.797 | 0.016 |
| 105.043 | 16.02 | l-Serine * | 1.646 | 0.004 | 1.228 | 0.030 | 1.835 | <0.001 | 1.927 | <0.001 |
| 119.058 | 14.68 | l-Threonine | 2.719 | <0.001 | 1.618 | 0.001 | 3.190 | <0.001 | 2.821 | <0.001 |
| 155.070 | 15.16 | l-Histidine * | 2.450 | <0.001 | 1.285 | 0.018 | 3.175 | <0.001 | 2.737 | <0.001 |
| 146.106 | 25.28 | l-Lysine * | 1.520 | 0.001 | 1.254 | 0.017 | 1.862 | <0.001 | 1.734 | <0.001 |
| 384.122 | 13.99 | S-Adenosyl-l-homocysteine * | 1.163 | ns | 1.047 | ns | 1.580 | 0.001 | 1.545 | 0.002 |
| 203.116 | 11.29 | O-Acetylcarnitine * | 0.702 | 0.001 | 0.688 | <0.001 | 0.644 | <0.001 | 0.689 | 0.001 |
| 175.048 | 14.53 | N-Acetyl-l-aspartate * | 0.758 | 0.003 | 0.628 | <0.001 | 0.797 | 0.003 | 0.970 | ns |
| 133.038 | 15.04 | l-Aspartate * | 1.136 | ns | 0.888 | ns | 1.306 | 0.003 | 1.618 | <0.001 |
| 89.048 | 14.97 | l-Alanine * | 0.671 | 0.001 | 0.731 | 0.004 | 1.041 | ns | 0.720 | 0.001 |
| 226.106 | 16.03 | Carnosine * | 1.088 | ns | 1.080 | ns | 1.203 | 0.016 | 1.201 | 0.012 |
| 132.054 | 15.48 | l-Asparagine * | 1.211 | ns | 0.798 | ns | 1.310 | 0.001 | 1.416 | 0.001 |
| 149.051 | 11.79 | l-Methionine * | 1.358 | ns | 0.910 | ns | 1.822 | <0.001 | 1.869 | <0.001 |
| 222.067 | 17.33 | Cystathionine * | 0.714 | ns | 0.833 | ns | 0.508 | <0.001 | 0.811 | ns |
| 181.074 | 13.24 | l-Tyrosine * | 1.360 | ns | 0.989 | ns | 1.930 | <0.001 | 1.840 | 0.001 |
| 131.095 | 11.11 | l-Leucine * | 1.383 | 0.007 | 0.962 | ns | 1.836 | <0.001 | 1.949 | <0.001 |
| 131.094 | 11.51 | l-Isoleucine * | 1.424 | ns | 0.915 | ns | 1.838 | <0.001 | 1.852 | <0.001 |
| 117.079 | 12.77 | l-Valine * | 1.739 | 0.006 | 1.045 | ns | 1.901 | <0.001 | 1.876 | <0.001 |
| Mass | Rt | Putative Metabolite | LPS/C | 11E-OH + LPS/C | 11E-Ester + LPS/C | 11E-Acid + LPS/C | ||||
|---|---|---|---|---|---|---|---|---|---|---|
| Ratio | p Value | Ratio | p Value | Ratio | p Value | Ratio | p Value | |||
| Fatty Acid and Related Metabolites | ||||||||||
| 306.256 | 19.23 | Icosatrienoic acid * | 1.963 | <0.001 | 2.976 | 0.001 | 7.296 | <0.001 | 2.941 | <0.001 |
| 328.240 | 18.11 | Docosahexaenoic acid * | 1.637 | 0.007 | 2.005 | 0.003 | 4.187 | <0.001 | 2.336 | <0.001 |
| 336.303 | 22.99 | Docosadienoic acid * | 1.058 | ns | 1.021 | ns | 2.301 | <0.001 | 1.027 | ns |
| 282.256 | 19.94 | Oleic acid * | 1.126 | ns | 1.189 | 0.034 | 2.938 | <0.001 | 1.391 | 0.003 |
| 216.136 | 4.28 | Undecanedioic acid | 1.181 | 0.041 | 1.463 | 0.001 | 9.890 | <0.001 | 1.487 | 0.003 |
| 214.193 | 14.92 | Tridecanoic acid * | 1.138 | ns | 1.102 | ns | 1.731 | 0.018 | 1.323 | 0.004 |
| 334.287 | 21.67 | Docosatrienoic acid * | 1.288 | 0.050 | 1.346 | 0.018 | 3.345 | <0.001 | 1.523 | 0.006 |
| 398.339 | 24.40 | Axillarenic acid * | 1.167 | ns | 1.118 | 0.023 | 1.331 | 0.039 | 1.190 | 0.007 |
| 366.350 | 26.47 | Tetracosenoic acid * | 1.322 | 0.001 | 1.632 | <0.001 | 6.416 | <0.001 | 4.085 | 0.018 |
| 230.152 | 7.29 | Dodecanedioic acid | 1.071 | ns | 1.313 | ns | 23.842 | <0.001 | 1.352 | 0.023 |
| 258.183 | 12.16 | Tetradecanedioic acid | 1.342 | ns | 1.231 | ns | 23.897 | 0.009 | 1.573 | 0.030 |
| 242.225 | 17.85 | Pentadecanoic acid * | 1.021 | ns | 1.084 | ns | 1.711 | 0.017 | 1.233 | 0.039 |
| 248.178 | 12.32 | Hexadecatetraenoic acid | 1.205 | ns | 1.837 | ns | 2.553 | 0.017 | 2.041 | 0.044 |
| 298.287 | 23.03 | Nonadecanoic acid * | 1.133 | 0.001 | 1.133 | ns | 1.310 | 0.001 | 1.219 | <0.001 |
| 332.272 | 20.18 | Docosatetraenoic acid * | 1.664 | 0.004 | 2.549 | <0.001 | 4.261 | <0.001 | 2.348 | <0.001 |
| 304.240 | 18.24 | Eicosatetraenoic acid * | 1.578 | 0.006 | 2.874 | <0.001 | 6.998 | <0.001 | 2.985 | <0.001 |
| 338.319 | 24.50 | Docosenoic acid * | 1.155 | 0.050 | 1.871 | <0.001 | 22.311 | <0.001 | 8.335 | <0.001 |
| 394.381 | 28.24 | Hexacosenoic acid * | 1.433 | <0.001 | 1.047 | ns | 1.903 | <0.001 | 1.685 | <0.001 |
| 364.334 | 25.02 | Tetracosadienoic acid * | 0.888 | ns | 1.409 | ns | 3.193 | <0.001 | 2.568 | <0.001 |
| 202.120 | 4.64 | Decanedioic acid | 1.134 | ns | 1.441 | 0.008 | 1.944 | 0.007 | 1.204 | ns |
| 226.193 | 15.21 | Tetradecenoic acid * | 0.820 | ns | 0.941 | ns | 1.660 | 0.009 | 0.963 | ns |
| 186.162 | 11.81 | Undecanoic acid * | 1.065 | ns | 0.898 | ns | 1.864 | 0.015 | 1.238 | ns |
| 158.131 | 8.54 | Nonanoic acid * | 1.084 | ns | 0.946 | ns | 1.714 | 0.019 | 1.370 | ns |
| 280.240 | 18.26 | Linoleate * | 1.169 | ns | 1.052 | ns | 1.617 | <0.001 | 1.202 | ns |
| 172.110 | 4.54 | 9-Oxononanoic acid | 1.213 | ns | 1.231 | ns | 1.497 | ns | 1.388 | 0.031 |
| 368.220 | 11.57 | Prostaglandin G2 | 1.358 | ns | 1.841 | 0.026 | 3.300 | 0.003 | 2.432 | 0.008 |
| 356.257 | 14.60 | Prostaglandin F1alpha | 1.203 | ns | 1.446 | 0.021 | 1.927 | <0.001 | 1.544 | 0.001 |
| Glycerophospholipids | ||||||||||
| 638.396 | 13.80 | PA (32:5) | 1.549 | ns | 1.510 | ns | 2.748 | 0.021 | 2.678 | ns |
| 847.645 | 29.88 | PC (42:6) | 0.963 | ns | 3.742 | <0.001 | 4.541 | <0.001 | 2.501 | 0.019 |
| 825.530 | 18.21 | PC (40:10) | 0.897 | 0.042 | 0.753 | 0.031 | 0.551 | 0.002 | 0.563 | <0.001 |
| 851.546 | 18.59 | PC (42:11) | 0.821 | 0.016 | 0.574 | <0.001 | 0.269 | <0.001 | 0.406 | <0.001 |
| 881.593 | 21.81 | PC (44:10) | 1.016 | ns | 1.743 | 0.002 | 2.051 | <0.001 | 1.090 | ns |
| 722.545 | 24.76 | PG (33:0) | 0.884 | ns | 0.933 | ns | 0.857 | ns | 0.515 | 0.001 |
| 484.280 | 22.13 | Lyso PG (16:0) | 1.056 | ns | 0.876 | ns | 0.817 | 0.002 | 0.942 | ns |
| 482.264 | 7.32 | Lyso PG (16:1) | 0.833 | ns | 1.097 | ns | 0.820 | 0.050 | 0.942 | ns |
| 572.296 | 7.29 | Lyso PI (16:0) | 1.028 | ns | 1.137 | 0.027 | 1.268 | 0.001 | 1.200 | 0.001 |
| 598.312 | 7.95 | Lyso PI (18:1) | 1.031 | ns | 1.241 | 0.007 | 1.563 | <0.001 | 1.303 | 0.004 |
| 622.312 | 7.71 | Lyso PI (20:3) | 1.119 | ns | 1.302 | 0.020 | 1.154 | ns | 1.255 | 0.031 |
| 620.296 | 7.04 | lyso PI (20:4) | 1.152 | ns | 1.187 | 0.045 | 1.891 | <0.001 | 1.770 | <0.001 |
| 495.260 | 6.38 | lyso PS (16:1) | 1.015 | ns | 0.885 | ns | 0.730 | 0.004 | 0.818 | 0.036 |
| 771.505 | 24.05 | PS (35:3) | 0.647 | 0.001 | 0.434 | <0.001 | 0.315 | <0.001 | 0.272 | <0.001 |
| 497.275 | 7.72 | Lyso PS (16:0) | 1.033 | ns | 1.139 | ns | 0.801 | 0.011 | 1.036 | ns |
| 517.244 | 12.63 | Lyso PS 18:4 | 1.689 | 0.040 | 1.922 | <0.001 | 2.208 | 0.020 | 1.390 | ns |
| 691.441 | 12.63 | PS (29:1) | 1.380 | ns | 2.276 | 0.038 | 2.380 | ns | 2.448 | ns |
© 2019 by the authors. Licensee MDPI, Basel, Switzerland. This article is an open access article distributed under the terms and conditions of the Creative Commons Attribution (CC BY) license (http://creativecommons.org/licenses/by/4.0/).
Share and Cite
Alqarni, A.M.; Dissanayake, T.; Nelson, D.J.; Parkinson, J.A.; Dufton, M.J.; Ferro, V.A.; Watson, D.G. Metabolomic Profiling of the Immune Stimulatory Effect of Eicosenoids on PMA-Differentiated THP-1 Cells. Vaccines 2019, 7, 142. https://0-doi-org.brum.beds.ac.uk/10.3390/vaccines7040142
Alqarni AM, Dissanayake T, Nelson DJ, Parkinson JA, Dufton MJ, Ferro VA, Watson DG. Metabolomic Profiling of the Immune Stimulatory Effect of Eicosenoids on PMA-Differentiated THP-1 Cells. Vaccines. 2019; 7(4):142. https://0-doi-org.brum.beds.ac.uk/10.3390/vaccines7040142
Chicago/Turabian StyleAlqarni, Abdulmalik M., Tharushi Dissanayake, David J. Nelson, John A. Parkinson, Mark J. Dufton, Valerie A. Ferro, and David G. Watson. 2019. "Metabolomic Profiling of the Immune Stimulatory Effect of Eicosenoids on PMA-Differentiated THP-1 Cells" Vaccines 7, no. 4: 142. https://0-doi-org.brum.beds.ac.uk/10.3390/vaccines7040142