Classical and Deep Learning Paradigms for Detection and Validation of Key Genes of Risky Outcomes of HCV

1
Information Technology Department, College of Computer & Information Sciences, Princess Nourah bint Abdulrahman University, 11671 Riyadh, Saudi Arabia
2
Computer Engineering Department, Misr University for Science and Technology, 12511 Giza, Egypt
Algorithms 2020, 13(3), 73; https://0-doi-org.brum.beds.ac.uk/10.3390/a13030073
Submission received: 19 December 2019
/
Revised: 6 March 2020
/
Accepted: 17 March 2020
/
Published: 24 March 2020
(This article belongs to the Special Issue Algorithms in Bioinformatics)
Abstract
:Hepatitis C virus (HCV) is one of the most dangerous viruses worldwide. It is the foremost cause of the hepatic cirrhosis, and hepatocellular carcinoma, HCC. Detecting new key genes that play a role in the growth of HCC in HCV patients using machine learning techniques paves the way for producing accurate antivirals. In this work, there are two phases: detecting the up/downregulated genes using classical univariate and multivariate feature selection methods, and validating the retrieved list of genes using Insilico classifiers. However, the classification algorithms in the medical domain frequently suffer from a deficiency of training cases. Therefore, a deep neural network approach is proposed here to validate the significance of the retrieved genes in classifying the HCV-infected samples from the disinfected ones. The validation model is based on the artificial generation of new examples from the retrieved genes’ expressions using sparse autoencoders. Subsequently, the generated genes’ expressions data are used to train conventional classifiers. Our results in the first phase yielded a better retrieval of significant genes using Principal Component Analysis (PCA), a multivariate approach. The retrieved list of genes using PCA had a higher number of HCC biomarkers compared to the ones retrieved from the univariate methods. In the second phase, the classification accuracy can reveal the relevance of the extracted key genes in classifying the HCV-infected and disinfected samples.
1. Introduction
Hepatitis C virus (HCV) is one of the dangerous infection diseases worldwide. The replication of hepatitis C in an infected patient eventually causes cirrhosis of the liver or hepatocellular carcinoma (HCC) [1,2] which is ranked as the 12th disease in a ranking of the principal causes of death [3]. Current antivirals for HCV do not target every virus protein required during its life cycle due to the lack of knowledge about the key genes responsible for its replication phase [4].
The microarray is an effective innovation that helps in studying the sub-atomic science of tissues and the quality expression estimations of the entire genome. High-density oligonucleotide array technology, Affymetrix GeneChip, is generally utilized as a part of numerous regions of biomedical exploration for estimating the gene expression values [5]. Affy microarrays help in quantifying the expression of thousands of genes in only one test, which paved the way to understanding and analyzing gene behavior under different conditions [6]. However, the prediction of new significant genes from huge data produced by large-scale Affymetrix microarrays may require the use of statistical and machine learning techniques [7].
Simple statistical approaches for predicting informative genes from microarrays such as T-test and F-test can indicate the variance in gene expression in different data sets [8]. However, univariate and multivariate machine learning techniques are more advanced methods [9]. Univariate gene selection approaches can measure the significance of each gene individually. Multivariate approaches are optimized to handle multiple variables (or features) simultaneously [10]. Another use of the multivariate approach is to expose the inherent structure of variables through the application of various statistical methods.
One of the most commonly used approaches for validating the significance of detected key genes is done via Insilco classifiers. However, the classification algorithms in the medical domain frequently suffer from a deficiency of training cases [11]. Most probably, the classifiers yield worse prognostic performance when trained on such small number of classes [12]. Typically, large dimensionality is one of the significant challenges that faces the interpretation and the analysis of gene expression data measured using microarray technology [13]. In microarray technology, thousands of gene expressions are produced under few conditions’ samples. The inadequate number of condition samples yield a faulty generalization and an inaccurate precision of classification models [14]. Data augmentation, the synthetic generation of additional training samples, can help in resolving the imbalance in data [15,16]. The deep autoencoder is one the most commonly employed paradigms to the field data augmentation [17]. It is a feed-forward, deep neural network that generates an output data X’ that is similar o an input data X using a set of low-dimension hidden layers [18].
In this work, the variations in genes expression during the different stages of HCV replication cycle are analyzed, which may help in discovering new key genes that may be targeted via a more effective HCV antiviral vaccine. This study, using univariate and multivariate gene selection methods, aims to extract key genes that play a role in worsening the progression of the Hepatitis C cycle. The effectiveness of each approach, univariate and multivariate, is investigated via a biological interpretation of retrieved features and a proposed deep autoencoder validation mode. The model is based on generating an adequate dataset using a feed forward autoencoder. The generated synthetic dataset was generated based on the expression values of the extracted key genes. Such data have been used to train sets of classical classifiers.
2. Literature Review
The non-invasive detection of new significant genes for the replication of HCV and its outcomes, such as Hepatocellular carcinoma using machine learning techniques, has been recently addressed in a diverse array of studies. Studying the early stages of HCV infection and detecting the host genes involved in the HCV life cycle was discussed in [8]. They utilized the same dataset applied in this research. A simple statistical method, Analysis of Variance (ANOVA), has been applied. An average of the triplicate values was used to calculate fold change, and each value was assessed for its statistical significance. Host genes having a p-value less than 0.05 were considered significant genes. The retrieved genes are those ones that has an increase/decrease in their expression of at least 2-fold.
The work done in [1] investigated the potential of Alpha Fetal Protein (AFP) as a well-known biomarker for HCC [19,20]. LncRNA (long non-coding RNAs) microarray has been used. Significant genes were selected using two univariate methods (chi-square tests and t-test). T-test was used to compare variances in the lncRNA expression of plasma tissue of normal and up normal samples. They detected three genes that might be potential biomarkers for tumorigenesis prediction and two genes for metastasis prediction in the future.
Another study has been done in [10] and they compared the univariate and multivariate gene selection methods via a range of classifiers based on a diverse type of cancers. They concluded that univariate gene selection paradigms yielded better results than the multivariate ones in five out of seven datasets. In the univariate method, they applied Pearson correlation, t-statistic or SNR, signal to noise ratio, and applied base pair selection, forward selection and recursive feature elimination in the multivariate method.
In the study done in [21], the author proposed new technique called Stable Gene Selection (SGS) which selects significant genes for training a Support Vector Machine (SVM) classifier [22]. Key genes are selected using Bayesian [23] and Lasso [24]. Then, the selected genes are used to train the SVM classification algorithm to build a prediction model. The proposed method (SGS) has been applied on four datasets and it outperformed the existing gene selection methods.
Another study [25] utilized perception tools to predict the up/down regulated genes in microarray samples. They proposed the Kernel PCA (KPCA) [26] and Biplot [27] to plot gene expression profiles. They applied the proposed method on three types of cancer including lymphoma, colon tumor, and leukemia cancer datasets. The proposed procedure starts with the SVD of preprocessed gene expression input matrix then takes the row of matrices as a set of observations to compute Kernel matrix. The nonlinear features are calculated using PCA on the Kernel matrix.
Similar work using machine learning for the same medical domain, HCV, is the work done in [28]. They applied a hybrid machine learning paradigm for diagnosing hepatitis disease. Four stages are used in that work, including dimension reduction, clustering, feature selection, and classification. The dimension of the data was reduced using non-linear iterative partial least squares, then the self-organizing map was applied to cluster the similar data points, Classification and Regression Trees (CART) for selecting the significant features, and the ensemble classifier to predict the class (live or die).
The work done in [29] investigated the serum miR-218 and its expression in patients with HCC, and analyzed its potential in the diagnosis and prognosis of HCC. They compared the expression of the serum level of miR-218 in healthy liver and HCC tissues to assess the relationship between its expression normal and tumor samples. The demonstrative estimation of serum miR-218 in HCC was additionally examined. This study gave profitable confirmation of the recognizable proof of the serum miR-218 as prognostic biomarker for HCC.
This study is an extension to our previous work done in [30] in which we have introduced a hybrid algorithm for the detection of the differentially expressed genes, upregulated ones, as candidate biomarkers for HCC. We have applied univariate methods including Pearson’s correlation coefficient, Cosine coefficient, Euclidean distance, mutual information and entropy. The experimental results yielded six genes that are well-known biomarkers for HCC using Pearson’s correlation coefficient, and Cosine coefficient. A lower number of well-known biomarkers were obtained by the other methods (four genes using mutual information, three genes using Euclidean distance and only one gene using entropy). In this work, we are comparing the significance of the univariate and multivariate approaches in detecting key genes associated with the replication cycle of C virus and its outcomes. Furthermore, we are proposing a novel approach of deep learning where sparse autoencoders are used in the validation model of retrieved significant genes.
3. Proposed Framework
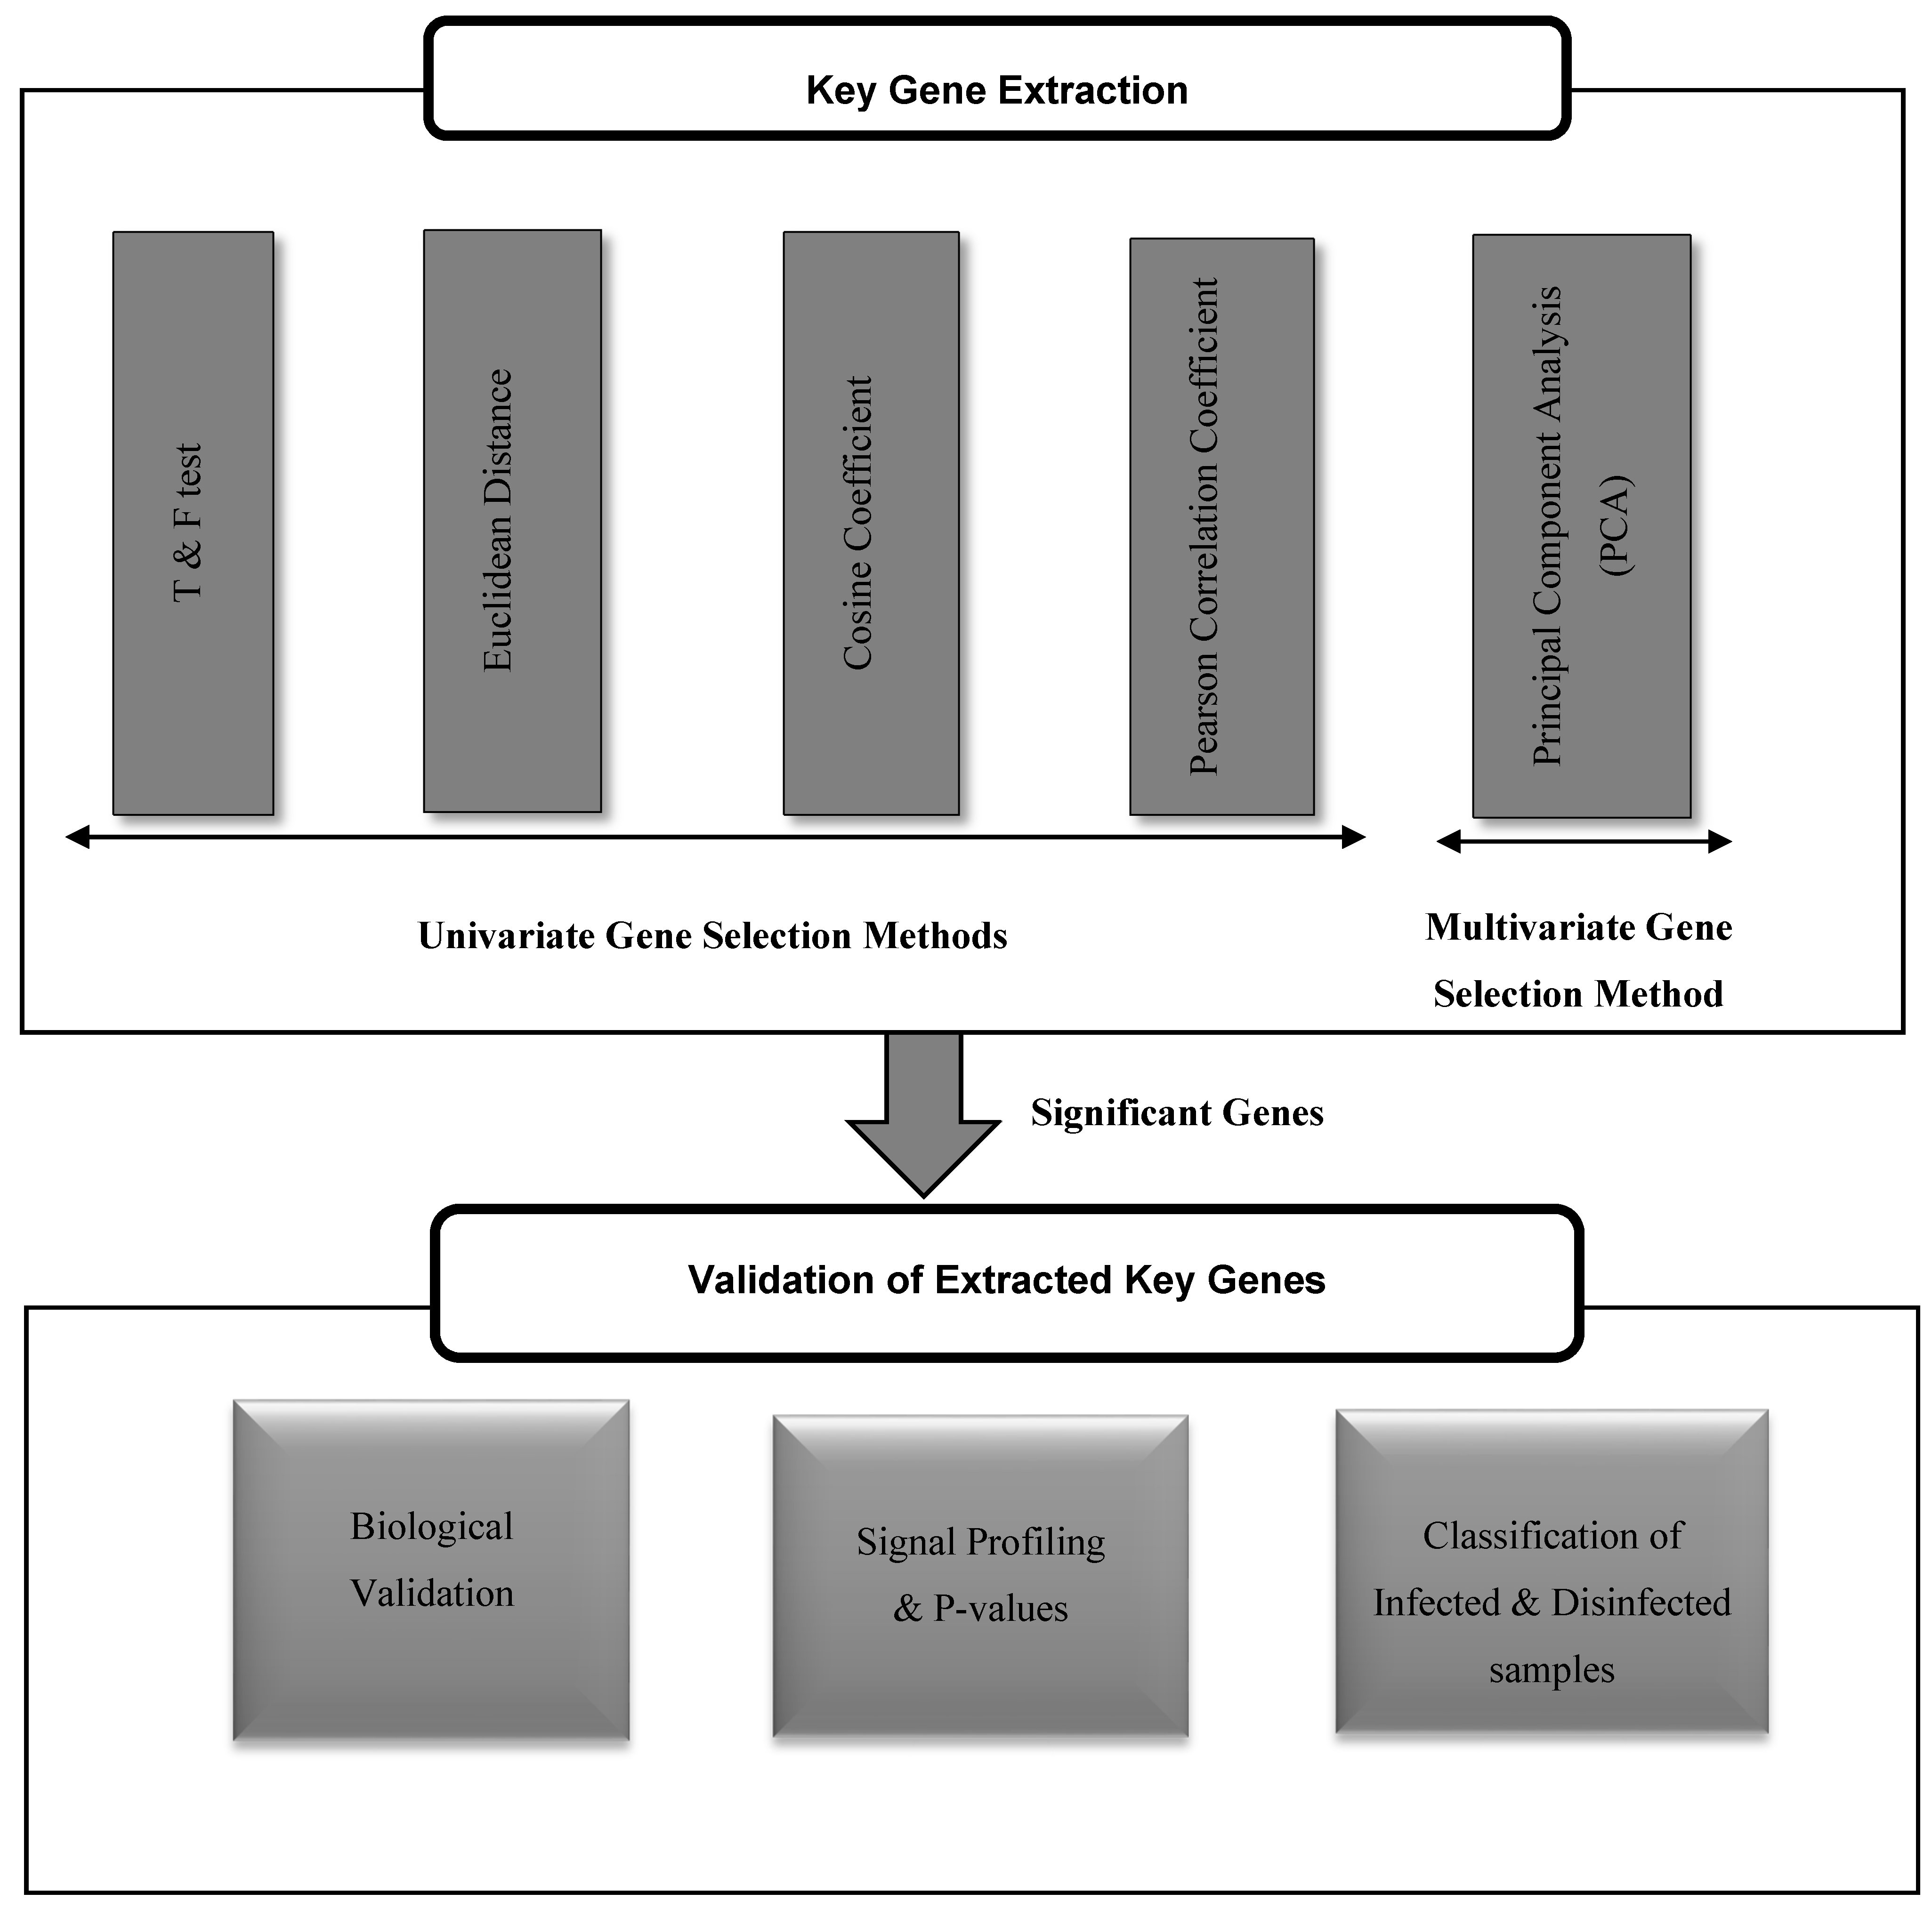
The proposed framework, as shown in Figure 1, consists of two phases: extracting the key genes that play a role in the occurrence of risky outcomes of HCV, and validating their significance for such diseases. The extraction of key genes has been done using both of univariate and multivariate gene selection methods. The significance of each tested method in retrieving powerful key genes for the risky outcomes of HCV is assessed by three paradigms: mining the biological literature, NCBI Entrez system, and KEGG pathways for such genes, inspecting their P-values and profiling their expression in both HCV-infected and HCV-disinfected samples, and assessing their ability in classifying the HCV-infected and HCV-disinfected samples.
3.1. Key Genes Extraction
The profiles of genes in HCV-infected and disinfected samples are represented by a gene expression matrix. The entries of this matrix are expression values of all genes, amount of their RNA, measured in infected and controlled samples. In this work, twenty-four samples were taken from Gene expression Omnibus, GEO [31]. The detailed description of the data used in this work is included in the Appendix A. After preprocessing of the data samples, a gene expression matrix of 54675 genes is retrieved for each period of post-infection.
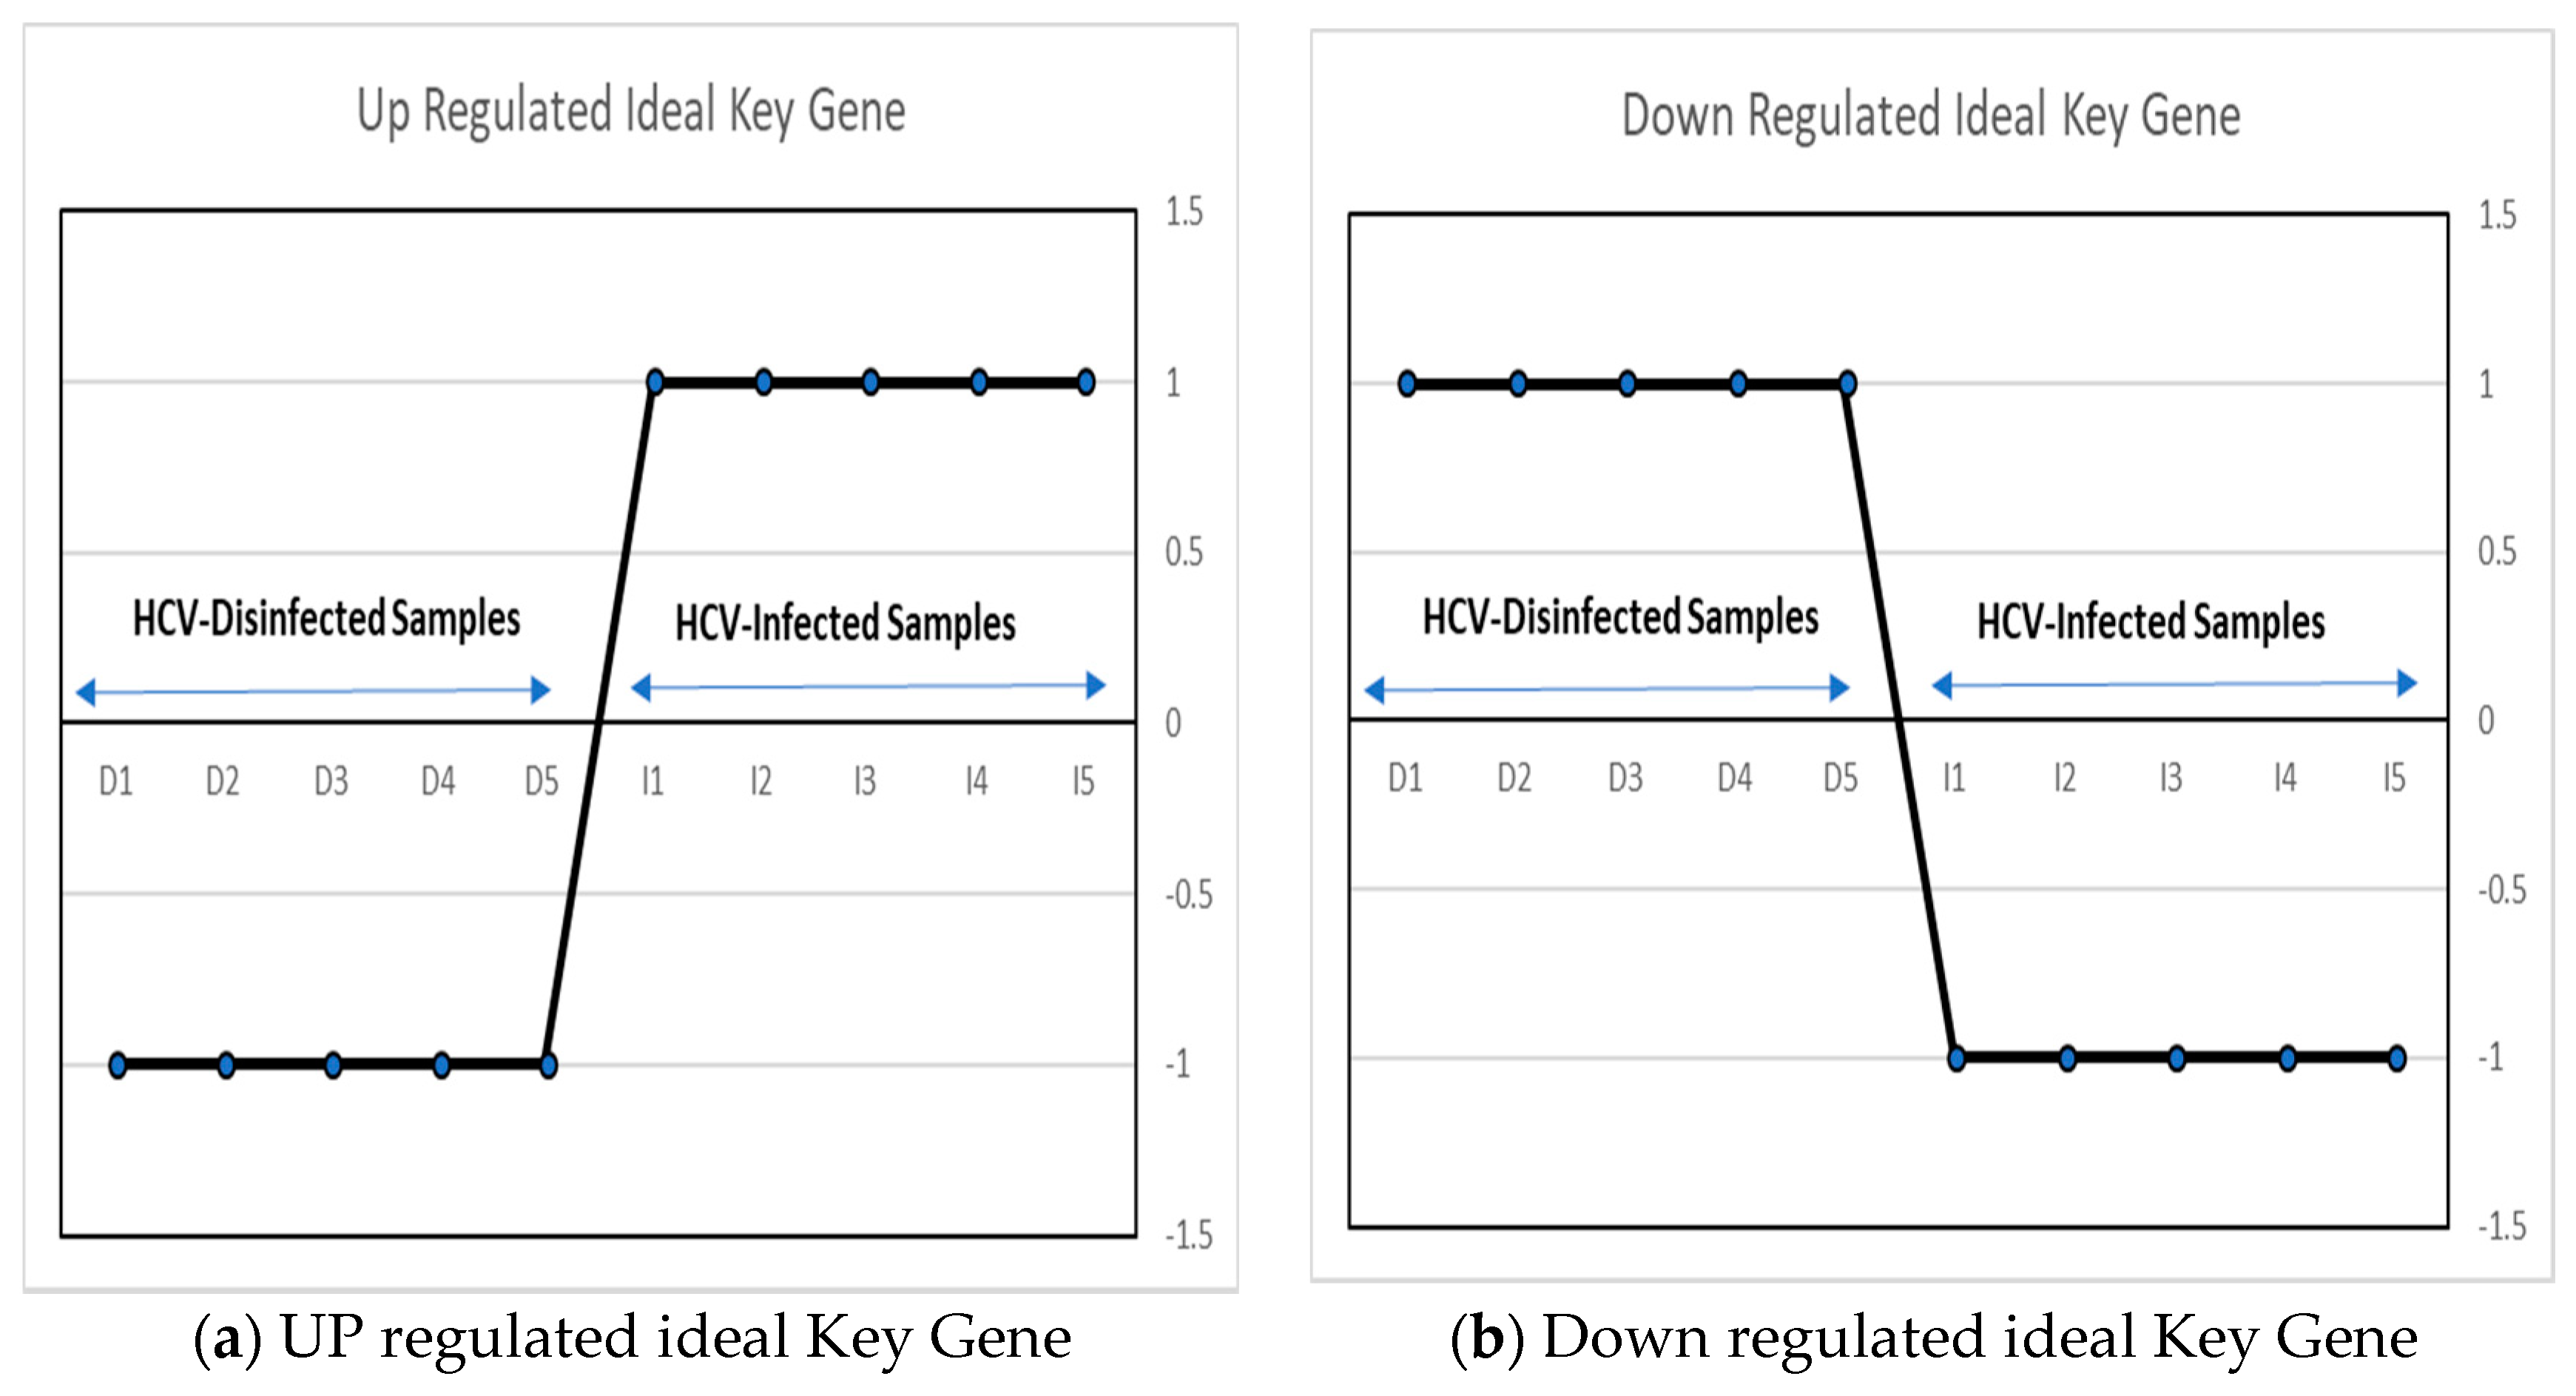
Ideal Up/Down Regulated Key Genes
An ideal key gene can be defined as a gene that has a variation in its values in infected and disinfected samples [30]. In this work, two ideal key genes have been proposed, as shown in Figure 2. Upregulated key genes are used as a vector, with two different sets (−1, 1) of values in HCV-disinfected and infected samples. And a downregulated key gene is proposed as a gene with values of (1, −1) in the HCV-disinfected and -infected samples.
3.2. Univariate Gene Selection Methods
The univariate gene selection is a methodology that utilizes a criterion to assess the information of every gene exclusively. T&F tests, Pearson correlation, Euclidean and Cosine distances have been applied here to detect the significant genes. The similarity between genes under investigation and the ideal key genes has been calculated using the Pearson Coefficient, Cosine coefficient, and Euclidean distances using the same criteria as [30]. Euclidean distance has been applied to measure similarities between the ideal key genes and all genes in the gene expression matrix. The similarity between two vectors can be dictated by measuring the distance between them in the space. The Cosine Coefficient (CC) can gauge the reliance between two vectors representing the genes. On the off chance that the cosine coefficient is zero, then they are independent, and, if one, then they are indicating in the same direction. Key genes should have a Pearson coefficient close to ±1. Typically, the retrieved key genes have minimum values of ±0.7 for their Pearson coefficient.
3.3. Multivariate Gene Selection Method
Multivariate feature selection approach is optimized to handle multiple features (or genes) simultaneously [10]. Principal Component Analysis (PCA) is a statistical multivariate paradigm for dimensionality reduction. It applies an orthogonal conversion for a set of correlated features into a set of principal components that are uncorrelated features. In this work, PCA is utilized, as it is the simplest multivariate analyses method and mostly applied as a tool in exploring and describing the variance of features within a dataset [32].
Principal component analysis (PCA) is applied to outline the information in a dataset described by numerous variables. PCA reduces the dimensionality of data containing an extensive set of variables. This is accomplished by transforming the initial variables into another small set of variables without losing the most critical data in the first information set. The fundamental objective of PCA is identifying a concealed example in a dataset, dropping the dimensionality of the data by removing the noise and redundancy in the data, and identifying correlated variables.
PCA applies to an input data table, X, that has rows (individuals) and columns (quantitative variables). X is transformed via an orthogonal linear transformation, as follows: assuming a is the new individual, then its coordinate can be written as shown in Equation (1), where , shown in Equation (2), is the coordinate of the variable on the axis s, is the weight accompanying to the variable , and is the eigenvalue accompanying with the axis s, the weight accompanying to the individual , is the data table of row , and column
In this study, the multivariate analysis has been implemented using R language. Two R packages, namely FactoMineR [33] and FactoextraR [34], have been applied. FactoMineR has been used here for performing a multivariate exploratory data analysis. FactoextraR package has been used for computing variances in retrieved principal components. We have visualized individuals that are used during the principal component analysis, which appear as Affy Ids, ranked from the smallest p-value to larger ones. Then, we validated the data to extract significant genes that affect the replication cycle of the C virus.
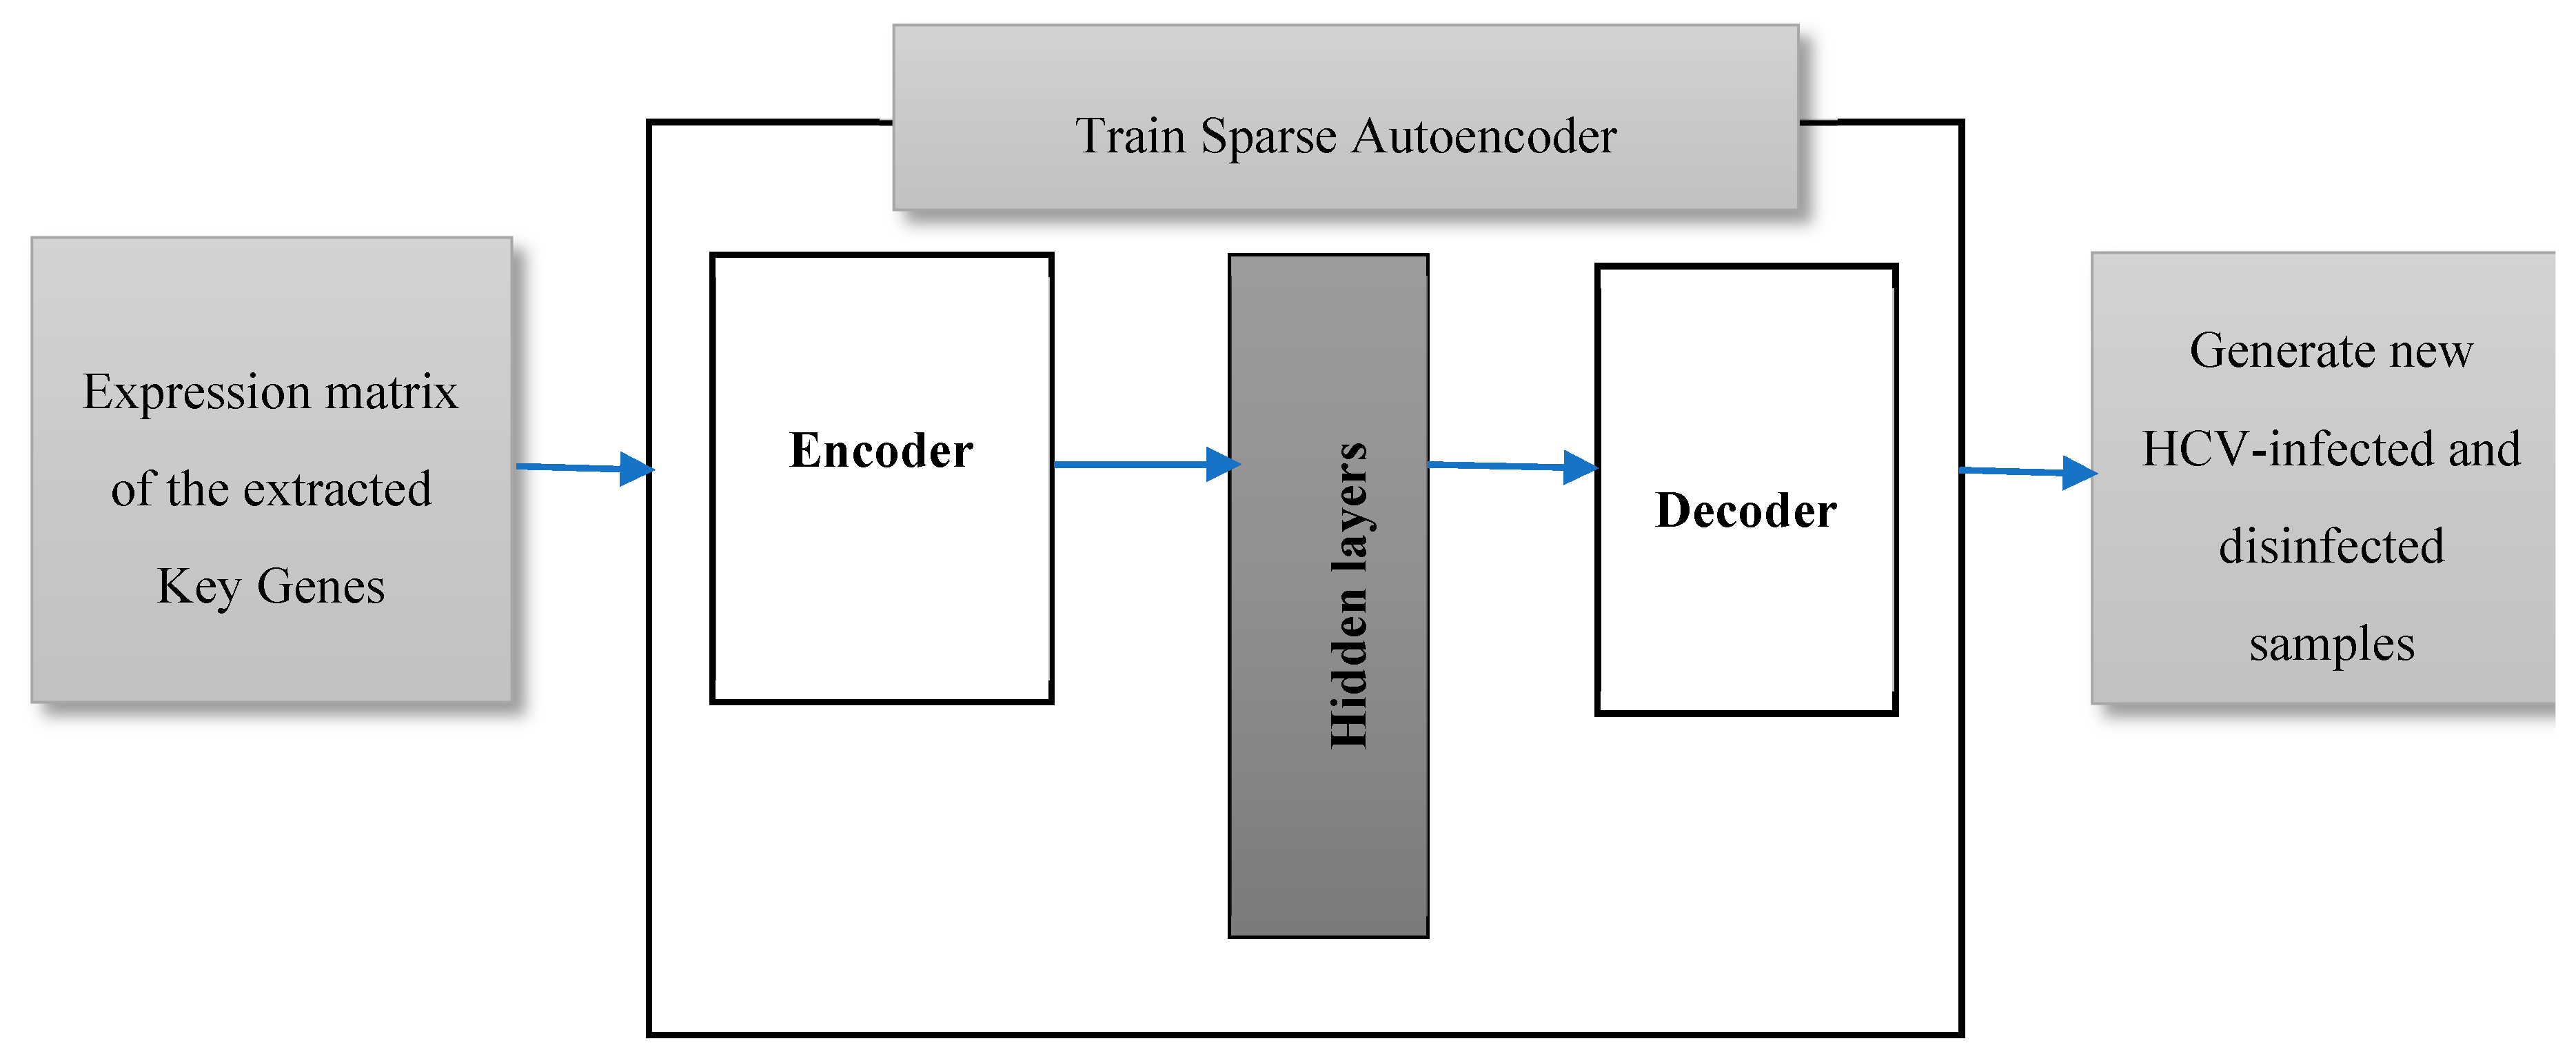
3.4. Validating the Extracted Key Genes
Mining the biological databases and literature, and examining the gene signal profiles for the top ranked extracted key genes have been extensively carried out in this work, as will be illustrated in the results section. However, the classification of HCV-infected and disinfected samples using the conventional classification algorithms has suffered from a deficiency in the number of samples. Twenty-four infected and disinfected samples are too insufficient to be split into training and testing samples. Most probably, the classification algorithms yield a worse predictive performance after being trained and tested on such a low number of samples. Therefore, in this work, we are proposing data augmentation of the expressions of the extracted key genes in the twenty-four samples to generate additional samples, as shown in Figure 3. A sparse autoencoder has been applied here, as it is one of the furthermost working methods for the field data augmentation [17]. It is a feed-forward deep neural network that generates an output, data X’, that is similar to an input data X using a set of low-dimension hidden layers [18]. A sparse autoencoder is an unsupervised neural network learning approach that tries to predict an output that is very close to its input. The input data are passed to an encoder which compresses and encodes the data. The encoded data, in turn, will be decompressed via a decoder. The weights of the closing hidden layer are the compressed picture of the input from which an approximated version of the original data can be regenerated. The number of nodes of both the input layer and the output layer are the same in case of data reconstruction.
Learning Parameters
In our experiment, a gene expression matrix of the most significant retrieved genes, with a p-value less than 0.005, is the input data, X, to the autoencoder. Ten autoencoders have been trained in an unsupervised manner with no labels to its input data examples, so the number of generated samples is 240. Each autoencoder consists of an encoder, hidden layers, and a decoder. Satlin, and purelin (defined by Equations (3) and (4) respectively) have been applied for the transfer function of the encoder and the decoder, respectively. The learning model tries to minimize the difference between the generated and original data (X and X’), so the cost function of the training model has been adjusted as a mean squared error function between X and X’. The learning model is trained for 1000 epochs, 0.04 as a coefficient of L2 regularization term, and 4 as a sparsity regularization term.
4. Results and Discussion
4.1. Biological validation of extracted Key Genes
By mining the KEGG pathways [35] and NCBI Entrez system, the biological interpretations of the extracted key genes are listed in Table 1, Table 2, Table 3 and Table 4. Each table contains the following details about the extracted key genes: the affy ID, gene symbol, Entrez ID, oncology, and the gene pathway.
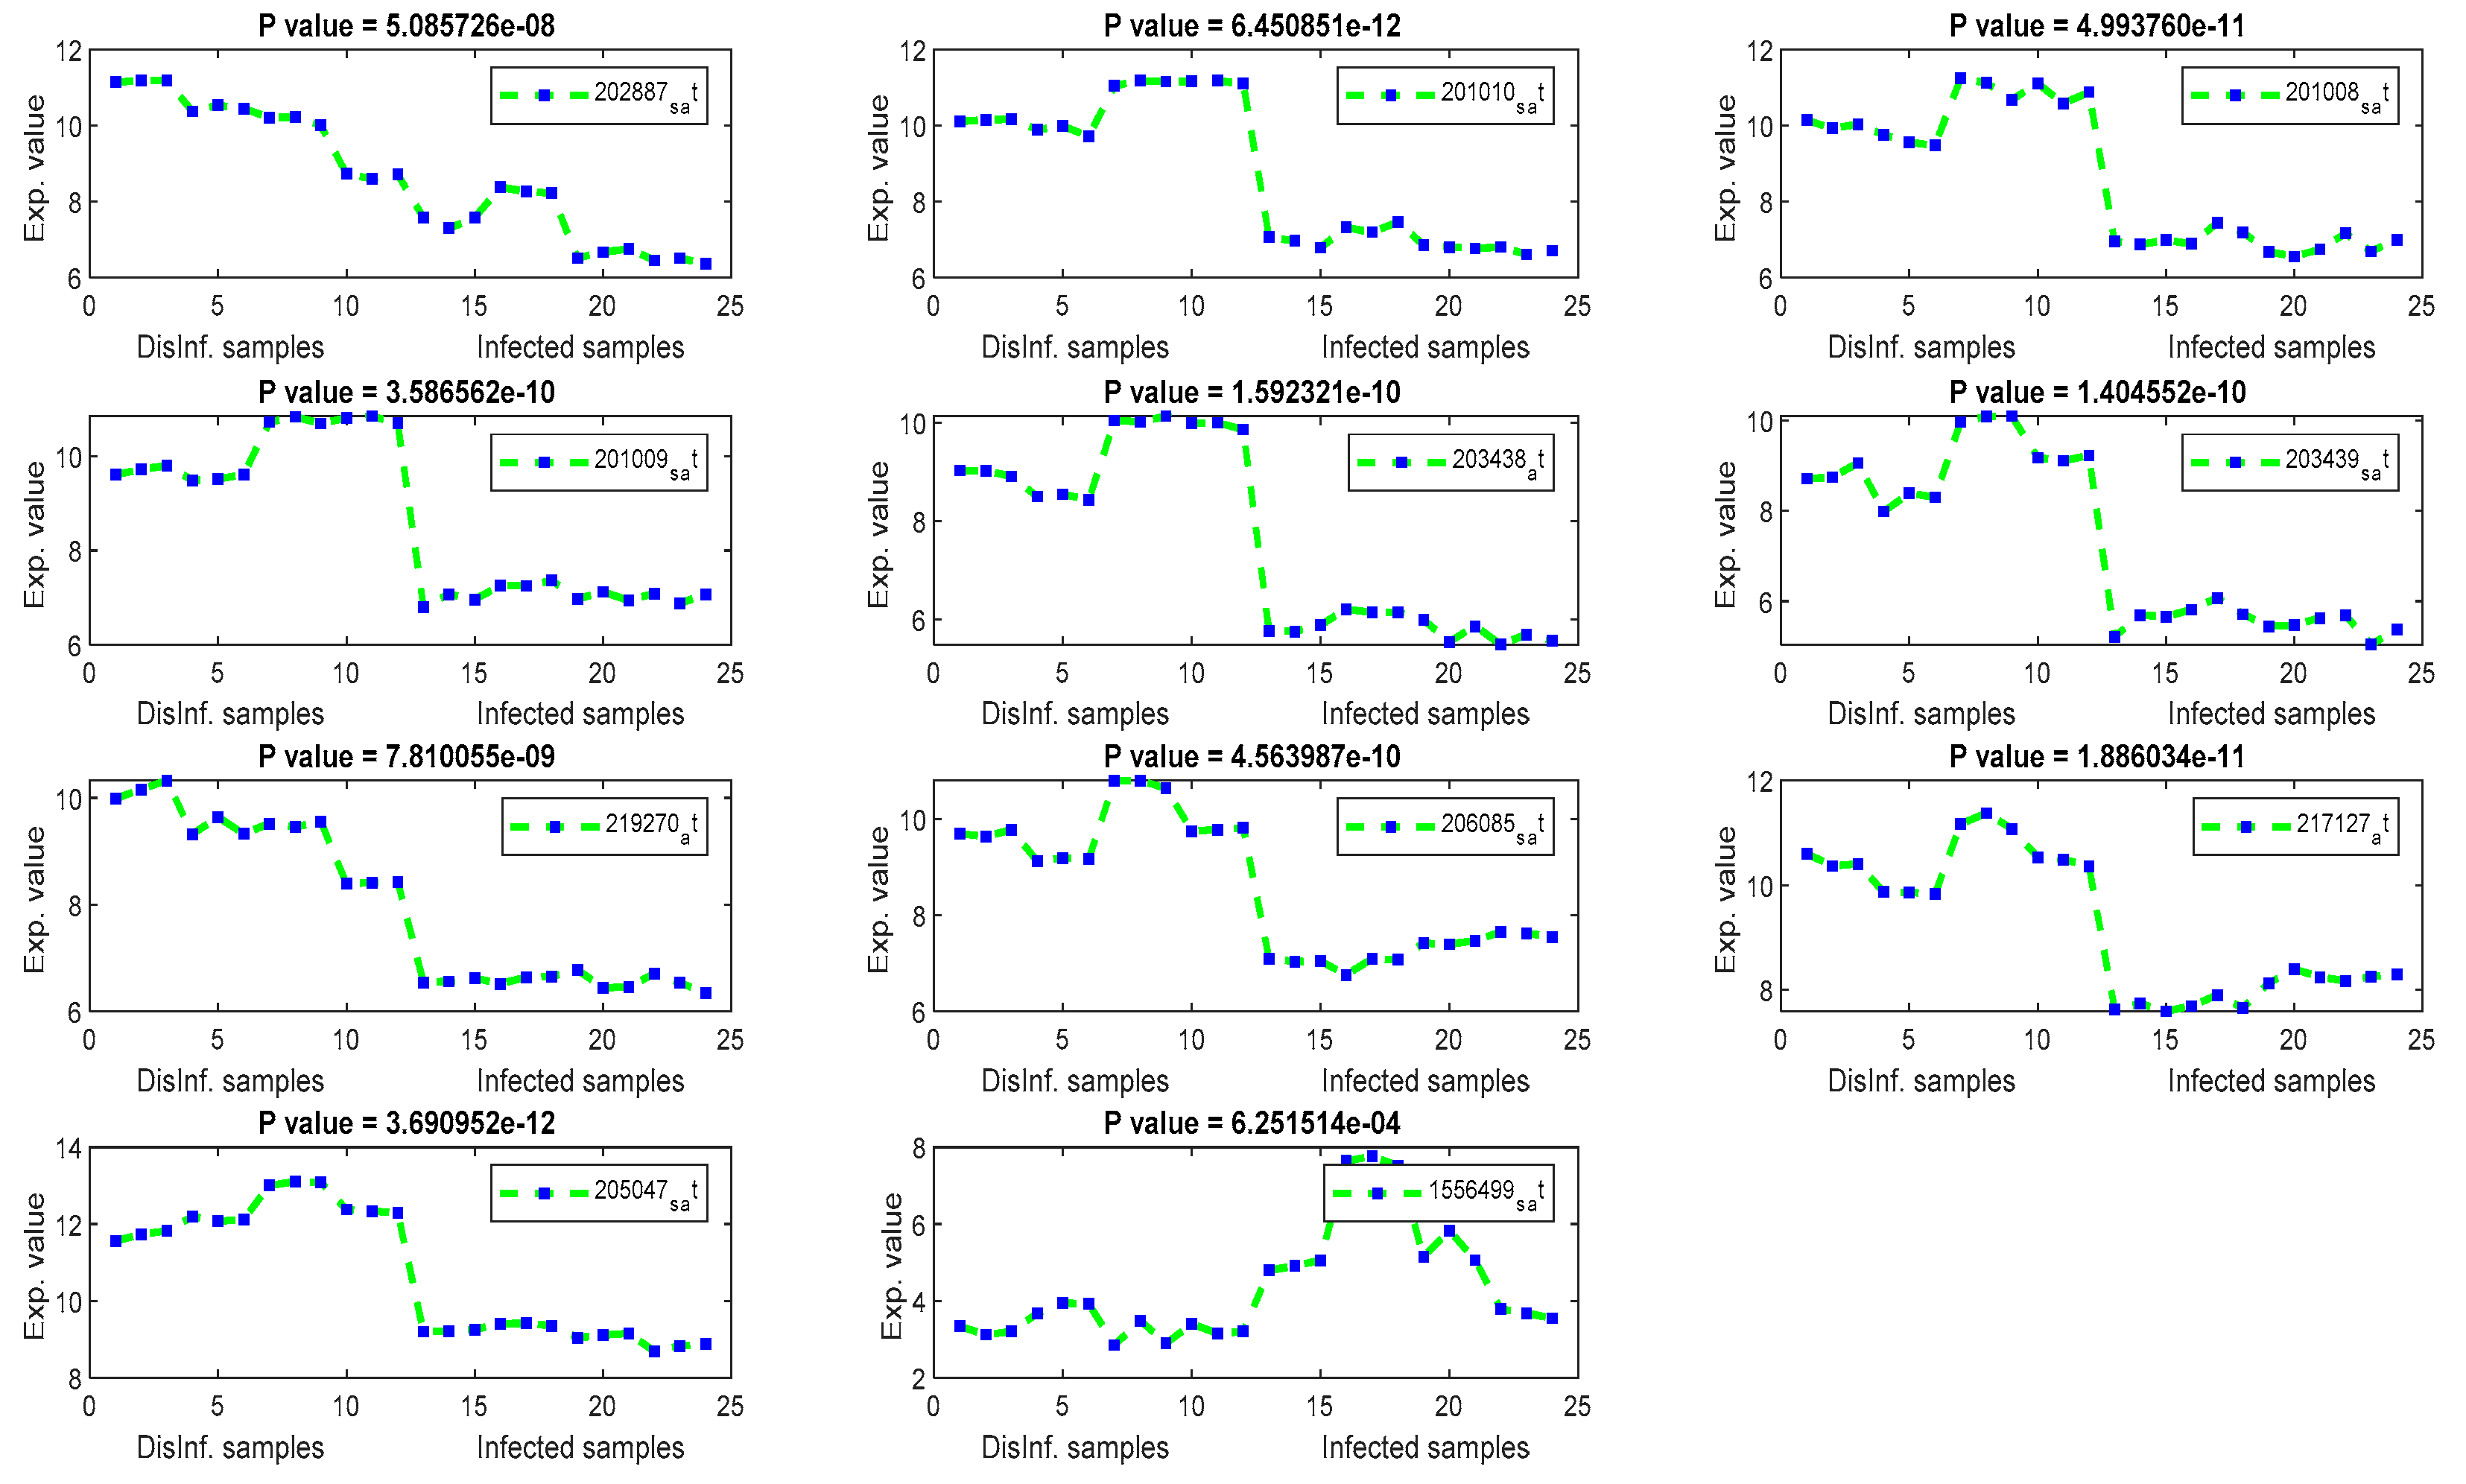
4.2. Signal Profiles and P-Values of Extracted Key Genes
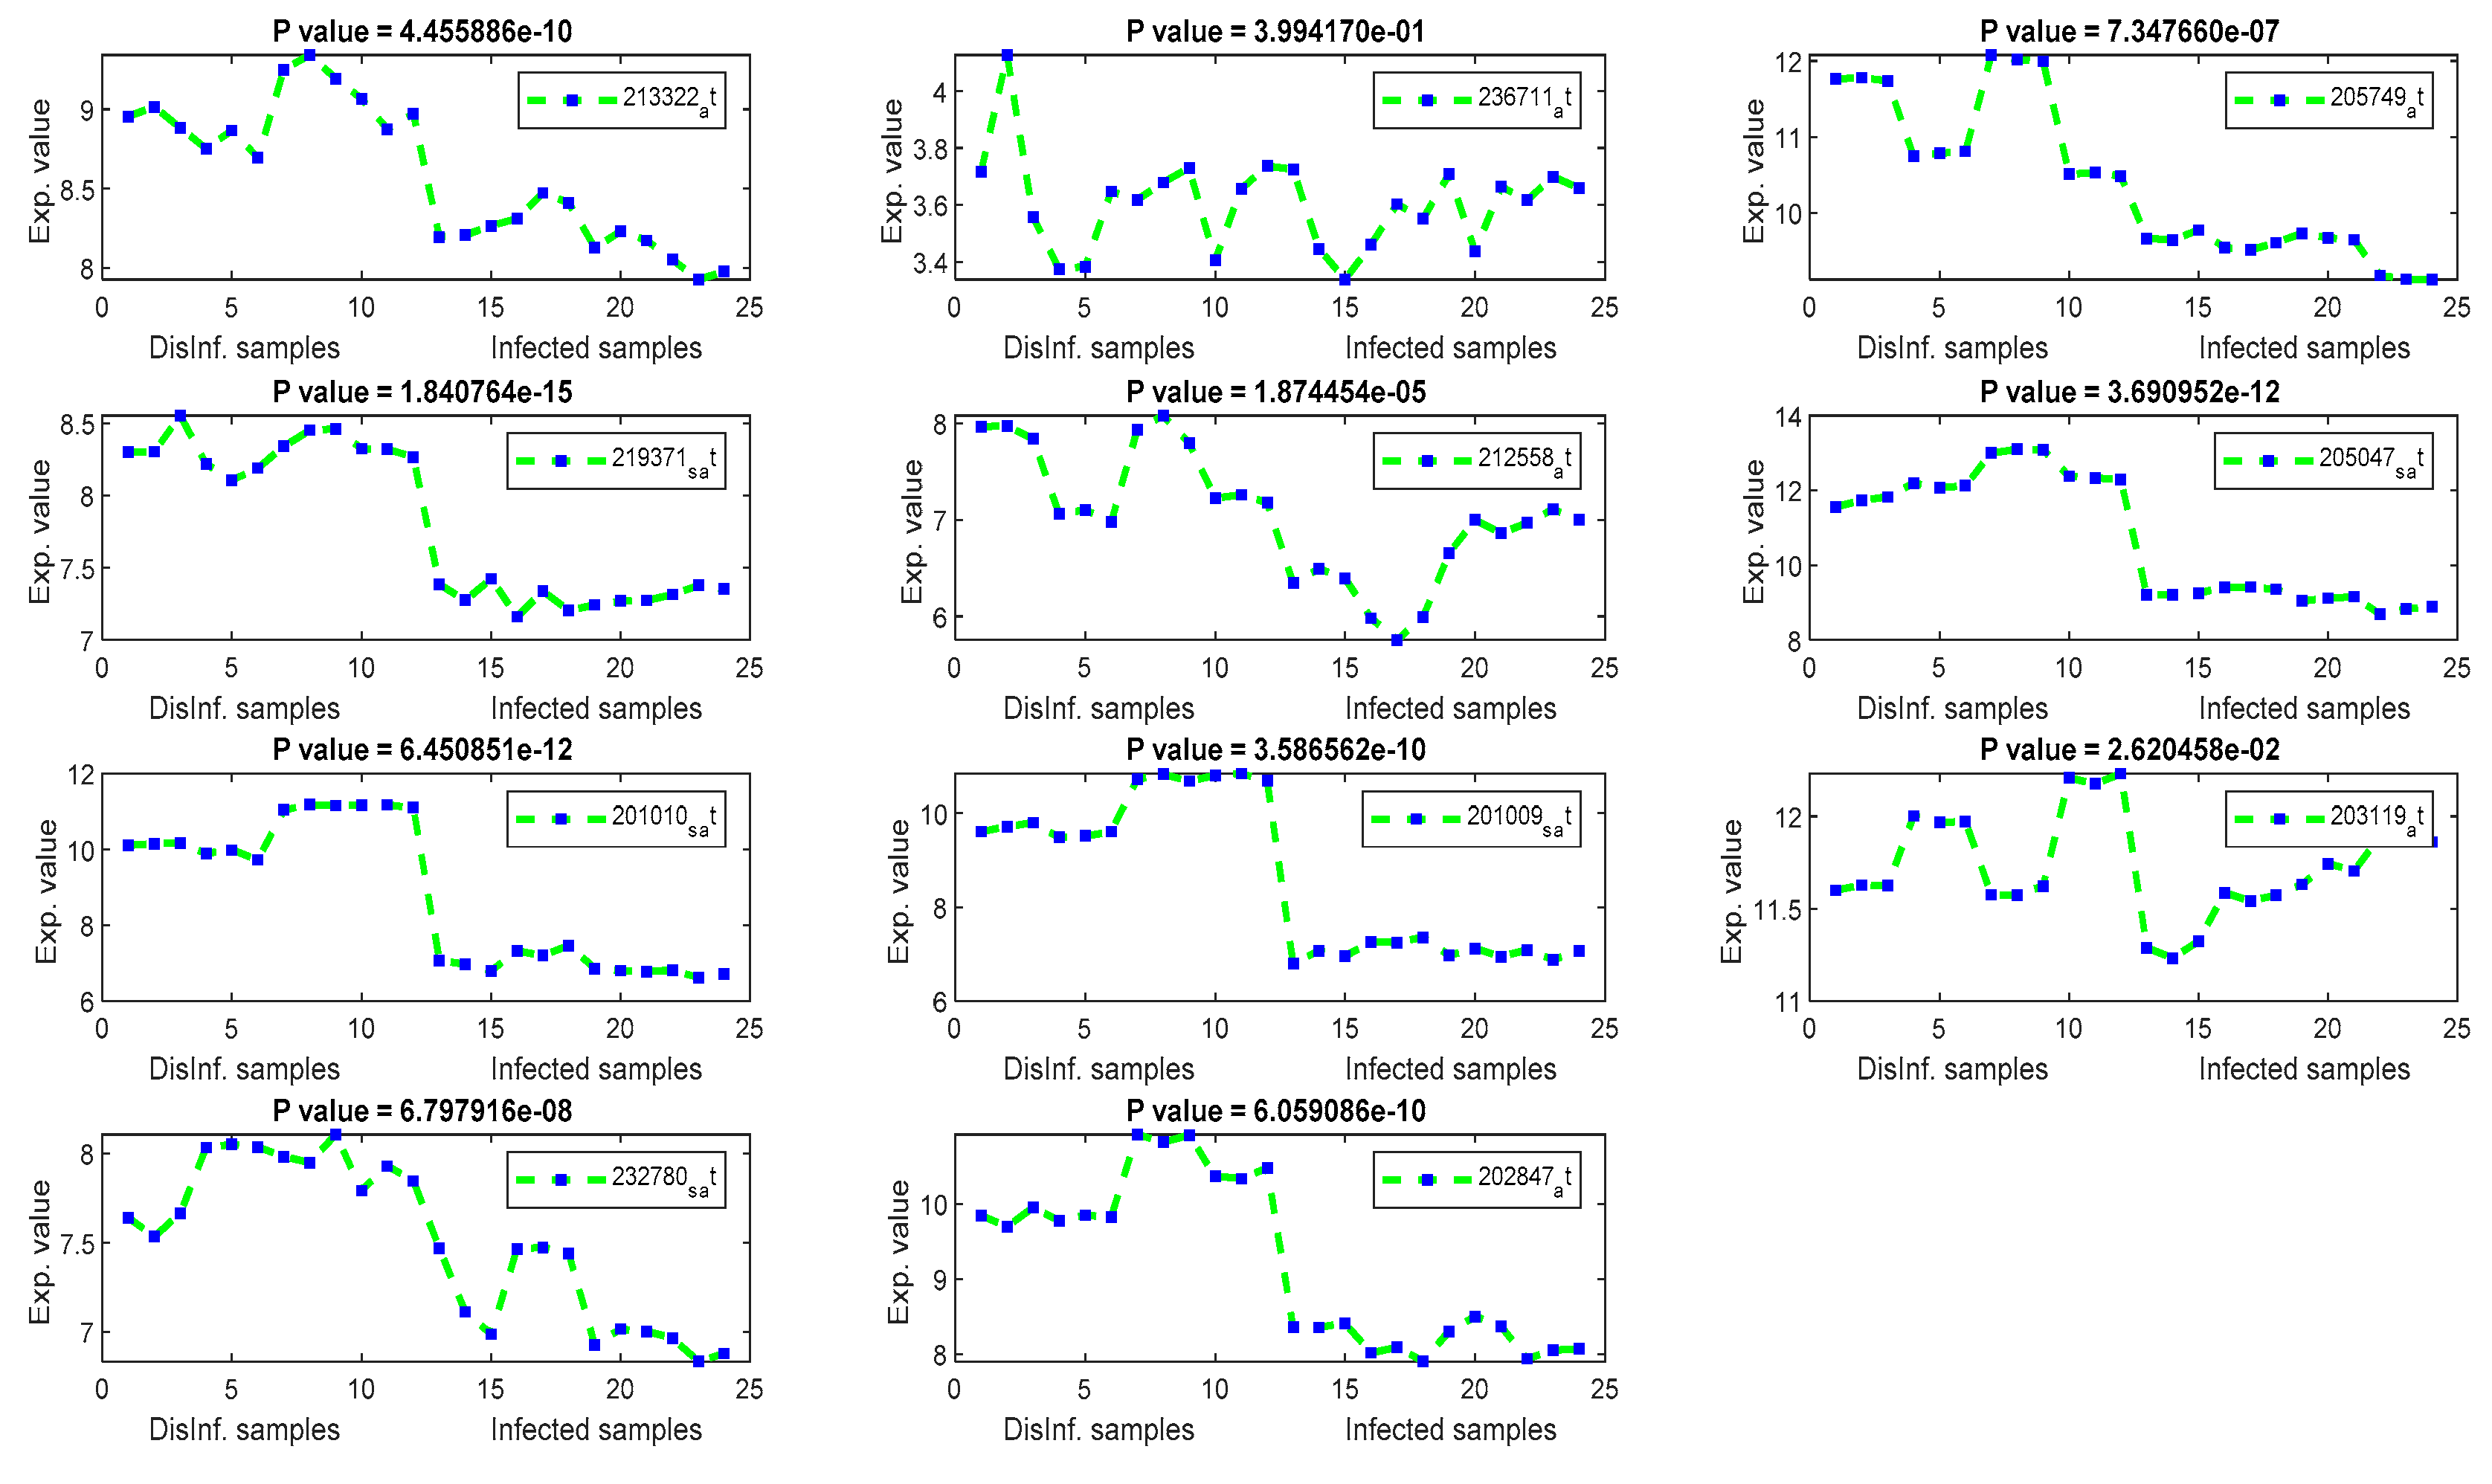
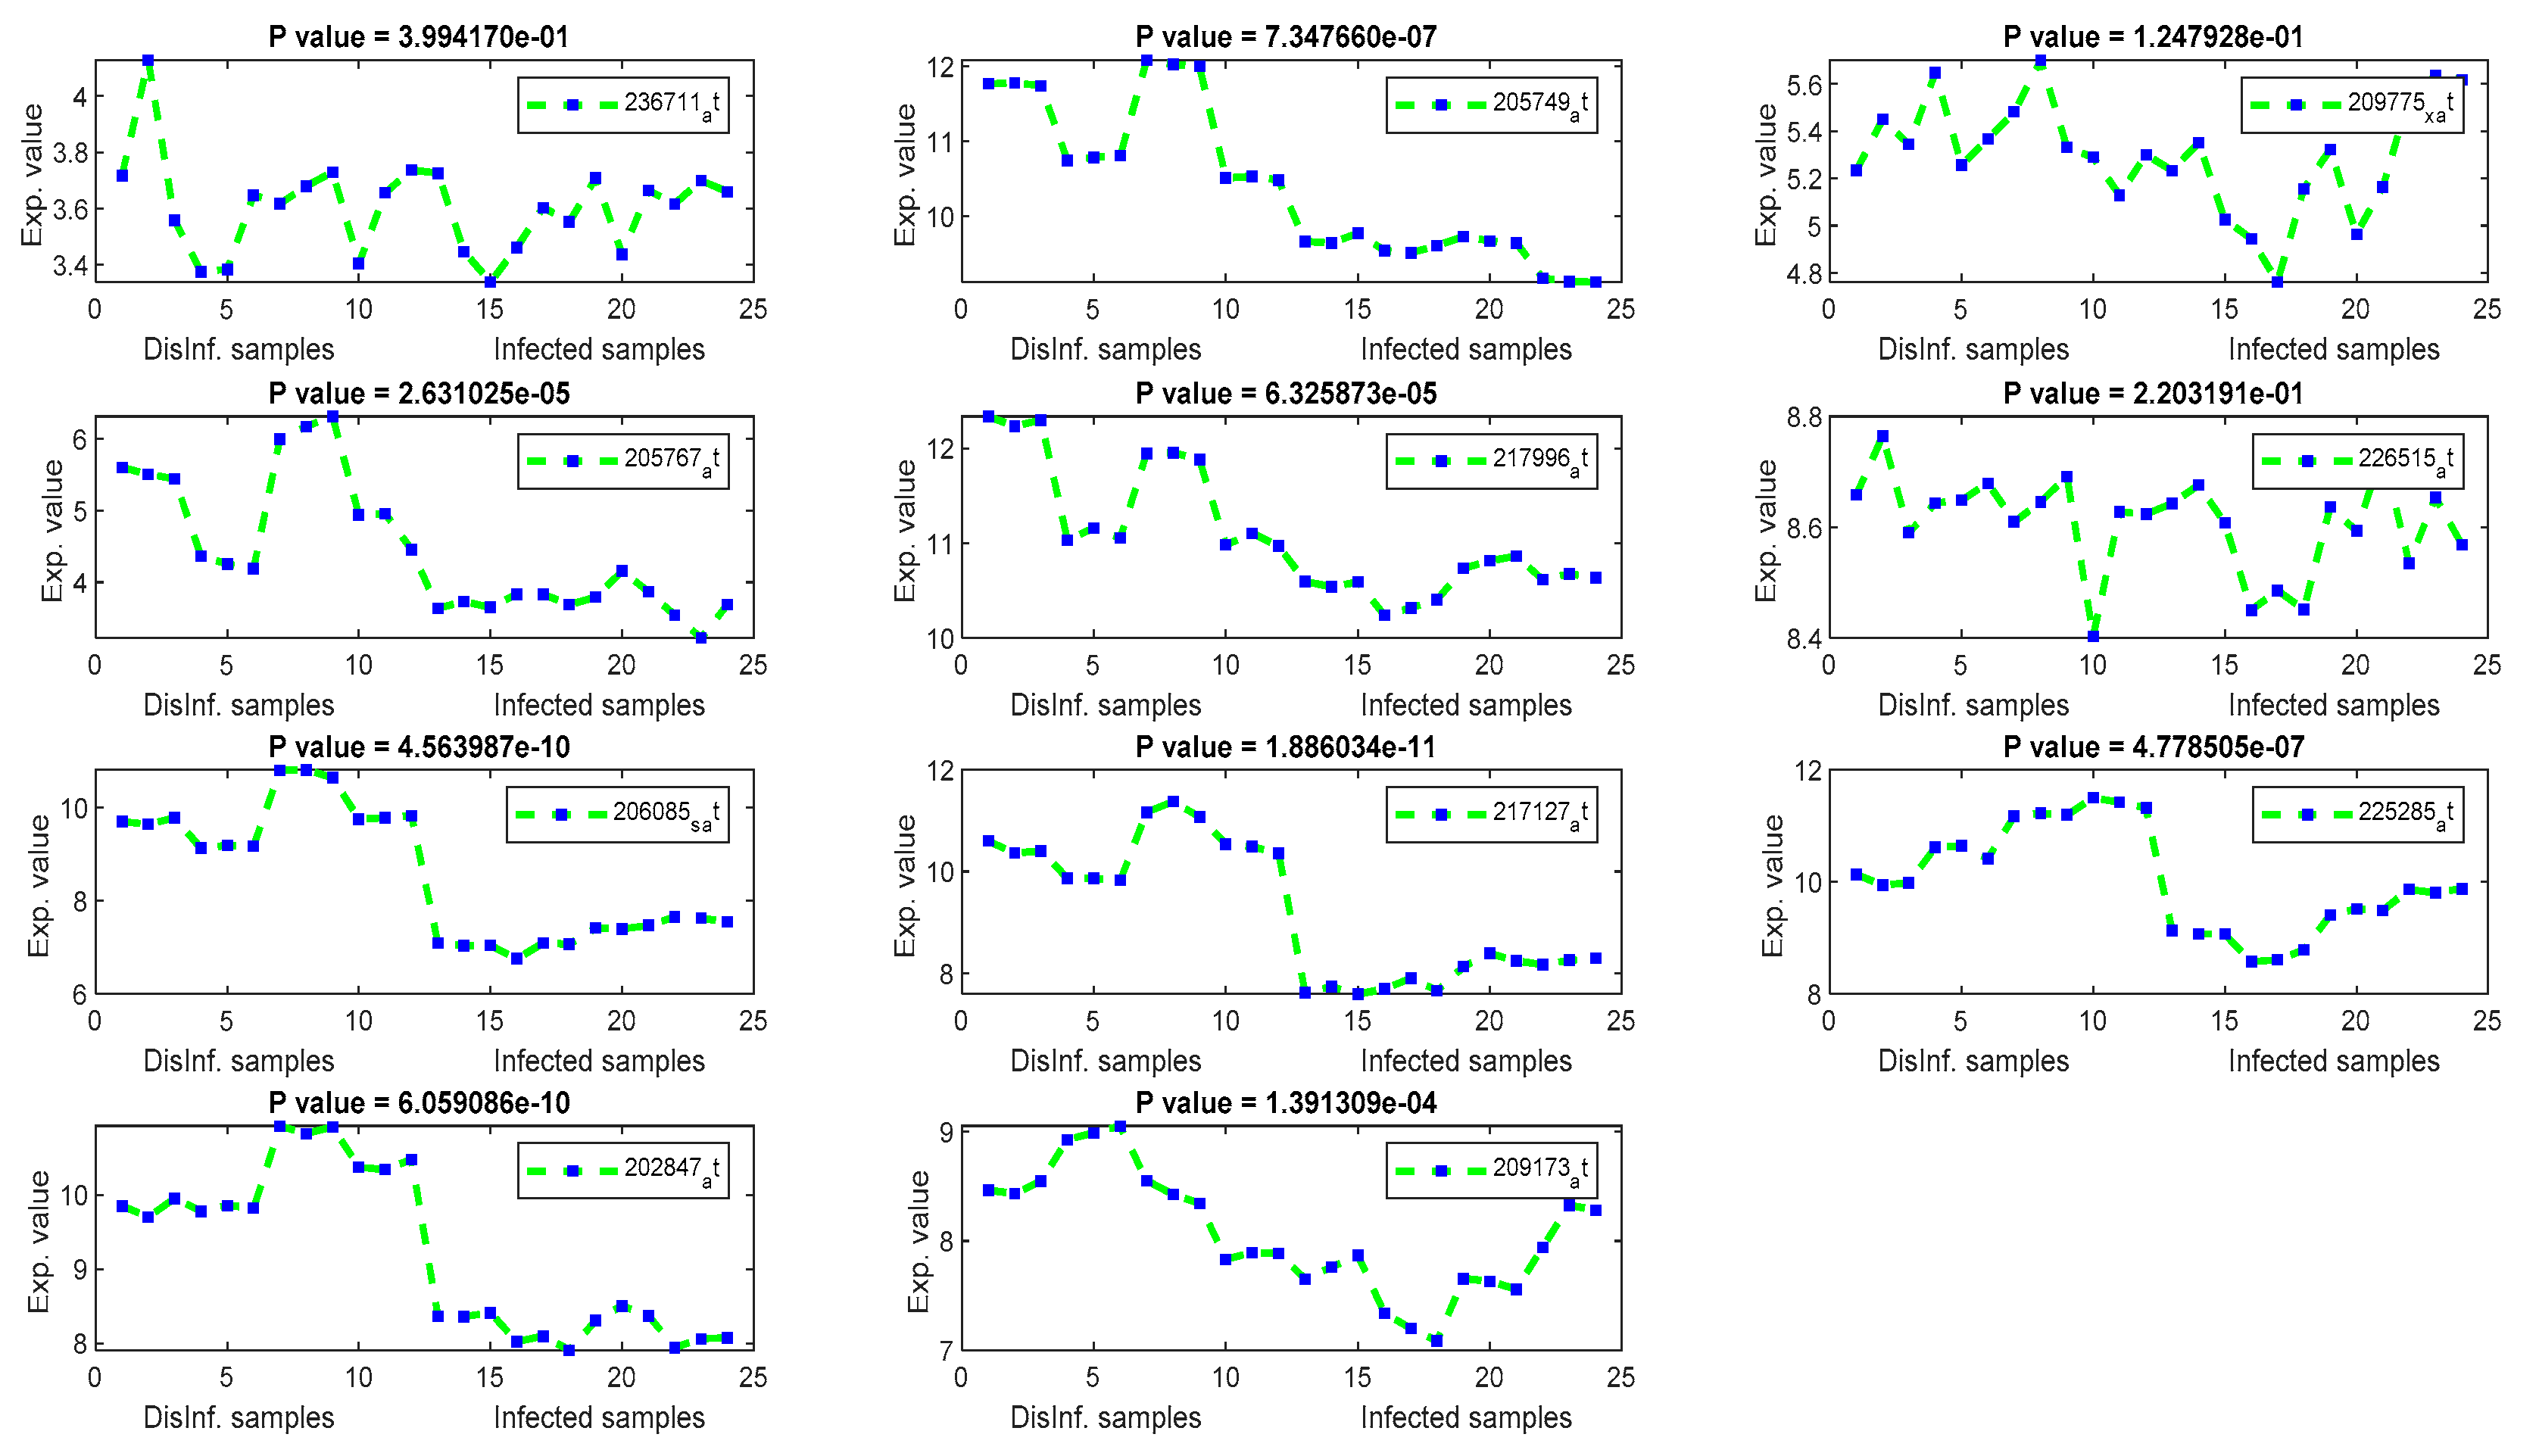
The gene signal profiles of top ranked key genes retrieved using each feature selection method are shown in Figure 4, Figure 5, Figure 6 and Figure 7. Each gene signal is plotted in HCV-infected and disinfected samples and its P-value is attached along with its Affy ID. The signal profile illustrates the up/downregulated genes. Each figure represents the plot of the gene expression value in the disinfected and infected samples. The x axis represents the samples, 12 samples for the disinfected samples and 12 for the infected one. The Y axis represents the gene expression value.
4.3. Discussing the Relevance of Extracted Key Genes Based on Their Biological Examination and Signal Profiles
The significance of those genes listed above, and their contributions in cellular functions and malignancies that may happen as risky outcomes of HCV, are discussed here in this section. An identical list was retrieved using T-test and F-test. It can be inferred that there is a major distinction between the two means of normal and infected samples. Additionally, the whole values of gene expression in infected samples are considerably completely different than the mean of gene expression value in disinfected samples. This is often a validation of the importance of the retrieved genes as key genes for the risky outcomes of HCV. TXNIP, a Thioredoxin interacting protein, has been detected as a downregulated gene, as shown in Figure 4, in all periods of post-infection (12, 18, 24, and 48 h) using T-test and F-test. TXNIP is known as a vitamin D3 protein and convoluted in a varied range of cellular developments, as well as apoptosis, proliferation, lipid and glucose metabolism, and may additionally be concerned within the metastasis of a range of tumors [36]. Stanniocalcin 2 (STC2) has been detected as a downregulated gene in three periods of post-infection. The encoded protein of STC2 is significant in the regulation of renal and intestinal calcium. Variations in the expression of STC2 may contribute to the appearance of breast cancers, Colorectecal cancer, and HCC, as discussed in [37]. Asparagine synthetase(ASNS) and DNA-damaged inducible transcript 4 (DDIT4) have been detected as downregulated in all studied periods of post-infection with HCV. The ASNS gene is extremely regulated in stress, liver development, and HepG2 human hepatocellular carcinoma [38]. DDIT4 has been detected as a downregulated gene, and it encodes a protein that is well known as a biomarker for the prognosis of different types of cancer including liver cancer [39]. In addition, DDIT4 is associated with the TP53 pathway, which is a significant pathway for HCC according to the biological literature [39]. INHBE, inhibin subunit beta E, is detected as a downregulated gene after 24, and 48 h of post-infection. This gene is regulated in cell proliferation, immune response, apoptosis, and hormone secretion [40]. Cystathionine gamma-lyase, CTH, has been detected as downregulated. CTH encodes an enzyme in the cellular processes of liver and kidney and it is a prognostic biomarker for bladder cancer [41]. CHAC1 has only been detected in the first and second periods of post-infection. CHAC1 encodes a protein in the ATF4 signaling. However, these genes are recommended as novel key genes in the replication cycle of HCV, as they have not been addressed before in the literature for HCV, liver cirrhosis, and HCC. COL1A1 has been detected as upregulated after 12 h of post-infection. COL1A1 has been reported recently as a highly up-regulated biomarker in HCC cancer tissues. COLIA1 can suppress the clonogenicity of HCC cells and help in the early survival of the HCC and play a great role in the target therapy of HCC [42].
The univariate methods, Pearson correlation, cosine coefficient, and Euclidean distance, have also yielded a similar list of key genes. KLF2 is the most significant key gene that has been detected using these methods. Its signal profile was as a downregulated gene in the infected tissues. The protein expression of KLF2 was enlarged in HCC cells [43] ASNS, TXNIP, and PCK2 have been detected downregulated also, with significant p values, according to Figure 5. The PCK2 gene has been reported as a downregulated gene in primary HCC and a forced expression of PCK2 was suppressed the HCC tumorigenesis in an experiment on mice [44]. OARD1, SPRY1, and ZNF691 are downregulated detected genes. The role of OARD1 has been investigated in [45]. SPRY1 is related to the Sprouty Protien and has been investigated in [46]. They revealed that its expression is overexpressed in HCC. The role of ZNF691 gene in the HCC tumorigenesis has not been investigated yet. CYP1A1, from cytochrome P450 family 1, has been detected as downregulated in the first period of post-infection. A study on the contribution of CYP1A1 in the risky outcomes of an HCV-infected patient was done in [47]. They investigated the impact of polymorphisms of the CYP family of genes on the progression of liver diseases. Their study showed that Polymorphic modifications of CYP family genes could result in the development of liver infection and occurrence of HCC risk. MAFF and CCDC86 were insignificant according to their P values, shown in Figure 5. MAFF has been detected in the first and second periods of post-infection. MAFF regulates a diversity of goal genes, including genes responsible for platelet production and genes responsible for antioxidant/xenobiotic enzyme. MAFF has been conveyed in the regulation of the oxytocin gene. However, the involvement of MAFF within the regulation of genes and proteins significant for HCV and HCC has not been inspected to date [48]. CCDC86 has a contribution in the formation of HCV [49].
By using the Euclidean distance gene selection method, a lower number of significant genes were retrieved, according to P values, as shown in Figure 6. CYP1A1, MAFF, and PCK2 genes have been retrieved. CTH, BCAT1, EREG, PHLDA1, and AGR2 have been retrieved as downregulated genes with significant P values. CTH has been differentially expressed in normal and tumor HCC tissues [50]. BCAT1 has a highly significant expression in HCC samples compared to normal samples, as stated in [51], EREG has contributed in the hepatocarcinogenesis, as testified in [52], PHLDA1 has been detected as a novel biomarker of HCC, as it expressed differentially in the experiment done in [53], and AGR2 has high expression values in metastatic hepatocellular carcinoma samples, as found in [54]. Other retrieved genes, including SLC19A1, CCDC127, and MAFF, were unexpressed differentially according to their P values.
Using PCA, several HCC biomarkers (EEF1A1, ATP6, and FTL) have been detected in the four periods of post-infection with C virus, as shown in Table 4. EEF1A1 is a well-known HCC biomarker and is considered one of the top 20 genes related to human hepatocarcinoma cell lines. EEF1A1 has been reported as a novel prognosis biomarkers for liver cancer using a multivariate analysis done in [55]. In our experiment, EEF1A1 was retrieved as a down-regulated gene with a significant p value, as illustrated by Figure 7. However, ATP6, and FTL were unexpressed, with p values > 0.005. RPS2 was downregulated with a significant p value. RPS2 was founded in [56] as a significant key gene for HCC. ACTB gene has been detected as upregulated with a significant p values. ACTB was expressed differentially in the study done in [57]. Although the other retrieved genes were related to liver diseases (HCV, and HCC) in the biological literature [58,59,60], including COX1, COX2, KRT18, PPIA, UBC, and MTND4, they were unexpressed in this study.
4.4. Examining the Relevance of Extracted Key Gens Using Conventional Classification & Data Augmentation
The key genes expression matrix has been augmented using the sparse autoencoder to generate more samples, as we have an insufficient number of samples. The augmented data has been applied to the classification of HCV-infected and disinfected samples Each autoencoder consists of an encoder/decoder module with one hidden layer in each module. The training procedure is built on optimizing the cost formula, which calculates the error between the input data X and its regenerated output data, X’, on each iteration. The mean square reconstruction error of autoencoder has been calculated for the generated samples, as illustrated by Table 5. The effectiveness of the generated feature matrices has been investigated by comparing their performance in classifying the HCV-infected and disinfected samples. The following conventional supervised classifiers, including Linear Discriminant Analysis (LDA), Quadratic Discriminant Analysis (QDA), Support Vector Machines (SVM), and K-Nearest Neighbor (KNN), have been extensively tested. In KNN, three values of K have been tested, including 1, 3, and 5. In SVM, three kernel functions have been employed, including linear, polynomial, and the Radial Base Kernel Function (RBF). Two polynomial orders (2, and 3) has been applied for the polynomial kernel function. Standardized and optimized RBF have been employed. All classifiers have been trained using 10-fold cross-validation to prevent over-fitting. During each fold, the learning model has been trained on nine divisions and verified on the 10th. The confusion matrix has been calculated in each fold and a summarized one was used to calculate the accuracy. Table 6 illustrates the classification accuracy for all feature selection methods discussed here. The highest accuracies are highlighted in a grey color. The retrieved key genes using T&F test have yielded the highest classification accuracy, 95.83%, using the QDA classifier. The extracted key genes, using PCA test, have returned a classification accuracy of 93.75% using the QDA classifier. On the other side, the key genes retrieved using PCA, and Euclidean distance have returned a 91.67% classification accuracy using the SVM classifier.
5. Conclusions
In this work, we have used the classical feature selection techniques, univariate method and multivariate methods, to detect up/downregulated genes which have a role in understanding the identification and characterization of the HCV replication cycle. This study has yielded 15 downregulated key genes (TXNIP, STC2, ASNS, DDIT4, CTH, CHAC1, INHBE, KLF2, PCK2, OARD1, SPRY1, ZNF691, CYP1A1, EEF1A1, and RPS2) for studying the outcomes of HCV infection. Only two upregulated key genes (COL1A1, and ACTB) were detected. In addition, a deep neural network approach has been proposed to augment the insufficient number of samples. The augmented data has been employed in a training set of conventional classification algorithms. The classification accuracy can reveal the relevance of the extracted key genes in classifying the HCV-infected and disinfected samples.
Funding
This research was funded by the Deanship of Scientific Research at Princess Nourah bint Abdulrahman University through the Fast-track Research Funding Program.
Conflicts of Interest
The authors declare no conflict of interest.
Appendix A
All data analyzed here in this study has been published in [4]. Twenty four samples were downloaded from NCBI gene expression data repository, Gene expression Omnibus (GEO) [31]. These samples contain fourteen infected samples, Huh7 cells_JFH-1 and the remaining are controlled samples, Huh7 cells_Mock. Extracted RNA was hybridized on Affymetrix microarray chips, Human U133 plus 2.0 at different period of post infection (12, 18, 24, and 48 h). Data samples have GSE20948 as GEO accession number, and were pre-processed using an open source package, Affy, provided by Bioconductor [32].
References
- Tang, J.; Jiang, R.; Deng, L.; Zhang, X.; Wang, K.; Sun, B. Circulation long non-coding RNAs act as biomarkers for predicting tumorigenesis and metastasis in hepatocellular carcinoma. Oncotarget 2015, 6, 4505–4515. [Google Scholar] [CrossRef] [PubMed] [Green Version]
- Bartenschlager, R.; Cosset, F.L.; Lohmann, V. Hepatitis C virus replication cycle. J. Hepatol. 2010, 53, 583–585. [Google Scholar] [PubMed] [Green Version]
- Li, W.-Q.; Park, Y.; McGlynn, K.A.; Hollenbeck, A.R.; Taylor, P.R.; Goldstein, A.M.; Freedman, N.D. Index-based dietary patterns and risk of incident hepatocellular carcinoma and mortality from chronic liver disease in a prospective study. Hepatology 2014, 60, 588–597. [Google Scholar] [CrossRef] [PubMed] [Green Version]
- Blackham, S.; Baillie, A.; Al-Hababi, F.; Remlinger, K.; You, S.; Hamatake, R.; McGarvey, M.J. Gene expression profiling indicates the roles of host oxidative stress, apoptosis, lipid metabolism, and intracellular transport genes in the replication of hepatitis C virus. J. Virol. 2010, 84, 5404–5414. [Google Scholar] [CrossRef] [Green Version]
- Schena, M.; Shalon, D.; Davis, R.W.; Brown, P.O. Quantitative monitoring of gene expression patterns with a complementary DNA microarray. Science 1995, 270, 467–470. [Google Scholar]
- Wang, X.; Simon, R. Microarray-based cancer prediction using single genes. BMC Bioinform. 2011, 12, 391. [Google Scholar] [CrossRef] [Green Version]
- Yoo, C.; Ramirez, L.; Liuzzi, J. Big data analysis using modern statistical and machine learning methods in medicine. Int. Neurourol. J. 2014, 18, 50–57. [Google Scholar]
- Sui, S.; Wang, X.; Zheng, H.; Guo, H.; Chen, T.; Ji, D.-M. Gene set enrichment and topological analyses based on interaction networks in pediatric acute lymphoblastic leukemia. Oncol. Lett. 2015, 10, 3354–3362. [Google Scholar] [CrossRef] [Green Version]
- Urda, D.; Luque-Baena, R.M.; Franco, L.; Jerez, J.M.; Sanchez-Marono, N. Machine learning models to search relevant genetic signatures in clinical context. In Proceedings of the International Joint Conference on Neural Networks, Anchorage, AK, USA, 14–19 May 2017; pp. 1649–1656. [Google Scholar]
- Yao, F.; Coquery, J.; Lê Cao, K.A. Independent Principal Component Analysis for biologically meaningful dimension reduction of large biological data sets. BMC Bioinform. 2012, 13, 24. [Google Scholar] [CrossRef] [Green Version]
- Bellinger, C.; Japkowicz, N.; Drummond, C. Synthetic oversampling for advanced radioactive threat detection. In Proceedings of the 2015 IEEE 14th International Conference on Machine Learning and Applications, ICMLA 2015, Miami, FL, USA, 9–11 December 2016; pp. 948–953. [Google Scholar]
- Bellinger, C.; Drummond, C.; Japkowicz, N. Manifold-based synthetic oversampling with manifold conformance estimation. Mach. Learn. 2018, 107, 605–637. [Google Scholar] [CrossRef] [Green Version]
- Li, Z.; Xie, W.; Liu, T. Efficient feature selection and classification for microarray data. PLoS ONE 2018, 13, e0202167. [Google Scholar] [CrossRef] [PubMed]
- Yue, Y.; Li, Y.; Yi, K.; Wu, Z. Synthetic Data Approach for Classification and Regression. In Proceedings of the International Conference on Application-Specific Systems, Architectures and Processors, Milan, Italy, 10–12 July 2018. [Google Scholar]
- Lyu, B.; Haque, A. Deep Learning Based Tumor Type Classification Using Gene Expression Data. In Proceedings of the 2018 ACM International Conference on Bioinformatics, Computational Biology, and Health Informatics; Association for Computing Machinery: New York, NY, USA, 28 November 2018; pp. 89–96. [Google Scholar]
- Wang, S.; Minku, L.L.; Yao, X. A Systematic Study of Online Class Imbalance Learning with Concept Drift. IEEE Trans. Neural Networks Learn. Syst. 2018, 29, 4802–4821. [Google Scholar] [CrossRef] [PubMed]
- Xie, R.; Wen, J.; Quitadamo, A.; Cheng, J.; Shi, X. A deep auto-encoder model for gene expression prediction. BMC Genom. 2017, 18, 845. [Google Scholar] [CrossRef] [PubMed] [Green Version]
- Ca, P.V.; Edu, L.T.; Lajoie, I.; Ca, Y.B.; Ca, P.-A.M. Stacked Denoising Autoencoders: Learning Useful Representations in a Deep Network with a Local Denoising Criterion Pascal Vincent Hugo Larochelle Yoshua Bengio Pierre-Antoine Manzagol. J. Mach. Learn. Res. 2010, 11, 3371–3408. [Google Scholar]
- Hsieh, C.B.; Chen, T.W.; Chu, C.M.; Chu, H.C.; Yu, C.P.; Chung, K.P. Is inconsistency of α-fetoprotein level a good prognosticator for hepatocellular carcinoma recurrence? World J. Gastroenterol. 2010, 16, 3049–3055. [Google Scholar] [CrossRef]
- Di Carlo, I.; Mannino, M.; Toro, A.; Ardiri, A.; Galia, A.; Cappello, G.; Bertino, G. Persistent increase in alpha-fetoprotein level in a patient without underlying liver disease who underwent curative resection of hepatocellular carcinoma. A case report and review of the literature. World J. Surg. Oncol. 2012, 10, 79. [Google Scholar] [CrossRef] [Green Version]
- You, Z.; Wang, S.; Gui, J.; Zhang, S. A novel hybrid method of gene selection and its application on tumor classification. In Advanced Intelligent Computing Theories and Applications. With Aspects of Artificial Intelligence; Huang, D.S., Wunsch, D.C., Levine, D.S., Jo, K.H., Eds.; Springer: Berlin, Germany, 2008; Volume 5227, pp. 1055–1068. [Google Scholar]
- Advances in Kernel Methods-Support Vector Learning. Available online: https://www.researchgate.net/publication/2346087_Advances_in_Kernel_Methods_-_Support_Vector_Learning (accessed on 10 October 2019).
- Park, T.; Casella, G. The Bayesian Lasso. J. Am. Stat. Assoc. 2008, 103, 681–686. [Google Scholar] [CrossRef]
- Meier, L.; Van De Geer, S.; Bühlmann, P. The Group Lasso for Logistic Regression. J. R. Stat. Soc. Ser. B 2008, 70, 53–71. [Google Scholar] [CrossRef] [Green Version]
- Reverter, F.; Vegas, E.; Sánchez, P. Mining Gene Expression Profiles: An Integrated Implementation of Kernel Principal Component Analysis and Singular Value Decomposition. Genom. Proteom. Bioinforma. 2010, 8, 200–210. [Google Scholar] [CrossRef] [Green Version]
- SchölkopfSch, B.; Smola, A.; Müller, K.R. Nonlinear Component Analysis as a Kernel Eigenvalue Problem. Neural Comput. 1998, 10, 1299–1319. [Google Scholar]
- Park, M.; Lee, J.W.; Bok Lee, J.; Heun Song, S. Several biplot methods applied to gene expression data. J. Stat. Plan. Inference 2008, 138, 500–515. [Google Scholar] [CrossRef]
- Nilashi, M.; Ahmadi, H.; Shahmoradi, L.; Ibrahim, O.; Akbari, E. A predictive method for hepatitis disease diagnosis using ensembles of neuro-fuzzy technique. J. Infect. Public Health 2019, 12, 13–20. [Google Scholar] [CrossRef] [PubMed]
- Yang, L.; Xu, Q.; Xie, H.; Gu, G.; Jiang, J. Expression of serum miR-218 in hepatocellular carcinoma and its prognostic significance. Clin. Transl. Oncol. 2016, 18, 841–847. [Google Scholar] [CrossRef] [PubMed]
- Abdel Samee, N.M.; Solouma, N.H.; Kadah, Y.M. Detection of biomarkers for Hepatocellular Carcinoma using a hybrid univariate gene selection methods. Theor. Biol. Med. Model. 2012, 9, 24. [Google Scholar] [CrossRef] [PubMed] [Green Version]
- Edgar, R.; Domrachev, M.; Lash, A.E. Gene Expression Omnibus: NCBI gene expression and hybridization array data repository. Nucleic Acids Res. 2002, 30, 207–210. [Google Scholar] [CrossRef] [PubMed] [Green Version]
- Markopoulos, P.P.; Kundu, S.; Chamadia, S.; Pados, D.A. Efficient L1-Norm Principal-Component Analysis via Bit Flipping. IEEE Trans. Signal Process. 2017, 65, 4251–4264. [Google Scholar] [CrossRef]
- Lê, S.; Josse, J.; Husson, F. FactoMineR: An R package for multivariate analysis. J. Stat. Softw. 2008, 25, 1–18. [Google Scholar] [CrossRef] [Green Version]
- Factoextra: Extract and Visualize the Results of Multivariate Data Analyses Version 1.0.5 from CRAN. Available online: https://rdrr.io/cran/factoextra/ (accessed on 11 October 2019).
- Maglott, D.; Ostell, J.; Pruitt, K.D.; Tatusova, T. Entrez Gene: Gene-centered information at NCBI. Nucleic Acids Res. 2005, 33, D54–D58. [Google Scholar] [CrossRef]
- Masaki, S.; Masutani, H.; Yoshihara, E.; Yodoi, J. Deficiency of thioredoxin binding protein-2 (TBP-2) enhances TGF-β signaling and promotes epithelial to mesenchymal transition. PLoS ONE 2012, 7, e39900. [Google Scholar] [CrossRef]
- Wu, F.; Li, T.-Y.; Su, S.-C.; Yu, J.-S.; Zhang, H.-L.; Tan, G.-Q.; Liu, J.-W.; Wang, B.-L. STC2 as a novel mediator for Mus81-dependent proliferation and survival in hepatocellular carcinoma. Cancer Lett. 2017, 388, 177–186. [Google Scholar] [CrossRef]
- Balasubramanian, M.N.; Butterworth, E.A.; Kilberg, M.S. Asparagine synthetase: Regulation by cell stress and involvement in tumor biology. Am. J. Physiol. Endocrinol. Metab. 2013, 304, E789–E799. [Google Scholar] [CrossRef] [PubMed] [Green Version]
- Pinto, J.A.; Rolfo, C.; Raez, L.E.; Prado, A.; Araujo, J.M.; Bravo, L.; Fajardo, W.; Morante, Z.D.; Aguilar, A.; Neciosup, S.P.; et al. In silico evaluation of DNA Damage Inducible Transcript 4 gene (DDIT4) as prognostic biomarker in several malignancies. Sci. Rep. 2017, 7, 1526. [Google Scholar] [CrossRef] [PubMed]
- Fagerberg, L.; Hallstrom, B.M.; Oksvold, P.; Kampf, C.; Djureinovic, D.; Odeberg, J.; Habuka, M.; Tahmasebpoor, S.; Danielsson, A.; Edlund, K.; et al. Analysis of the human tissue-specific expression by genome-wide integration of transcriptomics and antibody-based proteomics. Mol. Cell. Proteom. 2014, 13, 397–406. [Google Scholar] [CrossRef] [PubMed] [Green Version]
- Ji, Y.; Bowersock, A.; Badour, A.R.; Vij, N.; Juris, S.J.; Ash, D.E.; Mohanty, D.K. Dichotomous effects of isomeric secondary amines containing an aromatic nitrile and nitro group on human aortic smooth muscle cells via inhibition of cystathionine-γ-lyase. Biochimie 2017, 133, 103–111. [Google Scholar] [CrossRef] [Green Version]
- Ma, H.-P.; Chang, H.-L.; Bamodu, O.A.; Yadav, V.K.; Huang, T.-Y.; Wu, A.T.H.; Yeh, C.-T.; Tsai, S.-H.; Lee, W.-H. Collagen 1A1 (COL1A1) Is a Reliable Biomarker and Putative Therapeutic Target for Hepatocellular Carcinogenesis and Metastasis. Cancers 2019, 11, 786. [Google Scholar] [CrossRef] [Green Version]
- Zou, K.; Lu, X.; Ye, K.; Wang, C.; You, T.; Chen, J. Krüppel-like factor 2 promotes cell proliferation in hepatocellular carcinoma through up-regulation of c-myc. Cancer Biol. Ther. 2016, 17, 20–26. [Google Scholar] [CrossRef] [Green Version]
- Liu, M.-X.; Jin, L.; Sun, S.-J.; Liu, P.; Feng, X.; Cheng, Z.-L.; Liu, W.-R.; Guan, K.-L.; Shi, Y.-H.; Yuan, H.-X.; et al. Metabolic reprogramming by PCK1 promotes TCA cataplerosis, oxidative stress and apoptosis in liver cancer cells and suppresses hepatocellular carcinoma. Oncogene 2018, 37, 1637–1653. [Google Scholar] [CrossRef]
- Forst, A.H.; Karlberg, T.; Herzog, N.; Thorsell, A.; Feijs, K.; Verheugd, P.; Kursula, P.; Nijmeijer, B.; Lippok, B.; Kleine, H.; et al. Recognition of mono-ADP-ribosylated ARTD10 substrates by ARTD8 macrodomains. Structure 2013, 21, 462–475. [Google Scholar] [CrossRef] [Green Version]
- Sirivatanauksorn, Y.; Sirivatanauksorn, V.; Srisawat, C.; Khongmanee, A.; Tongkham, C. Differential expression of sprouty genes in hepatocellular carcinoma. J. Surg. Oncol. 2012, 105, 273–276. [Google Scholar] [CrossRef]
- Fu, P.; Yang, F.; Li, B.; Zhang, B.; Guan, L.; Sheng, J.; Ye, Y.; Wang, Z.; Li, P.; Xu, L.; et al. Meta-analysis of CYP2E1 polymorphisms in liver carcinogenesis. Dig. Liver Dis. 2017, 49, 77–83. [Google Scholar] [CrossRef]
- Katsuoka, F.; Motohashi, H.; Ishii, T.; Aburatani, H.; Engel, J.D.; Yamamoto, M. Genetic evidence that small maf proteins are essential for the activation of antioxidant response element-dependent genes. Mol. Cell. Biol. 2005, 25, 8044–8051. [Google Scholar] [CrossRef] [PubMed] [Green Version]
- Fénéant, L.; Levy, S.; Cocquerel, L. CD81 and hepatitis C virus (HCV) infection. Viruses 2014, 6, 535–572. [Google Scholar] [CrossRef] [PubMed] [Green Version]
- Shao, P.; Sun, D.; Wang, L.; Fan, R.; Gao, Z. Deep sequencing and comprehensive expression analysis identifies several molecules potentially related to human poorly differentiated hepatocellular carcinoma. FEBS Open Bio 2017, 7, 1696–1706. [Google Scholar] [CrossRef] [PubMed]
- Xu, M.; Liu, Q.; Jia, Y.; Tu, K.; Yao, Y.; Liu, Q.; Guo, C. BCAT1 promotes tumor cell migration and invasion in hepatocellular carcinoma. Oncol. Lett. 2016, 12, 2648–2656. [Google Scholar] [CrossRef] [Green Version]
- Dapito, D.H.; Mencin, A.; Gwak, G.Y.; Pradere, J.P.; Jang, M.K.; Mederacke, I.; Caviglia, J.M.; Khiabanian, H.; Adeyemi, A.; Bataller, R.; et al. Promotion of Hepatocellular Carcinoma by the Intestinal Microbiota and TLR4. Cancer Cell 2012, 21, 504–516. [Google Scholar] [CrossRef] [Green Version]
- Zheng, C.; Zheng, L.; Yoo, J.K.; Guo, H.; Zhang, Y.; Guo, X.; Kang, B.; Hu, R.; Huang, J.Y.; Zhang, Q.; et al. Landscape of Infiltrating T Cells in Liver Cancer Revealed by Single-Cell Sequencing. Cell 2017, 169, 1342–1356.e16. [Google Scholar] [CrossRef] [Green Version]
- Yu, H.; Zhao, J.; Lin, L.; Zhang, Y.; Zhong, F.; Liu, Y.; Yu, Y.; Shen, H.; Han, M.; He, F.; et al. Proteomic study explores AGR2 as pro-metastatic protein in HCC. Mol. Biosyst. 2012, 8, 2710–2718. [Google Scholar] [CrossRef]
- Chen, S.L.; Lu, S.X.; Liu, L.L.; Wang, C.H.; Yang, X.; Zhang, Z.Y.; Zhang, H.Z.; Yun, J. ping eEF1A1 Overexpression Enhances Tumor Progression and Indicates Poor Prognosis in Hepatocellular Carcinoma. Transl. Oncol. 2018, 11, 125–131. [Google Scholar] [CrossRef]
- Nguyen, A.T.; Emelyanov, A.; Koh, C.H.V.; Spitsbergen, J.M.; Lam, S.H.; Mathavan, S.; Parinov, S.; Gong, Z. A high level of liver-specific expression of oncogenic Kras V12 drives robust liver tumorigenesis in transgenic zebrafish. DMM Dis. Model. Mech. 2011, 4, 801–813. [Google Scholar] [CrossRef] [Green Version]
- Fu, L.-Y.; Jia, H.-L.; Dong, Q.-Z.; Wu, J.-C.; Zhao, Y.; Zhou, H.-J.; Ren, N.; Ye, Q.-H.; Qin, L.-X. Suitable reference genes for real-time PCR in human HBV-related hepatocellular carcinoma with different clinical prognoses. BMC Cancer 2009, 9, 49. [Google Scholar] [CrossRef] [Green Version]
- Yu, C.; Wang, X.; Huang, L.; Tong, Y.; Chen, L.; Wu, H.; Xia, Q.; Kong, X. Deciphering the spectrum of mitochondrial DNA mutations in hepatocellular carcinoma using high-Throughput sequencing. Gene Expr. 2018, 18, 125–134. [Google Scholar] [CrossRef] [PubMed] [Green Version]
- Strnad, P.; Lienau, T.C.; Tao, G.Z.; Lazzeroni, L.C.; Stickel, F.; Schuppan, D.; Omary, M.B. Keratin variants associate with progression of fibrosis during chronic hepatitis C infection. Hepatology 2006, 43, 1354–1363. [Google Scholar] [CrossRef] [PubMed]
- Liu, Y.; Yang, Z.; Du, F.; Yang, Q.; Hou, J.; Yan, X.; Geng, Y.; Zhao, Y.; Wang, H. Molecular mechanisms of pathogenesis in hepatocellular carcinoma revealed by RNA-sequencing. Mol. Med. Rep. 2017, 16, 6674–6682. [Google Scholar] [CrossRef] [PubMed] [Green Version]
Figure 1.
The proposed framework for the extraction and validation of up/downregulated key genes for risky outcomes of hepatitis C virus (HCV).
Figure 1.
The proposed framework for the extraction and validation of up/downregulated key genes for risky outcomes of hepatitis C virus (HCV).

Figure 2.
The proposed up/downregulated ideal key genes.

Figure 3.
The proposed data augmentation model using a sparse autoencoder to generate additional samples.
Figure 3.
The proposed data augmentation model using a sparse autoencoder to generate additional samples.

Figure 4.
The gene signal profile of top ranked key genes retrieved using T-test and F-test.

Figure 5.
The gene signal profiles of top ranked key genes retrieved using Cosine and Pearson’s correlation.
Figure 5.
The gene signal profiles of top ranked key genes retrieved using Cosine and Pearson’s correlation.

Figure 6.
The gene signal profiles of top ranked key genes retrieved using Euclidean distance.

Figure 7.
The gene signal profiles of top ranked key genes retrieved using PCA.


Table 1.
Functional annotation of key genes detected using T-test, and F-test methods after different periods of post-infection with C virus.
Table 1.
Functional annotation of key genes detected using T-test, and F-test methods after different periods of post-infection with C virus.
| AFFY ID | Gene Symbol | ENTREZ Gene ID | Oncology | Gene Pathway |
|---|---|---|---|---|
| 201010_s_at, 201008_s_at, 201009_s_at | TXNIP | 10628 | Breast cancer, prostate Carcinoma, colorectal carcinoma, Hepatocellular Carcinoma (HCC) | REACT_75808. The NLRP3 inflammasome. cellular response to tumor cell |
| 203438_at, 203439_s_at | STC2 | 8614 | Colorectecal cancer, Breast cancer, Mutation of HCC | KEGG: hsa: 8614. |
| 205047_s_at | ASNS | 440 | Cancer, Protein and/or amino acid deprivation | REACT_238. liver development. REACT_18355. ATF4 activates genes. |
| 202887_s_at | DDIT4 | 54541 | Pancreatic tumor, prostate cancer, lung carcinoma | REACT_355377. TP53 Regulates Metabolic Genes |
| 219270_at | CHAC1 | 79094 | downstream of the ATF4 | KEGG: hsa79094 CHAC1 is a component of the UPR, unfolded protein response pathway. |
| 206085_s_at, 217127_at | CTH | 1491 | Bladder Cancer | REACT_115589. Cysteine ormation from homocysteine |
| 1556499_s_at | COL1A1 | 1277 | Mutation in liver, infirative skin carcinoma, bendnar carcinoma | REACT_118779. Extracellular matrix organization. cascade. |
| 210587_at | INHBE | 83729 | hepatocellular carcinoma, HCC | REACT_15398. Glycoprotein hormones |
| 202672_s_at | ATF3 | 467 | Solid tumor | REACT_18355. ATF4 activates genes. |
Table 2.
Functional annotation of key genes detected using cosine coefficient and Pearson’s correlation methods after different periods post-infection with C virus.
Table 2.
Functional annotation of key genes detected using cosine coefficient and Pearson’s correlation methods after different periods post-infection with C virus.
| AFFY ID | Gene Symbol | ENTREZ Gene ID | Oncology | Gene Pathway |
|---|---|---|---|---|
| 213322_at | OARD1 | 221443 | infiltrating duct carcinoma | KEGG: hsa: 221443. |
| 36711_at | MAFF | 23764 | leukemia/lymphoma (BCR-ABL1) | REACT_24970. megakaryocyte, and platelet construction. |
| 205749_at | CYP1A1 | 1543. | hepatocellular carcinoma, NOS, unstated behavior | KEGG: hsa: 1543. REACT_116145. PPARA activates gene expression. |
| 219371_s_at | KLF2 | 10365. | chronic lymphocytic B-cell leukemia | KEGG: hsa: 10365. |
| 212558_at | SPRY1 | 10252 | HCC, gastrointestinal stromal sarcoma | REACT_12484. EGFR downregulation. |
| 205047_s_at | ASNS | 440 | Cancer, Protein and/or amino acid deprivation | REACT_238. liver development. REACT_18355. ATF4 activates genes. |
| 201010_s_at 201009_s_at | TXNIP | 10628 | HCC, Breast cancer, prostate Carcinoma, colorectal carcinoma | REACT_75808. The NLRP3 inflammasome. cellular response to tumor cell |
| 203119_at | CCDC86 | 79080 | HCV, squamous cell carcinoma | KEGG:hsa79080 |
| 232780_s_at | ZNF691 | 51058 | Infiltrating duct carcinoma | REACT_12627. Generic Transcription Pathway. |
| 202847_at | PCK2 | 5106 | HCC | KEGG:hsa00020Citrate cycle (TCA cycle) |
Table 3.
Functional annotation of key genes detected using Euclidean distance after different periods post-infection with C virus.
Table 3.
Functional annotation of key genes detected using Euclidean distance after different periods post-infection with C virus.
| AFFY ID | Gene Symbol | ENTREZ Gene ID | Oncology | -Gene Pathway |
|---|---|---|---|---|
| 36711_at | MAFF | 23764 | leukemia/lymphoma (BCR-ABL1) | REACT_24970. Megakaryocyte and platelet construction. |
| 205749_at | CYP1A1 | 1543. | hepatocellular carcinoma, NOS, unstated behavior | KEGG: hsa: 1543. REACT_116145. PPARA activates gene expression. |
| 209775_x_at | SLC19A1 | 6573. | anaplastic large cell lymphoma | KEGG: hsa 6573. REACT_11167. Metabolism of folate and pterines. |
| 205767_at | EREG | 2069. | chronic myelogenous leukemia (BCR/ABL-positive) | KEGG: hsa 2069. REACT_147727. Signaling by PI3K in Cancer. |
| 217996_at | PHLDA1 | 22822 | gastrointestinal stromal sarcoma | KEGG: hsa: 22822. |
| 226515_at | CCDC127 | 133957 | renal cell carcinoma | KEGG:hsa:133957 |
| 206085_s_at, 217127_at | CTH | 1491 | Bladder Cancer | REACT_115589. Cysteine ormation from homocysteine |
| 225285_at | BCAT1 | 586 | HCC | REACT_197. Branched-chain amino acid catabolism. |
| 202847_at | PCK2 | 5106 | HCC | KEGG:hsa00020Citrate cycle (TCA cycle) |
| 209173_at | AGR2 | 10551 | Breast Cancer | KEGG: hsa: 10551. |
Table 4.
Functional annotation of detected key genes using PCA after different periods of post-infection with C virus.
Table 4.
Functional annotation of detected key genes using PCA after different periods of post-infection with C virus.
| AFFY ID | Gene Symbol | ENTREZ Gene ID | Oncology | Gene Pathway |
|---|---|---|---|---|
| 204892_x_at | EEF1A1 | 1915 | HCC | REACT_1404. Peptide chain elongation |
| 1553567_s_at | ATP6 | 4508. | HCC, adenoma | REACT_6759. Development of ATP. |
| 200801_x_at | ACTP | 948575. | hematopoietic | KEGG: eco: b4067. |
| 212788_x_at | FTL | 2512. | HCC | REACT_163699. Scavenging by Class A Receptors. |
| 200801_x_at | ACTB | 60 | Langerhans-cell histiocytosis | REACT_20649. Cell-extracellular matrix interactions. |
| 201596_x_at | KRT18 | 3875. | HCV, adenocarcinoma | KEGG: hsa: 3875. |
| 1553570_x_at | COX2 | 5743 | Adenocarcinoma, Mutation in HCC | REACT_11213. Nicotinamide salvaging. |
| 224372_at | MTND4 | 4538. | Adenocarcinoma, Mutation in HCC | REACT_22393. Respiratory electron transport. |
| 212661_x_at | PPIA | 5478. | Burkitt lymphoma Mutation in HCC | REACT_9406. HIV-1 infection. |
| 221798_x_at | RPS2 | anaplastic large cell lymphoma | ||
| 1553538_s_at | COX1 | 5742. | Mutation gene in HCC | REACT_1396. COX reactions. |
| 211296_x_at | UBC | 7316. | leukemia/lymphoma | REACT_115852. Signaling by EGFR Cancer Variants. |
Table 5.
The mean squared reconstruction error of the generated samples using sparse autoencoder.
| Feature Selection Method | Mean Squared Reconstruction Error of the Generated Samples |
|---|---|
| T, and F test | 0.0891 |
| Pearson’s correlation, and cosine coefficient | 0.04966 |
| Euclidean distance | 0.05345 |
| Principal component analysis (PCA) | 0.005861 |
Table 6.
The classification accuracies based on the generated samples of the extracted key genes.
| Feature Selection Method | LDA-Linear | QDA-Quadratic | KNN | SVM | ||||||
|---|---|---|---|---|---|---|---|---|---|---|
| K = 1 | K = 3 | K = 5 | SVM-Linear | SVM-Quadratic | SVM-Cubic | SVM-RBF | SVM-RBF Optimized | |||
| T and F test | 66.7 | 95.83 | 79.1667 | 68.75 | 60.417 | 37.50 | 66.667 | 79.167 | 56.25 | 83.334 |
| Pearson’s correlation coefficient, cosine coefficient | 48 | 62.5 | 75 | 62.5 | 56.25 | 37.50 | 64.583 | 85.417 | 72.916 | 85.4167 |
| Euclidean distance) | 69.75 | 78.2 | 81.25 | 79.167 | 77.083 | 50 | 81.25 | 85.417 | 81.25 | 91.667 |
| Principal component analysis (PCA) | 70.8 | 93.75 | 85.41667 | 70.8334 | 72.9167 | 50 | 89.5833 | 87.50 | 77.083 | 91.667 |
© 2020 by the author. Licensee MDPI, Basel, Switzerland. This article is an open access article distributed under the terms and conditions of the Creative Commons Attribution (CC BY) license (http://creativecommons.org/licenses/by/4.0/).
Share and Cite
MDPI and ACS Style
Abdel Samee, N.M. Classical and Deep Learning Paradigms for Detection and Validation of Key Genes of Risky Outcomes of HCV. Algorithms 2020, 13, 73. https://0-doi-org.brum.beds.ac.uk/10.3390/a13030073
AMA Style
Abdel Samee NM. Classical and Deep Learning Paradigms for Detection and Validation of Key Genes of Risky Outcomes of HCV. Algorithms. 2020; 13(3):73. https://0-doi-org.brum.beds.ac.uk/10.3390/a13030073
Chicago/Turabian StyleAbdel Samee, Nagwan M. 2020. "Classical and Deep Learning Paradigms for Detection and Validation of Key Genes of Risky Outcomes of HCV" Algorithms 13, no. 3: 73. https://0-doi-org.brum.beds.ac.uk/10.3390/a13030073
Note that from the first issue of 2016, this journal uses article numbers instead of page numbers. See further details here.