
A Simplification Method for Point Cloud of T-Profile Steel Plate for Shipbuilding

College of Mechanical and Electrical Engineering, China Jiliang University, Hangzhou 310018, China
*
Author to whom correspondence should be addressed.
Algorithms 2021, 14(7), 202; https://0-doi-org.brum.beds.ac.uk/10.3390/a14070202
Submission received: 20 May 2021
/
Revised: 21 June 2021
/
Accepted: 26 June 2021
/
Published: 30 June 2021
Abstract
:According to the requirements of point cloud simplification for T-profile steel plate welding in shipbuilding, the disadvantages of the existing simplification algorithms are analyzed. In this paper, a point cloud simplification method is proposed based on octree coding and the threshold of the surface curvature feature. In this method, the original point cloud data are divided into multiple sub-cubes with specified side lengths by octree coding, and the points that are closest to the gravity center of the sub-cube are kept. The k-neighborhood method and the curvature calculation are performed in order to obtain the curvature features of the point cloud. Additionally, the point cloud data are divided into several regions based on the given adjustable curvature threshold. Finally, combining the random sampling method with the simplification method based on the regional gravity center, the T-profile point cloud data can be simplified. In this study, after obtaining the point cloud data of a T-profile plate, the proposed simplification method is compared with some other simplification methods. It is found that the proposed simplification method for the point cloud of the T-profile steel plate for shipbuilding is faster than the three existing simplification methods, while retaining more feature points and having approximately the same reduction rates.
1. Introduction
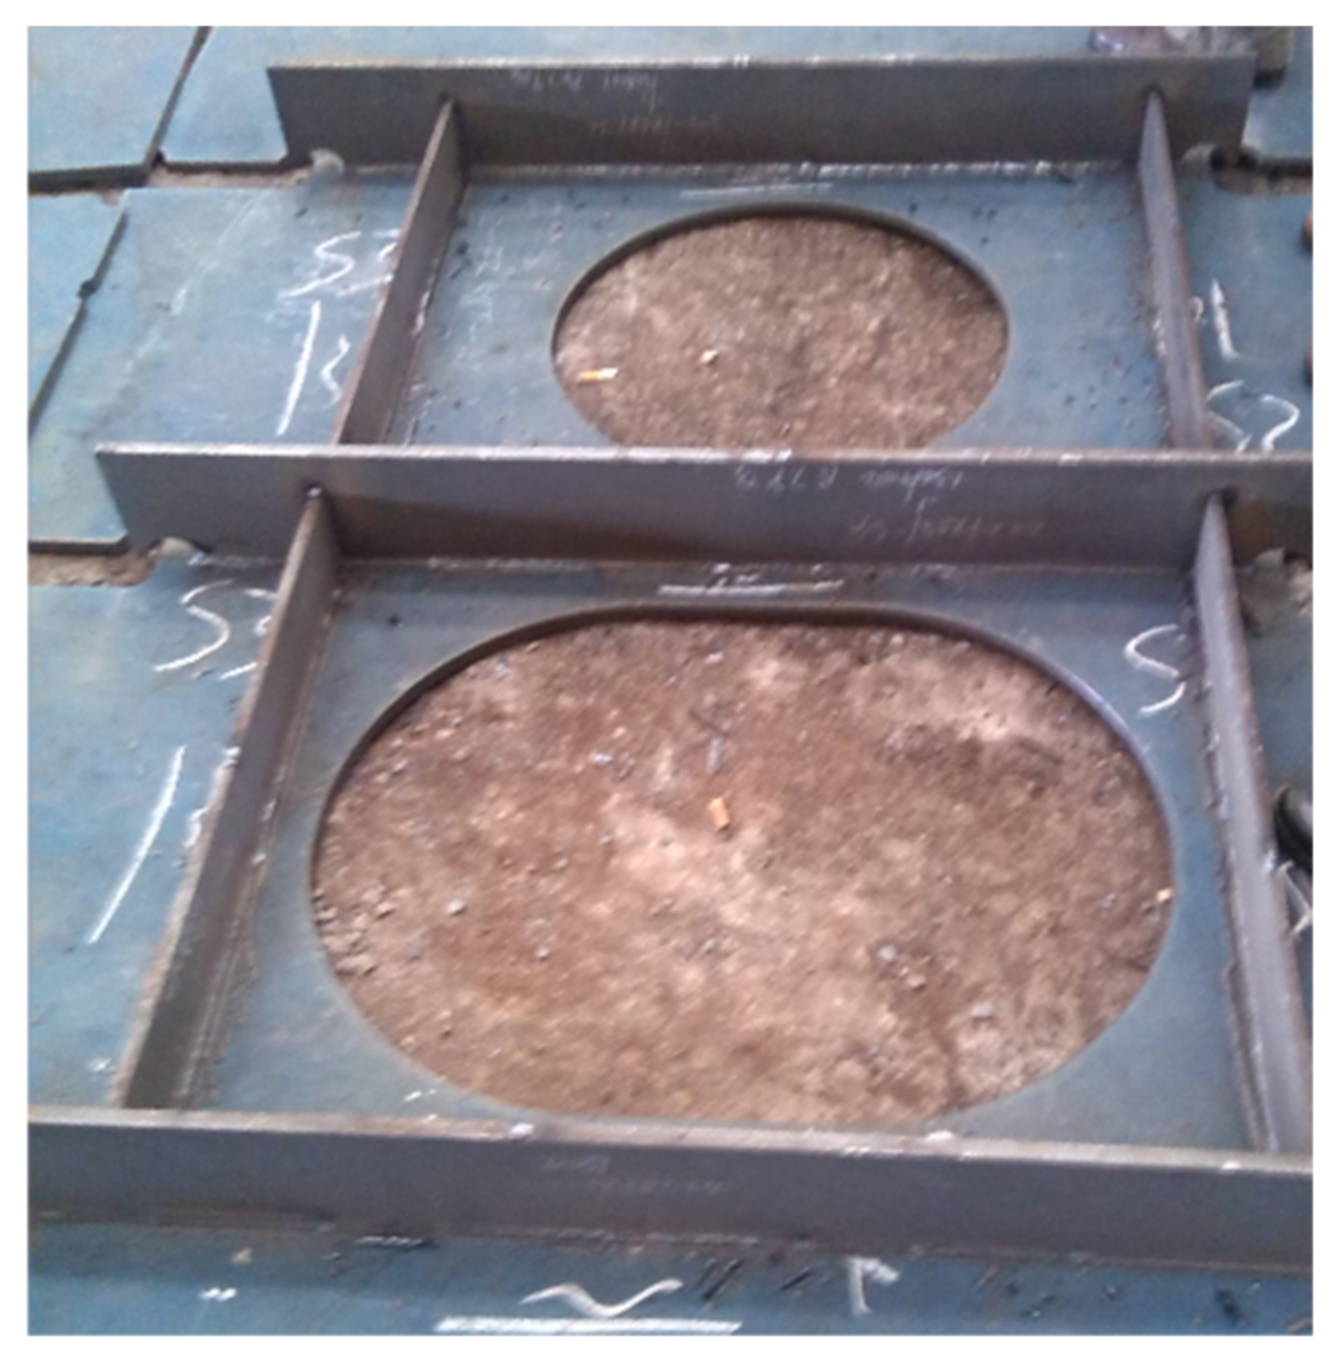
At present, the welding of T-profile steel plates (shown in Figure 1) are still completed manually in ship plants in China. This is costly and labor intensive with low efficiency. Additionally, the welding quality is often difficult to be guaranteed [1,2]. Therefore, three-dimensional (3D) laser scanning technology is selected for collecting the data on T-profile plates, and then industrial robots are used for plate welding based on the obtained point cloud data [3,4,5]. The amount of point cloud data collected by 3D laser scanning instruments is often large and may include a number of redundant points [6]. If the original 3D data are directly used, then this needs much computing time and resource. Therefore, reducing the data as much as possible is needed with the consideration of keeping an acceptable level of accuracy. In this process, the redundant data points and the noise of them should be removed at an acceptable processing speed [7].
In the past decades, a number of methods have been developed for removing redundant cloud points, which are classified into two categories: mesh-based simplification and point-based simplification [8,9,10]. There is a long history of research on mesh-based simplification methods of point cloud data. For example, in the studies of Hoppe et al. and Eck et al., when sub-regions of measured surface points are continuous, the progressive mesh algorithm is suggested to simplify the point cloud [8,11]. Moenning and Dodgson [12] developed a simplification method of point-sampled geometry without any prior surface reconstruction, which is considered computationally and memory efficient. Dey et al. [13] presented an algorithm to decimate the samples to eliminate oversampling, which can guarantee that the remaining points are sufficient to reconstruct the surface. Furthermore, informative reviews on point cloud simplification methods can be found in the literature [14,15]. As addressed by Zhang [10], it is necessary to construct mesh using the original point cloud data when mesh-based simplification is used. Thus, a lot of computational resources are needed by this process of mesh construction.
On the other hand, point-based methods have become a focus for research of point cloud simplification. Yi et al. [16] proposed a point cloud data reduction method based on curvature and uniform reduction. In this method, the k-nearest neighbors are firstly established by the bounding box method, and then the curvature in the point cloud region is determined and classified according to the principle of the curvature reduction method. More points of the areas with larger curvatures are kept. The simplification method proposed in the study of Sun [17] is mainly for the surface reconstruction of the ship’s shell plating. In this study, the point cloud data of the flat area is reduced by the bounding box method, and the minimum distance algorithm is used for reducing the point cloud data of the sharp area. Considering the shape of T-profile plates made through welding in the ship plants, Shao and Xi [18] proposed a point cloud simplification method based on the combination of octree coding and the surface curvature feature threshold. This method can preserve the features of the target object and guarantee the processing speed. Shi et al. [19] presented an adaptive simplification method to reduce the scanned dense 3D points, and designed an automatic recursive subdivision scheme to remove redundant 3D points. Whelan et al. [20] presented a dataset simplification method for the RGB-D type point cloud in terms of two types of segments, including incremental planar segmentation of a gradually expanding point cloud map and a method for efficient triangulation and texturing of planar surface segments. Rodriguez et al. [21] developed an algorithm that can reduce the point cloud with the precision criteria by 99%, and they can still accurately resolve the geometry of the scanned object after performing this algorithm. Han et al. [22] proposed a point cloud simplification algorithm with the edge based on the normal vector. Thus, the distinct features of the edge were preserved.
Based on the data attributes, the point-based simplification methods above can be further classified into: space subdivision, geometric features, and extra attributes. Considering the demand for automated T-profile steel plate welding in shipbuilding, a point cloud simplification algorithm is presented in this paper focused on the simplicity, efficiency and accuracy requirements of point cloud reduction. The proposed simplification method for the point cloud data of the T-profile steel plate for shipbuilding includes both the space subdivision step and geometric features.
The rest of this paper is described as follows. In Section 2, the main procedures of the proposed simplification method for the point cloud of the T-profile steel plate used in shipbuilding are given. In Section 3 and Section 4, the algorithms included in the proposed method are described, which are the octree coding algorithm based on the neighborhood point search, and the point cloud simplification algorithm based on the surface curvature feature. The experiment results are given and analyzed in Section 5. Finally, the conclusions are addressed.
2. Main Procedures of the Proposed Simplification Method
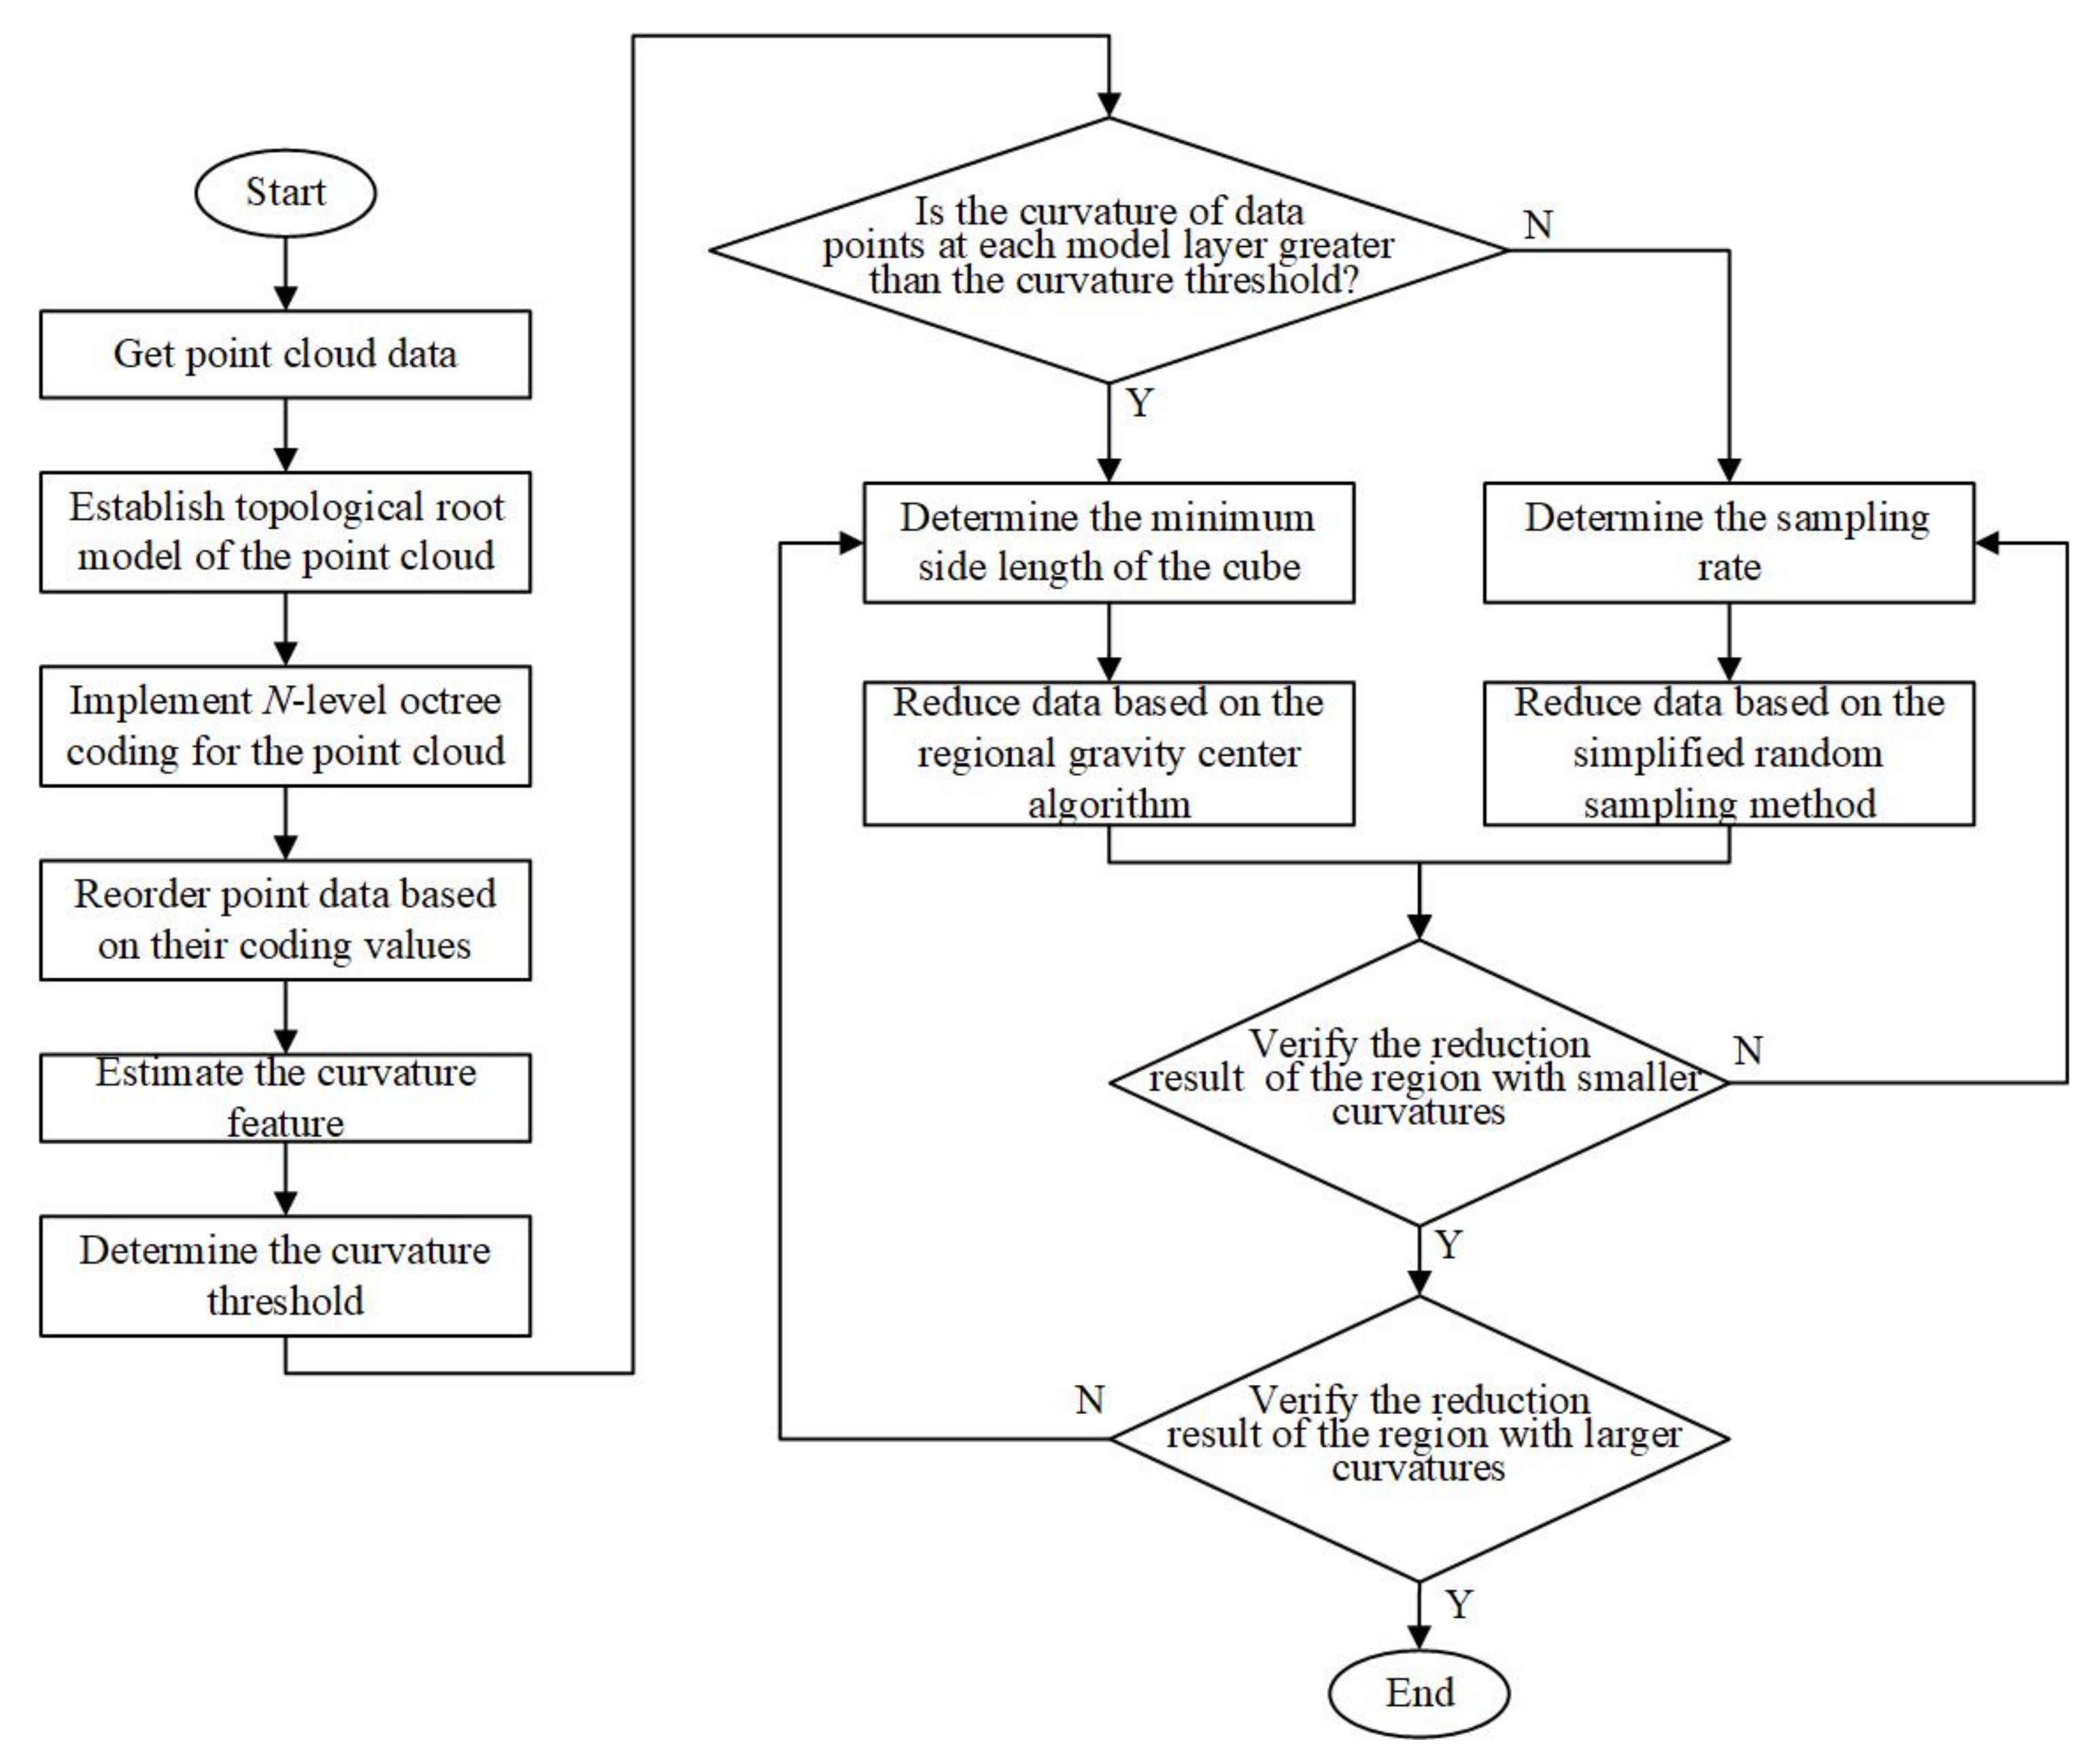
The main procedures of the proposed simplification method for the point cloud are shown in Figure 2. In order to divide the point cloud into regions, octree coding is used firstly in this paper. In this step, the bounding box of the original points is constructed, and this box is divided into multiple sub-cubes with the same side lengths. Thus, the topological root model of the data point cloud is established. Secondly, the k-neighborhood search is performed for the points in each sub-cube, and the curvatures as the features of the point cloud are calculated [23]. Then, after an adjustable curvature threshold is set, the regions with larger or smaller curvatures can be identified based on the curvature threshold and the mean curvatures of all sub-cubes. In this study, the regions with smaller curvatures are the flat regions of the T-profile steel plate, and the regions with larger curvatures are the welding regions of the T-profile steel plate.
Next, two different simplification algorithms are used for the regions with smaller or larger curvatures. For the flat regions of the T-profile steel plate, the random sampling method is used, which is effective for the reduction of data points. For the welding regions of the T-profile steel plate, the regional center of gravity simplification algorithm is selected. The processing speed of the latter method is relatively low. However, most useful information is retained after data reduction by this method.
The proposed simplification method combines the advantages of the two simplification algorithms with the consideration of the points curvature distribution of the T-profile steel plate. For the T-profile steel plate, the number of the regions with larger curvatures is obviously far less than those with smaller curvatures. Therefore, the simplification speed and the retention of most feature information is ensured in the proposed simplification method of the point cloud for the T-profile steel plate.
3. Octree Coding Algorithm Based on Neighborhood Point Search
Due to the large amount of the point cloud of the T-profile plate, the time needed is often long and the search efficiency is low if the k-d tree algorithm is used for dividing regions [24]. Considering the shortcomings of applying the k-d tree to the neighborhood search of the T-profile plate point cloud [25,26], the octree coding algorithm is used in this paper. This is more suitable for dividing the three-dimensional space of the T-profile plate point cloud in this study. This algorithm is simple, and its search efficiency is relatively high [27,28].
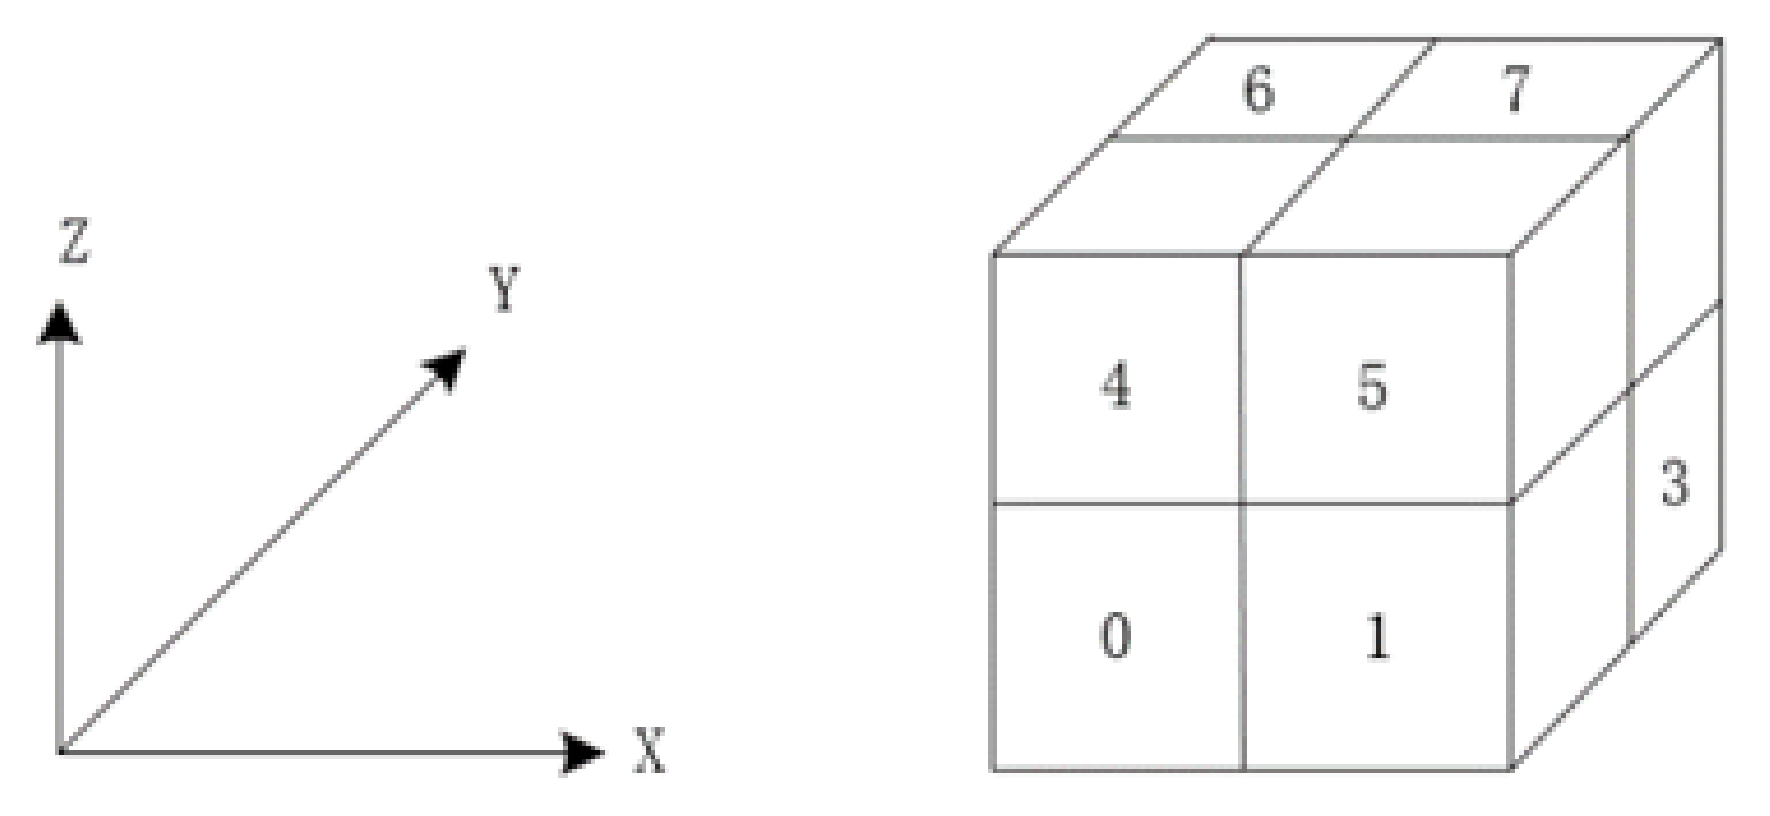
As shown in Figure 3, in this study we developed a root model based on the topological relationship of the target object’s point cloud [29,30]. Firstly, when constructing the bounding box, all the point data is divided into eight sub-cubes with the same size. Secondly, each sub-cube is equally divided by the recursion method. Finally, the previous steps are repeated until the smallest side lengths of the sub-cubes are smaller than the specified point spacing. Since the minimum interval of the scanning point cloud of the Leica HDS7000 [31] is set as 0.6 mm for the T-profile plate scanning, the specified distance is set to 4 mm in order to allow 50 to 100 point cloud data to be included in the smallest sub-cube. Additionally, each sub-cube obtained by the octree coding algorithm is coded based on its position.
Each sub-cube is represented by a code, and the code corresponds to the root node under the octree. The sub-cube position in the root model can be represented by the octree code Q, given as follows
where qm is the number of this node at this level, m ∈ {0, 1, …, n − 1}, and it is octal; qm+1 is the node number of qm at the parent level. Therefore, the path from each child node to the root in the octree can be represented by q0 to qn−1.
Q = qn−1⋯qm⋯q1q0
The specific steps are as follows:
- Step (1): Determine the division number of the octree for the point cloudwhere d0 is the known point distance of the point cloud; dmax is the longest side length of the bounding box; n is the division number of the octree, which is the minimum integer in Equation (2).
- Step (2): Determine the encoding of the sub-cubes, at which the point cloud data points are located. Assume that the data point is P (x, y, z), the spatial index of the sub-cube is (i, j, k), and Q is the octree coding of the corresponding node. The relationship among them is represented by Equations (3) to (5)where (xmin, ymin, zmin) is the minimum vertex coordinate of the bounding box corresponding to the root node. The procedure converting the index (i, j, k) to binary representation is as followswhere im, jm, km ∈ {0,1}, and m ∈ {0,1,…, n − 1}.
Therefore, the octree encoding corresponding to the cube can be expressed by Equation (1).
If we assume that the index of a sub-cube after partitioning is (i, j, k), the index of the 26 sub-cubes surrounding it can be represented by (i ± δ, j ± δ, k ± δ) (δ ∈ {0,1}).
After finding the point Pi in the point cloud that is closest to the gravity center of a sub-cube, 30 points are evenly selected in the sub-cube, ensuring that the point Pi is the gravity center of the 30 points. The 30 points are also required to cover the sub-cube as much as possible. Finally, the least square method is used to fit the quadric surface through the 30 points. The quadratic surface formula is given as follows
where ci,j−1 is the surface parameters.
4. Point Cloud Simplification Algorithm Based on Curvature Feature
4.1. Algorithm of Calculating the Surface Curvature Feature
In the study, the least square method is used for calculating the coefficients of the fitting surface shown by Equation (7)
where: xk, yk, zk are the coordinates of the points in the sub-cube.
Then, the coefficients are calculated separately in Equation (7) by making the partial differential zero
As a result, the quadratic equation of the fitting surface is determined.
After obtaining the fitting surface equation, the average curvature of the points is derived based on the following first-order and second-order partial differentials
Then, the average curvature of the surface can be expressed as follows
Based on the steps above, the average curvature Pi of the selected points in the field is obtained. Finally, the average curvature of all points in the region is obtained
The average curvature can show the bending degree of the surface. If the average curvature of point cloud data within the sub-cube is Pi ≤ , it can be considered that the point cloud data in the sub-cube belong to a point with relatively flat distribution, and the points in the region are simplified by the random sampling method. When Pi ≥ , the points are considered as belonging to a dramatically changing region. The regional gravity algorithm is used for the simplification of the points in the dramatically changing regions.
4.2. Reduction Algorithm Based on the Random Sampling Method
It is considered that the point cloud data in the flat region of the T-profile steel plate is required to reserve the complete contour features, and the demand for detailed features is not very large. As a result, the random sampling method is adopted for simplification in the flat region [32].
First, a random function is established; the function covers the original point cloud data, then generates random numbers according to the random function and deletes the corresponding points until the number of remaining point cloud data reaches the preset number determined by the planned reduction rate. The random sampling algorithm is simple and easy to implement, and the processing speed is also high. However, the randomness of the random function is very large. After the original point cloud data are reduced, some important geometric features are possibly lost.
4.3. Simplification Algorithm Based on the Regional Gravity Center
When the curvature is greater than the given threshold, the simplification algorithm based on the regional gravity center is applied in the proposed method. In the simplified algorithm based on the regional center of gravity, more information features can be reserved than in the random sampling method [33].
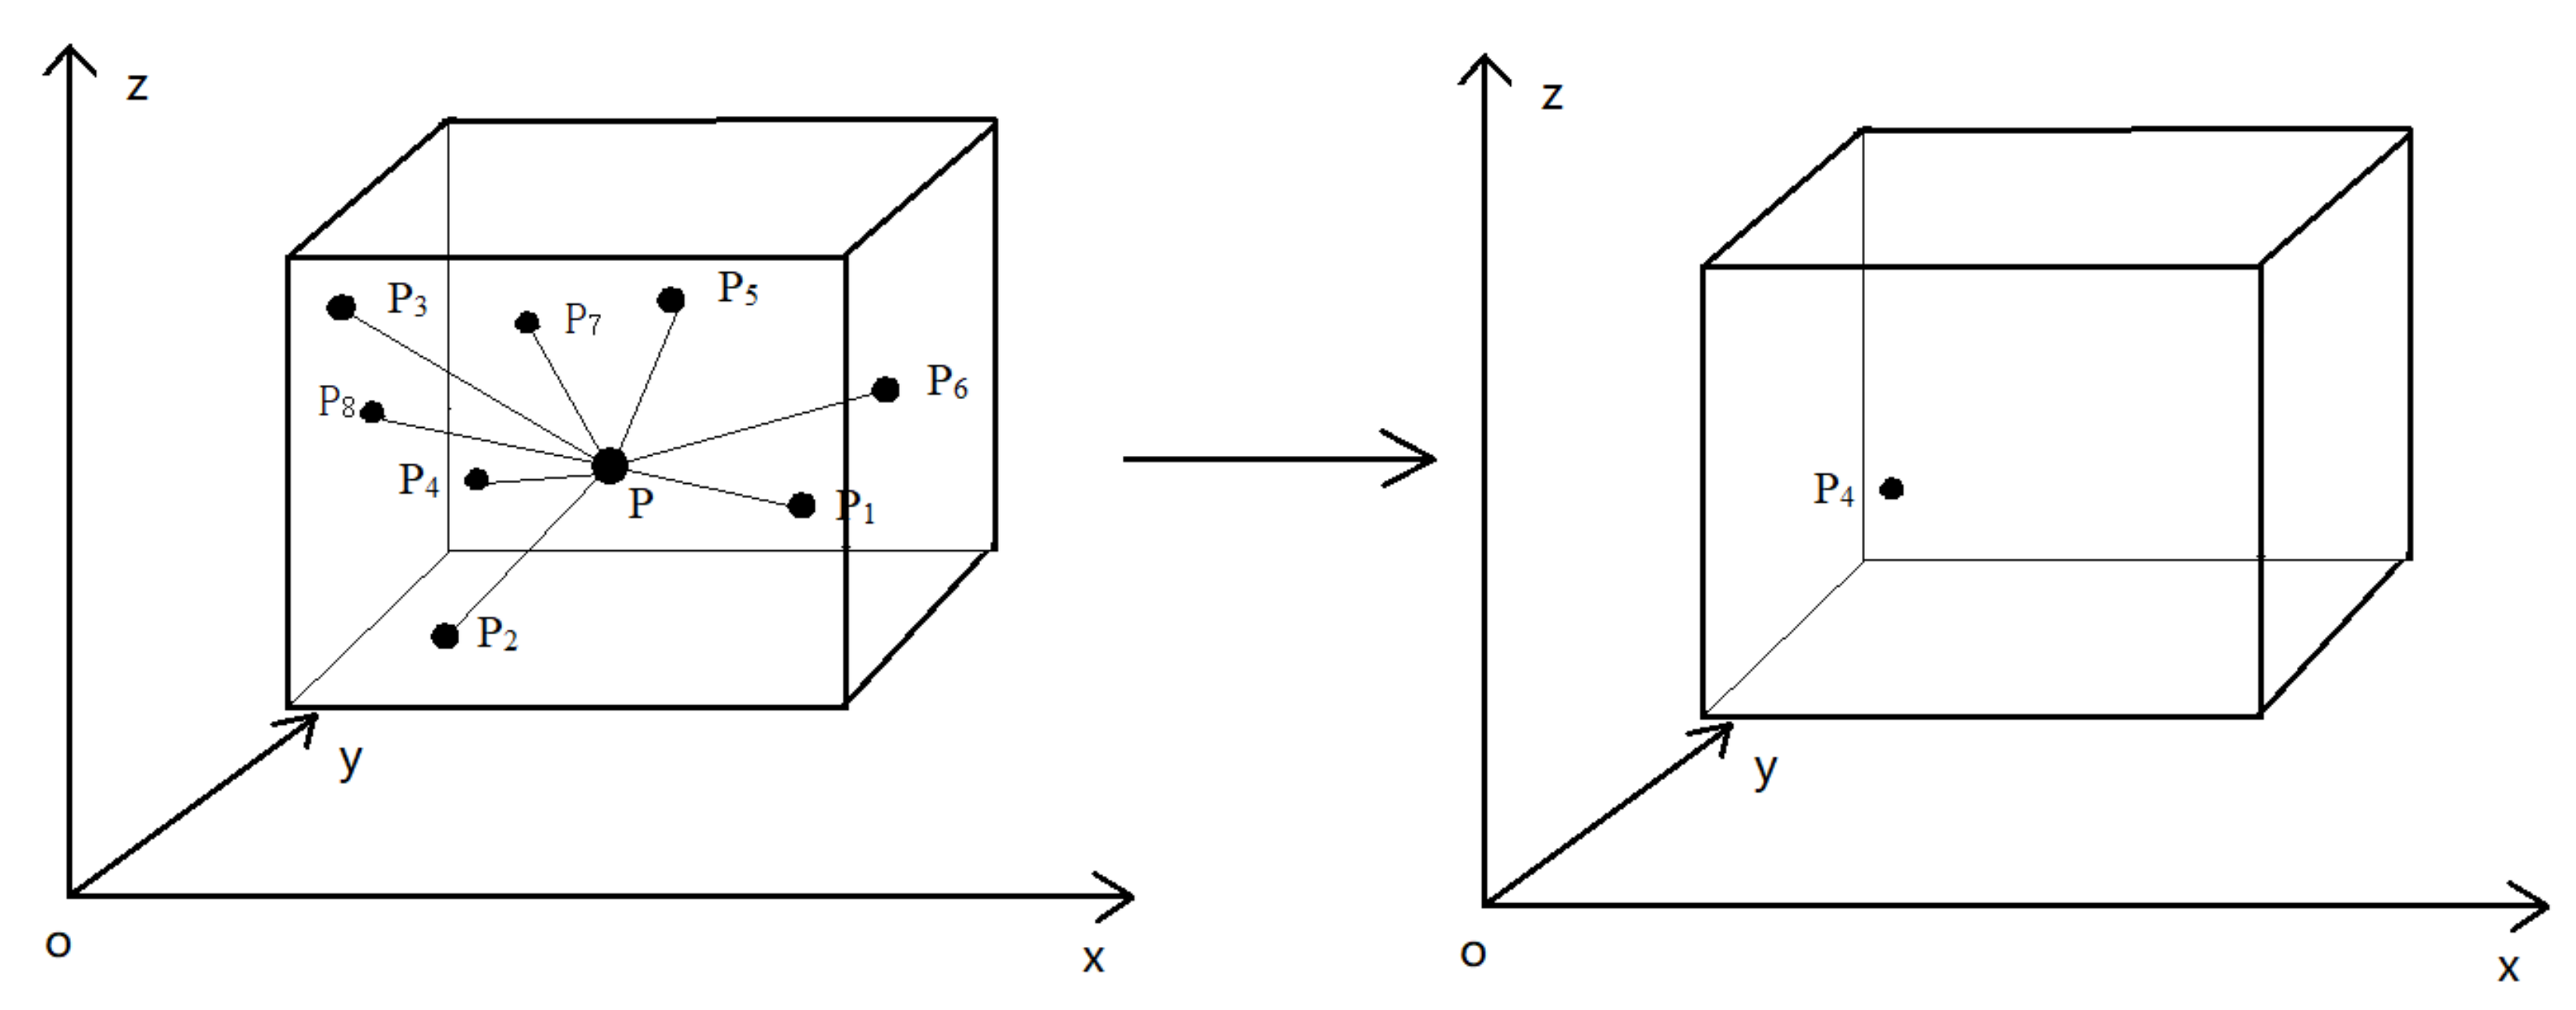
Firstly, where the curvature is larger than the threshold, all points in this region are contained by a cube. Secondly, the cube is divided into a number of small cubes with the same size. Finally, the mean point (regional gravity center) is calculated in each small cube and the nearest point to this mean is calculated.
Supposing that there are N points {p1, p2, ...., pN} in the considered box, and there coordinates are (pix, piy, piz), I = 1, 2, ..., N, then the mean point is marked p. Its coordinates are (px, py, pz), which are given as follows
Then, the distance di, i = 1,2, …, N between the point pi (pix, piy, piz) in the sub-cube and the mean point p can be calculated, given as follows:
The distances between other points and the mean point are also calculated. Finally, the nearest point to the mean point in the sub-cube is determined. This point is preserved while deleting other points in the sub-cube. The simplification process is shown in Figure 4.
5. Experimental Results
In this section, the proposed simplification method is verified based on the 3-D laser scanner and the Matlab of the MathWorks Incorporation. The experimental data are obtained from the HDS7000 laser scanner of the Leica Geosystems company [31] by scanning a T-profile steel plate. In the experiment, the data reduction rate is defined as the ratio of the remaining point cloud data volume to the total point cloud data volume. The welding zone feature point retention rate is defined as the ratio of the amount of point cloud data remaining in the weld zone to the total point cloud data volume in the weld zone.
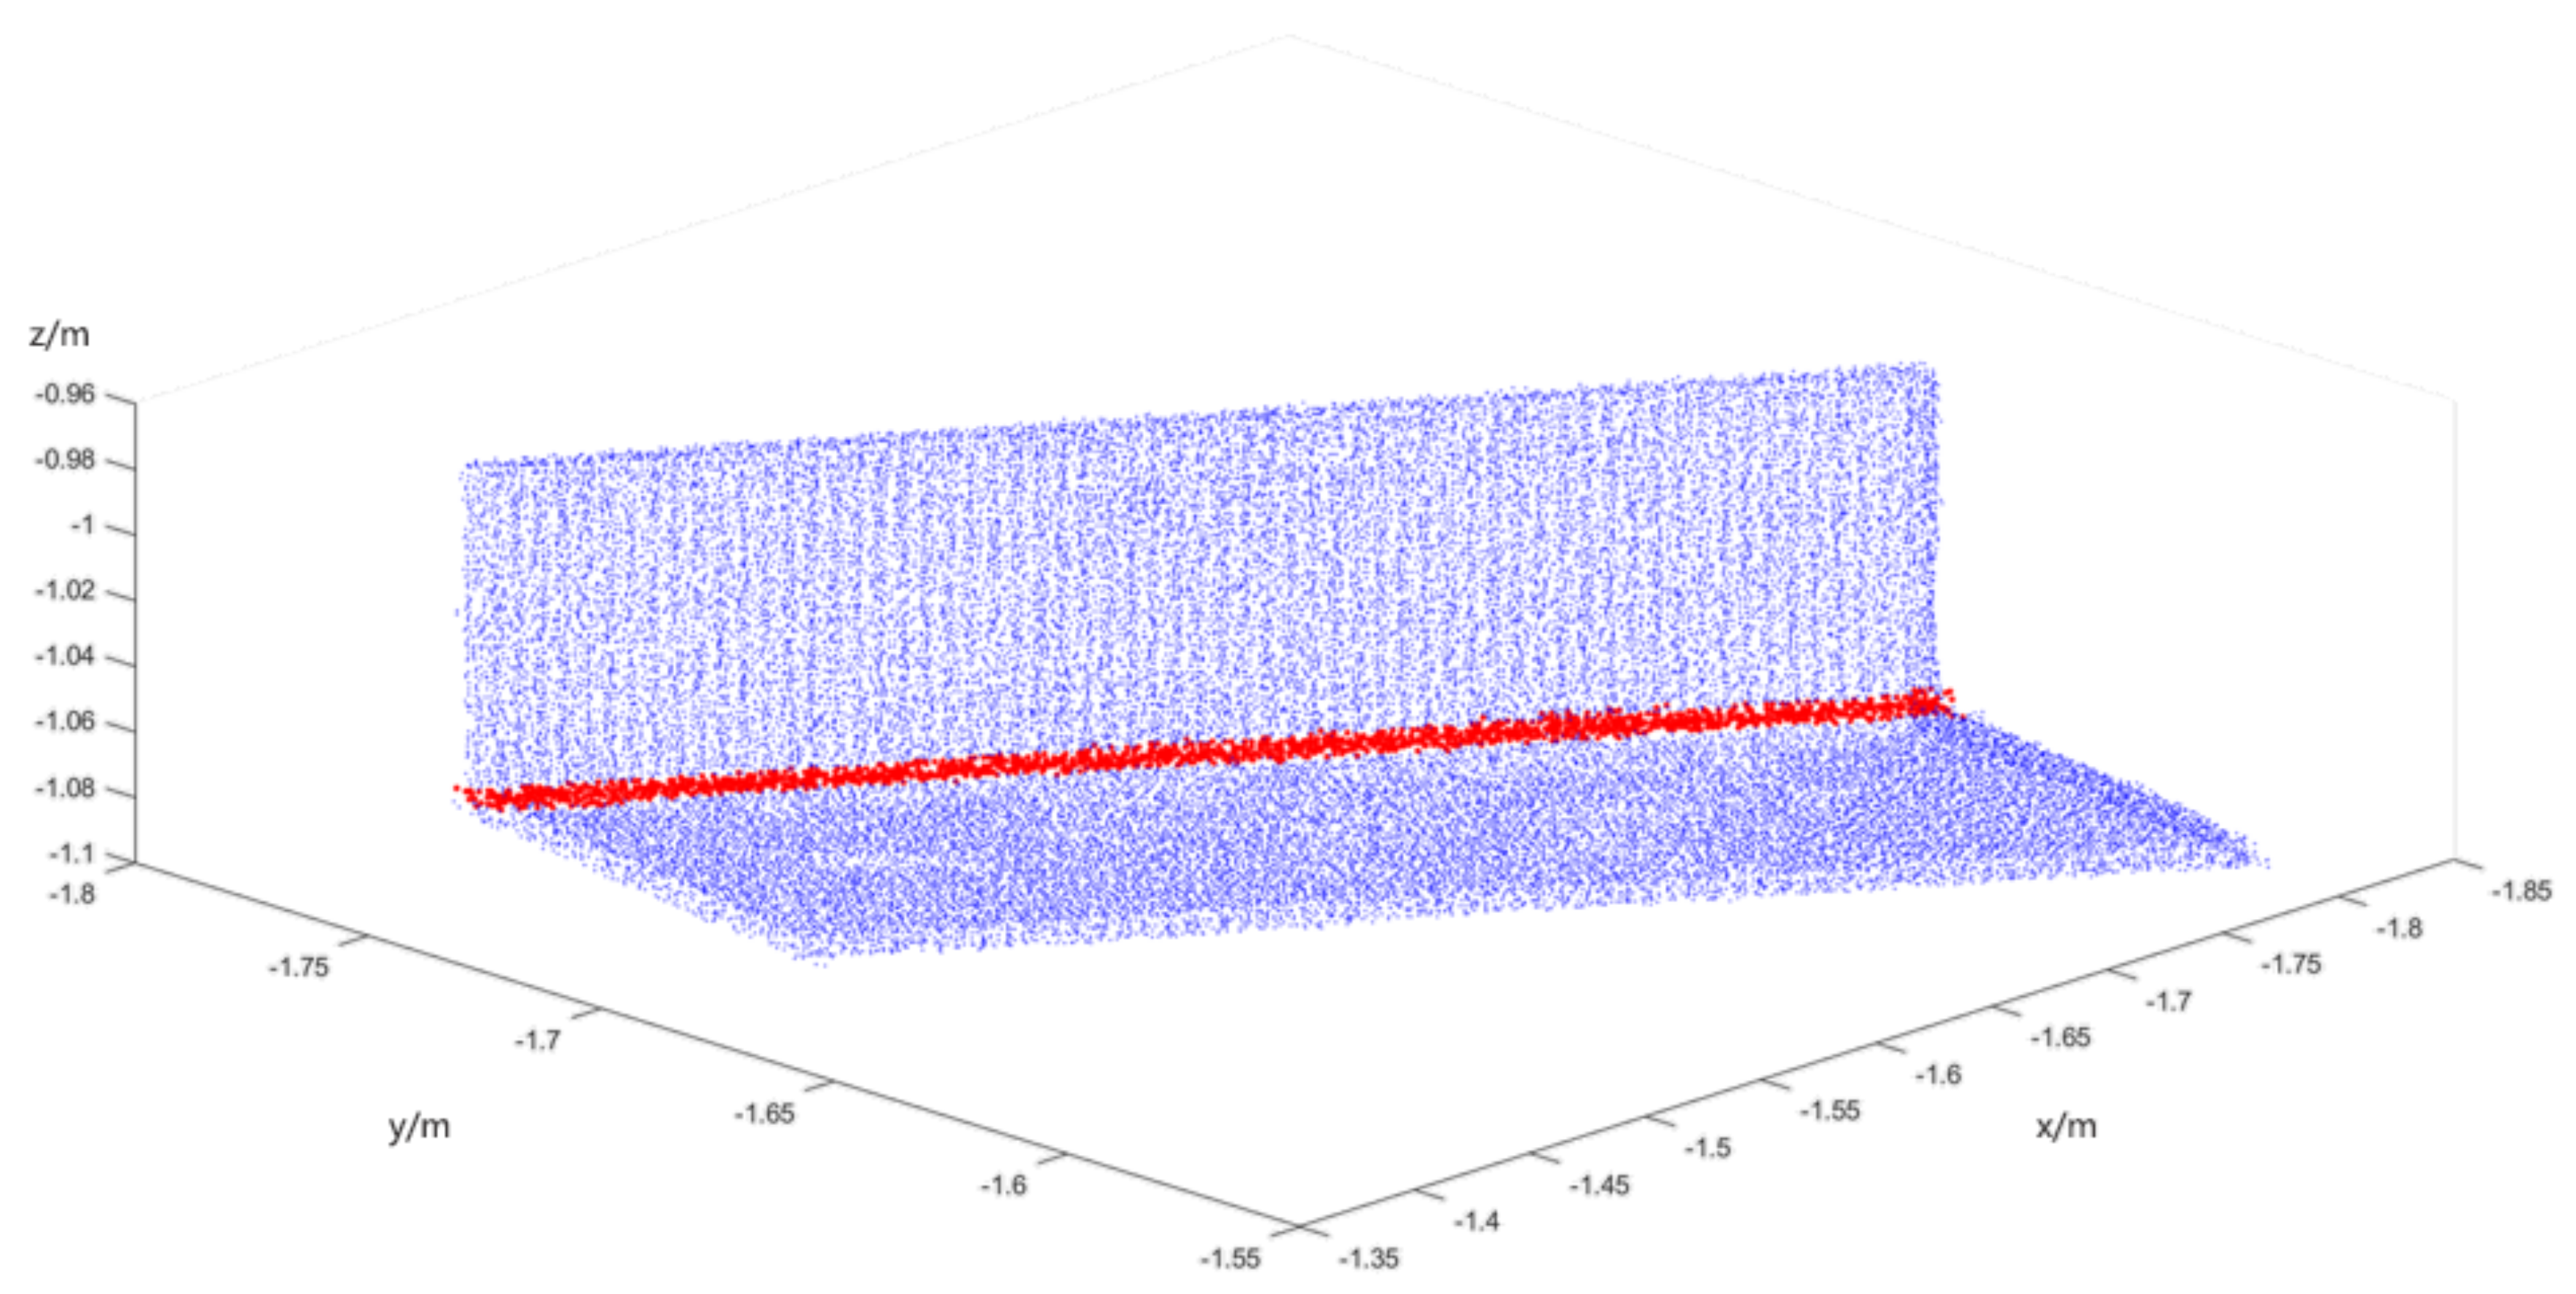
As shown in Figure 5, the red region has a relatively steep distribution of point cloud, while the blue region is a region with a relatively flat distribution of point cloud.
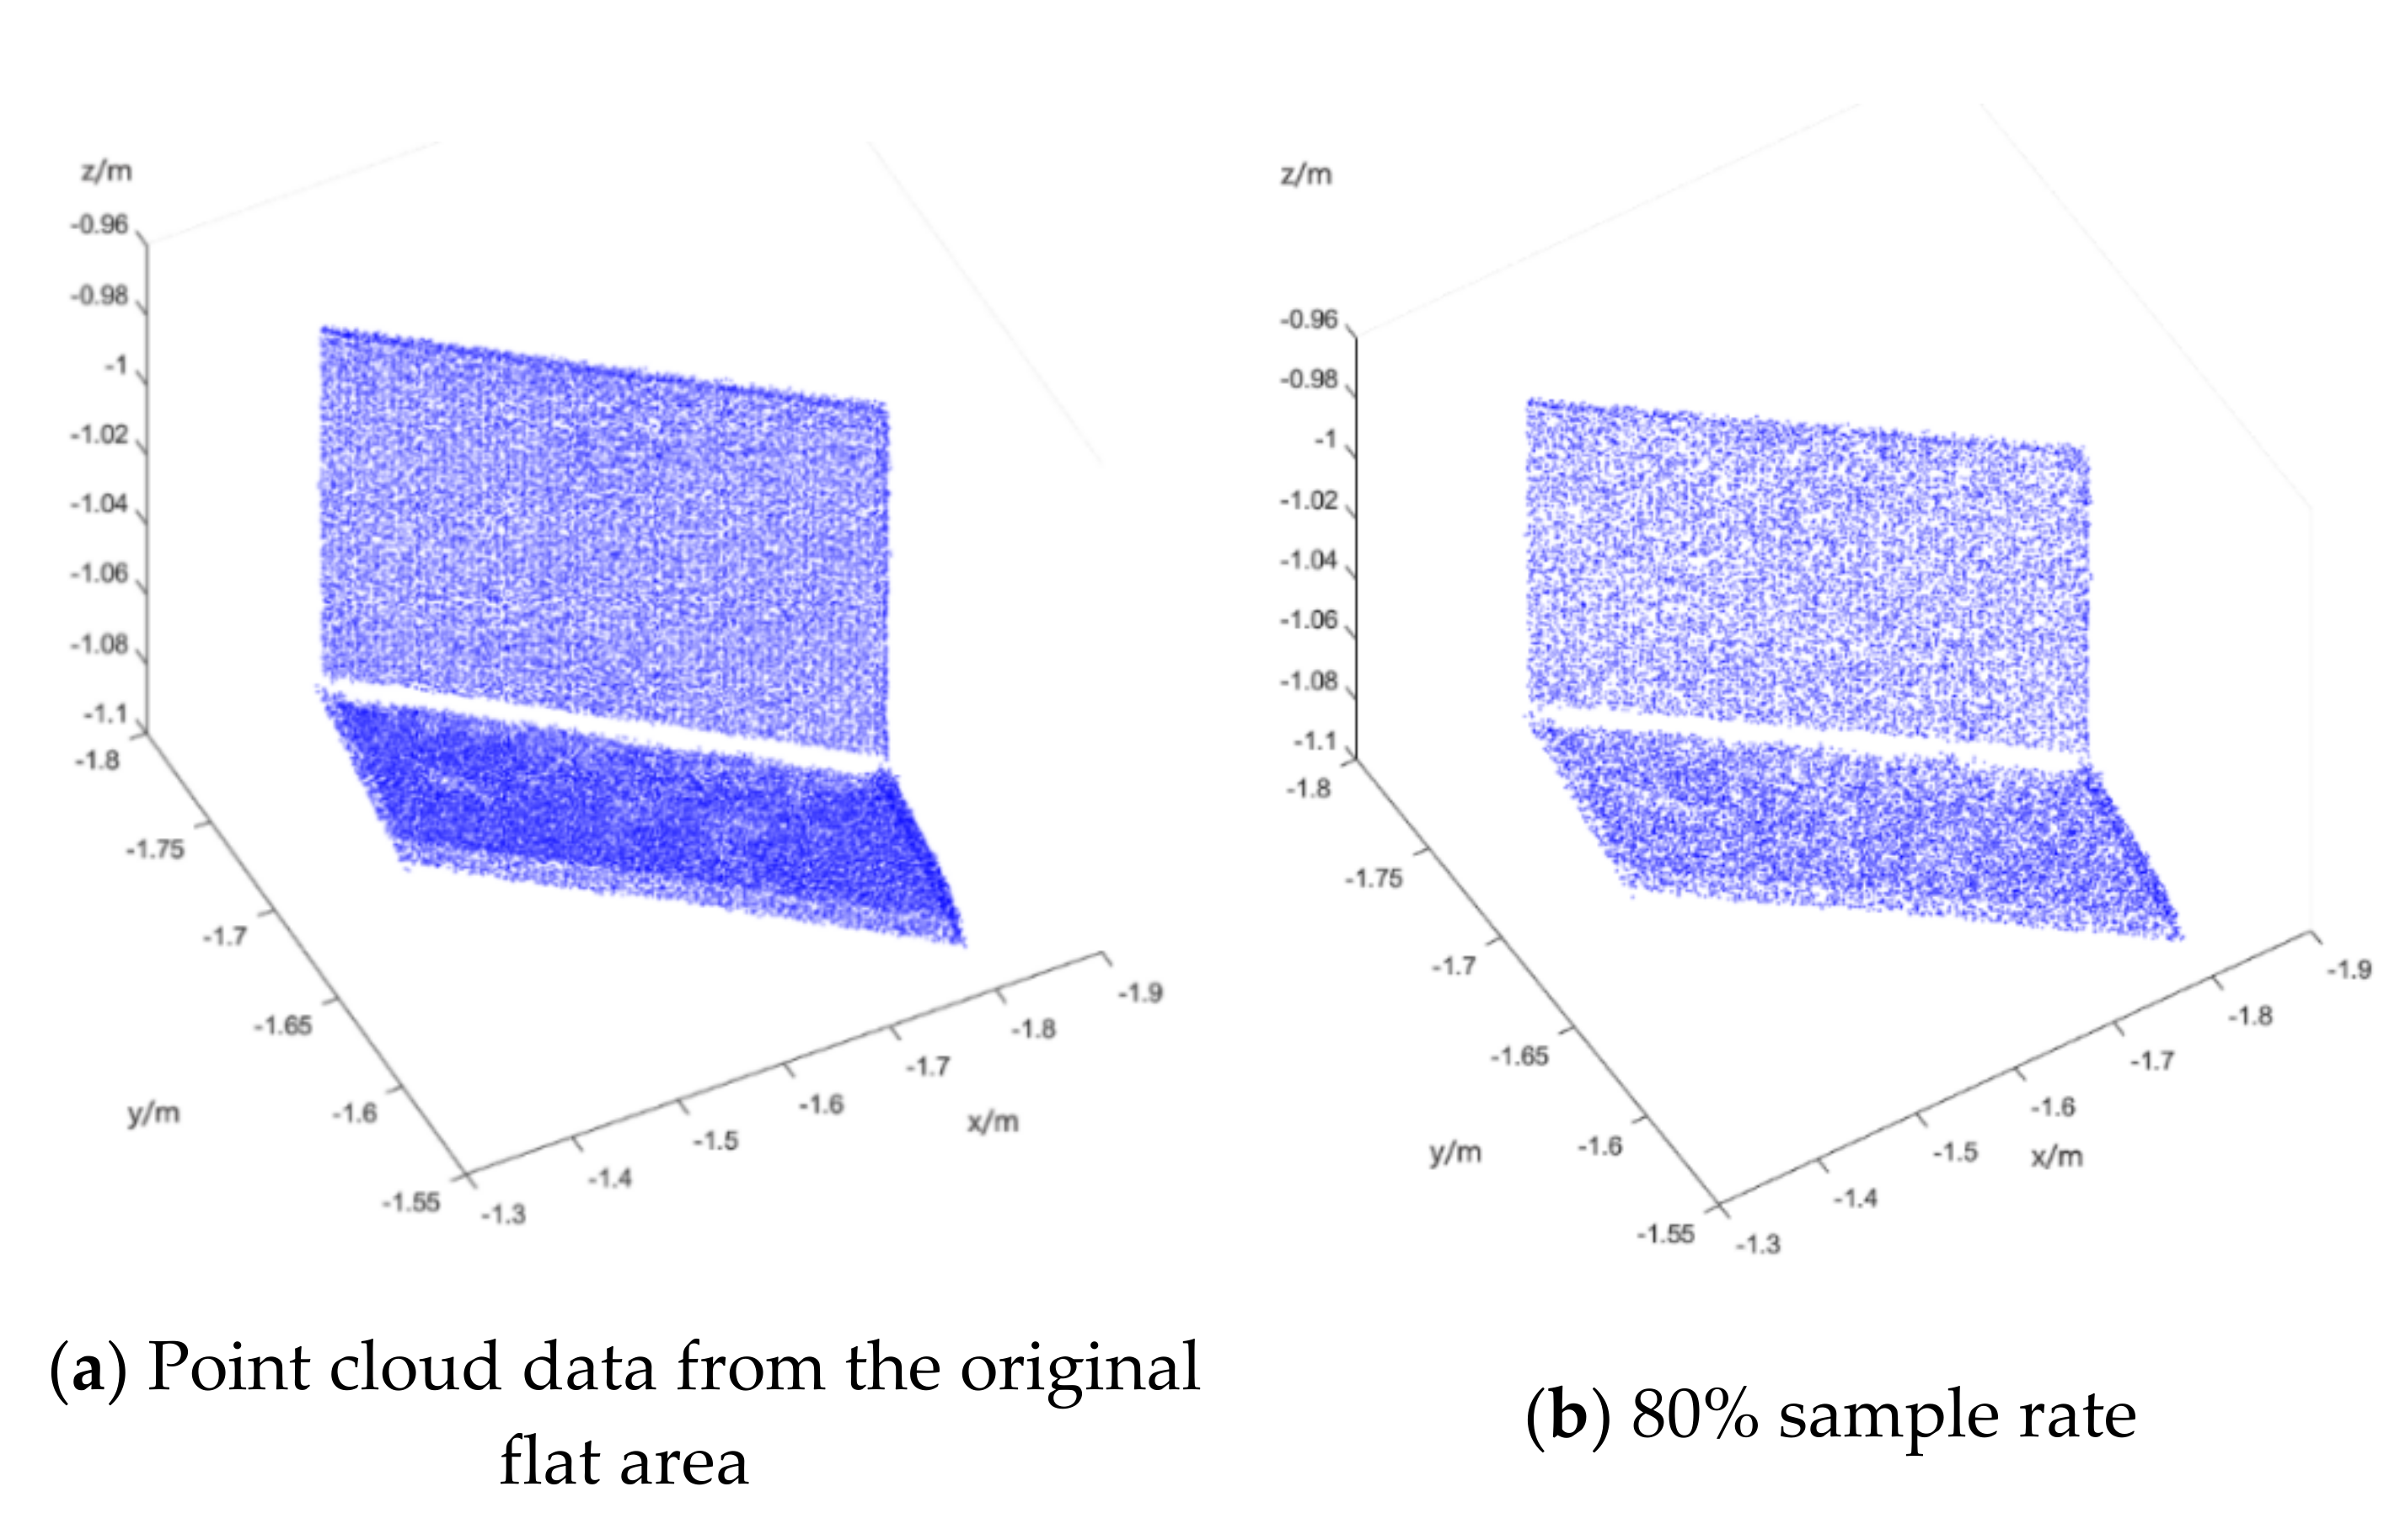
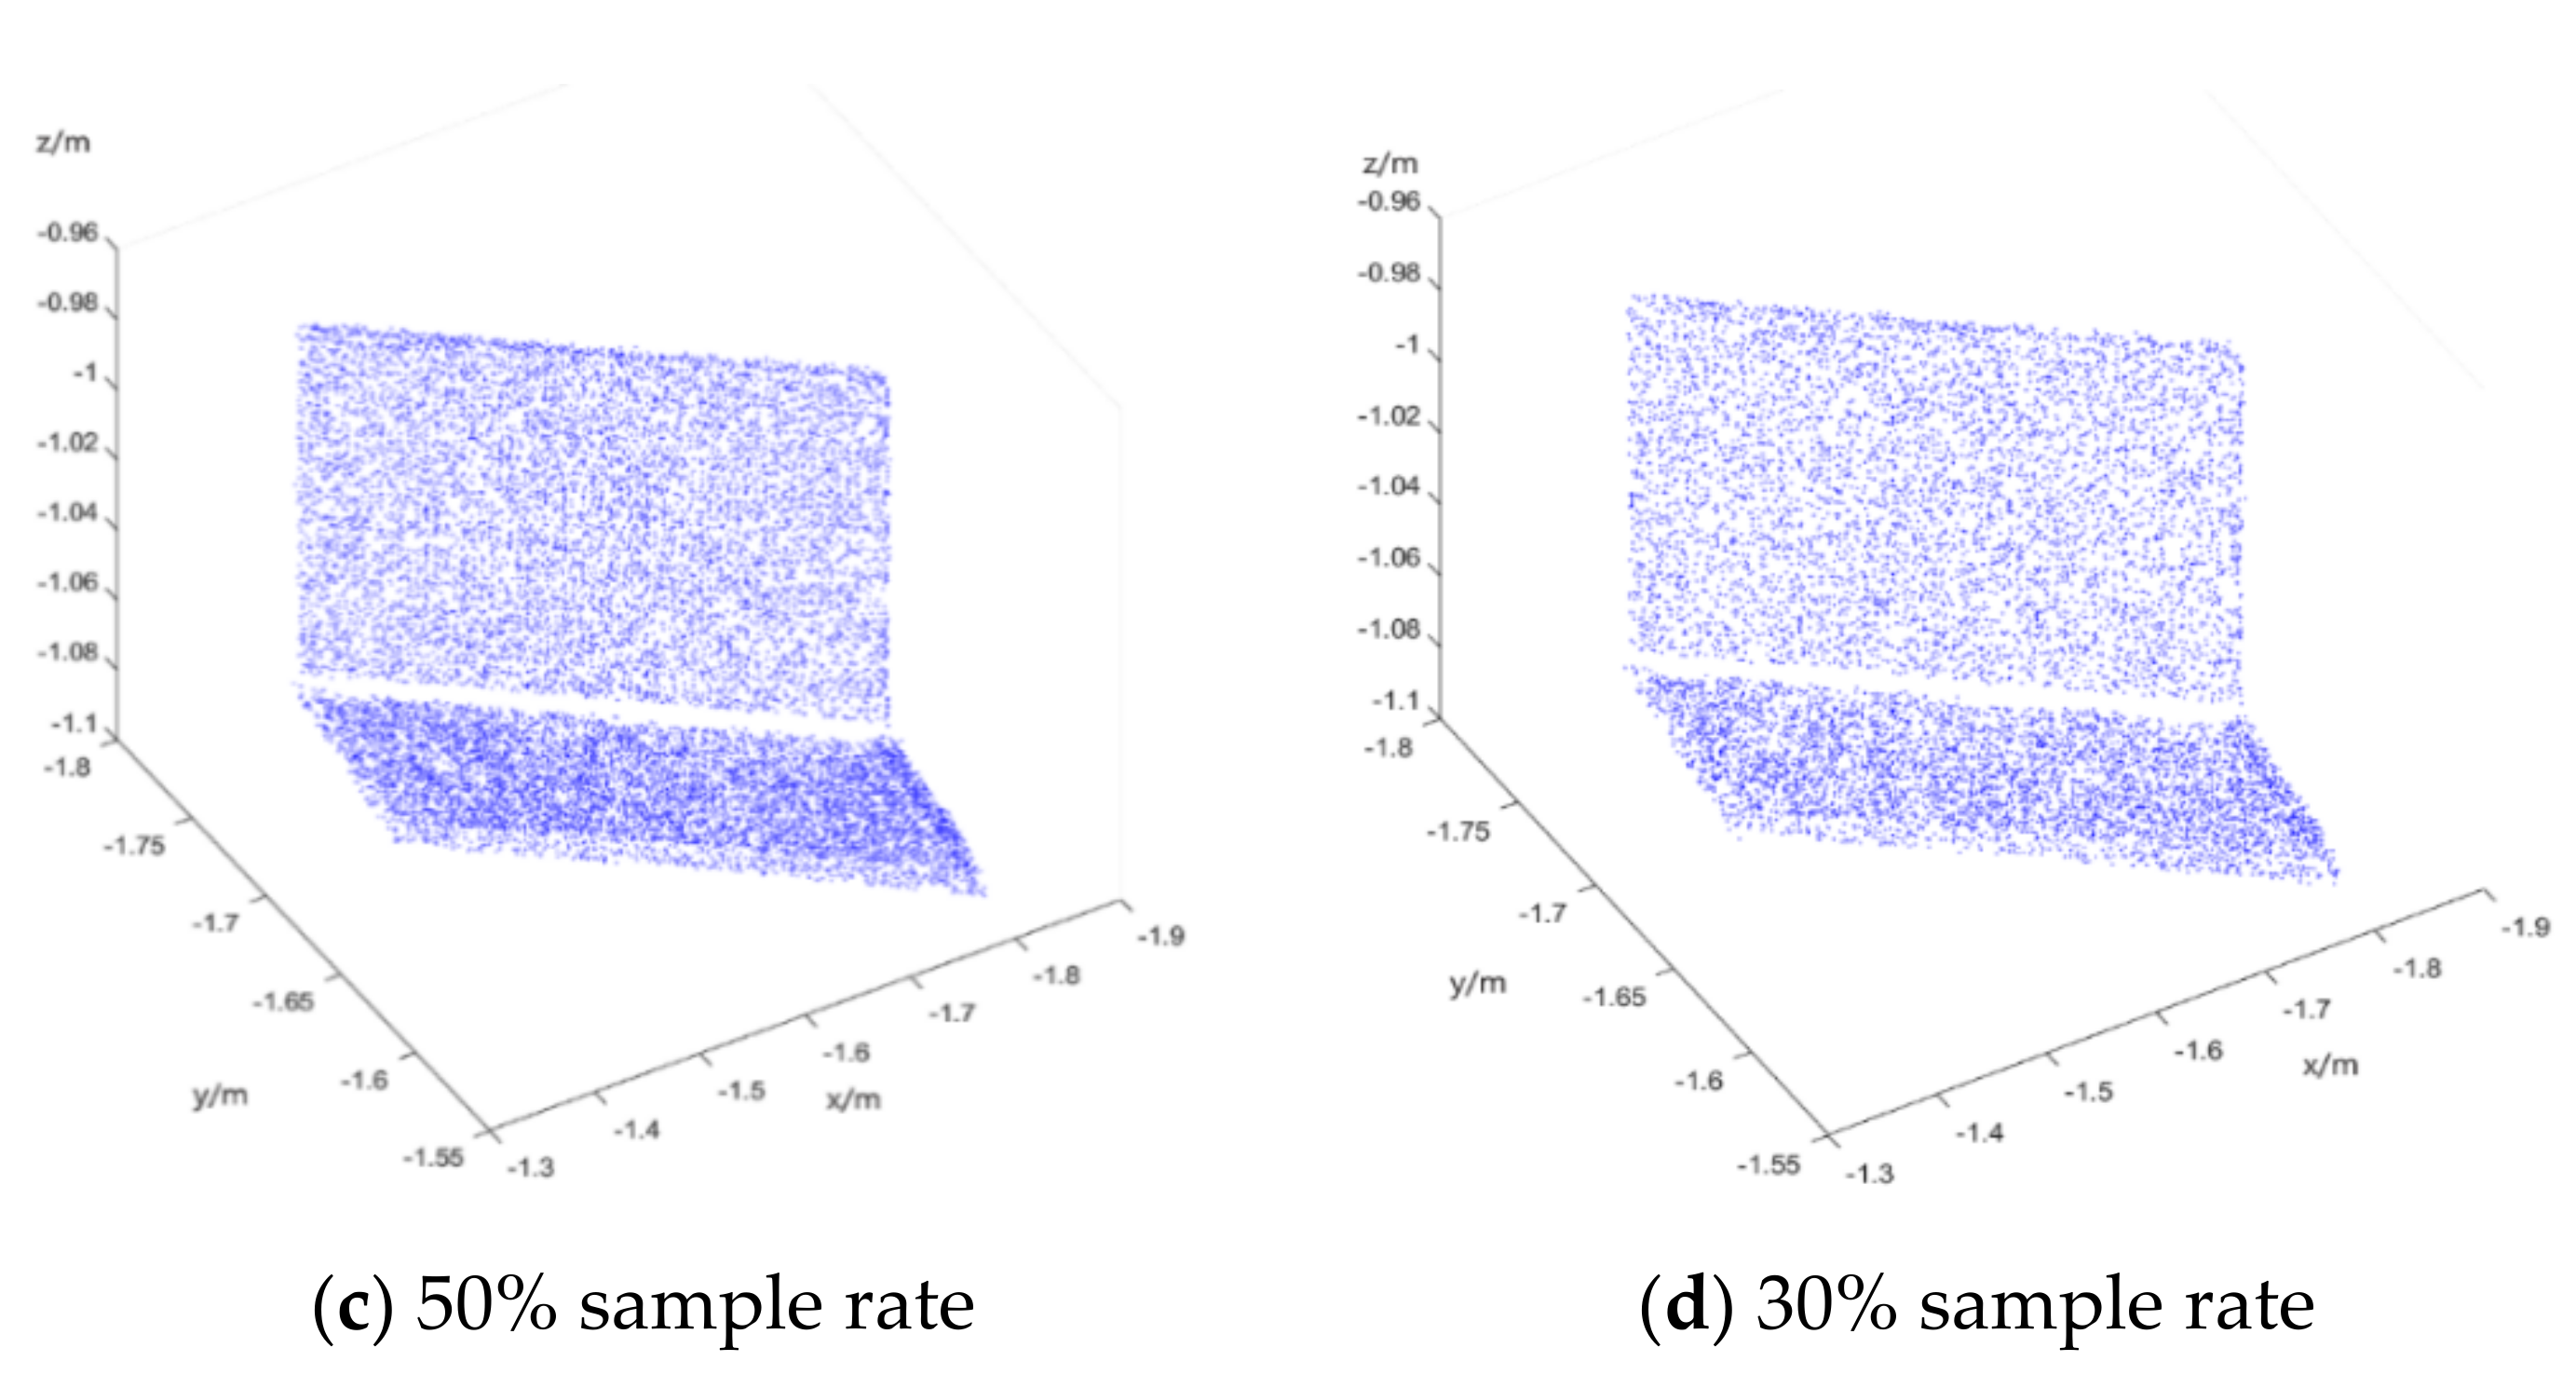
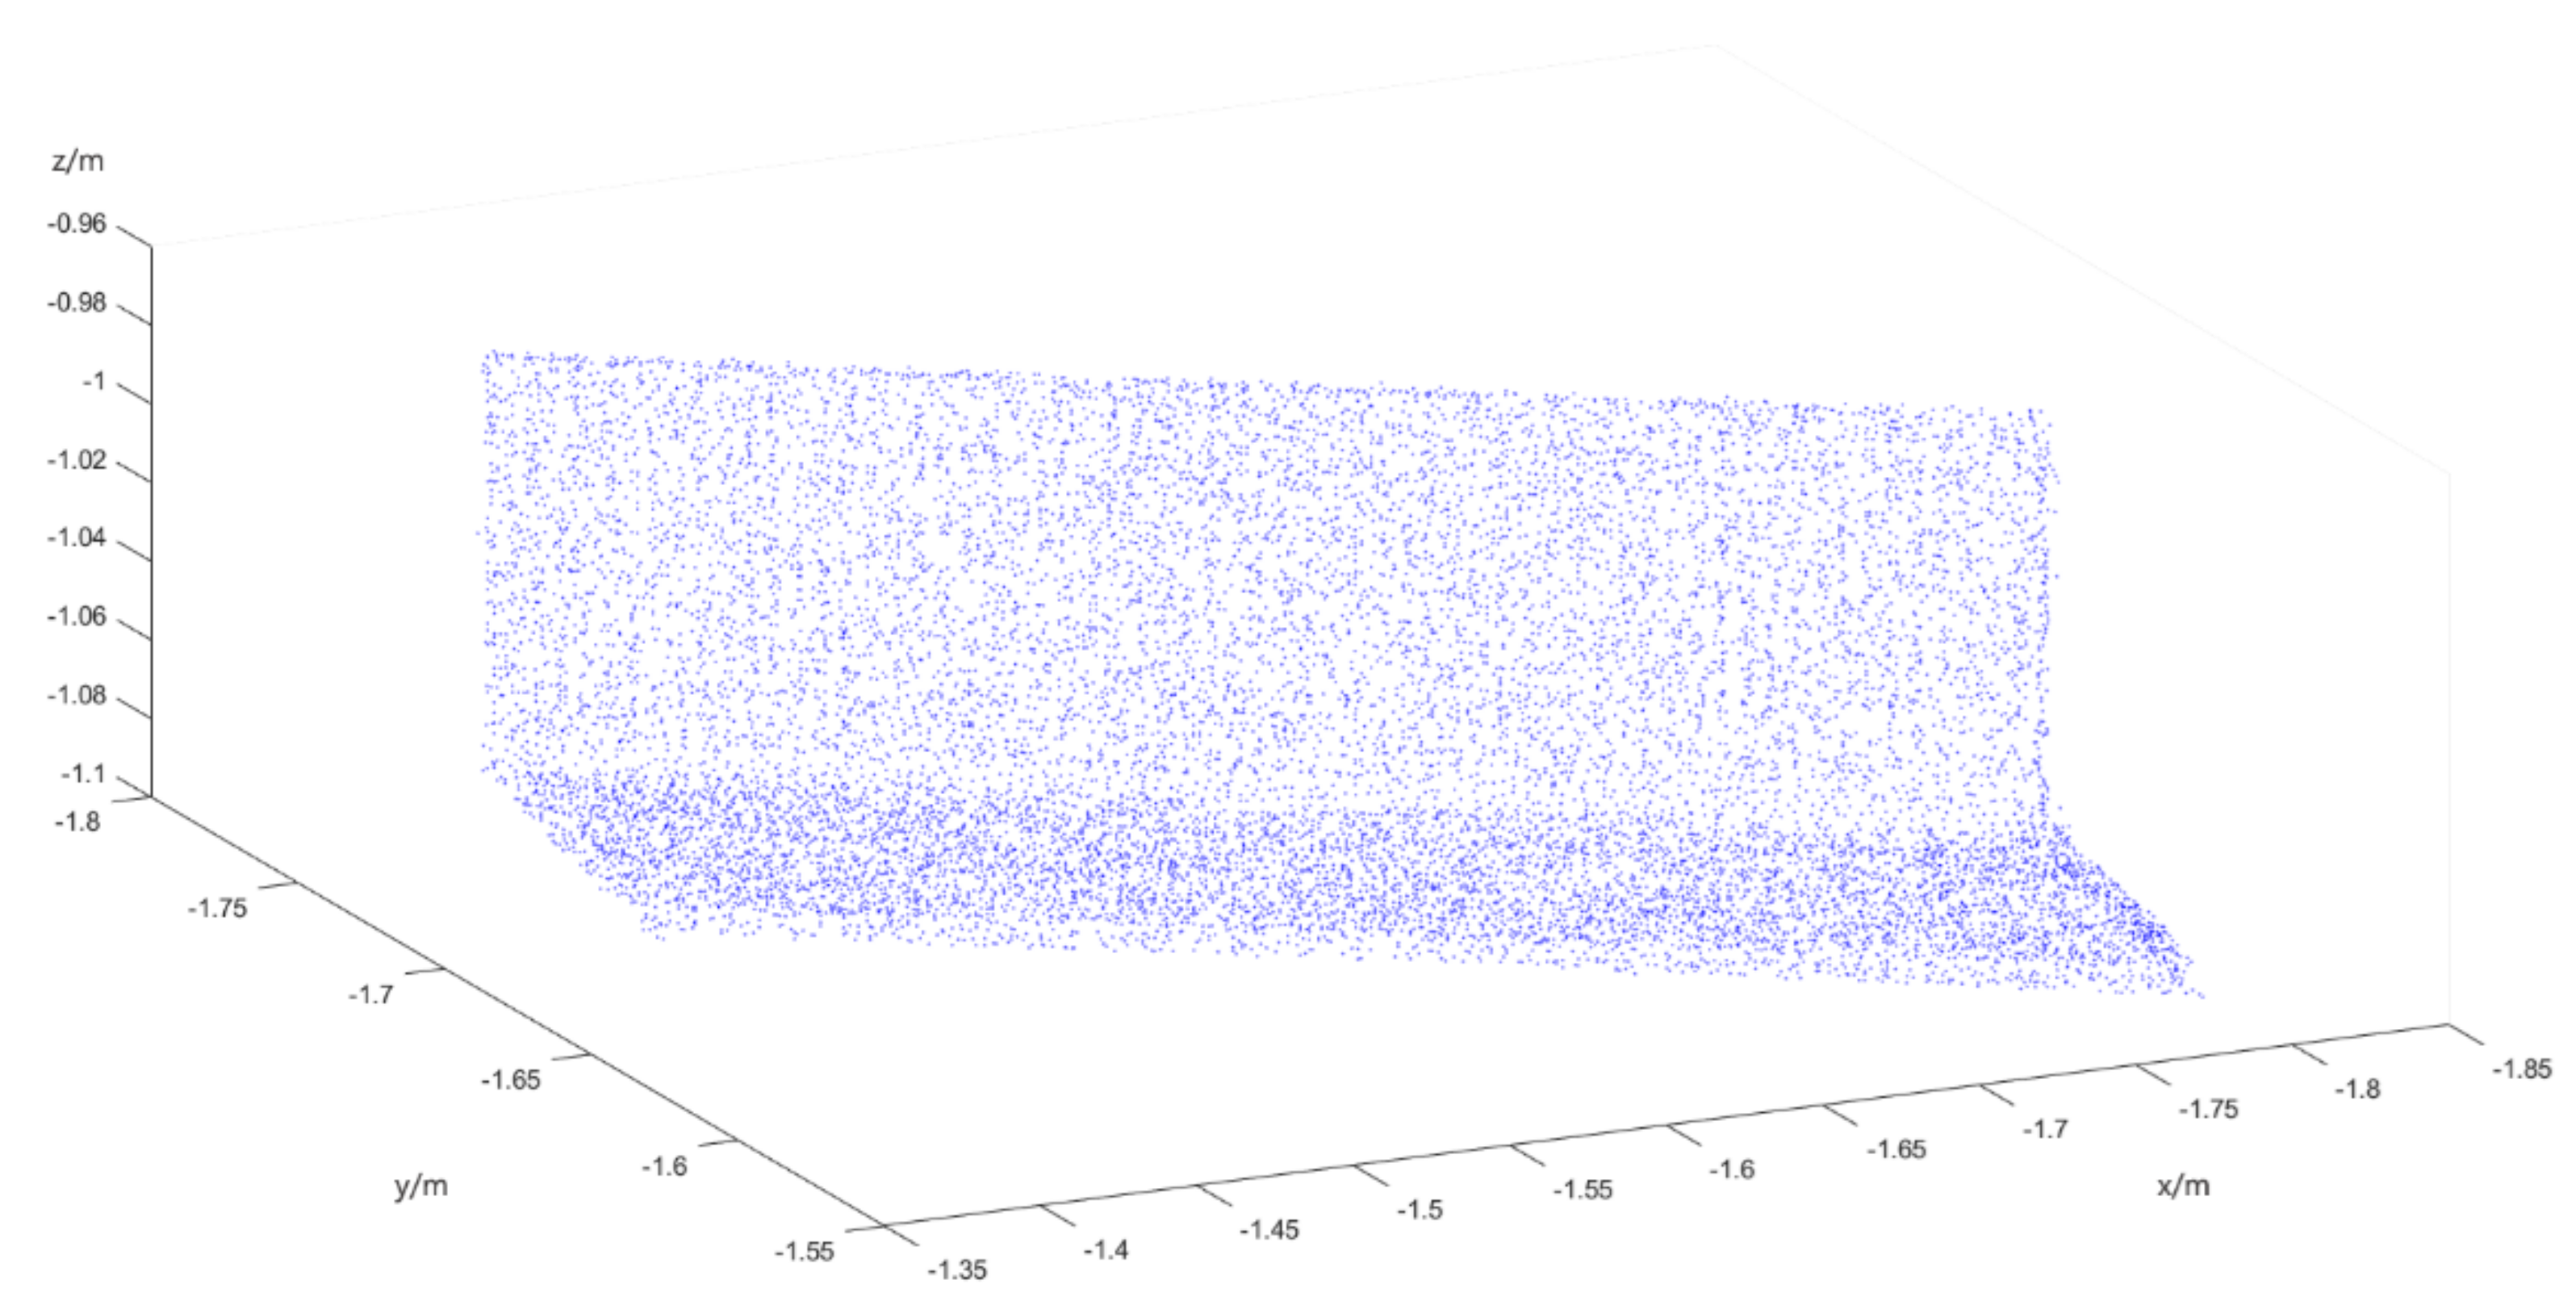
With the improvement of the reduction rate, the shape of the entire measured object can still be seen. Comparing the original point cloud data with the reduced data in Figure 6, it can be seen that the algorithm can reserve the important features for the T-profile steel plate. The original point cloud data of this experiment are divided into areas with relatively flat features of the point cloud, which are simplified by the random sampling method. The experimental results are shown in Figure 6:
As can be seen in Figure 6, the smaller the sampling rate is, the fewer point cloud data points are left. In the flat area, only the complete contour features need to be retained. Considering the time required by the streamlining and its effect, the random sampling method is used to select a sampling rate of 50%. The corresponding reduction rate is 49.20%.
For the region where the point cloud distribution is steep, the regional center of gravity method is simplified. As shown in Figure 7, the point cloud data of the region is better preserved after the regional center of gravity method is simplified.
As can be seen in Figure 7 and Table 1, the smaller the side length of the set sub-cube grid is the more detail features are retained but the lower the processing speed is.
Considering the streamlining time and the retention rate of the feature points in the welding zone, the side length of the sub-cube grid is set to 3 mm when the regional center of gravity reduction method is adopted.
It can be seen in Figure 8 that the point cloud simplification method based on the combination of octree coding and the surface feature curvature threshold is used to preserve important feature points for the welding area of the T-shaped steel plate model. Meanwhile, the outline of the appearance is still good, which can help to extract the key geometric feature positions in the next step.
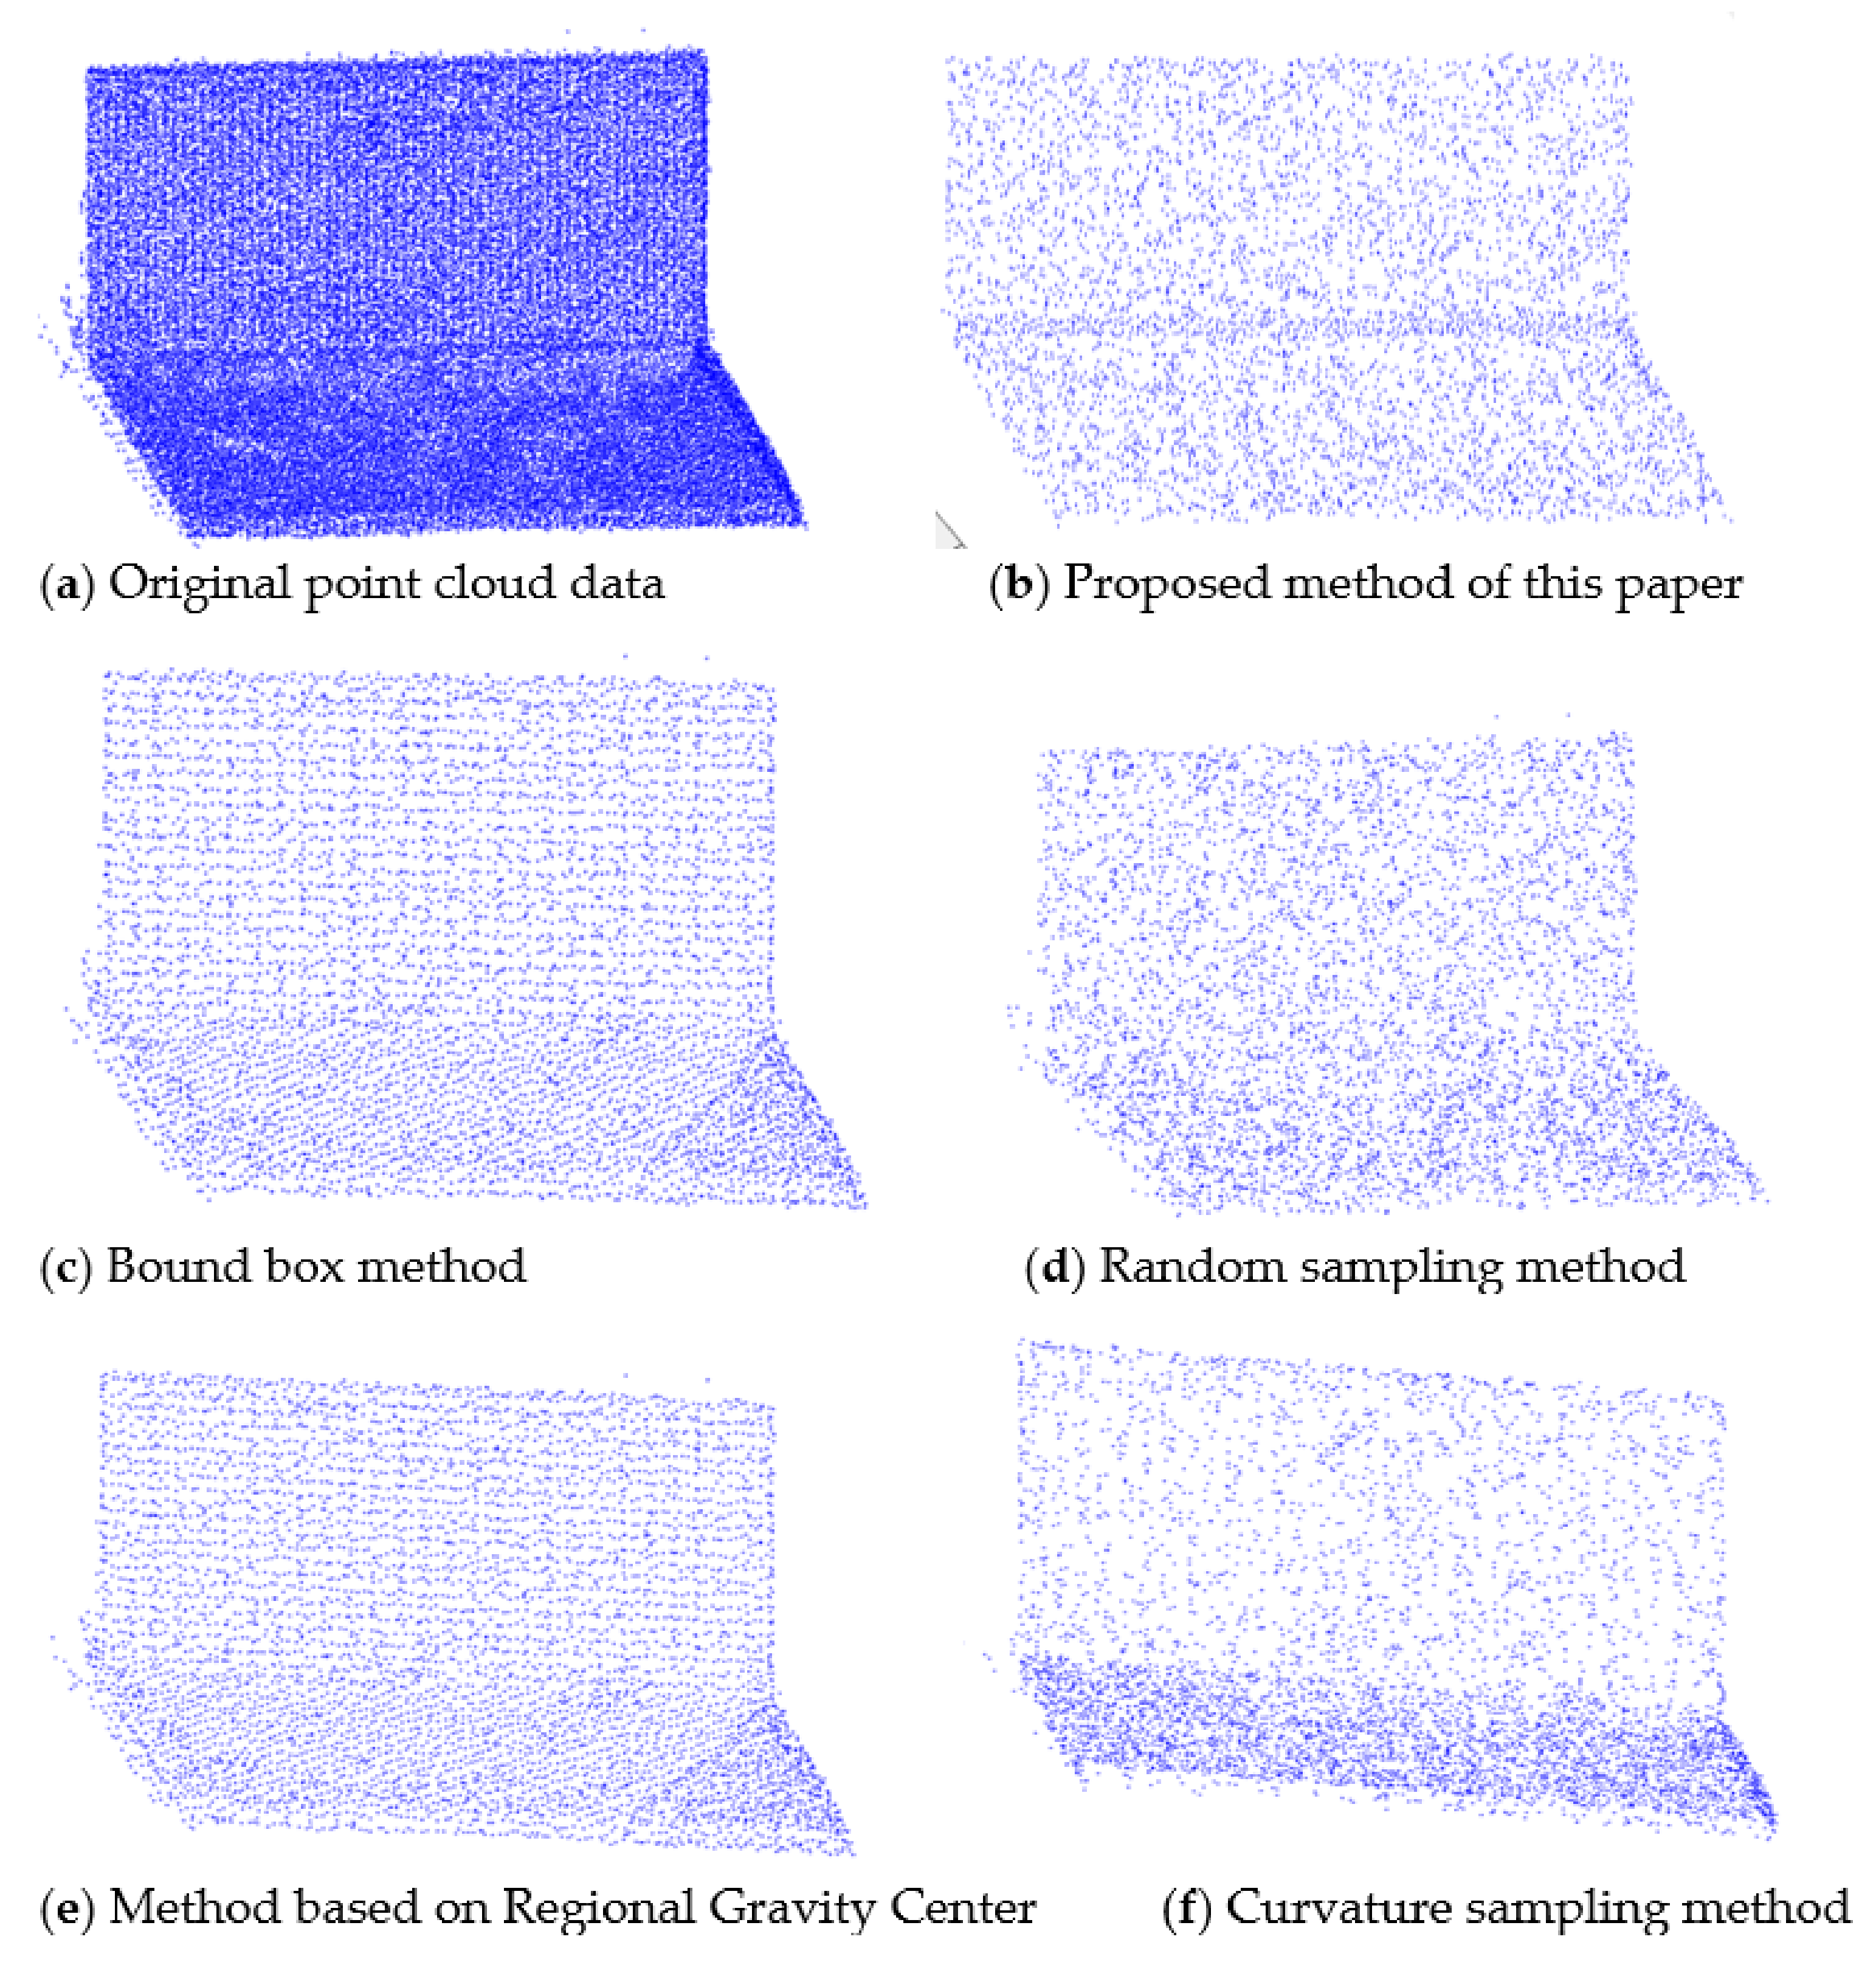
The experimental results of the improved reduced algorithm and the four traditional reduced algorithms are shown in Table 2. The simplified effect of each algorithm is shown in Figure 9.
In order to analyze the performance of the proposed simplification method for the cloud point of the T-profile steel plate, it is compared with four other simplification methods. The results are shown in Table 2 and Figure 9, in which the reduction rates of these methods are kept approximately equal.
Table 2 shows that the processing speeds of the five methods are very different when the reduction rate of point cloud is about 14%. Processing of the random sampling is the fastest method. However, due to the random sampling, many feature points may be lost in the random sampling method, although its required processing time is very short. In this experiment, the curvature sampling method has the longest computation time, which includes the adjacent point searching, the surface fitting, and the curvature calculation steps.
As shows in Table 2, the processing speed of the proposed simplification method is lower than the existing random sampling method. On the other hand, the retention of feature points is better. This is because the octree coding algorithm based on neighborhood point search is used in the proposed method, and the two different simplification algorithms are selected for the regions of different curvatures. As a result, the proposed method can take the advantages of both the random sampling algorithm and the regional center of gravity simplification algorithm.
6. Conclusions
Considering the use of automatic welding of T-profile plates by robots in the shipbuilding process, it is necessary to reduce the point cloud of T-profile plates obtained by laser scanners. In this paper, a point cloud simplification method based on octree coding and the threshold of the surface curvature feature is proposed in order to reduce the point cloud of the T-profile steel plate in shipbuilding. Based on the point cloud characteristics of the T-profile plate in this study, octree coding is used for dividing the point cloud into sub-cubes, and then the curvature features are obtained based on the k-neighborhood search and the curvature calculation. Finally, by combining the two simplification algorithms, the point cloud data of the T-profile plate can be simplified. Through the experiment described in this study, it was found that the proposed simplification method is faster than the other three traditional simplification methods including the bound box method, the method based on regional gravity center, and the curvature sampling method. When the reduction rates are approximately the same, the simplification method proposed in this paper can retain more feature points than the other traditional methods. The proposed method can combine the advantages of both the random sampling simplification method and the regional center of gravity simplification method in different curvature regions, and is able to better preserve the surface characteristics of the T-profile plate under testing.
The study in this paper may be beneficial for shipyards to develop their automatic welding systems. In the future, further research of the point cloud simplification methods are needed for automatic welding of different plates with other profiles. In addition, more point cloud data sets of shipbuilding plates with different profiles will be needed to verify the proposed method.
Author Contributions
Conceptualization, Y.G., C.P., L.W.; methodology, Y.G., C.P.; software, Y.G., C.P., validation, Y.G., C.P.; formal analysis, Y.G., L.W.; investigation, Y.G.; resources, Y.G., C.P., L.W., and B.W.; data curation, Y.G., and C.P.; writing—original draft Preparation, Y.G. and C.P.; writing—review and editing, Y.G., C.P., L.W. and B.W.; visualization, C.P.; supervision, L.W. and B.W.; project administration, B.W.; funding acquisition, B.W. All authors have read and agreed to the published version of the manuscript.
Funding
This study was supported by the Analysis and Test Research Project of Public Welfare Technology Application of Zhejiang Province (No. LGC21F030001), National Key Technologies Research & Development of China (No. 2018YFB2101004) and the Zhejiang Province Key R&D Program Project (No. 2019C03114).
Institutional Review Board Statement
Not applicable.
Informed Consent Statement
Not applicable.
Data Availability Statement
Not applicable.
Acknowledgments
The authors are grateful to Jianqiu Gao for carefully reviewing this paper.
Conflicts of Interest
The authors declare no conflict of interest.
References
- Lin, S.; Guan, Q. Research on current situation and development strategy of welding production in China’s manufacturing industry. Mach. Met. Form. 2014, 10, 16–20. [Google Scholar]
- You, B.H.; Kim, J.W. A study on an automatic seam tracking system by using an electromagnetic sensor for sheet metal arc welding of butt joins. Proc. Inst. Mech. Eng. B J. Eng. Manuf. 2002, 911–920. [Google Scholar] [CrossRef]
- Xu, J.; Yu, M.; Zhen, Y. Survey of Terrestrial 3D Laser Scanners. Geotech. Investig. Surv. 2008, 31–34, In Chinese. [Google Scholar]
- Levoy, M. The digital Michelangelo project: 3D scanning of large statues. In Proceeding of the Conference on Computer Graphics and Interactive Techniques; ACM Press: New York, NY, USA, 2000; pp. 131–144. [Google Scholar]
- Kraus, K.; Pfeifer, N. Determination of terrain models in wooded areas with airborne laser scanner data. ISPRS J. Photogramm. Remote Sens. 1998, 53, 193–203. [Google Scholar] [CrossRef]
- Ma, T. Visible neighborhood graph of point clouds. Graph. Models 2012, 74, 184–196. [Google Scholar] [CrossRef]
- Kammer, J.; Blodow, N. Real-time compression of point cloud streams. In Proceedings of the IEEE International Conference on Robotics and Automation; IEEE: Saint Paul, MN, USA, 2012; pp. 778–785. [Google Scholar]
- Hoppe, H. Progressive meshes. Comput. Graph. 1996, 30, 99–108. [Google Scholar]
- Sanchez, G.L.; Esmeide, L.N. A linear programming approach for 3D point cloud simplification. IAENG Int. J. Comput. Sci. 2017, 44, 60–67. [Google Scholar]
- Zhang, K.; Qiao, S.; Wang, X.; Yang, Y.; Zhang, Y. Feature-preserved point cloud simplification based on natural quadric shape models. Appl. Sci. 2019, 9, 2130. [Google Scholar] [CrossRef] [Green Version]
- Eck, M.; De Rose, T. Muhiresolution analysis of arbitrary meshes. In Proceeding of the SIGGRAPH Computer Graphics; Association for Computing Machiner: New York, NY, USA, 1995; pp. 82–90. [Google Scholar]
- Moenning, C.; Dodgson, N.A. A new point cloud simplification algorithm. In Proceedings of the 3rd IASTED International Conference on Visualization, Imaging, and Image Processing (VIIP 2003), Benalmádena, Spain, 8–10 September 2003; pp. 1–6. [Google Scholar]
- Dey, T.K.; Giesen, J.; Hudson, J. Decimating samples for mesh simplification. In Proceedings of the 13th Canadian Conference on Computational Geometry, Waterloo, ON, Canada, 13–15 August 2001; pp. 85–88. [Google Scholar]
- Luebke, D.P. A developer’s survey of polygonal simplification algorithms. IEEE Comput. Graph. Appl. 2001, 21, 24–35. [Google Scholar] [CrossRef]
- Cignoni, P.; Montani, C.; Scopigno, R. A comparison of mesh simplification algorithms. Comput. Graph. 1998, 22, 37–54. [Google Scholar] [CrossRef]
- Yi, X.; Tang, P. An improved point cloud data combination reduction algorithm. Wirel. Internet Technol. 2016, 7, 94–97. [Google Scholar]
- Sun, Z. Simplified algorithm for calculating random point clouds facing surface reconstruction of hull plates. Mech. Des. Manuf. 2014, 9, 228–231. [Google Scholar]
- Shao, Z.; Xi, P. Data reduction for point cloud using octree coding. J. Eng. Graph. 2010, 31, 73–77. [Google Scholar]
- Shi, B.-Q.; Liang, J.; Liu, Q. Adaptive simplification of point cloud using k-means clustering. Comput. Aided Des. 2011, 43, 910–922. [Google Scholar] [CrossRef]
- Whelan, T.; Ma, L.; Bondarev, E.; de With, P.H.N.; McDonald, J. Incremental and batch planar simplification of dense point cloud maps. Robot. Auton. Syst. 2015, 69, 3–14. [Google Scholar] [CrossRef] [Green Version]
- Rodriguez, J.; Denia, J.L.; Navarro, P.; Herráez, J.; Yudici, S.; Martin, M.T. Optimal modelling of buildings through simultaneous automatic simplifications of point clouds obtained with a laser scanner. Measurement 2016, 93, 243–251. [Google Scholar]
- Han, H.; Han, X.; Sun, F.; Huang, C. Point cloud simplification with preserved edge based on normal vector. Opt. Int. J. Light Electron Opt. 2015, 126, 2157–2162. [Google Scholar] [CrossRef]
- Zhou, L.; Ling, H. Research on measured point cloud reduction methods in surface reconstruction. Mach. Des. Manuf. Eng. 2004, 3, 102–104. [Google Scholar]
- Xiao, Z.X.; Huang, W.M. Kd-tree based nonumuiform simplification of 3D point cloud. In Proceedings of the third International Conference on Genetic and Evolutionary Computing, Guilin, China, 14 October 2009; pp. 339–342. [Google Scholar]
- Zhang, L. Research on the Technology of the Three-Dimensional Surface Reconstruction from Scattered Point Cloud. Ph.D. Thesis, Nation University of Defense Technology, Changsha, China, 2009. (In Chinese). [Google Scholar]
- Bentley, J.L. Multidimensional binary search trees used for associative searching. Commun. ACM 1975, 18, 509–517. [Google Scholar] [CrossRef]
- Xiong, B.; He, M.; Yu, H. Algorithm for finding k-nearest neighbors of scattered points in three dimension. J. Comput. Aided Des. Comput. Graph. 2004, 16, 909–912. [Google Scholar]
- Wang, P.; Pan, Z.; Xu, M. A fast and lossless compression algorithm for point-based models based on local minimal spanning tree. J. Comput. Res. Dev. 2011, 48, 1263–1268. [Google Scholar]
- Zhou, R.; Zhang, L.; Su, X. Algorithmic research on surface reconstruction from dense scattered points. J. Softw. 2001, 12, 249–255. [Google Scholar]
- Ni, M.; He, X.; Xue, Y. Research on the algorithm for topology reconstruction of scattered point cloud. Mach. Des. Manuf. 2010, 20, 3126–3131. [Google Scholar]
- Leica Geosystems AG. HDS7000 User Manual. Available online: http://w3.leica-geosystems.com/downloads123/hds/general/HDS7000/manuals/HDS7000_UserManual_en.pdf (accessed on 10 June 2021).
- Tao, W.; Wang, H.; Zhou, C.; Li, G.; Liu, F. A random demodulation based reduced sampling rate method for wideband digital predistortion. In Proceedings of the Asia-Pacific Microwave Conference (APMC), Nanjing, China, 6–9 December 2015; pp. 1–3. [Google Scholar]
- Li, T. 3D Point Cloud Data Processing and Application. Master’s Thesis, Kunming University of Science and Technology, Kunming, China, 2011. [Google Scholar]
Figure 1.
T-profile steel plate for shipbuilding after welding.

Figure 2.
The main procedures of the proposed simplification method.

Figure 3.
Octree partition space model.

Figure 4.
Simplification profile based on the regional gravity center.

Figure 5.
Point cloud distribution area of T-profile steel plate.

Figure 6.
Simplified results with different sample rates.


Figure 7.
Different simplification effects under the bounding box with different side lengths.

Figure 8.
The effect of point cloud reduction after using this algorithm.

Figure 9.
Five algorithms to simplify the T-profile steel plate.


Table 1.
Simplified result indicators under different side length bounding boxes.
| Name | Set Side Length 2 mm | Set Side Length 3 mm | Set Side Length 4 mm |
|---|---|---|---|
| Original point cloud data volume | 1534 | 1534 | 1534 |
| Remaining point number | 913 | 465 | 291 |
| Reduction rate of point cloud | 59.52% | 30.31% | 19.36% |
| Processing time | 4.0826 s | 1.4228 s | 0.8965 s |
Table 2.
Comparison results for five simplification methods of point cloud data of T-profile plate.
| Algorithm Name | Algorithm Proposed in This Paper | Bound Box Method | Random Sampling Method | Method Based on Regional Gravity Center | Curvature Sampling Method |
|---|---|---|---|---|---|
| Total point cloud data | 37734 | 37734 | 37734 | 37734 | 37734 |
| Remaining point number | 5545 | 5517 | 5514 | 5517 | 5581 |
| Reduction rate of point cloud | 14.70% | 14.62% | 14.61% | 14.62% | 14.79% |
| Retention rate of weld area feature points | 30.31% | 10.61% | 9.24% | 13.25% | 12.78% |
| Processing time | 2.9261 s | 14.534 s | 0.724 s | 12.283 s | 18.873 s |
Publisher’s Note: MDPI stays neutral with regard to jurisdictional claims in published maps and institutional affiliations. |
© 2021 by the authors. Licensee MDPI, Basel, Switzerland. This article is an open access article distributed under the terms and conditions of the Creative Commons Attribution (CC BY) license (https://creativecommons.org/licenses/by/4.0/).
Share and Cite
MDPI and ACS Style
Gao, Y.; Ping, C.; Wang, L.; Wang, B. A Simplification Method for Point Cloud of T-Profile Steel Plate for Shipbuilding. Algorithms 2021, 14, 202. https://0-doi-org.brum.beds.ac.uk/10.3390/a14070202
AMA Style
Gao Y, Ping C, Wang L, Wang B. A Simplification Method for Point Cloud of T-Profile Steel Plate for Shipbuilding. Algorithms. 2021; 14(7):202. https://0-doi-org.brum.beds.ac.uk/10.3390/a14070202
Chicago/Turabian StyleGao, Yanfeng, Cicao Ping, Ling Wang, and Binrui Wang. 2021. "A Simplification Method for Point Cloud of T-Profile Steel Plate for Shipbuilding" Algorithms 14, no. 7: 202. https://0-doi-org.brum.beds.ac.uk/10.3390/a14070202
Note that from the first issue of 2016, this journal uses article numbers instead of page numbers. See further details here.