Article

Myocardial Infarction Quantification from Late Gadolinium Enhancement MRI Using Top-Hat Transforms and Neural Networks

by
Ezequiel de la Rosa
1,
Désiré Sidibé
1,
Thomas Decourselle
2,
Thibault Leclercq
3,
Alexandre Cochet
1,3 and
Alain Lalande
1,3,*
1
ImViA, University of Burgundy, 21000 Dijon, France
2
Casis Company, 21800 Quetigny, France
3
Department of Radiology, University Hospital of Dijon, 21000 Dijon, France
*
Author to whom correspondence should be addressed.
Submission received: 30 June 2021 / Revised: 12 August 2021 / Accepted: 17 August 2021 / Published: 20 August 2021

Abstract

:
Late gadolinium enhancement (LGE) MRI is the gold standard technique for myocardial viability assessment. Although the technique accurately reflects the damaged tissue, there is no clinical standard to quantify myocardial infarction (MI). Moreover, commercial software used in clinical practice are mostly semi-automatic, and hence require direct intervention of experts. In this work, a new automatic method for MI quantification from LGE-MRI is proposed. Our novel segmentation approach is devised for accurately detecting not only hyper-enhanced lesions, but also microvascular obstruction areas. Moreover, it includes a myocardial disease detection step which extends the algorithm for working under healthy scans. The method is based on a cascade approach where firstly, diseased slices are identified by a convolutional neural network (CNN). Secondly, by means of morphological operations a fast coarse scar segmentation is obtained. Thirdly, the segmentation is refined by a boundary-voxel reclassification strategy using an ensemble of very light CNNs. We tested the method on a LGE-MRI database with healthy (n = 20) and diseased (n = 80) cases following a 5-fold cross-validation scheme. Our approach segmented myocardial scars with an average Dice coefficient of 77.22 ± 14.3% and with a volumetric error of 1.0 ± 6.9 cm 3 . In a comparison against nine reference algorithms, the proposed method achieved the highest agreement in volumetric scar quantification with the expert delineations (p< 0.001 when compared to the other approaches). Moreover, it was able to reproduce the scar segmentation intra- and inter-rater variability. Our approach was shown to be a good first attempt towards automatic and accurate myocardial scar segmentation, although validation over larger LGE-MRI databases is needed.

1. Introduction

Late gadolinium enhancement (LGE) MRI is the cornerstone of myocardial tissue characterization [1], representing the most accurate and highest resolution method for myocardial infarction (MI) and non-ischemic cardiomyopathies diagnosis. It allows, as well, risk stratification and outcome prediction after revascularization or cardiac resynchronization therapies. Currently, LGE inversion recovery and phase sensitive inversion recovery are considered as the gold standards for myocardial viability assessment [2]. Imaging is generally conducted after 10 min of gadolinium injection, which over-enhances infarcted myocardium by accumulation of the agent in the damaged tissue. In healthy tissue areas, there is no abnormal accumulation of contrast agent thanks to the fast gadolinium wash in and wash out and, as a consequence the normal myocardium, remains hypointense [3]. By means of experimental studies, it was exhibited that the contrast distribution accurately reflects pathology of the myocardium [4]. In patients where the revascularization therapy fails, severe and extensive damage of the myocardium might be observed due to the permanent microvascular obstruction (MVO, also known as no-reflow) phenomenon [3,5,6]. The accurate diagnosis of the MVO is important since it evidences the lack of reperfusion of some myocardial area even after the ending of the ischemic event, indicating severe ischemic disease and being associated with poor prognosis, adverse left ventricular remodeling, adverse cardiac events and death [7].
The main limitations of LGE-MRI for myocardial tissue assessment are not only due to technical parameters setting (such as slice thickness, inversion recovery, etc.), but mainly due to the lack of a clinical standard for scar tissue quantification [8,9]. Thus, nowadays there is no reference method for abnormal tissue detection and segmentation, even though several techniques have been explored. The most frequently used techniques are the threshold-based ones, such as the full-width at half-maximum (FWHM) [10] and the n-standard deviations (from now on n-SD) [4]. Although Flett et al. [11] obtained good performance and reproducibility for the FWHM method, the works of Spiewak et al. [12] and Zhang et al. [13] reported controversial results for both techniques. While manual delineations have the drawback of being subjective [8], threshold-based methods are prone to inaccuracies, suffer from intra- and inter-rater variation [14], and may lead to false-positive detections when operating over healthy images. As such, these methods ( i ) require visual identification of diseased myocardium before quantifying the lesions and ( i i ) can only detect the hyper-enhanced scar tissue since MVO areas are not addressed. In this work, a new LGE-MRI infarction quantification method is devised. The main contributions of this work are: ( i ) the automatic myocardial lesion detection and quantification, ( i i ) the a priori discrimination of healthy and diseased myocardium slices, which extends the algorithm application for working under healthy scenarios, ( i i i ) the incorporation of a dedicated MVO segmentation step and ( i v ) the validation of the algorithm on an LGE-MRI database accounting with hyper-enhanced and MVO ground truth areas.

2. Background and Related Works

This section is split into two main fields: ( i ) the analysis of myocardial damage detection techniques and ( i i ) the reference algorithms used for myocardial infarction quantification.

2.1. Myocardial Damage Detection

Segmentation of the myocardial scar has been widely addressed in many works, where methods have been mainly validated under pathological datasets. Thus, before segmenting the scar area, myocardial abnormality identification by visual inspection is performed, as in n-SD [4] and FHWM [10] methods. By means of this approach, the lesion’s search is only guaranteed in the abnormal myocardium, reducing potential false positives in healthy scans. Despite the fact that these methods are able to better control the false positive rate, one of the drawbacks is the required expert interaction. Under this scenario, the development of an automatic method that could deal with healthy patients as well is highly desired. Devising such a method based on intensity myocardial profiles could be conducted by characterizing healthy and abnormal myocardium histograms. In previous works, healthy and scarred myocardial tissue distributions have been well described [15,16,17]. According to [15], a Rayleigh distribution might appropriately model the normal tissue, while hyper-enhanced infarcted areas can suitably be modeled by a Gaussian one. Thus, the whole myocardium histogram consists on the resulting distribution obtained from the overlapped healthy and abnormal tissues. For the sake of simplicity, assumption of both distributions as Gaussian models has been extensively used [8,18,19,20]. Hennemuth et al. [15] proposed the use of information criteria (Akaike and Bayesian ones) for histogram characterization. Thus, by assessing the best histogram model fit a normal or abnormal myocardium could be identified. However, the main limitation of this approach regards the expectation-maximization algorithm performance. Due to the considerable intensity overlap in diseased cases, the method may sub-optimally estimate the parameters of both tissue (healthy and abnormal) distributions. Moreover, in small myocardial lesions, the scarred tissue distribution is obscured by the healthy one, turning the method inaccurate. These limitations suggest that the problem could be better addressed by extracting more complex features (and not only intensity-based ones). In this sense, some initial attempts using deep learning were performed in CT scans for detecting coronary artery stenoses [21].

2.2. Myocardial Infarction Segmentation

Intensity-based segmentation algorithms have been widely investigated and validated in clinical practice. In these techniques, the histogram thresholding is conducted in a semi-automatic [4,10,22] or automatic approach [19,23]. While the FWHM method [10] requires the manual identification of a hyper-enhanced zone, the n-SD [4] method requires the manual identification of a remote myocardial one. Given that these approaches cannot deal with the overlapping tissue distribution areas, several studies extended or combined them by using more sophisticated tools. Common works recombined the thresholding techniques [11,24,25] or used intensity features with connected component analysis [16,20,26], clustering [27,28] or support-vector-machines (SVM) [29,30]. Graph-cuts [17,31], watershed [15,32] and continuous max-flow [33,34] algorithms have received researchers’ attention as well. Currently, with the advent of GPUs, there is an increasing interest in deep-learning based strategies given their outstanding performance, speed and user-free operation. Under certain databases (such as large, multi-scanner and multi-center) and training considerations, convolutional neural networks (CNN) have shown robustness not only for handling image variability (coming from acquisition differences like voxel resolution, noise, artifacts, intensity distributions, etc.), but also for handling the inherent patient one (such as cardiac shape, location, and lesion configuration differences). In this regard, CNNs have been explored for segmentation of myocardial scars in 2D [35,36] and 3D [37,38,39,40] LGE-MRI sequences. In [35,36], a 2D fully CNN based on the ENet [41] model was proposed for left ventricle scar segmentation. The best model found by the authors reached a ∼71% Dice coefficient over a 30-subject cohort. Segmentation of 3D LGE-MRI images was initially explored in [37] by means of a 2D patch-based CNN and was later extended to a 3D CNN model [38]. In their 3D outperforming proposal, the authors conducted a binary ( H e a l t h y vs. D i s e a s e d ) voxel-wise classification of the myocardial area using downsampled MRI images. A high ∼93% Dice coefficient was found over a 34-subject cohort. The work was later enhanced by including a left ventricle cavity segmentation model in the pipeline [42]. In [43], a deep learning fusion of LGE with cine MRI images was proposed for improving the scar segmentation performance. The segmentation of a t r i a l scars using deep learning has also been explored. In [39], a super-pixel feature-extraction algorithm followed by a binary classification with stacked sparse autoencoders was proposed. More recently, Yang et al. [40] proposed a similar super-pixel approach where classification was performed with SVMs instead.
Despite the vast techniques exploration, up to now there is no reference method for scar quantification [8] and mostly the threshold-based methods are implemented on clinical workstations. The considered reference approaches comprise the n-SD and FWHM, even when their variability, reproducibility and lack of expert agreement were highly discussed [12,13]. For these reasons, the development of automatic approaches that could better reproduce the experts’ delineations becomes highly valuable.

3. Material and Methods

3.1. Data Acquisition

One-hundred randomly chosen late-gadolinium enhanced MRI cases (20 healthy, 80 with attested MI) from the University Hospital of Dijon were included in this study. Gadolinium contrast solution (Dotarem, Guerbet, France) was administered to the patients between 8 and 10 min before conducting the study. Balanced cases of acute and chronic myocardial infarctions were included. Besides, thirty-five percent of infarcted cases (n = 28) presented micro-vascular obstruction areas. For all patients, a short-axis stack of cardiac images covering the whole left ventricle was acquired using one of the two clinical MRI devices with magnetic fields of 1.5T and 3T (Siemens Healthineers, Erlangen, Germany). A T1-weighted phase sensitive inversion recovery sequence with slice thickness of 8 mm and slice gap of 2 mm was performed (TR = 3.5 ms, TE = 1.42 ms, TI = 400 ms, flip angle = 20). Voxel size differed among scans between 1.25 mm× 1.25 mm to 1.91 mm × 1.91 mm.
The dataset ground truths were delineated in each slice by an expert of the institution (AL) with more than 15 years of expertise in the field. The endocardial and epicardial boundaries were contoured (papillary muscles were included in the cardiac cavity as recommended [44]) and in pathological cases the scar tissue was annotated taking separate contours for enhanced and MVO areas. Although the concentration of the contrast agent in the myocardium is influenced by several external factors (such as the type of contrast media and dose, the renal clearance, the delay between contrast injection and image acquisition, the MRI sequence parameters, etc.) [45], in our dataset the contrast media injection protocol and the MR acquisition parameters have been preserved. As such, the MRI signal intensity variability was reduced to the remaining external factors only. In late enhancement studies (as performed in this work), the fibrotic area appears bright in T1-weighted MRI. The MVO areas in T1-weighted MRI appear, instead, hypo-intense (i.e., black) regardless of the time-delay between the contrast agent injection and the image acquisition [45]. When present, the hypo-intense MVO areas are typically surrounded by hyper-intense (bright) regions.
For assessing intra- and inter-rater annotations variability, a random subset of pathological cases (50%, n = 40) were fully re-contoured by the same expert as well as by a second one (TL, a cardiologist with 5 years of experience in the field).

3.2. Proposed Method

In this work, a new method for detection and quantification of myocardial infarction from short-axis cardiac LGE-MRI is presented. The method comprises two blocks, which target the identification of diseased images and afterwards their segmentation. Firstly, healthy and pathological scans are discriminated using a classifier. Secondly, the scar tissue is segmented by an initial fast coarse segmentation followed by a voxel reclassification refinement strategy. The preference of a 2D pipeline instead of the 3D one relies on the poor resolution along the Z-axis and on the potential shift of the diaphragm position during two consecutive breath-holds, which affects the cardiac location in the images. The outputs of the algorithm are the delineated scarred areas with their corresponding clinical biomarkers.

3.2.1. Data Pre-Processing

Collected MRI scans present differences among them mainly in ( i ) voxel size and ( i i ) intensity values. While the former differences come from the setting of diverse scanning parameters, the latter differences may come from the use of different magnetic field devices (which account with diverse signal to noise levels) as well as by the inherent biological and anatomical patients variability. For homogenizing the scans, all volumes were pre-processed by following three steps. Firstly, high-frequency noise was removed by using a spatial adaptive non-local means filter with automatic noise level estimation [46]. The chosen algorithm allows tackling not only the intra-patient noise level differences in the scan, but also the inter-patient one observed by the use of different MRI magnetic field devices. Secondly, volumes were resliced to reach an homogenous voxel size of 1.25 mm × 1.25 mm × 8 mm (minimum voxel size found among patients). Thirdly, after contrast enhancement with a gamma function ( I o u t = I i n γ , γ > 0 ), intensity normalization within the epicardium inner region ([0–255]) was performed for reducing intra- and inter-patient image variability. Since the contrast agent tissue concentration changes within time and the intensities become brighter from the mitral valve to the apex causing inter-slice variability [12], slice normalization was performed by taking into account the left ventricular myocardium and blood-pool regions.

3.2.2. Myocardial Abnormality Detection

In this step, a binary classifier is built for discriminating healthy and pathological images. Considering that in most slices the area defined by the epicardium resembles a disk, its centroid is estimated. Afterwards, cropped images (size 89 × 89, 3-channel replicated) masked within the myocardium and centroid-centered are used as inputs of the classifier. Note that a rough estimation of the centroid is only needed, since the aim of this step is just image cropping. The motivation for cropping the images is for helping the CNN training by reducing the processing area [36] and for allowing the algorithm to run in portable laptops with a small GPU.
Working phase. For achieving the classification task, a three-step approach is conducted: ( i ) Fine-tuned VGG19 [34] models are used for extracting informative features characterizing the myocardial images. ( i i ) Extracted features followed a principal component analysis dimensionality reduction by their projection into the learned principal-components space. ( i i i ) Images are finally classified as healthy or infarcted by using SVM.
Training phase I: Feature extraction. The ImageNet pretrained VGG19 [47] model was chosen over other network architectures (such as VGG16, Resnet50, Resnet101, and GoogleNet) based on an exploratory performance analysis. In previous works, the model shows suitability and good adaptability for working in the medical domain [48,49]. Since the main aim of this block is to devise a robust image classifier, only experiments with the achieved outperforming network are shown. The model was fine-tuned using MR images by preserving all layers and their corresponding weights with exception of the three ending fully-connected layers (FCL), whose neuron weights were re-learned. Besides, after the last 1000-neuron FCL, an extra 2-neuron FCL with a softmax layer were added for conducting the required binary classification ( H e a l t h y vs. D i s e a s e d ). The network training parameters are summarized on Table 1. For the replaced FCL, the learning rate was 30 times higher than the value shown on the table. Data imbalance was addressed by randomly under-sampling in each training epoch the majority class until reaching the minority class size [50,51]. Considering the dataset size limitations and with the aim of overfitting avoidance we ( i ) performed data augmentation for increasing the training set by considering random geometric image transformations (rotation, shearing, flipping and scaling) ( i i ) shuffled the training set in every epoch, ( i i i ) applied a random dropout [52] of 50% after each fully connected layer and ( i v ) applied an early-stopping criterion by monitoring the validation set loss.
Once the network was fine-tuned, the whole training set was re-fed to the fitted network and image features were extracted from the 1000-FCL. Afterwards, the matrix of observations X N x 1000 (where N is the number of training samples) was built.
Training phase II: Classifier fitting. For conducting dimensionality reduction, a principal component analysis was performed. The K principal components (K < < 1000) that preserve 95% of the data variance were retained. Afterwards, with the reduced observation matrix X N x K a SVM with linear kernel was fitted for classifying normal and infarcted myocardium images. The SVM cost parameter was empirically chosen in a cross-validation scheme.
Model validation. One-hundred random dataset splits were conducted in a class balanced 80-10-10% (training-validation-test) approach by including all subject slices in the same subset. For each training/validation set, fine tuning of VGG19, dimensionality reduction and SVM fitting were performed. Afterwards, over the test-set, the label prediction was performed. Obtained classifiers were characterized and evaluated by means of a receiver-operating characteristic (ROC) curve analysis. Besides, to further validate whether the discriminant SVM rule could be randomly achieved, a one-hundred permutation analysis over H e a l t h y vs. D i s e a s e d cases was performed. Obtained ROC area under the curve (AUC) values were used as a global performance metric for comparing permuted and un-permuted classifier results.

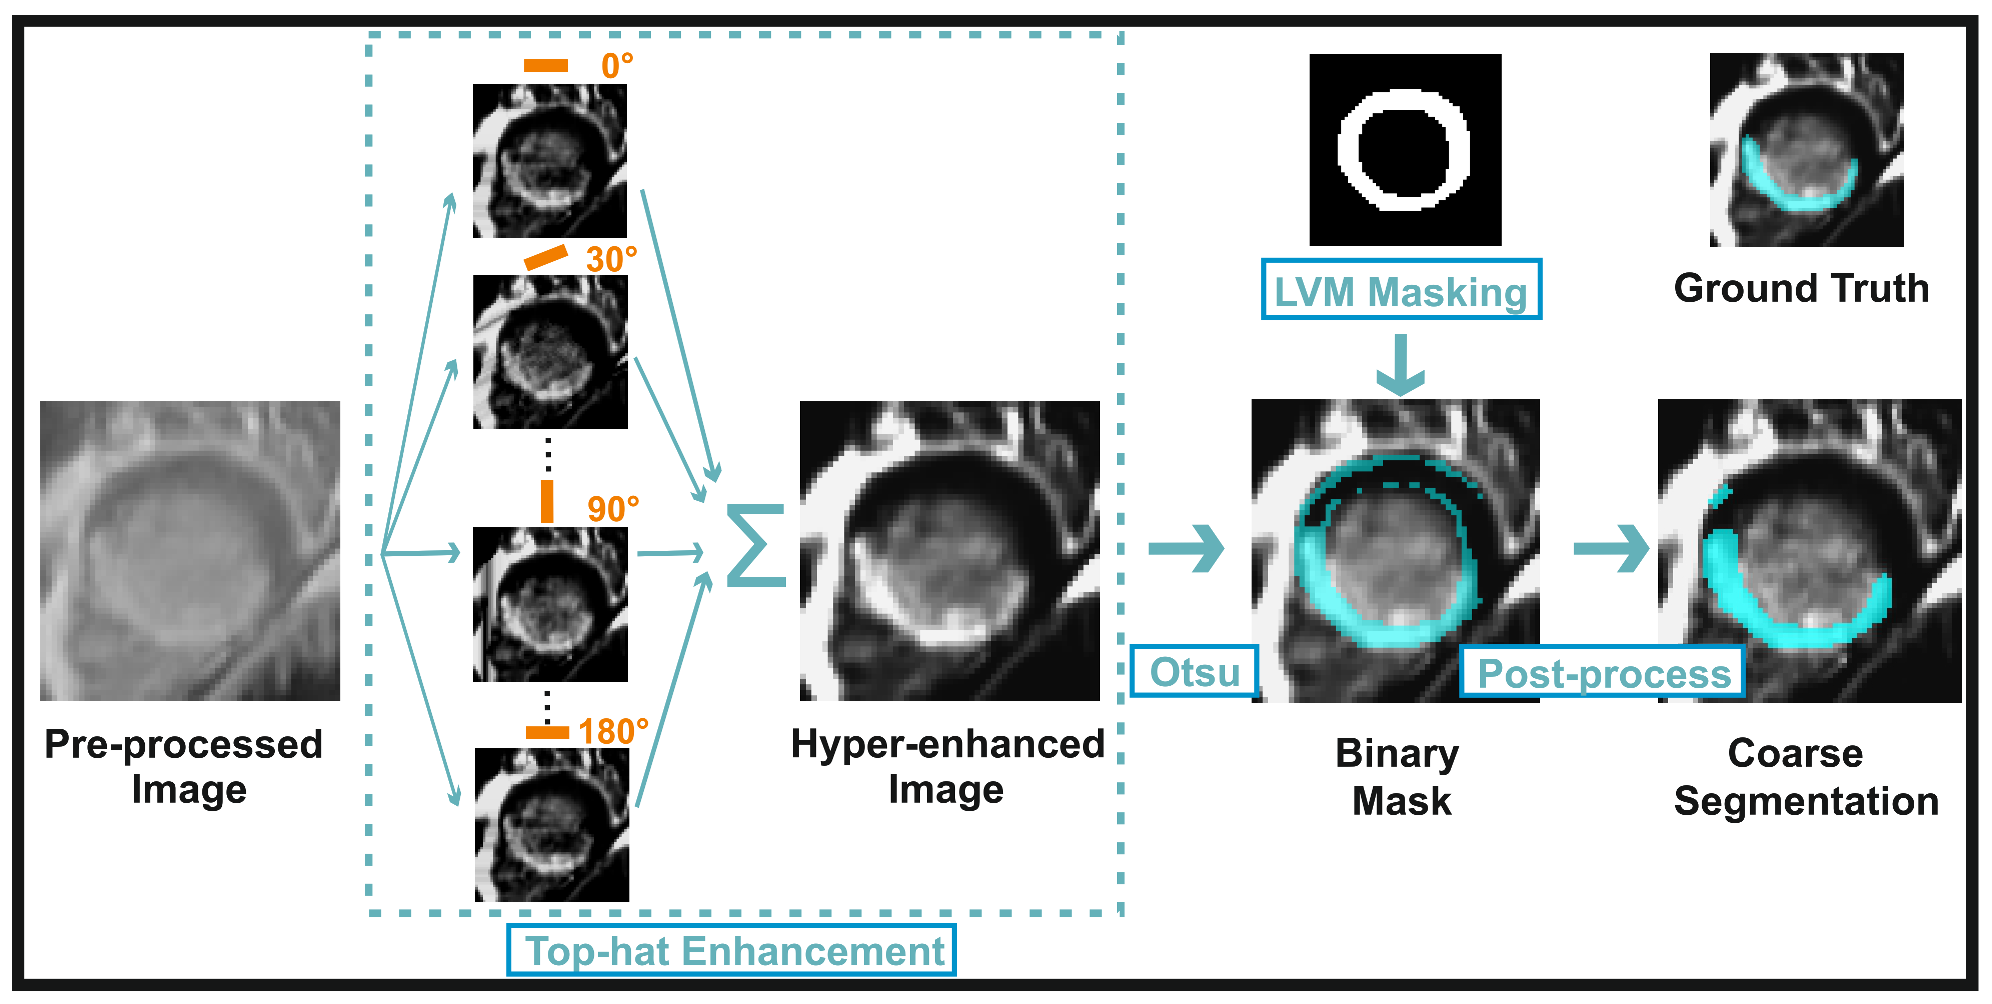
3.2.3. Myocardial Scar Quantification: Coarse Segmentation

Myocardial infarction was initially segmented after over-enhancing potential damaged regions using the non-parametric top-hat transform, as similarly conducted in other fields [53,54,55]. The enhancement was performed by using a sum of top-hats, which increases the contrast between dark and bright image areas (healthy and damaged regions, respectively). The transform was applied in each slice using a 2D bar rotational structuring element with increasing variations of 30 and a constant length of 34 pixels. The enhancement reduced the overlapping areas of the healthy and scar distributions due to partial volume effect, helping the tissues discrimination by using Otsu’s algorithm [23]. Structuring element shape, length and rotation-degree were empirically selected by maximizing the segmentation performance over the training set. Subsequently, a morphological opening (disk as structuring element, radius 1 pixel) was applied for removing small misclassified voxel clusters. The coarse segmentation workflow is shown on Figure 1.

3.2.4. Myocardial Scar Quantification: Refined Segmentation

Working phase. After achieving an initial segmentation of the potential damaged areas, inspired by the work of Jia et al. [49] a voxel-level segmentation refinement was followed by using an ensemble of from-scratch trained CNNs. Although in the initial segmentation most lesions are detected within their core or more evident damaged areas, the method might provide misclassifications due to the overlapping healthy and infarcted intensity distributions. Thus, false positives removal (or false negatives inclusion) were tackled by a voxel reclassification approach using image patches centered at the voxels of interest. Voxels falling in a boundary region surrounding the coarse segmentation were re-classified with the aim of including in the analysis only the potentially misclassified ones. The boundary region was taken by subtracting to the morphologically dilated mask the morphologically eroded one. A disk as a structuring element with radius of 2 pixels was considered. The degree of the morphological operations was experimentally chosen by assuring a mean sensitivity of 95% over the dilated masks on the training set. Voxel label prediction was achieved afterwards by majority voting after passing each patch over a seven-component CNN ensemble. The whole refinement segmentation workflow can be appreciated in Figure 2b.
CNN architecture. The CNN model of Figure 2a was used for the re-classification of voxels falling in the boundary of the coarse mask. The binary classification CNN (healthy vs. scar) consisted in a modified single-branch version of the architecture proposed for left ventricular myocardium segmentation in [21]. The network received input patches of size 49 × 49. By using 2D convolutional blocks, max-pooling operations and FCLs, the central-patch voxel prediction was obtained through a single neuron output layer. Unlike the original implementation, rectified linear units were used as activation functions [56].
CNN’s training phase. The network was trained from scratch by extracting boundary patches taken from the training set in a 50%-50% class balanced way. Ground-truth masks were dilated and eroded by using a disk of radius 5. Then, healthy-class patches were taken from the mask obtained after subtracting to the dilated mask the original ground-truth. Likewise, infarcted-class patches were extracted from the mask obtained after subtracting to the original infarction mask the eroded mask. In cases were the lesions were small (and hence the erosion operation degraded the whole mask) patches from the entire mask were taken. The reason for preferring boundary-close voxels instead of central ones relies on the difficulty for their detection, since partial volume effect and the so-called gray-zone areas [20] make the tissue separation difficult. Voxel-centered patches were extracted with high information overlap (stride of 3 voxels) in order to help the network learning process [57]. A summary of the parameters used during the training phase is shown on Table 1. In all cases, patches were zero-centered by subtracting the mean image of the training set. Overfitting avoidance and data balancing were conducted as described earlier in Section 3.2.2. The network training process converged after 50 epochs. The classifiers ensemble was built by training CNNs in a 7-fold cross-validation strategy over the considered training set. Networks were trained in the same fashion. Validation of the method was performed using 5-fold cross-validation (80–20% of patients as training/test sets, respectively, in each fold).

3.2.5. Myocardial Scar Quantification: MVO Inclusion

To include MVO areas, we took advantage of the pathological anatomy prior information provided by MVO structure. Indeed, MVO is represented by hypointense regions neighboring the hyperintense areas [58]. Besides, infarction is always propagated from the endocardial cavity towards the epicardial one [3], assuring connectedness of the enhanced scar tissue volume with the blood-pool area. Mainly, MVO is found in the images as a dark cluster of voxels ( i ) confined by the endocardial and enhanced areas or ( i i ) fully enclosed in the enhanced region. For MVO inclusion, the union of the endocardial and hyperintense infarction masks was computed for finding all voxels clusters fulfilling the hypothesis. Afterwards, holes were filled providing a unique infarction segmentation mask including dark and bright pixel areas. The MVO inclusion strategy is illustrated in Figure 2c.

3.2.6. Comparison against Previous Methods

In order to evaluate the proposed infarction segmentation algorithm performance, results were compared against nine standard algorithms widely used in clinical practice: the n-SD (n = 1, 2, , 6) [4], Otsu [23], FWHM (implementation of [26]) and Gaussian mixture models (with threshold at 2-SD above the mean healthy intensity [19]).
Statistical analysis were conducted by first inspecting data behavior and then applying a t-Student or Mann–Whitney U tests when appropriate. For t-Student test, normality was firstly checked by using the Shapiro–Wilk test while homoscedasticity was verified by data distribution inspection. Two-tailed tests with a 0.05 significance level were performed in all cases. Image classification was assessed by sensitivity, specificity and accuracy metrics. Besides, characterization of the built classifier was evaluated by the area under the ROC curve. Mean and standard deviation of AUC values were reported. For assessing the model robustness in the ROC permutation analysis, the p-value was computed as follows:
p = i = 1 N I ( A U C i p , A U C i n p ) N
where N = 100 is the amount of data splits (and permutations) conducted, A U C i p and A U C i n p are the obtained AUC values for the permuted and un-permuted i-th dataset split, respectively, and the indicator function I is defined as follows:
I ( A U C i p , A U C i n p ) = 1 i f A U C i p A U C i n p 0 i f A U C i p < A U C i n p
Given the 2D implementation of our algorithm, all method’s segmentation performance were assessed by Dice similarity indexes and Hausdorff distances in 2D [32]. The scarred myocardial volume (cm 3 ) and percentage of infarcted myocardium ( % V o l s c a r V o l m y o c a r d i u m ) were quantified for assessing clinical markers’ estimation performance. Results were compared with the expert annotations by using Spearman correlation coefficient and Bland–Altman [59] analysis (mean and standard deviation of bias are provided).

4. Results

4.1. Myocardial Abnormality Detection

4.1.1. Model Selection

The herein proposed classifier was chosen after comparing the model against a normal end-to-end fine-tuned VGG19. In this latter model, the network was fine-tuned in the same fashion as described in Section 3.2.2, but the final prediction over the test-set was directly conducted by the network. Performance results for the models are shown in Table 2. The chosen model outperformed the VGG19 fine-tuned one in terms of sensitivity and accuracy in a maximum-a posteriori prediction. Even more, the metric variances were lower for the selected classifier.

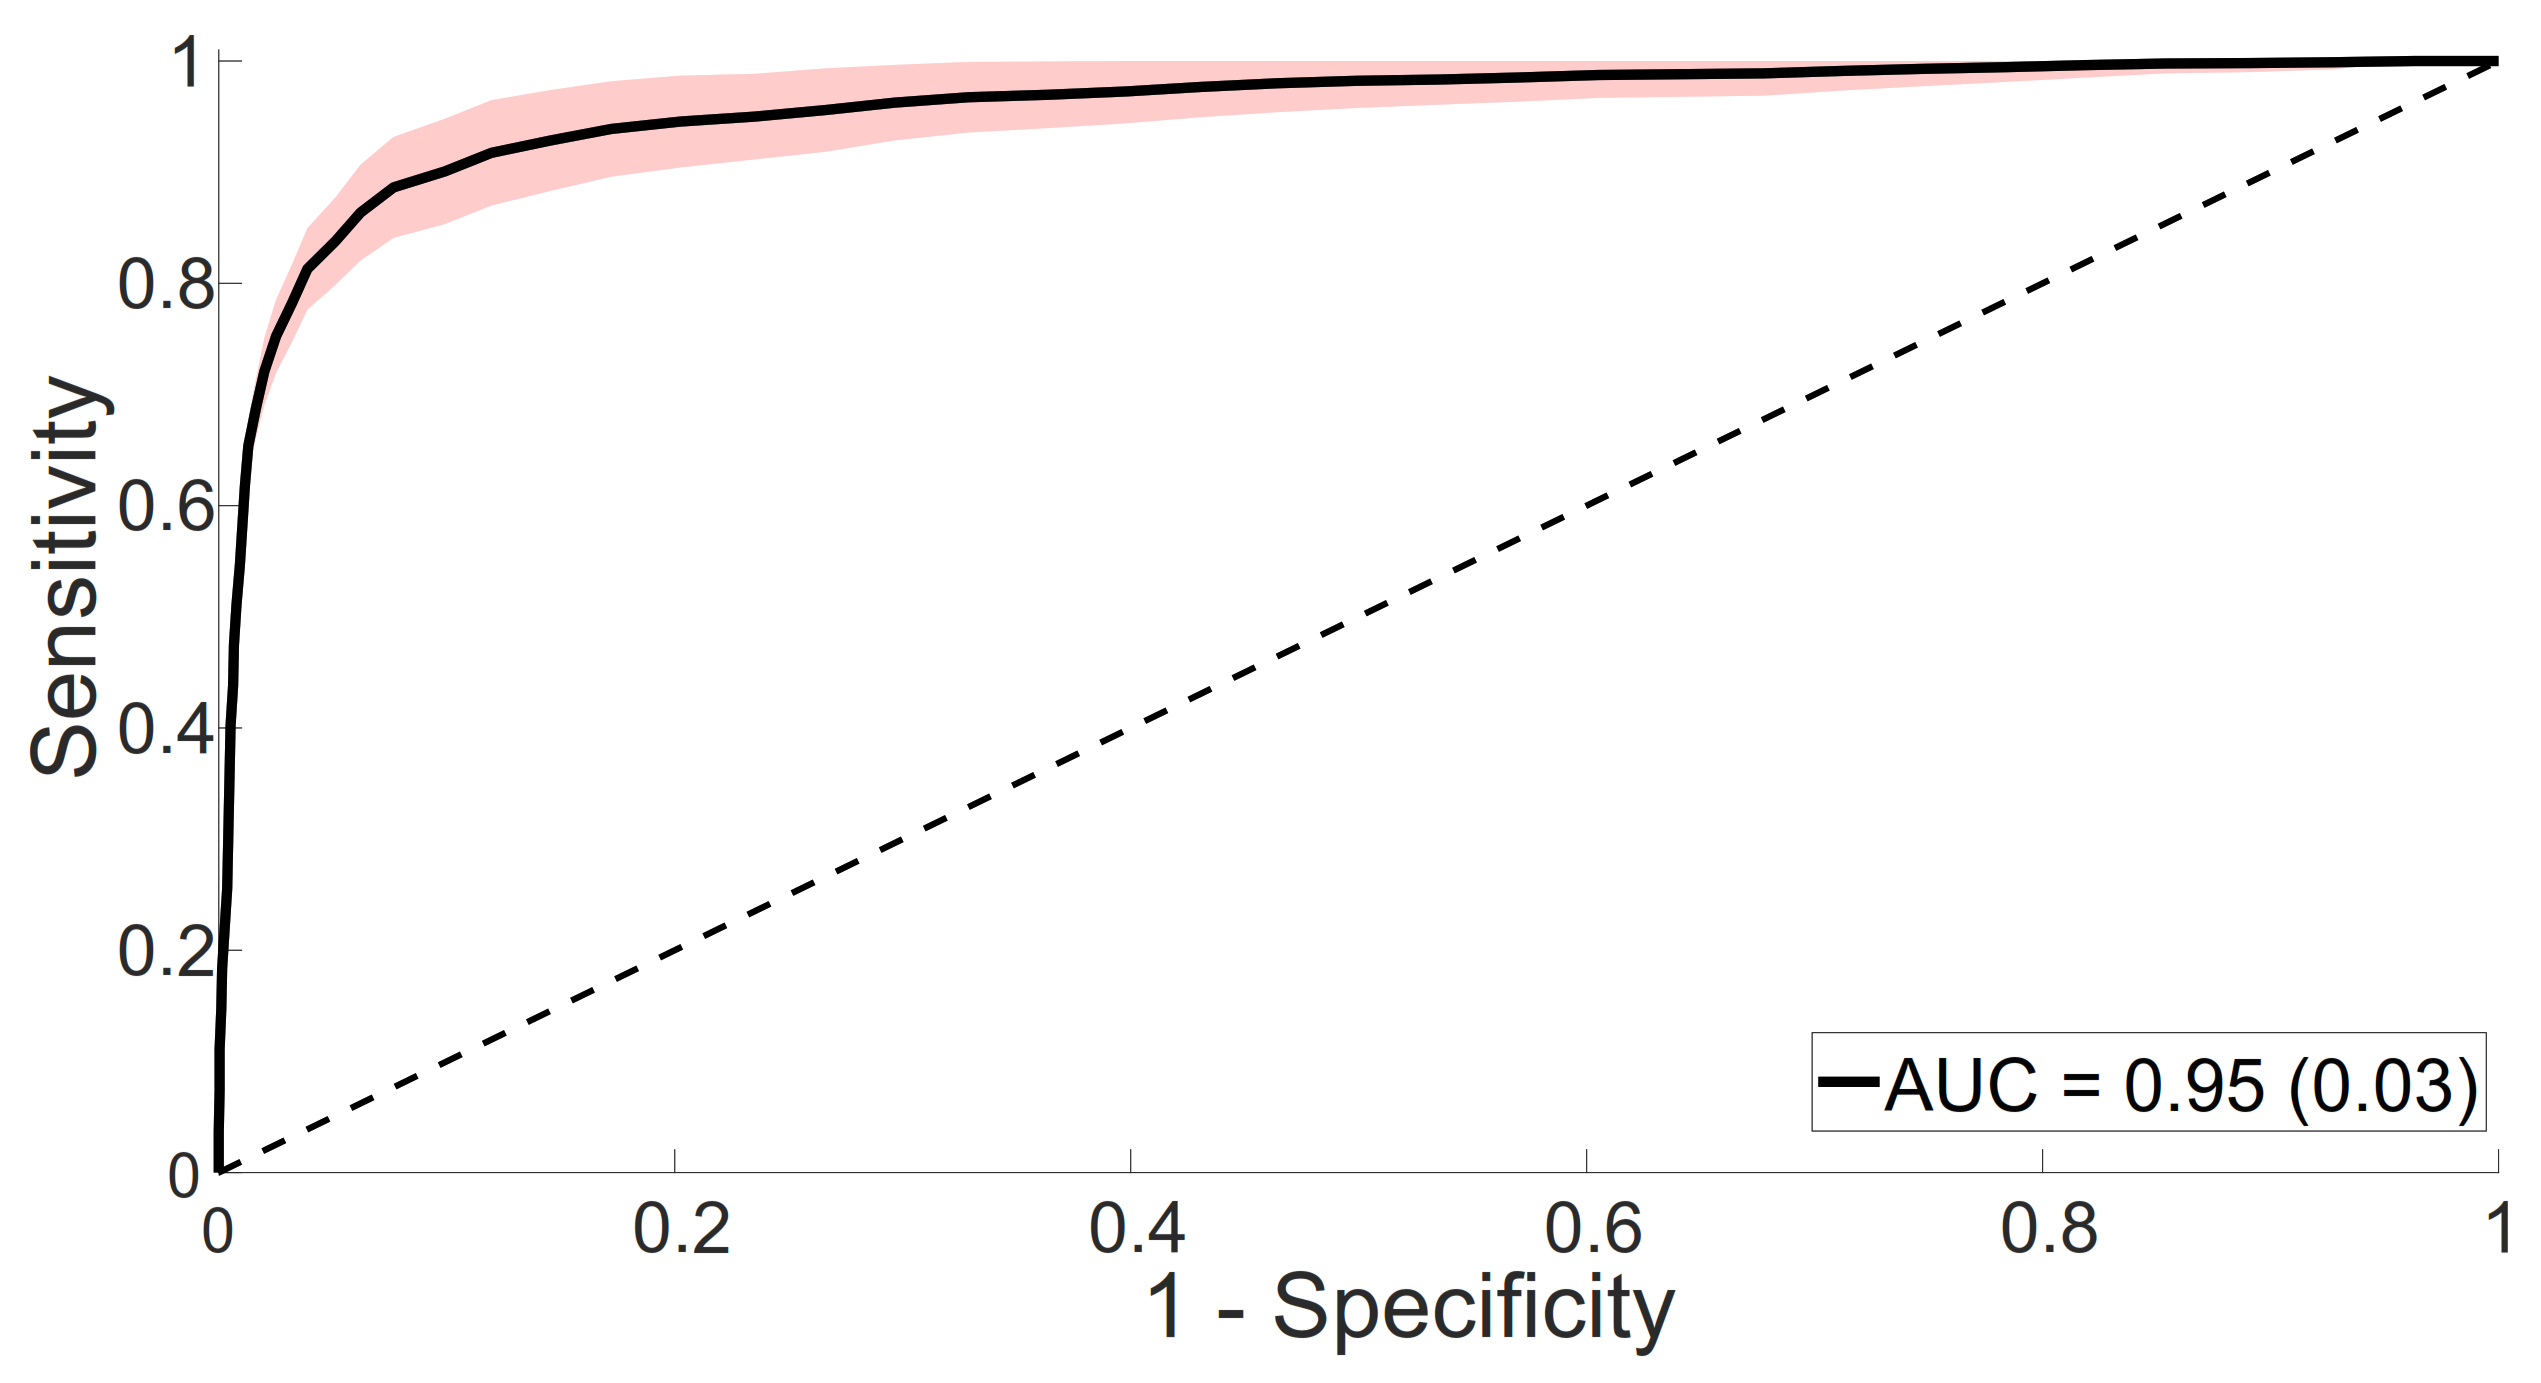
4.1.2. Classifier Evaluation

The AUC value obtained on the ROC analysis was 0.95 ± 0.03 for the proposed classifier (Figure 3). The results obtained under 100-random splits scenarios show high performance stability and low variance. Since the classifier will be used to decide whether or not the segmentation lesion search algorithm should be applied in each image, it is not equally important to have false positive or negative detections. Thus, each pathological image misclassified as a healthy one will not be assessed by the segmentation algorithm and their damaged areas will be lost from the analysis. On the other hand, misclassified healthy images into pathological ones might tend to produce an over-segmentation of the lesion. Under this scenario the classifier was set up for assuring high-sensitivity performance. When moving the decision rule threshold for addressing this goal we obtained for sensitivities of 90%, 92.5%, 95% and 97.5% corresponding specificity values of 90%, 85.4%, 73.3% and 57.3%.
The last experiment of this section involved a ROC permutation analysis. There were consistent AUC distribution differences between permuted and un-permuted data, which showed statistical significance (p < 0.05, paired t-Student test). For the random dataset configurations there was no permutation outperforming in AUC terms the original data configuration.

4.2. Myocardial Scar Segmentation and Quantification

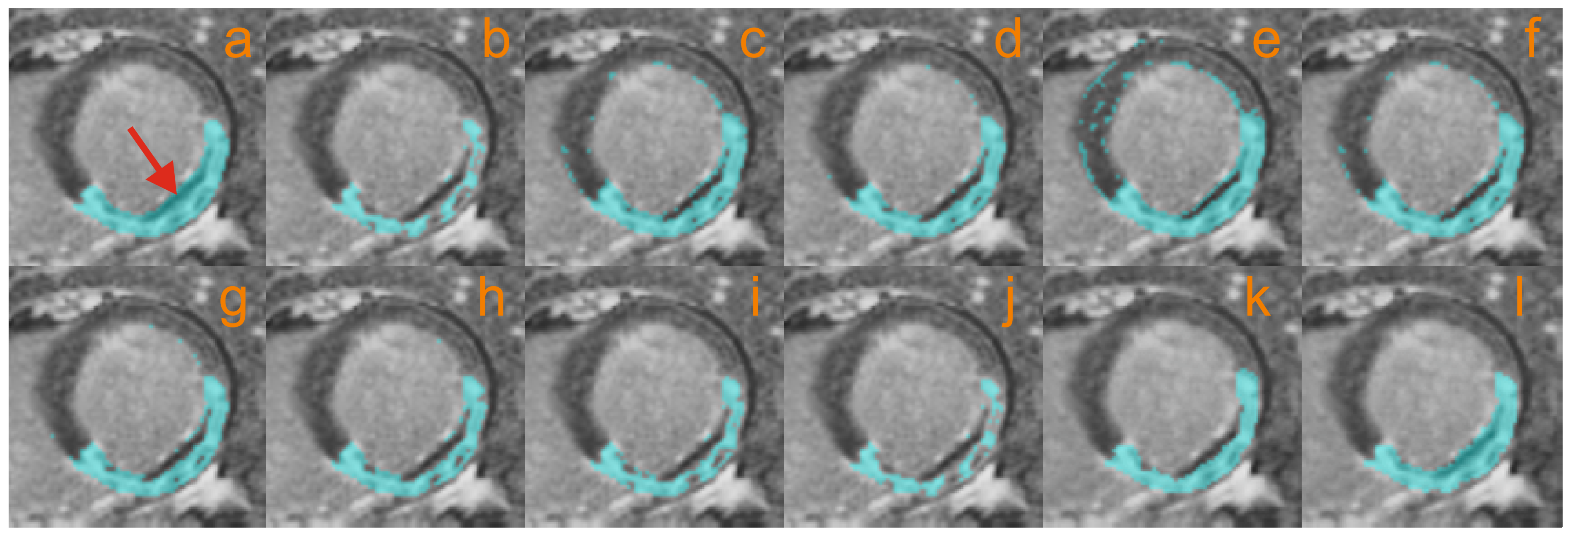
4.2.1. Ensemble Size Selection

The idea of training an ensemble of classifiers using 7 CNNs is based on a comparative analysis conducted for different ensemble sizes. Results obtained for different ensemble models (with k = 1, 3, 5, 7, 9 components) are reported in Table 3. The coarse segmentation by itself achieved an overall Dice index of 73%. When the segmentation refinement was introduced, results improved until reaching a mean Dice index of 77.22% for the ensemble using 7 CNNs. It is noticeable that using an ensemble with more CNNs did not improve the segmentation performance. Besides, the ensemble of 7 CNNs performed closely in terms of Hausdorff distance (< 1 mm difference) to the best performing model (ensemble with 1 CNN). Consequently, after this experiment the number of CNNs was fixed to seven and from here on, all presented results are obtained under this chosen configuration.

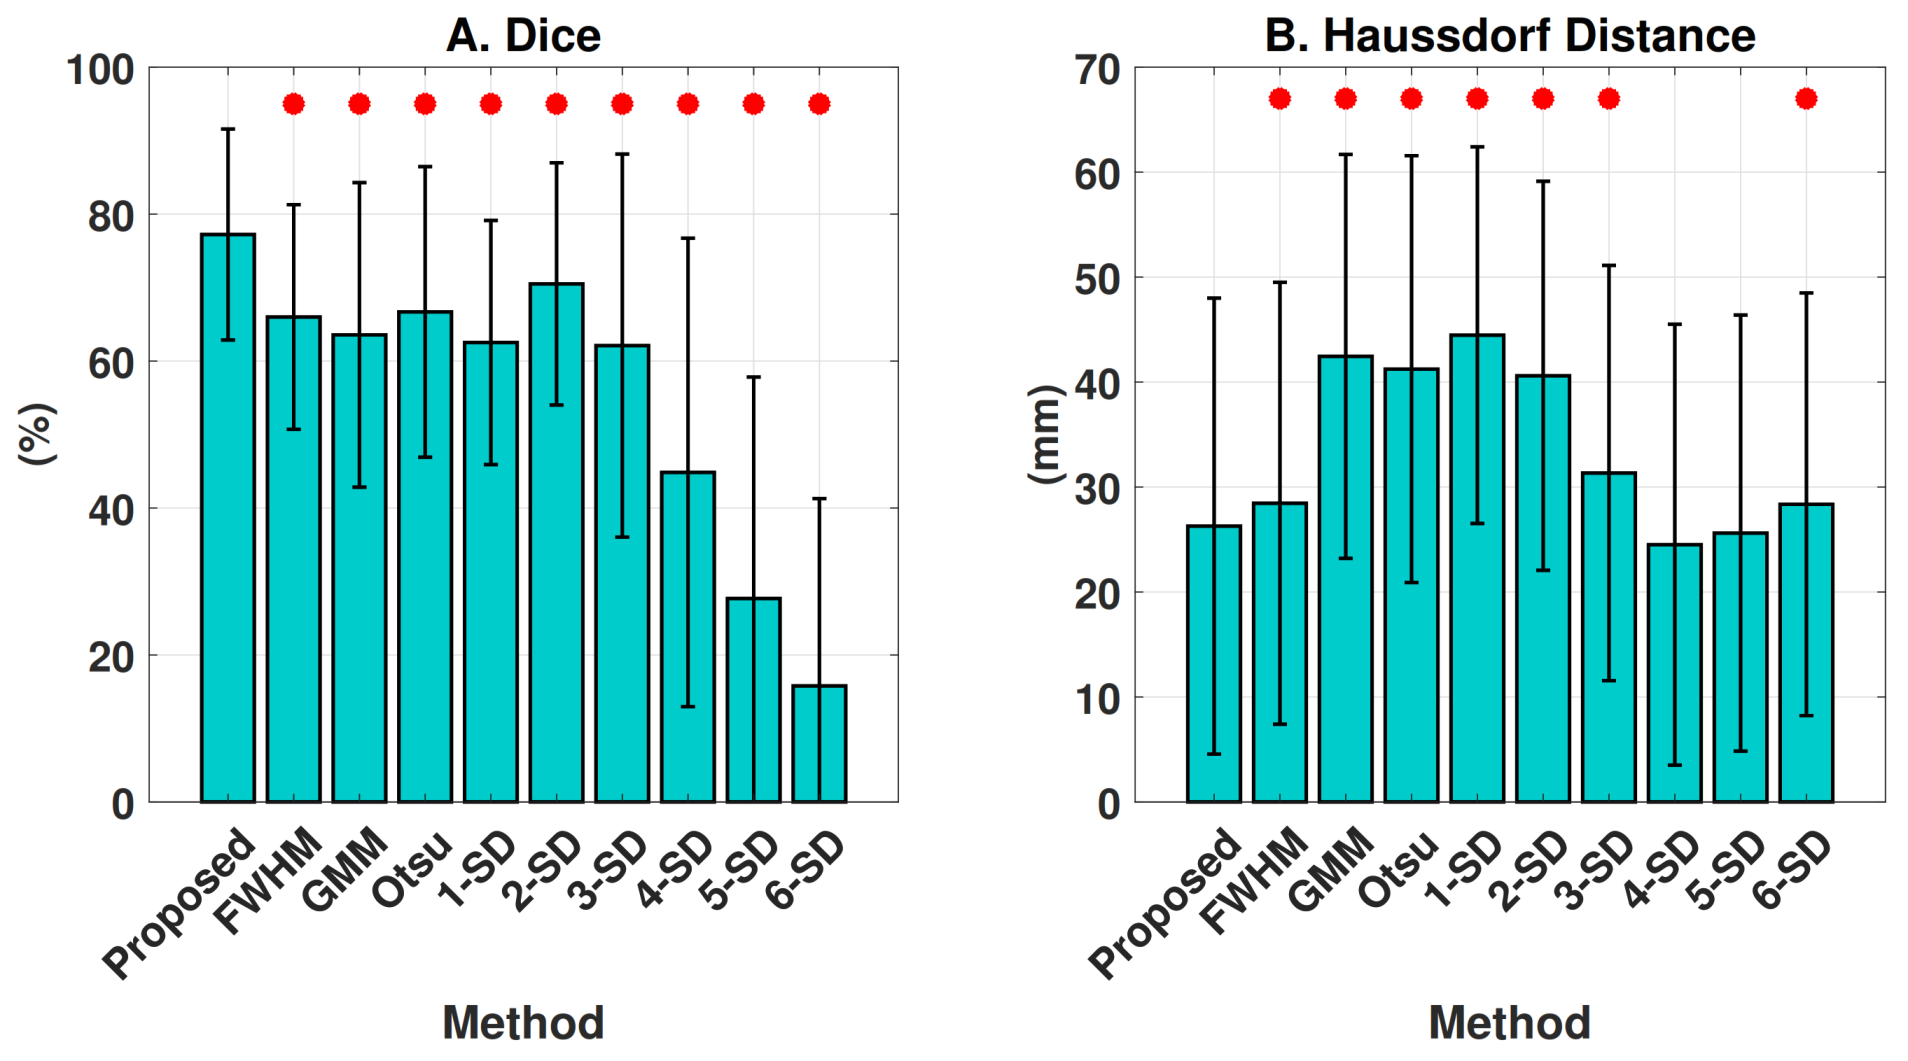
4.2.2. Segmentation Performance

Achieved segmentation performance are shown in Figure 4. With the aim of comparing all the methods under similar working scenarios, only diseased cases were segmented (i.e., healthy slices/patients were not segmented since the algorithms are devised for working on selected pathological cases). Our algorithm obtained the highest Dice index when compared against the reference method ones, achieving a Dice value of 77.22 ± 14.3% and considerably outperforming the best ranked reference method (2-SD with Dice 70.49 ± 16.48%). Besides, our proposal obtained the lowest Dice variance among all methods. Statistical significance was present in all Dice comparisons. When comparing performance in terms of Hausdorff distances, our method obtained 26.3 ± 21.7 mm (Figure 4B). The lowest Hausdorff values were obtained for the 4-SD and 5-SD methods (24.5 ± 21.0 mm and 25.6 ± 20.8 mm, respectively, p< 0.05). The achieved homoscedastic Hausdorff distance distributions showed similar variance levels for all the methods.
For evaluating whether the method’s performance varies depending on the heart position, we assessed the results at three cardiac levels: apex, middle, and base myocardium. Qualitative segmentation results are shown in Figure 5. As can be observed, the algorithm is robust for detecting the scar at different heart locations. Overall, less false-positives cluster of voxels were found for our method when comparing against the reference ones. We can also notice the segmentation improvement obtained after the refinement step. Besides, in Table 4, the performance of our method at different heart locations is shown. Overall, similar Dice indexes were obtained at the considered locations, with greater Hausdorff distances at the base when compared against middle and apex myocardial levels.
Intra-rater absolute errors for the infarcted volume and for the percentage of infarcted myocardium were −2.2 ± 7 cm 3 ( ρ = 0.98) and −1.0 ± 2.4% ( ρ = 0.973), respectively. On the other hand, the inter-rater absolute errors for the infarcted volume and for the percentage of infarcted myocardium were 11.0 ± 7.04 cm 3 ( ρ = 0.915) and 5.2 ± 9.7 % ( ρ = 0.9). The agreement of the different methods with the manual delineations in terms of clinical markers is summarized in Table 5. Estimation of the scarred myocardial volume as well as of the percentage of infarcted myocardium were consistently better for our proposal when compared against the reference ones. For both considered metrics, our approach achieved the highest correlation values and lowest Bland–Altman biases. A relevant result is that our proposal was the only method in estimating the scar volume and percentage of infarcted myocardium by agreeing with the manual delineations. All the remaining methods obtained clinical markers estimations that statistically differed from the expert annotated ones.

4.2.3. Microvascular Obstruction Inclusion

In Table 6, the sensitivity of the different methods for detecting MVO areas are shown. Our proposal achieved the highest performance values and showed statistical significance when compared with all reference methods with exception of the 1-SD one. A MVO segmentation example can be appreciated in Figure 6, where our proposal’s capability for the task is exposed. It can be highlighted the accurate segmentation of the hyper-enhanced area provided by the coarse pre-segmentation, with its improvement and MVO inclusion after the refinement approach. For the shown image, only our approach was able to deal with the no-reflow area.

4.3. Computational Performance

The whole method was implemented under Matlab R2017b and the experiments were performed in a laptop equipped with Intel® CoreTM i7-7500U CPU (2.7 GHz, 4Mb Cache, 2 cores), 16 GB DDR4 RAM and a GPU NVIDIA® GeForce 940MX (2GB dedicated). The networks’ training for both tasks (classification and segmentation) took less than 2 h for each CNN. Processing of an entire exam in testing phase took from 30 s to 100 s depending on the scar size, being always faster than the experts’ scar delineation (which took from 1 to 5 min according to the size, the complexity of the scar shape and the size of the gray zone that render the segmentation difficult). Exams that required less amount of time to be automatically processed correspond to the ones that required less time to be manually delineated.

5. Discussion

In this work, a new method for myocardial infarction detection and quantification in LGE-MRI is presented. Our proposal differs in several ways from the existing deep-learning methods. Unlike most approaches, we did not use deep-learning for segmenting the entire scar, but for refining an initial coarse segmentation. Namely, we targeted with CNNs the reclassification of voxels falling in the boundary scar area, since partial volume effect and the gray-zone tissue turn their identification difficult. In this work, we assumed that voxels belonging to the core infarction are mostly distinguishable with intensity features, while those overlapping with healthy intensities require more complex descriptors for their classification. Moreover, our method takes advantage of CNNs for identifying diseased images before segmenting them. While the remaining approaches conduct direct lesion segmentation, we preferred to mimic the experts working pipeline by constraining the algorithms’ lesion search to infarcted slices only. Another difference between deep-learning methods is the preference of 3D CNNs over 2D ones in 3D LGE-MRI images. This is in fact expected given the high voxel resolution and the free-breathing acquisition of 3D LGE-MRI. In 2D breath-holds imaging, slices are sequentially acquired with poor Z-axis resolution. As a consequence, the usage of 3D CNNs might be misleading since heart shape and location might differ in each breath-hold given diaphragm shifts. Despite the advantages of free-breathing 3D LGE-MRI, this imaging modality is not commonly used in clinical practice. A common prerequisite found for all methods segmenting the left ventricle scar is the manual myocardial delineation. In [36], a direct segmentation protocol without making use of myocardial masks was explored. However, the approach obtained much lower performance with a ∼17% Dice drop when compared with a model that uses myocardial boundaries. Among the main novelties of our proposal when compared against the existing methods we found: ( i ) the generalization of the algorithm for working under healthy scenarios, ( i i ) the automated detection of myocardial lesions and subsequent quantification, ( i i i ) the incorporation of a dedicated step for including MVO areas within the scar segmentation and (iv) the validation of the algorithm on an LGE-MRI annotated database with both hyper-enhanced and MVO cases. All these characteristics make our proposal a highly valuable tool with clinical transfer potential.
With the aim of overcoming most current algorithms’ limitations for working with healthy images, a binary classifier for discriminating healthy and diseased cases was devised. The discriminant rule achieved high classification performance results. Our results suggest that features extracted with a CNN followed by a supervised classifier such as SVM performs better than an end-to-end training of CNN models for classifying myocardial images. When the decision rule was assessed in terms of a ROC analysis, high AUC metrics with low variance were obtained, suggesting robustness of the proposed discriminant rule. Possible operative points providing high sensitivity were proposed, which will help in reducing the false positive lesions’ detection in healthy images. Even more, results from the permutation analysis showed that the built classifier and the features used are informative for the addressed problem and cannot be achieved by a random chance configuration. All these findings support, consequently, the classifiers robustness as well as the method’s reproducibility over different databases.
Segmentation of the infarcted masses was conducted in a two-step approach where the initial segmentation was later improved using deep learning. It is important to highlight the novelty of this approach which was not only thought as a high-performance algorithm, but also as a modular transferable technique. Thus, high performance results were even obtained before conducting the segmentation refinement, achieving the coarse segmentation step a better agreement with the ground truth than the reference methods. When the deep-learning based refinement was included, a consistent and statistical significant improvement in segmentation agreement was achieved. Even more, the low Dice variance showed homogeneity and adaptability of the method to different myocardial lesions configurations. Since the strategy relies on un-constrained located hyper-enhanced voxels detection, it should allow quantification of not only subendocardial scars, but also of non-subendocardial LGE patterns as found in hypertrophic cardiomyopathy or myocarditis. The method showed, besides, a stable performance independent on the cardiac location considered. Myocardial scar segmentation at the base and the apex of the heart were slighter lesser than at the middle. Our hypothesis is that at these locations, the stronger partial volume effect turns tissue segmentation more challenging. The increased Hausdorff distances found from the myocardial apex to the base are related with the larger myocardial area involved and the higher chances of the method to provide misclassification of voxels.
When assessing Hausdorff distance results, our method obtained much lower values than most reference algorithms (p < 0.05). Only the 4-SD and 5-SD methods achieved lower metrics (p non-statistically significant), which is expected since in these algorithms the intensity segmentation threshold is set very high. Thus, only highly hyperenhanced voxels from the core necrotic tissue are detected and hence outliers (which are more prone to appear at lower thresholds) are avoided. As a consequence, these methods may have better Hausdorff distance results since this metric is strongly affected by outliers [49].
Promising results in terms of clinical markers were achieved with the proposed algorithm. The high correlation, low bias and the fact of being the only method agreeing in volumetric lesion quantification with the manual delineations suggest its appropriateness for potentially working under clinical and medical conditions. It is important to highlight that our results shared the intra- and inter-rater variability ranges. On the other hand, supporting the findings of [12,13] the reference results showed very poor scar segmentation agreement with the manual delineations, characterized by low accuracies, high results variability and significant differences in volumetric tissue quantification.
A strength of the dataset used is the real world data included, which comprises large image quality variability and a wide range of disease severity. For instance, cases highly corrupted with artifacts or with very small myocardial lesions have not been excluded from our analysis. These dataset considerations could explain the large variability in the segmentation metrics reported in this work. Another novelty from our dataset is the inclusion of cases containing no-reflow areas. The MVO performance evaluation showed that our approach was consistently superior for conducting this task, achieving the highest sensitivity performance and evidencing statistical significance when compared against the reference approaches. The 1-SD method was the only exception, showing non-significant differences even when achieving lower performance. For this latter technique, the setting of a very low threshold for detecting myocardial scars favors MVO detection at the expenses of providing low overall performance.
For evaluating the methods’ robustness and generalizability, validation over large, public and multi-center databases is needed. As a limitation of our proposal we can point out the two independent modules devised for lesion detection and quantification. Future goals will address the algorithm unification into a unique block as well as the full segmentation of the left-ventricle myocardium. In this work, given the complexity of segmenting the left ventricle and its high impact over the infarction biomarkers, manual contouring was preferred. Implementation of an end-to-end deep-learning model performing joint detection and segmentation (of both the myocardium and the lesions) could be addressed by current state-of-the-art encoder-decoder networks (such as U-Net [60], V-Net [61], SEG-Net [62] or Y-Net [63]). Moreover, in this work, we make use of classical non-linear operations for image enhancement and tissue discrimination, which can be improved by automatic and task-specific approaches such as MedGA [64].
Other future perspectives could be the use of our method in T1-mapping images [65] or in non-contrast-enhanced MRI such as in [66,67]. Another possible direction could be the evaluation of the extent of fibrosis in other diseases such as hypertrophic cardiomyopathy or myocarditis, where the location and the shape of the hyperenhanced area do not follow the same rules as in myocardial infarction.

6. Conclusions

We propose a new method for infarction segmentation and quantification in LGE-MRI. The method overcomes several limitations of previous proposals from which the following points can be highlighted: ( i ) repeatability, a limitation of semi-automatic approaches such as n-SD and FWHM methods, ( i i ) detection of healthy and diseased slices, allowing to extend the method for working with healthy patients, ( i i i ) development of a novel and accurate technique for automatic delineation of the scar tissue and ( i v ) incorporation of a no-reflow strategy for including these regions in the infarction quantification. The extensive statistical validation of the framework and its vast comparison against several reference methods turn this proposal into a reliable and promising tool with clinical transfer potential.

Author Contributions

Conceptualization, D.S., A.C. and A.L.; data curation, E.d.l.R., T.D., T.L. and A.L.; formal analysis, E.d.l.R.; investigation, E.d.l.R.; methodology, E.d.l.R., D.S. and A.L.; software, E.d.l.R. and T.D.; supervision, D.S. and A.L.; validation, T.D.; writing—original draft, E.d.l.R.; writing—review and editing, D.S., T.D., T.L., A.C. and A.L. All authors have read and agreed to the published version of the manuscript.

Funding

This research received no external funding.

Institutional Review Board Statement

Not applicable.

Informed Consent Statement

Not applicable.

Data Availability Statement

Not applicable.

Acknowledgments

EDLR received an Erasmus+ scholarship from the Erasmus Mundus Joint Master Degree in Medical Imaging and Applications (MAIA), a program funded by the European Union.

Conflicts of Interest

The authors declare no conflict of interest.

References

  1. Dastidar, A.G.; Rodrigues, J.C.; Baritussio, A.; Bucciarelli-Ducci, C. MRI in the assessment of ischaemic heart disease. Heart 2016, 102, 239–252. [Google Scholar] [CrossRef]
  2. Puntmann, V.O.; Valbuena, S.; Hinojar, R.; Petersen, S.E.; Greenwood, J.P.; Kramer, C.M.; Kwong, R.Y.; McCann, G.P.; Berry, C.; Nagel, E. Society for Cardiovascular Magnetic Resonance (SCMR) expert consensus for CMR imaging endpoints in clinical research: PartI-analytical validation and clinical qualification. J. Cardiovasc. Magn. Reson. 2018, 20, 67. [Google Scholar] [CrossRef] [Green Version]
  3. Rajiah, P.; Desai, M.Y.; Kwon, D.; Flamm, S.D. MR imaging of myocardial infarction. Radiographics 2013, 33, 1383–1412. [Google Scholar] [CrossRef]
  4. Kim, R.J.; Fieno, D.S.; Parrish, T.B.; Harris, K.; Chen, E.L.; Simonetti, O.; Bundy, J.; Finn, J.P.; Klocke, F.J.; Judd, R.M. Relationship of MRI delayed contrast enhancement to irreversible injury, infarct age, and contractile function. Circulation 1999, 100, 1992–2002. [Google Scholar] [CrossRef] [Green Version]
  5. Cochet, A.A.; Lorgis, L.; Lalande, A.; Zeller, M.; Beer, J.C.; Walker, P.M.; Touzery, C.; Wolf, J.E.; Brunotte, F.; Cottin, Y. Major prognostic impact of persistent microvascular obstruction as assessed by contrast-enhanced cardiac magnetic resonance in reperfused acute myocardial infarction. Eur. Radiol. 2009, 19, 2117–2126. [Google Scholar] [CrossRef]
  6. Hamirani, Y.S.; Wong, A.; Kramer, C.M.; Salerno, M. Effect of microvascular obstruction and intramyocardial hemorrhage by CMR on LV remodeling and outcomes after myocardial infarction: A systematic review and meta-analysis. JACC Cardiovasc. Imaging 2014, 7, 940–952. [Google Scholar] [CrossRef] [PubMed] [Green Version]
  7. Abbas, A.; Matthews, G.; Brown, I.; Shambrook, J.; Peebles, C.; Harden, S. Cardiac MR assessment of microvascular obstruction. Br. J. Radiol. 2015, 88, 20140470. [Google Scholar] [CrossRef] [PubMed]
  8. Engblom, H.; Tufvesson, J.; Jablonowski, R.; Carlsson, M.; Aletras, A.H.; Hoffmann, P.; Jacquier, A.; Kober, F.; Metzler, B.; Erlinge, D.; et al. A new automatic algorithm for quantification of myocardial infarction imaged by late gadolinium enhancement cardiovascular magnetic resonance: Experimental validation and comparison to expert delineations in multi-center, multi-vendor patient data. J. Cardiovasc. Magn. Reson. 2016, 18, 27. [Google Scholar] [CrossRef] [PubMed]
  9. Pattanayak, P.; Bleumke, D.A. Tissue characterization of the myocardium: State of the art characterization by magnetic resonance and computed tomography imaging. Radiol. Clin. 2015, 53, 413–423. [Google Scholar] [CrossRef] [PubMed] [Green Version]
  10. Amado, L.C.; Gerber, B.L.; Gupta, S.N.; Rettmann, D.W.; Szarf, G.; Schock, R.; Nasir, K.; Kraitchman, D.L.; Lima, J.A. Accurate and objective infarct sizing by contrast-enhanced magnetic resonance imaging in a canine myocardial infarction model. J. Am. Coll. Cardiol. 2004, 44, 2383–2389. [Google Scholar] [CrossRef] [Green Version]
  11. Flett, A.S.; Hasleton, J.; Cook, C.; Hausenloy, D.; Quarta, G.; Ariti, C.; Muthurangu, V.; Moon, J.C. Evaluation of techniques for the quantification of myocardial scar of differing etiology using cardiac magnetic resonance. JACC Cardiovasc. Imaging 2011, 4, 150–156. [Google Scholar] [CrossRef] [Green Version]
  12. Spiewak, M.; Malek, L.A.; Misko, J.; Chojnowska, L.; Milosz, B.; Klopotowski, M.; Petryka, J.; Dabrowski, M.; Kepka, C.; Ruzyllo, W. Comparison of different quantification methods of late gadolinium enhancement in patients with hypertrophic cardiomyopathy. Eur. J. Radiol. 2010, 74, e149–e153. [Google Scholar] [CrossRef]
  13. Zhang, L.; Huttin, O.; Marie, P.y.; Felblinger, J.; Beaumont, M.; de Chillou, C.; Girerd, N.; Mandry, D. Myocardial infarct sizing by late gadolinium-enhanced MRI: Comparison of manual, full-width at half-maximum, and n-standard deviation methods. J. Magn. Reson. Imaging 2016, 44, 1206–1217. [Google Scholar] [CrossRef]
  14. Karim, R.; Claus, P.; Chen, Z.; Housden, R.J.; Obom, S.; Gill, H.; Ma, Y.; Acheampong, P.; O’Neill, M.; Razavi, R.; et al. Infarct segmentation challenge on delayed enhancement MRI of the left ventricle. In International Workshop on Statistical Atlases and Computational Models of the Heart; Springer: Berlin/Heidelberg, Germany, 2012; pp. 97–104. [Google Scholar]
  15. Hennemuth, A.; Seeger, A.; Friman, O.; Miller, S.; Klumpp, B.; Oeltze, S.; Peitgen, H.O. A comprehensive approach to the analysis of contrast enhanced cardiac MR images. IEEE Trans. Med. Imaging 2008, 27, 1592–1610. [Google Scholar] [CrossRef] [PubMed]
  16. Tao, Q.; Milles, J.; Zeppenfeld, K.; Lamb, H.J.; Bax, J.J.; Reiber, J.H.; van der Geest, R.J. Automated segmentation of myocardial scar in late enhancement MRI using combined intensity and spatial information. Magn. Reson. Med. 2010, 64, 586–594. [Google Scholar] [CrossRef] [PubMed]
  17. Wei, D.; Sun, Y.; Ong, S.H.; Chai, P.; Teo, L.L.; Low, A.F. A comprehensive 3-D framework for automatic quantification of late gadolinium enhanced cardiac magnetic resonance images. IEEE Trans. Biomed. Eng. 2013, 60, 1499–1508. [Google Scholar]
  18. Carminati, M.C.; Boniotti, C.; Fusini, L.; Andreini, D.; Pontone, G.; Pepi, M.; Caiani, E.G. Comparison of image processing techniques for nonviable tissue quantification in late gadolinium enhancement cardiac magnetic resonance images. J. Thorac. Imaging 2016, 31, 168–176. [Google Scholar] [CrossRef] [PubMed] [Green Version]
  19. Pop, M.; Ghugre, N.R.; Ramanan, V.; Morikawa, L.; Stanisz, G.; Dick, A.J.; Wright, G.A. Quantification of fibrosis in infarcted swine hearts by late gadolinium-enhancement and diffusion-weighted MRI methods. Phys. Med. Biol. 2013, 58, 5009. [Google Scholar] [CrossRef] [PubMed]
  20. Valindria, V.V.; Angue, M.; Vignon, N.; Walker, P.M.; Cochet, A.; Lalande, A. Automatic quantification of myocardial infarction from delayed enhancement MRI. In Proceedings of the 2011 Seventh International Conference on Signal-Image Technology and Internet-Based Systems (SITIS), Dijon, France, 28 November–1 December 2011; IEEE: Piscataway, NJ, USA, 2011; pp. 277–283. [Google Scholar]
  21. Zreik, M.; Lessmann, N.; van Hamersvelt, R.W.; Wolterink, J.M.; Voskuil, M.; Viergever, M.A.; Leiner, T.; Išgum, I. Deep learning analysis of the myocardium in coronary CT angiography for identification of patients with functionally significant coronary artery stenosis. Med. Image Anal. 2018, 44, 72–85. [Google Scholar] [CrossRef] [Green Version]
  22. Kolipaka, A.; Chatzimavroudis, G.P.; White, R.D.; O’Donnell, T.P.; Setser, R.M. Segmentation of non-viable myocardium in delayed enhancement magnetic resonance images. Int. J. Cardiovasc. Imaging 2005, 21, 303–311. [Google Scholar] [CrossRef]
  23. Otsu, N. A threshold selection method from gray-level histograms. IEEE Trans. Syst. Man, Cybern. 1979, 9, 62–66. [Google Scholar] [CrossRef] [Green Version]
  24. Andreu, D.; Berruezo, A.; Ortiz-Pérez, J.T.; Silva, E.; Mont, L.; Borràs, R.; de Caralt, T.M.; Perea, R.J.; Fernández-Armenta, J.; Zeljko, H.; et al. Integration of 3D electroanatomic maps and magnetic resonance scar characterization into the navigation system to guide ventricular tachycardia ablation clinical perspective. Circ. Arrhythmia Electrophysiol. 2011, 4, 674–683. [Google Scholar] [CrossRef] [Green Version]
  25. Schmidt, A.; Azevedo, C.F.; Cheng, A.; Gupta, S.N.; Bluemke, D.A.; Foo, T.K.; Gerstenblith, G.; Weiss, R.G.; Marbán, E.; Tomaselli, G.F.; et al. Infarct tissue heterogeneity by magnetic resonance imaging identifies enhanced cardiac arrhythmia susceptibility in patients with left ventricular dysfunction. Circulation 2007, 115, 2006–2014. [Google Scholar] [CrossRef]
  26. Hsu, L.Y.; Natanzon, A.; Kellman, P.; Hirsch, G.A.; Aletras, A.H.; Arai, A.E. Quantitative myocardial infarction on delayed enhancement MRI. Part I: Animal validation of an automated feature analysis and combined thresholding infarct sizing algorithm. J. Magn. Reson. Imaging 2006, 23, 298–308. [Google Scholar] [CrossRef]
  27. Detsky, J.S.; Paul, G.; Dick, A.J.; Wright, G.A. Reproducible classification of infarct heterogeneity using fuzzy clustering on multicontrast delayed enhancement magnetic resonance images. IEEE Trans. Med Imaging 2009, 28, 1606–1614. [Google Scholar] [CrossRef]
  28. Positano, V.; Pingitore, A.; Giorgetti, A.; Favilli, B.; Santarelli, M.F.; Landini, L.; Marzullo, P.; Lombardi, M. A fast and effective method to assess myocardial necrosis by means of contrast magnetic resonance imaging. J. Cardiovasc. Magn. Reson. 2005, 7, 487–494. [Google Scholar] [CrossRef] [PubMed]
  29. Dikici, E.; O’Donnell, T.; Setser, R.; White, R.D. Quantification of delayed enhancement MR images. In Proceedings of the International Conference on Medical Image Computing and Computer-Assisted Intervention, Saint-malo, France, 26–29 September 2004; Springer: Berlin/Heidelberg, Germany, 2004; pp. 250–257. [Google Scholar]
  30. O’Donnell, T.P.; Xu, N.; Setser, R.M.; White, R.D. Semi-automatic segmentation of nonviable cardiac tissue using cine and delayed enhancement magnetic resonance images. In Medical Imaging 2003: Physiology and Function: Methods, Systems, and Applications; International Society for Optics and Photonics: Bellingham, WA, USA, 2003; Volume 5031, pp. 242–252. [Google Scholar]
  31. Lu, Y.; Yang, Y.; Connelly, K.A.; Wright, G.A.; Radau, P.E. Automated quantification of myocardial infarction using graph cuts on contrast delayed enhanced magnetic resonance images. Quant. Imaging Med. Surg. 2012, 2, 81. [Google Scholar] [PubMed]
  32. Kruk, D.; Boucher, A.; Lalande, A.; Cochet, A.; Sliwa, T. Segmentation Integrating Watershed and Shape Priors Applied to Cardiac Delayed Enhancement MR Images. IRBM 2017, 38, 224–227. [Google Scholar] [CrossRef]
  33. Ukwatta, E.; Arevalo, H.; Li, K.; Yuan, J.; Qiu, W.; Malamas, P.; Wu, K.C.; Trayanova, N.A.; Vadakkumpadan, F. Myocardial infarct segmentation from magnetic resonance images for personalized modeling of cardiac electrophysiology. IEEE Trans. Med. Imaging 2016, 35, 1408–1419. [Google Scholar] [CrossRef] [PubMed] [Green Version]
  34. Rajchl, M.; Yuan, J.; White, J.A.; Ukwatta, E.; Stirrat, J.; Nambakhsh, C.M.; Li, F.P.; Peters, T.M. Interactive hierarchical-flow segmentation of scar tissue from late-enhancement cardiac MR images. IEEE Trans. Med. Imaging 2014, 33, 159–172. [Google Scholar] [CrossRef] [PubMed]
  35. Moccia, S.; Banali, R.; Martini, C.; Moscogiuri, G.; Pontone, G.; Pepi, M.; Caiani, E.G. Automated Scar Segmentation From CMR-LGE Images Using a Deep Learning Approach. In Proceedings of the 2018 Computing in Cardiology Conference (CinC), Maastricht, The Netherlands, 23–26 September 2018; IEEE: Piscataway, NJ, USA, 2018; Volume 45, pp. 1–4. [Google Scholar]
  36. Moccia, S.; Banali, R.; Martini, C.; Muscogiuri, G.; Pontone, G.; Pepi, M.; Caiani, E.G. Development and testing of a deep learning-based strategy for scar segmentation on CMR-LGE images. Magn. Reson. Mater. Phys. Biol. Med. 2019, 32, 187–195. [Google Scholar] [CrossRef] [Green Version]
  37. Zabihollahy, F.; White, J.A.; Ukwatta, E. Myocardial scar segmentation from magnetic resonance images using convolutional neural network. In Medical Imaging 2018: Computer-Aided Diagnosis; Petrick, N., Mori, K., Eds.; International Society for Optics and Photonics, SPIE: San Diego, CA, USA, 2018; Volume 10575, pp. 663–670. [Google Scholar]
  38. Zabihollahy, F.; White, J.A.; Ukwatta, E. Convolutional neural network-based approach for segmentation of left ventricle myocardial scar from 3D late gadolinium enhancement MR images. Med. Phys. 2019, 46, 1740–1751. [Google Scholar] [CrossRef] [PubMed] [Green Version]
  39. Yang, G.; Zhuang, X.; Khan, H.; Haldar, S.; Nyktari, E.; Ye, X.; Slabaugh, G.; Wong, T.; Mohiaddin, R.; Keegan, J.; et al. A fully automatic deep learning method for atrial scarring segmentation from late gadolinium-enhanced MRI images. In Proceedings of the 2017 IEEE 14th International Symposium on Biomedical Imaging (ISBI 2017), Melbourne, Australia, 18–21 April 2017; IEEE: Piscataway, NJ, USA, 2017; pp. 844–848. [Google Scholar]
  40. Yang, G.; Zhuang, X.; Khan, H.; Haldar, S.; Nyktari, E.; Li, L.; Wage, R.; Ye, X.; Slabaugh, G.; Mohiaddin, R.; et al. Fully automatic segmentation and objective assessment of atrial scars for long-standing persistent atrial fibrillation patients using late gadolinium-enhanced MRI. Med. Phys. 2018, 45, 1562–1576. [Google Scholar] [CrossRef]
  41. Paszke, A.; Chaurasia, A.; Kim, S.; Culurciello, E. ENet: A Deep Neural Network Architecture for Real-Time Semantic Segmentation. arXiv 2016, arXiv:1606.02147. [Google Scholar]
  42. Zabihollahy, F.; Rajchl, M.; White, J.A.; Ukwatta, E. Fully automated segmentation of left ventricular scar from 3D late gadolinium enhancement magnetic resonance imaging using a cascaded multi-planar U-Net (CMPU-Net). Med. Phys. 2020, 47, 1645–1655. [Google Scholar] [CrossRef] [PubMed]
  43. Fahmy, A.S.; Rowin, E.J.; Chan, R.H.; Manning, W.J.; Maron, M.S.; Nezafat, R. Improved quantification of myocardium scar in late gadolinium enhancement images: Deep learning based image fusion approach. J. Magn. Reson. Imaging 2021. [Google Scholar] [CrossRef] [PubMed]
  44. Lalande, A.; Garreau, M.; Frouin, F. Evaluation of cardiac structure segmentation in cine magnetic resonance imaging. In Multi-Modality Cardiac Imaging: Processing and Analysis; Wiley Online Library: Hoboken, NJ, USA, 2015; pp. 169–215. [Google Scholar]
  45. Lalande, A.; Chen, Z.; Decourselle, T.; Qayyum, A.; Pommier, T.; Lorgis, L.; de la Rosa, E.; Cochet, A.; Cottin, Y.; Ginhac, D.; et al. Emidec: A database usable for the automatic evaluation of myocardial infarction from delayed-enhancement cardiac MRI. Data 2020, 5, 89. [Google Scholar] [CrossRef]
  46. Manjón, J.V.; Coupé, P.; Martí-Bonmatí, L.; Collins, D.L.; Robles, M. Adaptive non-local means denoising of MR images with spatially varying noise levels. J. Magn. Reson. Imaging 2010, 31, 192–203. [Google Scholar] [CrossRef] [PubMed] [Green Version]
  47. Simonyan, K.; Zisserman, A. Very Deep Convolutional Networks for Large-Scale Image Recognition. arXiv 2014, arXiv:1409.1556. [Google Scholar]
  48. Antropova, N.; Huynh, B.Q.; Giger, M.L. A deep feature fusion methodology for breast cancer diagnosis demonstrated on three imaging modality datasets. Med. Phys. 2017, 44, 5162–5171. [Google Scholar] [CrossRef]
  49. Jia, H.; Xia, Y.; Song, Y.; Cai, W.; Fulham, M.; Feng, D.D. Atlas registration and ensemble deep convolutional neural network-based prostate segmentation using magnetic resonance imaging. Neurocomputing 2018, 275, 1358–1369. [Google Scholar] [CrossRef]
  50. Johnson, J.M.; Khoshgoftaar, T.M. Survey on deep learning with class imbalance. J. Big Data 2019, 6, 27. [Google Scholar] [CrossRef]
  51. Haixiang, G.; Yijing, L.; Shang, J.; Mingyun, G.; Yuanyue, H.; Bing, G. Learning from class-imbalanced data: Review of methods and applications. Expert Syst. Appl. 2017, 73, 220–239. [Google Scholar] [CrossRef]
  52. Srivastava, N.; Hinton, G.; Krizhevsky, A.; Sutskever, I.; Salakhutdinov, R. Dropout: A simple way to prevent neural networks from overfitting. J. Mach. Learn. Res. 2014, 15, 1929–1958. [Google Scholar]
  53. Ram, S.; Rodríguez, J.J.; Bosco, G. Segmentation and detection of fluorescent 3D spots. Cytom. Part A 2012, 81, 198–212. [Google Scholar] [CrossRef] [PubMed]
  54. BahadarKhan, K.; Khaliq, A.A.; Shahid, M. A morphological hessian based approach for retinal blood vessels segmentation and denoising using region based otsu thresholding. PLoS ONE 2016, 11, e0158996. [Google Scholar] [CrossRef] [Green Version]
  55. Savelli, B.; Marchesi, A.; Bria, A.; Marrocco, C.; Molinara, M.; Tortorella, F. Retinal Vessel Segmentation Through Denoising and Mathematical Morphology. In Proceedings of the International Conference on Image Analysis and Processing, Catania, Italy, 11–15 September 2017; Springer: Berlin/Heidelberg, Germany, 2017; pp. 267–276. [Google Scholar]
  56. Krizhevsky, A.; Sutskever, I.; Hinton, G.E. Imagenet classification with deep convolutional neural networks. Adv. Neural Inf. Process. Syst. 2012, 25, 1097–1105. [Google Scholar] [CrossRef]
  57. Bernal, J.; Kushibar, K.; Cabezas, M.; Valverde, S.; Oliver, A.; Lladó, X. Quantitative Analysis of Patch-Based Fully Convolutional Neural Networks for Tissue Segmentation on Brain Magnetic Resonance Imaging. IEEE Access 2019, 7, 89986–90002. [Google Scholar] [CrossRef]
  58. Durante, A.; Camici, P.G. Novel insights into an “old” phenomenon: The no reflow. Int. J. Cardiol. 2015, 187, 273–280. [Google Scholar] [CrossRef]
  59. Bland, J.M.; Altman, D. Statistical methods for assessing agreement between two methods of clinical measurement. Lancet 1986, 327, 307–310. [Google Scholar] [CrossRef]
  60. Ronneberger, O.; Fischer, P.; Brox, T. U-net: Convolutional networks for biomedical image segmentation. In Proceedings of the International Conference on Medical Image Computing and Computer-Assisted Intervention, Munich, Germany, 5–9 October 2015; Springer: Berlin/Heidelberg, Germany, 2015; pp. 234–241. [Google Scholar]
  61. Milletari, F.; Navab, N.; Ahmadi, S.A. V-net: Fully convolutional neural networks for volumetric medical image segmentation. In Proceedings of the 2016 Fourth International Conference on 3D Vision (3DV), Stanford, CA, USA, 25–28 October 2016; IEEE: Piscataway, NJ, USA, 2016; pp. 565–571. [Google Scholar]
  62. Badrinarayanan, V.; Kendall, A.; Cipolla, R. Segnet: A deep convolutional encoder-decoder architecture for image segmentation. IEEE Trans. Pattern Anal. Mach. Intell. 2017, 39, 2481–2495. [Google Scholar] [CrossRef] [PubMed]
  63. Mehta, S.; Mercan, E.; Bartlett, J.; Weaver, D.; Elmore, J.G.; Shapiro, L. Y-Net: Joint segmentation and classification for diagnosis of breast biopsy images. In Proceedings of the International Conference on Medical Image Computing and Computer-Assisted Intervention, Granada, Spain, 16–20 September 2018; Springer: Berlin/Heidelberg, Germany, 2018; pp. 893–901. [Google Scholar]
  64. Rundo, L.; Tangherloni, A.; Cazzaniga, P.; Nobile, M.S.; Russo, G.; Gilardi, M.C.; Vitabile, S.; Mauri, G.; Besozzi, D.; Militello, C. A novel framework for MR image segmentation and quantification by using MedGA. Comput. Methods Programs Biomed. 2019, 176, 159–172. [Google Scholar] [CrossRef] [PubMed]
  65. Haaf, P.; Garg, P.; Messroghli, D.R.; Broadbent, D.A.; Greenwood, J.P.; Plein, S. Cardiac T1 mapping and extracellular volume (ECV) in clinical practice: A comprehensive review. J. Cardiovasc. Magn. Reson. 2017, 18, 89. [Google Scholar] [CrossRef] [Green Version]
  66. Xu, C.; Xu, L.; Gao, Z.; Zhao, S.; Zhang, H.; Zhang, Y.; Du, X.; Zhao, S.; Ghista, D.; Li, S. Direct detection of pixel-level myocardial infarction areas via a deep-learning algorithm. In Proceedings of the International Conference on Medical Image Computing and Computer-Assisted Intervention, Quebec City, QC, Canada, 11–13 September 2017; Springer: Berlin/Heidelberg, Germany, 2017; pp. 240–249. [Google Scholar]
  67. Zhang, N.; Yang, G.; Gao, Z.; Xu, C.; Zhang, Y.; Shi, R.; Keegan, J.; Xu, L.; Zhang, H.; Fan, Z.; et al. Deep Learning for Diagnosis of Chronic Myocardial Infarction on Nonenhanced Cardiac Cine MRI. Radiology 2019, 291, 606–617. [Google Scholar] [CrossRef] [Green Version]
Figure 1. Coarse segmentation workflow.
Algorithms 14 00249 g001
Figure 2. Segmentation refinement block. (a) CNN architecture used in the ensemble. (b) Refinement segmentation workflow. (c) Microvascular obstruction inclusion workflow. conv: Convolutional Layer; MP: Max-Pooling Layer; FC: Fully Connected Layer. × indicates the central voxel of the patch to be reclassified.
Algorithms 14 00249 g002
Figure 3. ROC curve obtained after 100-random splits for the proposed classifier. The solid black line represents the mean AUC performance obtained, while the red area represents the variability AUC interval (mean SD). ROC: Receiver Operating Characteristic; AUC: Area Under the Curve.
Algorithms 14 00249 g003
Figure 4. Segmentation performance. FWHM: Full-width at half-maximum; GMM: Gaussian mixture model; n-SD: n-standard deviation thresholding from remote myocardium. Red dots indicate p < 0.05 with Mann–Whitney U-test.
Algorithms 14 00249 g004
Figure 5. Scar segmentations obtained per algorithm at different heart locations. (a) Ground-truth. (b) Full-width at half-maximum. (c) Gaussian mixture model. (d) Otsu. (e) 1-SD. (f) 2-SD. (g) 3-SD. (h) 4-SD. (i) 5-SD. (j) 6-SD. (k) Proposed coarse segmentation. (l) Full proposed method.
Algorithms 14 00249 g005
Figure 6. Segmentation results for the microvascular obstruction areas per method. (a) Ground-truth. (b) Full-width at half-maximum. (c) Gaussian mixture model. (d) Otsu. (e) 1-SD. (f) 2-SD. (g) 3-SD. (h) 4-SD. (i) 5-SD. (j) 6-SD. (k) Proposed coarse segmentation. (l) Full proposed method. The arrow indicates the microvascular obstruction area.
Algorithms 14 00249 g006
Table 1. Summary of the CNN architectures used in the framework and their corresponding parameters.
GoalNetPatchLossOptimizerLRMMBL2Epochs
Disease DetectionVGG19 [47]89 × 89CESGDM 1 × 10 4 0.916 1 × 10 4 20
Scar Segmentation[21] *49 × 49CESGDM 1 × 10 2 0.75256 1 × 10 4 50
Net: Network Architecture; SGDM: Stochastic Gradient Descent with Momentum; LR: Learning Rate; M: Momentum; MB: Minibatch Size. L2: L2 Regularizer; * The elemental branch of the network was used instead of the whole architecture.
Table 2. Mean (standard-deviation) performance metrics obtained for the explored classifiers under the 100-random splits validation.
MethodSeSpAcc
Fine-tuned VGG1984.41 (11.02)93.89 (6.79)89.15 (5.36)
Our method88.11 (6.54)93.15 (4.84)90.63 (4.32)
Se: Sensitivity; Sp: Specificity; Acc: Accuracy.
Table 3. Mean (standard-deviation) segmentation performance obtained for the coarse segmentation followed by different ensemble sizes.
MethodDice (%)HD (mm)
Coarse73.0 (14.5)27.5 (21.7)
Coarse + Ensemble 176.3 (14.9)26.0 (21.8)
Coarse + Ensemble 376.9 (14.7)26.3 (21.8)
Coarse + Ensemble 577.1 (14.4)26.4 (21.8)
Coarse + Ensemble 777.2 (14.3)26.3 (21.7)
Coarse + Ensemble 977.2 (14.3)26.2 (21.8)
Ens: Ensemble Size; Dice: Dice Index; HD: Haussdorf distance.
Table 4. Mean (standard-deviation) segmentation performance at different heart levels.
Myocardial Location
MetricBaseMiddleApex
Dice (%)75.1 (16.2)78.1 (13.0)77.9 (14.6)
HD (mm)36.1 (23.4)25.2 (21.2)17.4 (15.6)
Dice: Dice index; HD: Hausdorff distance.
Table 5. Agreement between methods and the manual delineations by means of clinical markers.
Scar Volume (cm 3 )% Infarcted Myocardium Volume
MethodValue ρ BA Biasp-ValueValue ρ BA Biasp-Value
Manual25.7 (19.4) 18.5 (12.7)
FWHM17.6 (12.9)0.937−8.1 (8.7) < 0.001 12.7 (8.1)0.934−5.8 (5.9) < 0.001
GMM32.7 (17.2)0.8077.1 (14.6) < 0.001 24.2 (11.0)0.7775.6 (9.5) < 0.001
Otsu39.3 (20.8)0.90713.6 (10.1) < 0.001 28.6 (12.1)0.88510.1 (6.6) < 0.001
1-SD44.0 (24.4)0.93218.3 (10.8) < 0.001 32.3 (15.8)0.92313.8 (7.2) < 0.001
2-SD28.6 (18.7)0.9273.0 (9.4) < 0.01 21.1 (13.0)0.9162.6 (6.4) < 0.001
3-SD18.4 (14.5)0.875−7.2 (12.6) < 0.001 13.7 (10.4)0.847−4.9 (7.7) < 0.001
4-SD11.2 (11.1)0.756−14.5 (15.3) < 0.001 8.4 (8.0)0.723−10.2 (9.4) < 0.001
5-SD6.4 (8.4)0.567−19.3 (17.0) < 0.001 4.8 (6.0)0.565−13.7 (10.6) < 0.001
6-SD3.7 (6.4)0.458−21.9 (17.7) < 0.001 2.8 (4.4)0.471−15.8 (11.3) < 0.001
Proposed26.6 (18.5)0.9451.0 (6.9)0.19619.1 (11.0)0.9450.5 (4.6)0.314
Mean (standard deviation). FWHM: Full-width at half-maximum; GMM: Gaussian mixture model; n-SD: n-standard deviation thresholding from remote myocardium; BA: Bland–Altman; ρ : Spearman correlation coefficient; p-values obtained by a paired t-Student test.
Table 6. Mean (standard-deviation) sensitivity for detecting microvascular obstruction areas per method.
FWHMGMMOtsu1-SD2-SD3-SD4-SD5-SD6-SDProposed
18.8 *54.6 *57.7 *63.646.5 *27.9 *14.1 *5.7 *2.8 *66.9
(23.0)(37.1)(35.0)(36.4)(38.9)(34.0)(25.1)(14.6)(9.1)(40.5)
FWHM: Full-width at half-maximum; GMM: Gaussian mixture model; n-SD: n-standard deviation thresholding from remote myocardium. * p < 0.05 by means of Mann–Whitney U test.
Publisher’s Note: MDPI stays neutral with regard to jurisdictional claims in published maps and institutional affiliations.

