Article

Target Detection Algorithm Based on Two Layers Human Visual System

School of Electrical Engineering and Automation, Harbin Institute of Technology, No.2 Yi-Kuang Street Nan Gang District, Harbin 150001, China
*
Author to whom correspondence should be addressed.
Algorithms 2015, 8(3), 541-551; https://0-doi-org.brum.beds.ac.uk/10.3390/a8030541
Submission received: 27 April 2015 / Revised: 17 July 2015 / Accepted: 17 July 2015 / Published: 29 July 2015
(This article belongs to the Special Issue Machine Learning Algorithms for Big Data)

Abstract

:
Robust small target detection of low signal-to-noise ratio (SNR) is very important in infrared search and track applications for self-defense or attacks. Due to the complex background, current algorithms have some unsolved issues with false alarm rate. In order to reduce the false alarm rate, an infrared small target detection algorithm based on saliency detection and support vector machine was proposed. Firstly, we detect salient regions that may contain targets with phase spectrum Fourier transform (PFT) approach. Then, target recognition was performed in the salient regions. Experimental results show the proposed algorithm has ideal robustness and efficiency for real infrared small target detection applications.

1. Introduction

Infrared (IR) small-target detection plays a critical role in large amounts of practical projects such as infrared warning and defense alertness, in which not only accuracy is needed but also robustness is required [1]. Various algorithms have been developed in the past few decades [2,3,4]. Conventional small target detection methods such as top-hat filter [2], max-mean/max-median filter [3] and high-pass filters based on least spuares support vector machine (LS-SVM) [4] are widely used to reduce the background clutters. In recent years, a series of simple and fast algorithm based on Fourier transform was proposed, such as spectral residual (SR) [5], phase spectrum of Fourier transform (PFT) [6], hypercomplex Fourier transform (HFT) [7]. With regards to small target detection, frequency domain method is quite different from other methods. It transforms the airspace information to the frequency domain, defines significant target and tests in the frequency domain. While, spectral residual (SR) approach does not rely on the parameters. It calculates the difference between the original signal and a smooth one in the log amplitude spectrum, and then makes up a saliency map by transforming SR to spatial domain. PFT approach detects small targets from the reconstruction that is calculated only by the phase spectrum of the input signal. It omits the computation of SR in the amplitude spectrum, which saves about 1/3 computational cost. HFT approach explains the intrinsic theory of saliency detector in the frequency domain and use spectral filter to suppress repeated patterns.
Although numerous methods have been proposed, many of them may fail in certain circumstances, e.g., ground-sky background [8], which is common in the helicopter view. In this situation, targets are easily mixed up with the background clutters in size and easily overlapped by vegetation, roads, rivers, bridges [9], resulting a huge false rate in traditional algorithm.
In order to design an appropriate method, a small target detection method inspired by the human visual system (HVS) has been designed in this paper. HVS is a kind of layered image processing system consisting of optical system, retina and visual pathways, which is nonuniform and nonlinear. The rest of this paper is organized as follows. In Section 2, we describe the framework of the proposed algorithm for small target detection. In Section 3, we present the experimental results. Section 4 is the conclusion of this article.

2. Algorithm Based on Human Visual System

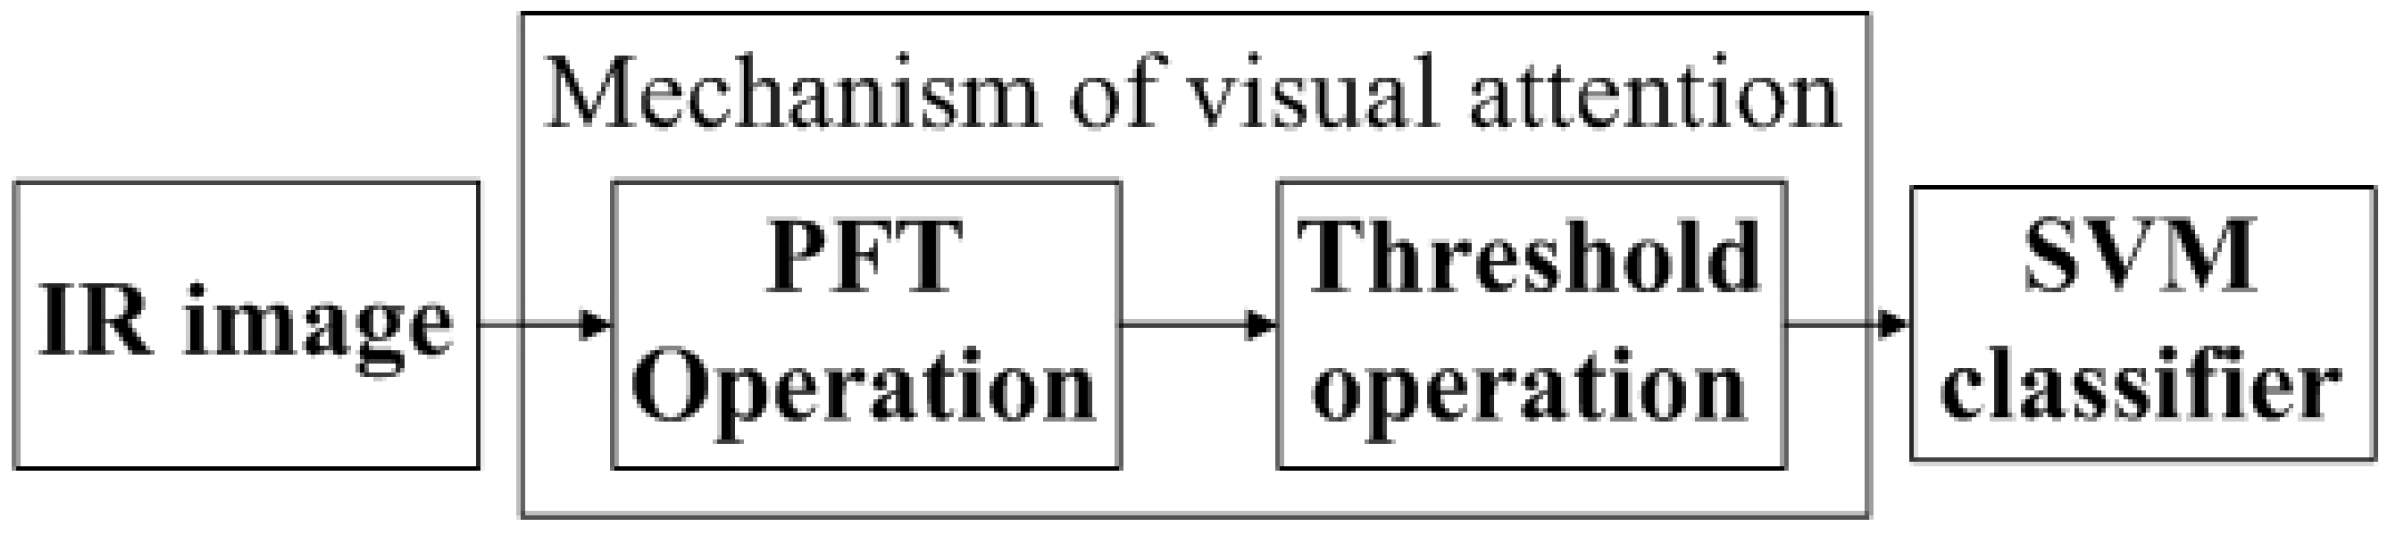
2.1. Framework of the Proposed Two Stage Algorithm—A Brief Description

HVS divides the scene into small patches and select important information through visual attention selection mechanism to make it easy to understand and analyze. On the other hand, as a component of low-level artificial vision processing, it facilitates subsequent procedures by reducing computational cost, which is a key consideration in real-time applications. Based on the above knowledge, we propose a framework consisting of two stages inspired by HVS as follows (See Figure 1). In predetection stage, a saliency map (SM) is obtained and the most salient region is picked up to improve detection speed. In detection stage, a support vector machines (SVM) classifier is used to get the target quickly.
Figure 1. The proposed framework inspired by human visual system (HVS).
Algorithms 08 00541 g001
Due to the two layers structure, the algorithm computational complexity becomes the prime concern. For the simplicity and high processing speed, saliency detection methods in the frequency domain are chosen. For instance, PFT is an advanced and effective method in saliency detection and expounds the real significance of frequency domain significant. Details will be described in Section 2.2. Candidate targets can be got through PFT followed by threshold operation.
Then, HVS will conduct some complex processing to separate targets from background clutters. Since background clutters are similar to the infrared targets in the size and shape, it is very difficult for traditional algorithms to distinguish them. SVM classifier, making use of the statistical features of targets, will be very effective to solve this kind of classification problem. Details will be described in Section 2.3.

2.2. The Theory of Frequency-Domain in the First Stage

Most existing significant target detection method is through detecting abnormal patterns in the image, namely, its difference with other parts of the image. Through defining and controlling insignificant areas, namely those easily overlooked by human eye attention mechanism, methods of frequency domain can distinguish the significant target.
In the model based on frequency-domain, we assume that a natural image consists of several salient and many so-called regular regions. All of these entities (whether distinct or not) may be considered as visual stimuli that compete for attention in the visual cortex. Then, the image is divided into many patches (at a particular scale), some of which are distinctive, while others are quite homogenous. These regular patches are identified as repeated patterns, which correspond to non-saliency. Then suppress them through several different operations in frequency-domain. These kinds of methods (e.g., SR, PFT, HFT) essentially suppress regular regions through suppress amplitude spectrum of the regular regions, thereby producing the pop-out of the salient objects. Here follows the expression in mathematics of these methods.
First we introduce the related definition. Given an image f ( x , y ) , it was first transformed into the frequency domain: f ( x , y ) F F ( f ) ( u , v ) . The amplitude A ( u , v ) = F ( f ) and phase P ( u , v ) = a n g l e ( F ( f ) ) spectra are calculated, and then the log amplitude spectrum is obtained: L ( u , v ) = l o g ( A ( u , v ) ) .
The operation in amplitude spectrum of SR method is defined as [5].
A S R ( u , v ) = L ( u , v ) - L ( u , v ) × h n ( f )
where h n ( f ) is a n × n matrix defined by:
h n ( f ) = 1 n 2 1 1 1 1 1 1 1 1 1
In PFT reconstruction, amplitude spectrum is abandoned which means A P F T ( u , v ) = 1 [6]. For HFT method, a gaussian kernel h G is employed to suppress spikes in amplitude spectrum [7]:
A H F T ( u , v ) = F ( f ( x , y ) ) × h G
The resulting processed amplitude spectrum A ( A S R for SR, 1 for PFT and A H F T for HFT) and the original phase spectrum are combined to compute the inverse transform, which in turn, yields the saliency map [6]:
S = F - 1 A ( u , v ) e i × P ( u , v )
In order to improve the visual display of saliency, we define saliency map hereafter as Equation (5), where g is the parameter to adjust gray level of the saliency map. For convenience, here we set g to be 10.
S = g × F - 1 A ( u , v ) e i × P ( u , v )
Based on the conclusion of [7], PFT algorithm is more effective for a small target. Therefore, we choose PFT algorithm. After the final significant map be obtained, a threshold operation is used to pick out the most salient points. Then, we define the thresholds as followed.
T = 1 N I j = 1 N I S j + k × M a x S j - 1 N I j = 1 N I S j
where S j represents the saliency value of the j t h pixel, N I is the number of the pixels of the image. k is a parameter from 0 to 1 and be used to control the threshold changing from 1 N I j = 1 N I S j to M a x S j . We only deal with those areas above the threshold. Setting threshold can effectively reduce the number of salient areas, thus reduce the amount of calculation.

2.3. The Theory of SVM Classifier in the Second Stage

The thought of detection algorithm based on machine learning is to convert a target detection problem into a pattern classification problem. In this case, we use SVM classifier, which is a linear classifier that maximizes the margin between different classes of support vectors in a high dimensional space and also one of the most attractive methods to solve this kind of problem. With regard to the binary classification scenario, { x i , y i } i = 1 N be a training set with x i R n as the input space, y i { - 1 , + 1 } as the output space. Then the fundamental goals of the standard SVM classifier can be defined as [10]:
ω T φ ( x i ) + b 1 , y i = 1 ω T φ ( x i ) + b 1 , y i = - 1
Here, φ ( ) : R n R m the kernel function mapping the vector from low-dimensional space to high-dimensional feature space. Then use hyperplanes ( ω R m , b R ) to classify the data. Thus, classification function is [10]:
y ( x ) = s i g n ( ω T φ ( x ) + b )
To do the classification correctly, it is important to obtain training sets through using the statistical features of the small targets. An accurate sample library of the target and the background is the key of the correct classification. When select a sequence of images, we make the first few sequence of images proxy for the training sample. Also, we use true targets as target samples and pseudo targets as background samples which belong to the salient regions of the first a few pictures. Considering that the target shape may have a slight change in the process of moving as a result of the change of direction and attitude, we could update the training set to make the classifier more intelligent. This process adds true and false target of the testing image into the training set respectively.
After the above preparation, we define the centers of salient areas obtained in the Section 2.2 as the suspected target centers and use the SVM classifier to classify these pixels with its 16 × 16 neighbors. Attributed to SVM classifier successful separations of target from clutters, the accuracy can be improved to a satisfactory degree.

3. Experimental Section

Experiments on the real IR image sequence have been done. The sequence contains 130 images with a resolution of 128 × 128 , obtained from United States Army Aviation and Missile Command (AMCOM). Each image involves one target, and the real targets are marked by asterisk (see Figure 2). Select a sequence of images, the first 30 images are treated as the training sample and the rest are used in experiment. All experiments were implemented by MATLAB software on a PC with 4-GB memory and 3.2-GHz Intel i5 dual processor.
Figure 2. One of the real infrared (IR) images for experiment.
Algorithms 08 00541 g002
Our algorithm can be divided into two stages (See Section 2.1). Conditioned on that PFT get a high detection rate in the first stage, SVM classifier can reduce fault detection rate in the second stage. Then, experimental results of two stages will be discussed in Section 3.1 and Section 3.2 respectively .

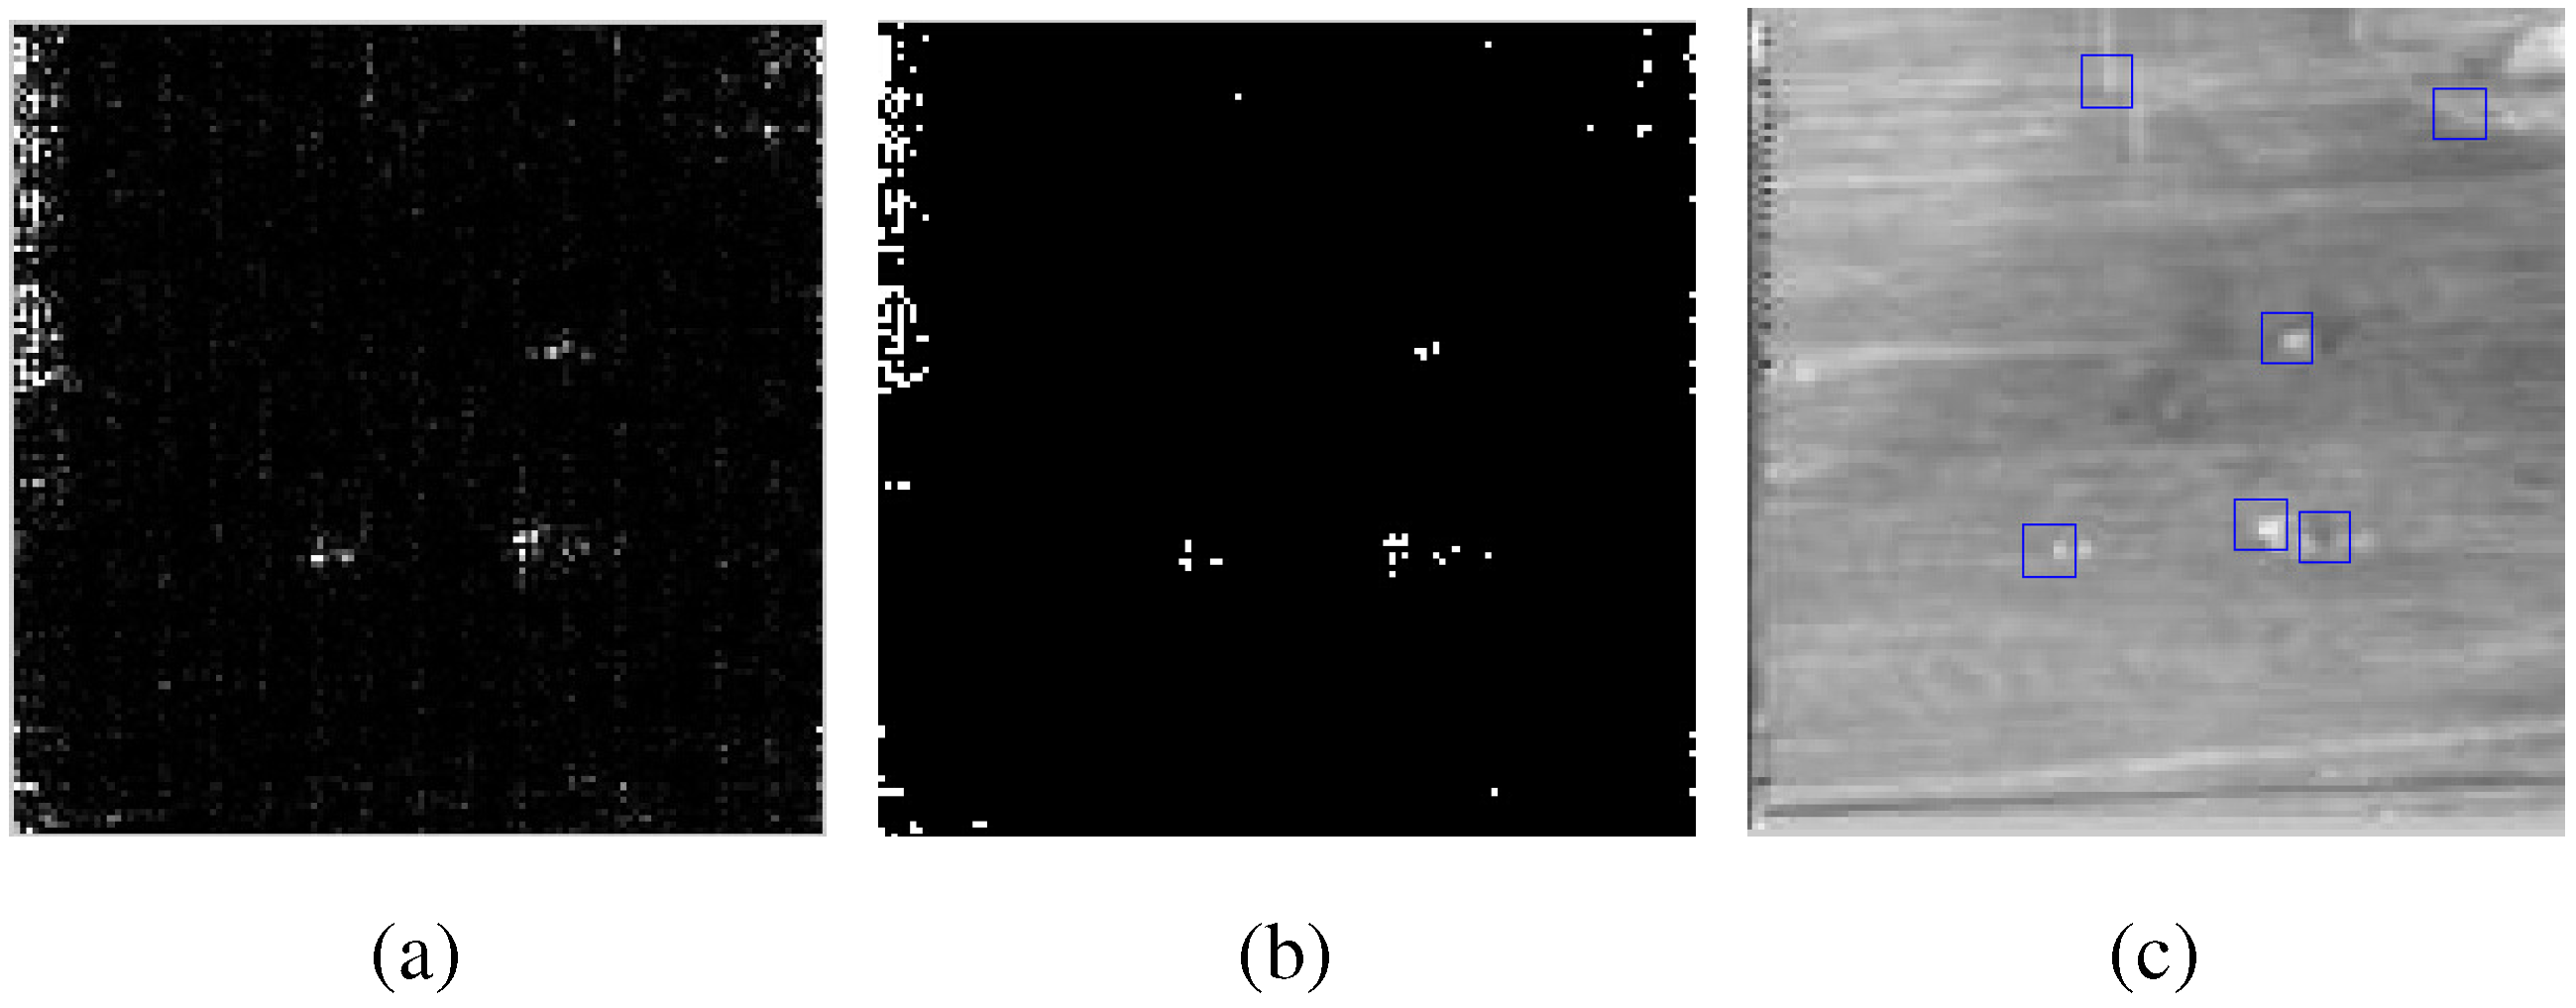
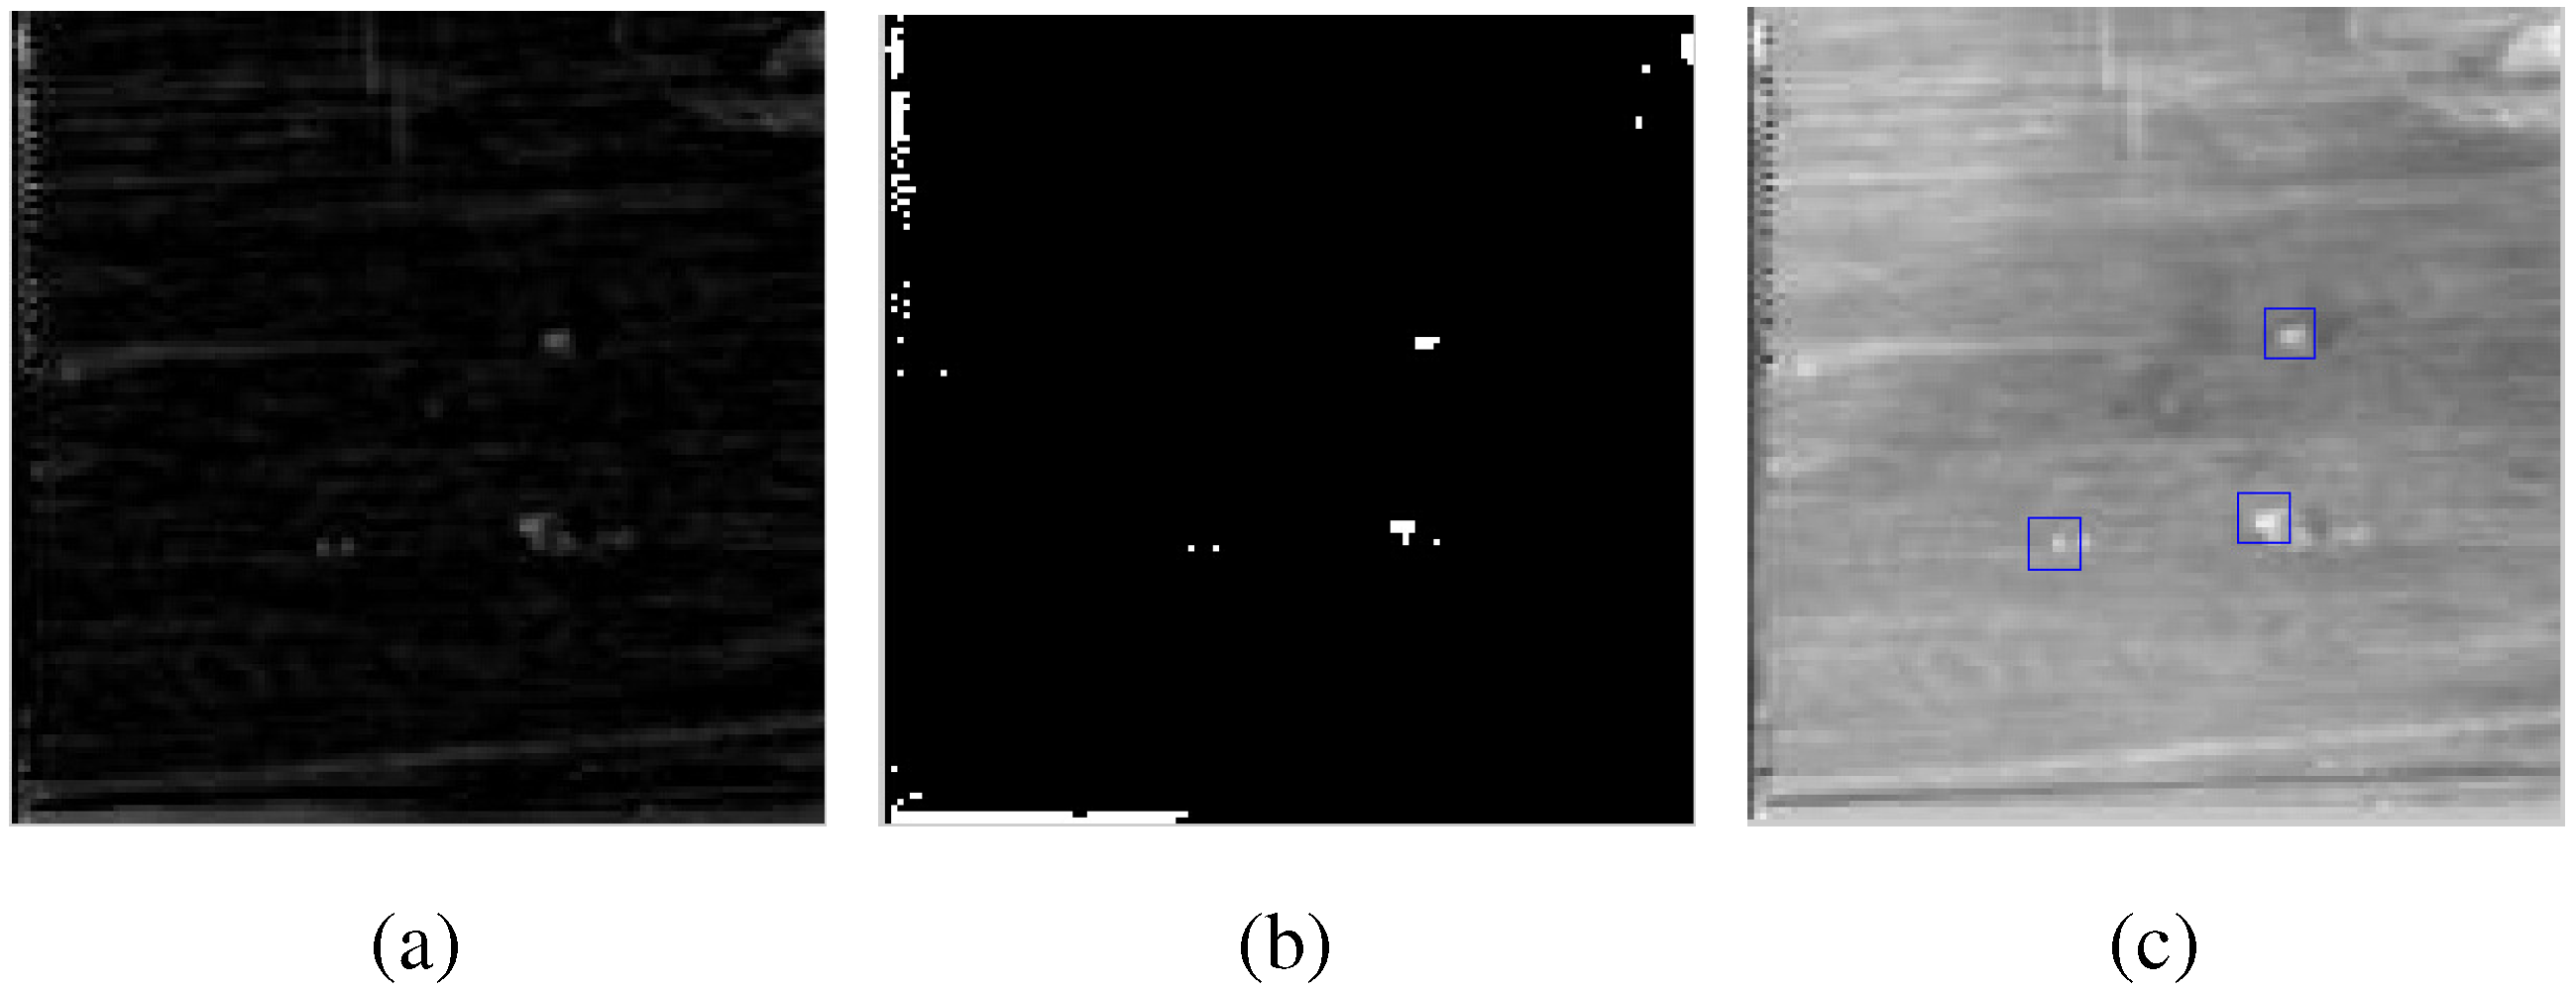
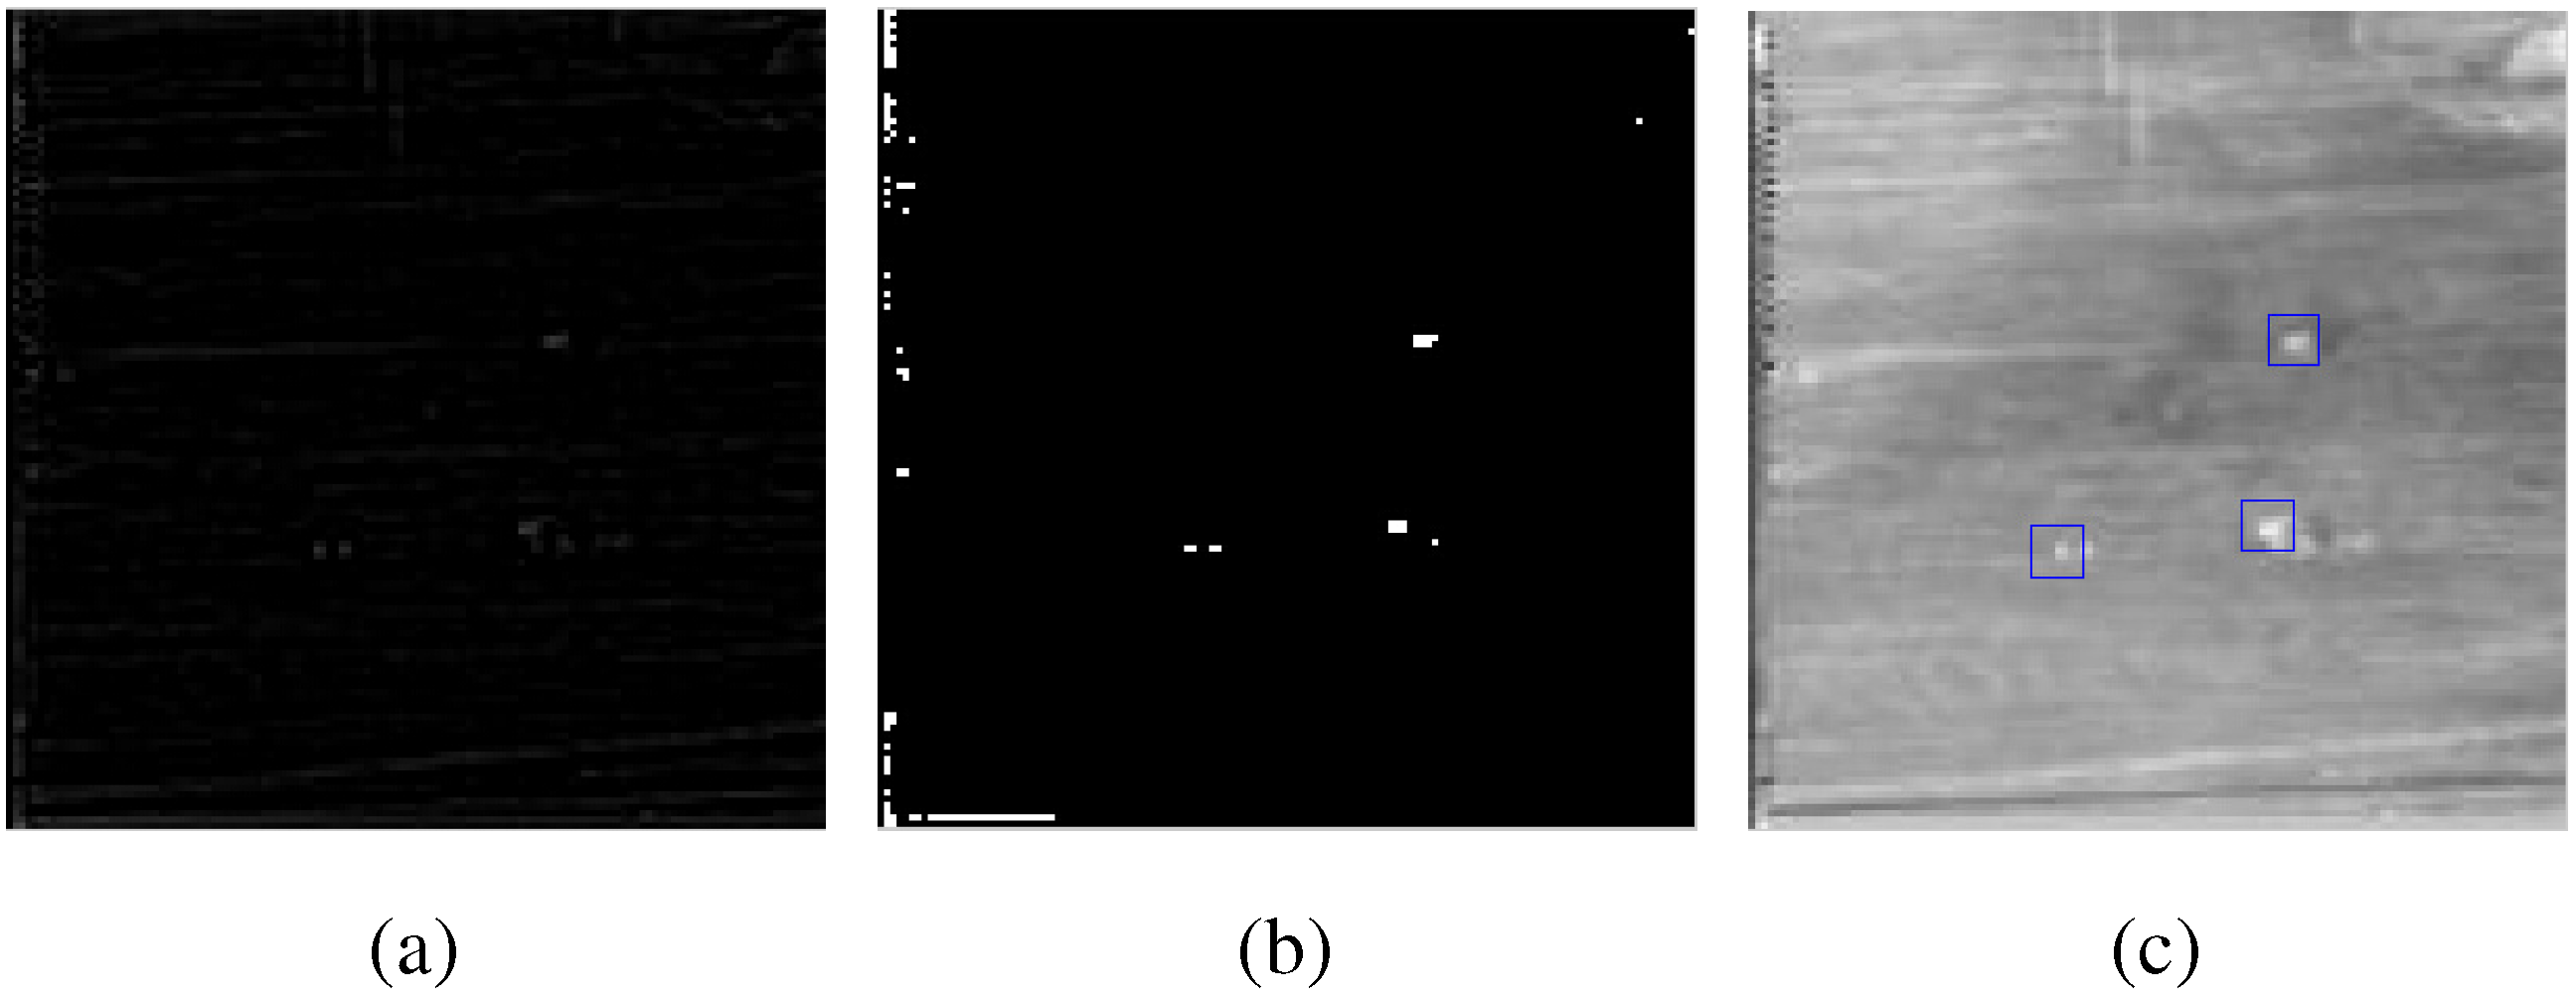
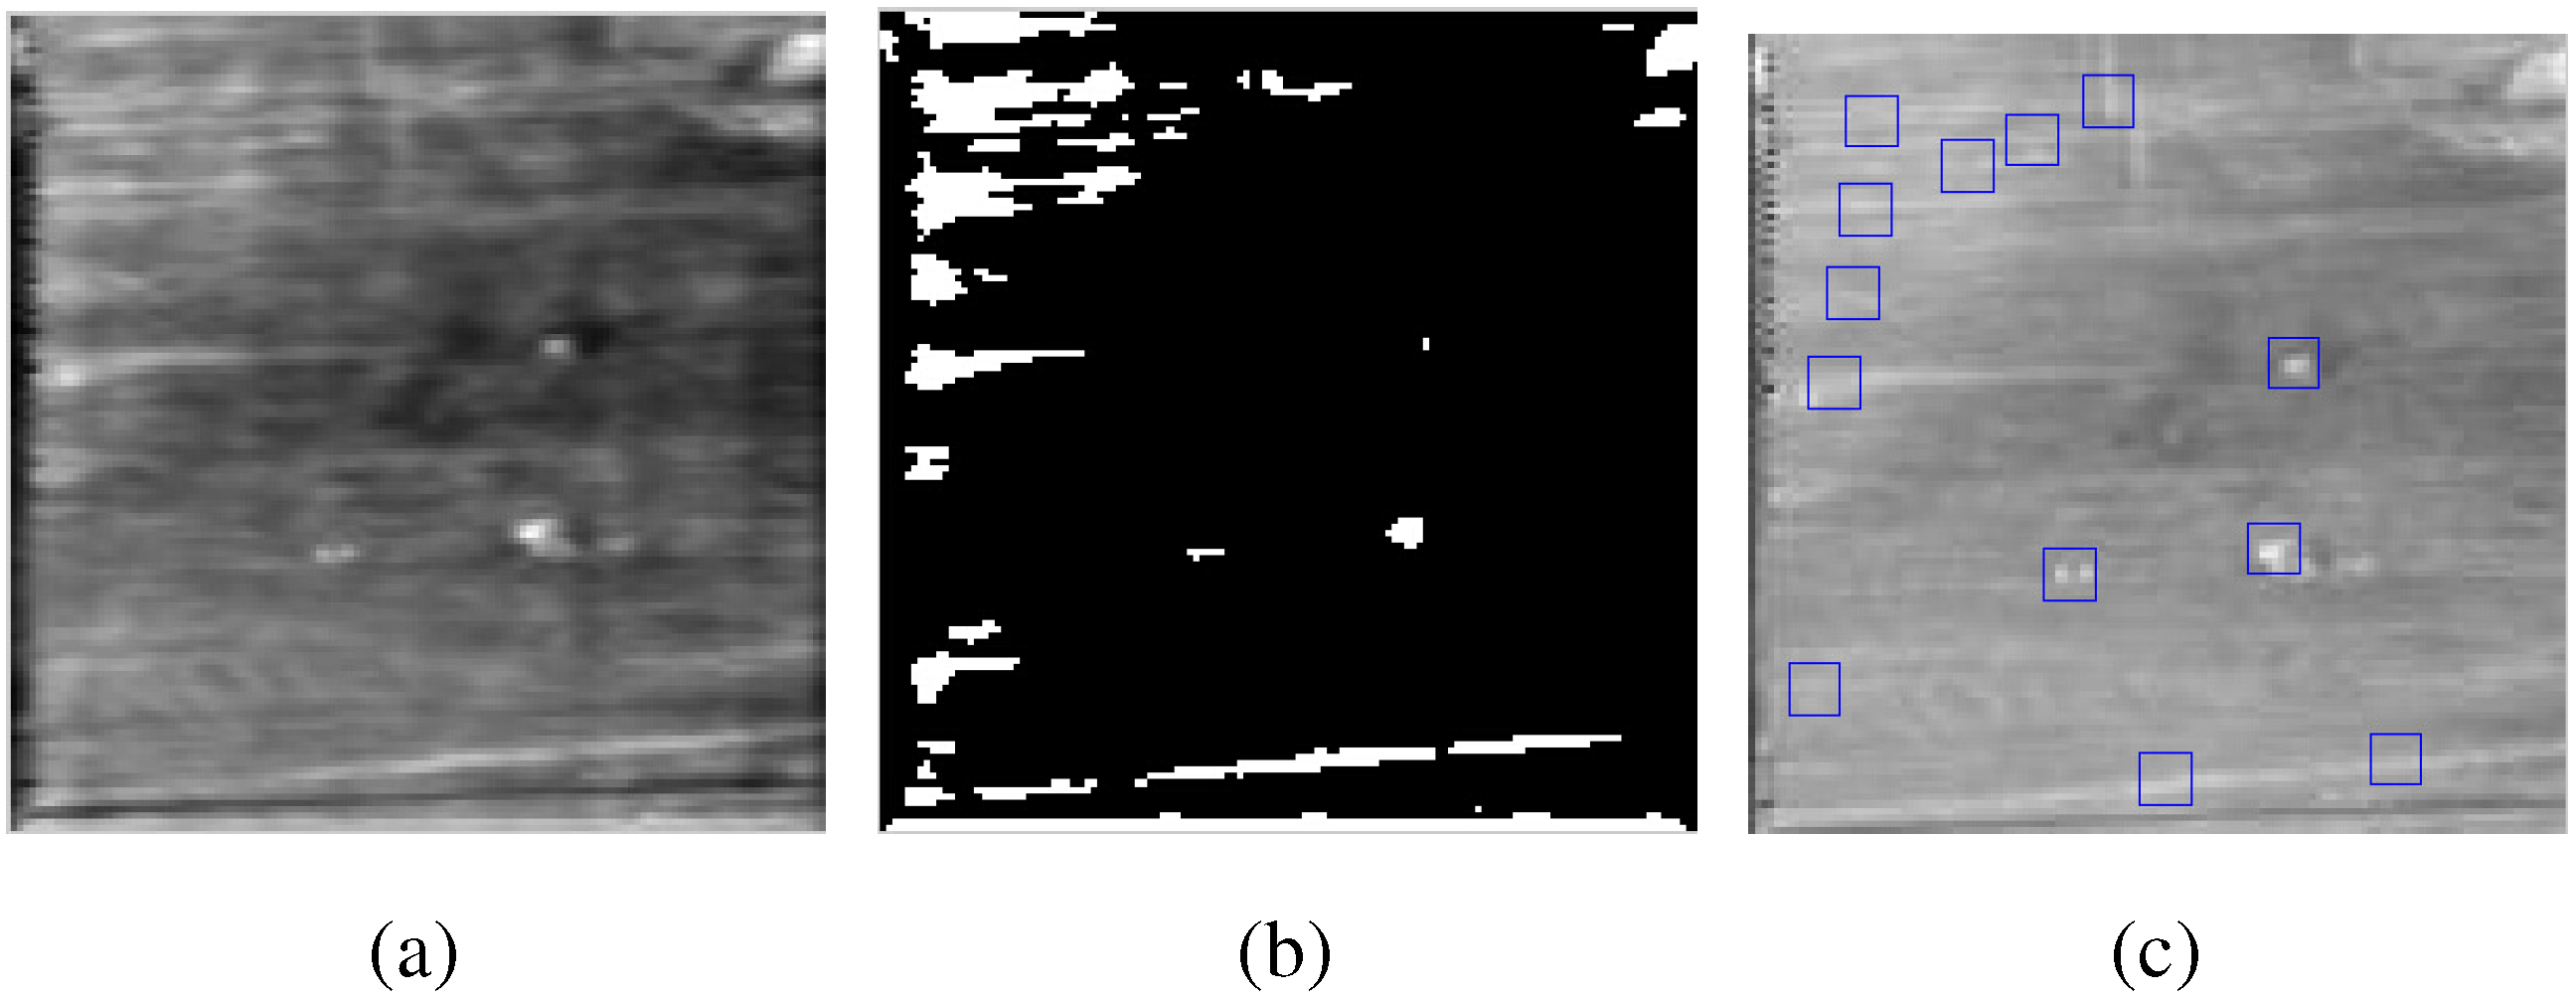
3.1. Experiment Result of One Layer

Experimental results using the PFT algorithm are shown in Figure 3. The same image in Figure 2 are used to be the example.
Figure 3a is the saliency map after PFT calculation. Figure 3b is the result of threshold operation. Parameter k in threshold is set to be 0.3. It can be seen that the target has more saliency, which will help to improve detection rate and reduce false alarm rate. Figure 3c shows the detection result where all the targets are labeled in rectangles.
Figure 3. Figures of phase spectrum Fourier transform (PFT). (a) saliency map of PFT method; (b) result of threshold operation; (c) final result marked by blue block.
Algorithms 08 00541 g003
To demonstrate the detection effect of the proposed algorithm, we compare it with other three IR small target detection methods, including traditional top-hat algorithm (See Figure 4), two-dimensional least mean square (TDLMS) algorithm (See Figure 5) and HFT algorithm (See Figure 6). Here follows a brief introduction of top-hat algorithm and TDLMS algorithm.
Figure 4. Figures of top-hat. (a) saliency map of top-hat method; (b) result of threshold operation; (c) final result marked by blue block.
Algorithms 08 00541 g004
Figure 5. Figures of two-dimensional least mean square (TDLMS). (a) saliency map of TDLMS method; (b) result of threshold operation; (c) final result marked by blue block.
Algorithms 08 00541 g005
Top-hat is a mathematical morphology operation based on two basic operations: Dilation and erosion. The two basic operations includes the opening operations which smooth bright small regions of images and the closing operations which eliminate dark small holes Top-hat can be defined as the result of subtracting the original image from the opening operation of the original image and the structuring element. So, it can be used directly to detect potential targets.
TDLMS filter acts as a background prediction operator when applied to the infrared small target detection. The filter can predict the image background with a long correlation length accurately. However, when the filter window moves to the area containing small targets which have a smaller correlation length, it will not be able to converge to the optimal solution. This method utilizes this property to separate small targets from the infrared image.
Figure 6. Figures of hypercomplex Fourier transform (HFT). (a) saliency map of HFT method; (b) result of threshold operation; (c) final result marked by blue block.
Algorithms 08 00541 g006
In these three figures, (a) is the preprocessing result of the algorithm. (b) is the result after the same threshold operation as the proposed algorithm. (c) is the detection result. To reveal the advantages of the proposed algorithm to the other three algorithms, set algorithms threshold to different values and compare the detection rate [true positive rate (TPR) defined in (9)].
T P R = Q u a n t i t y o f t r u e t a r g e t s d e t e c t e d i n i m a g e s Q u a n t i t y o f t r u e t a r g e t s e x i s t i n g i n i m a g e s × 100 %
Experimental results (we will show them in Section 3.2) show that the parameter k in Equation (6) is suitable to be set from 0.36 to 0.5 in our work. We can get high TRP with all kinds of algorithms by selecting this parameters section so as to meet the requirements. At the same time, we can get the conclusion that PFT can achieve the best performance in TPR. TDLMS algorithm and top-hat method have lower TPRs. HFT method is obviously not suitable for small target, which makes its TPR lowest in all methods.

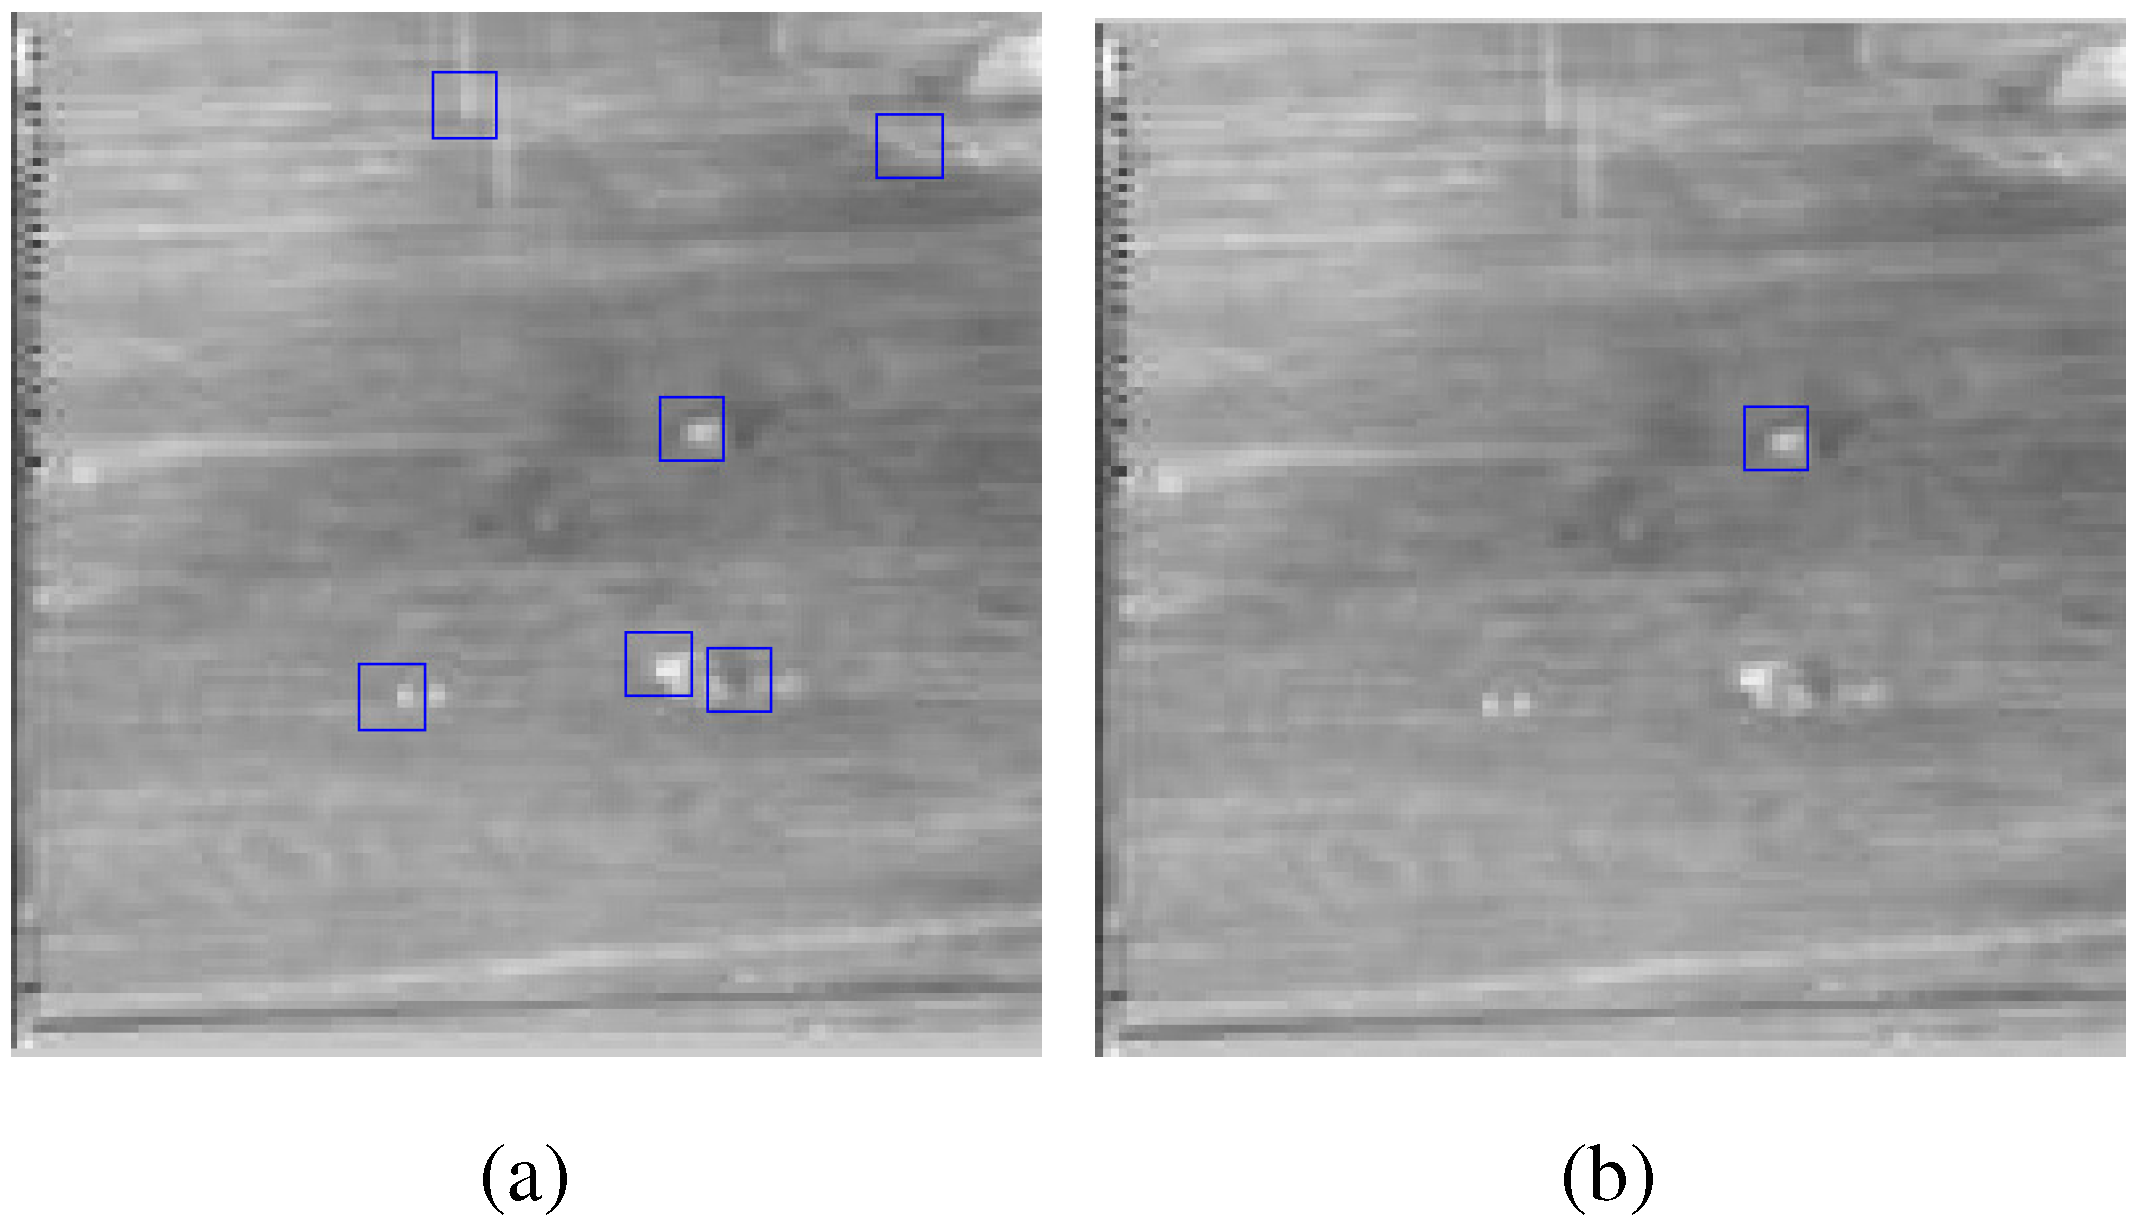
3.2. Experiment Result of Two Layers
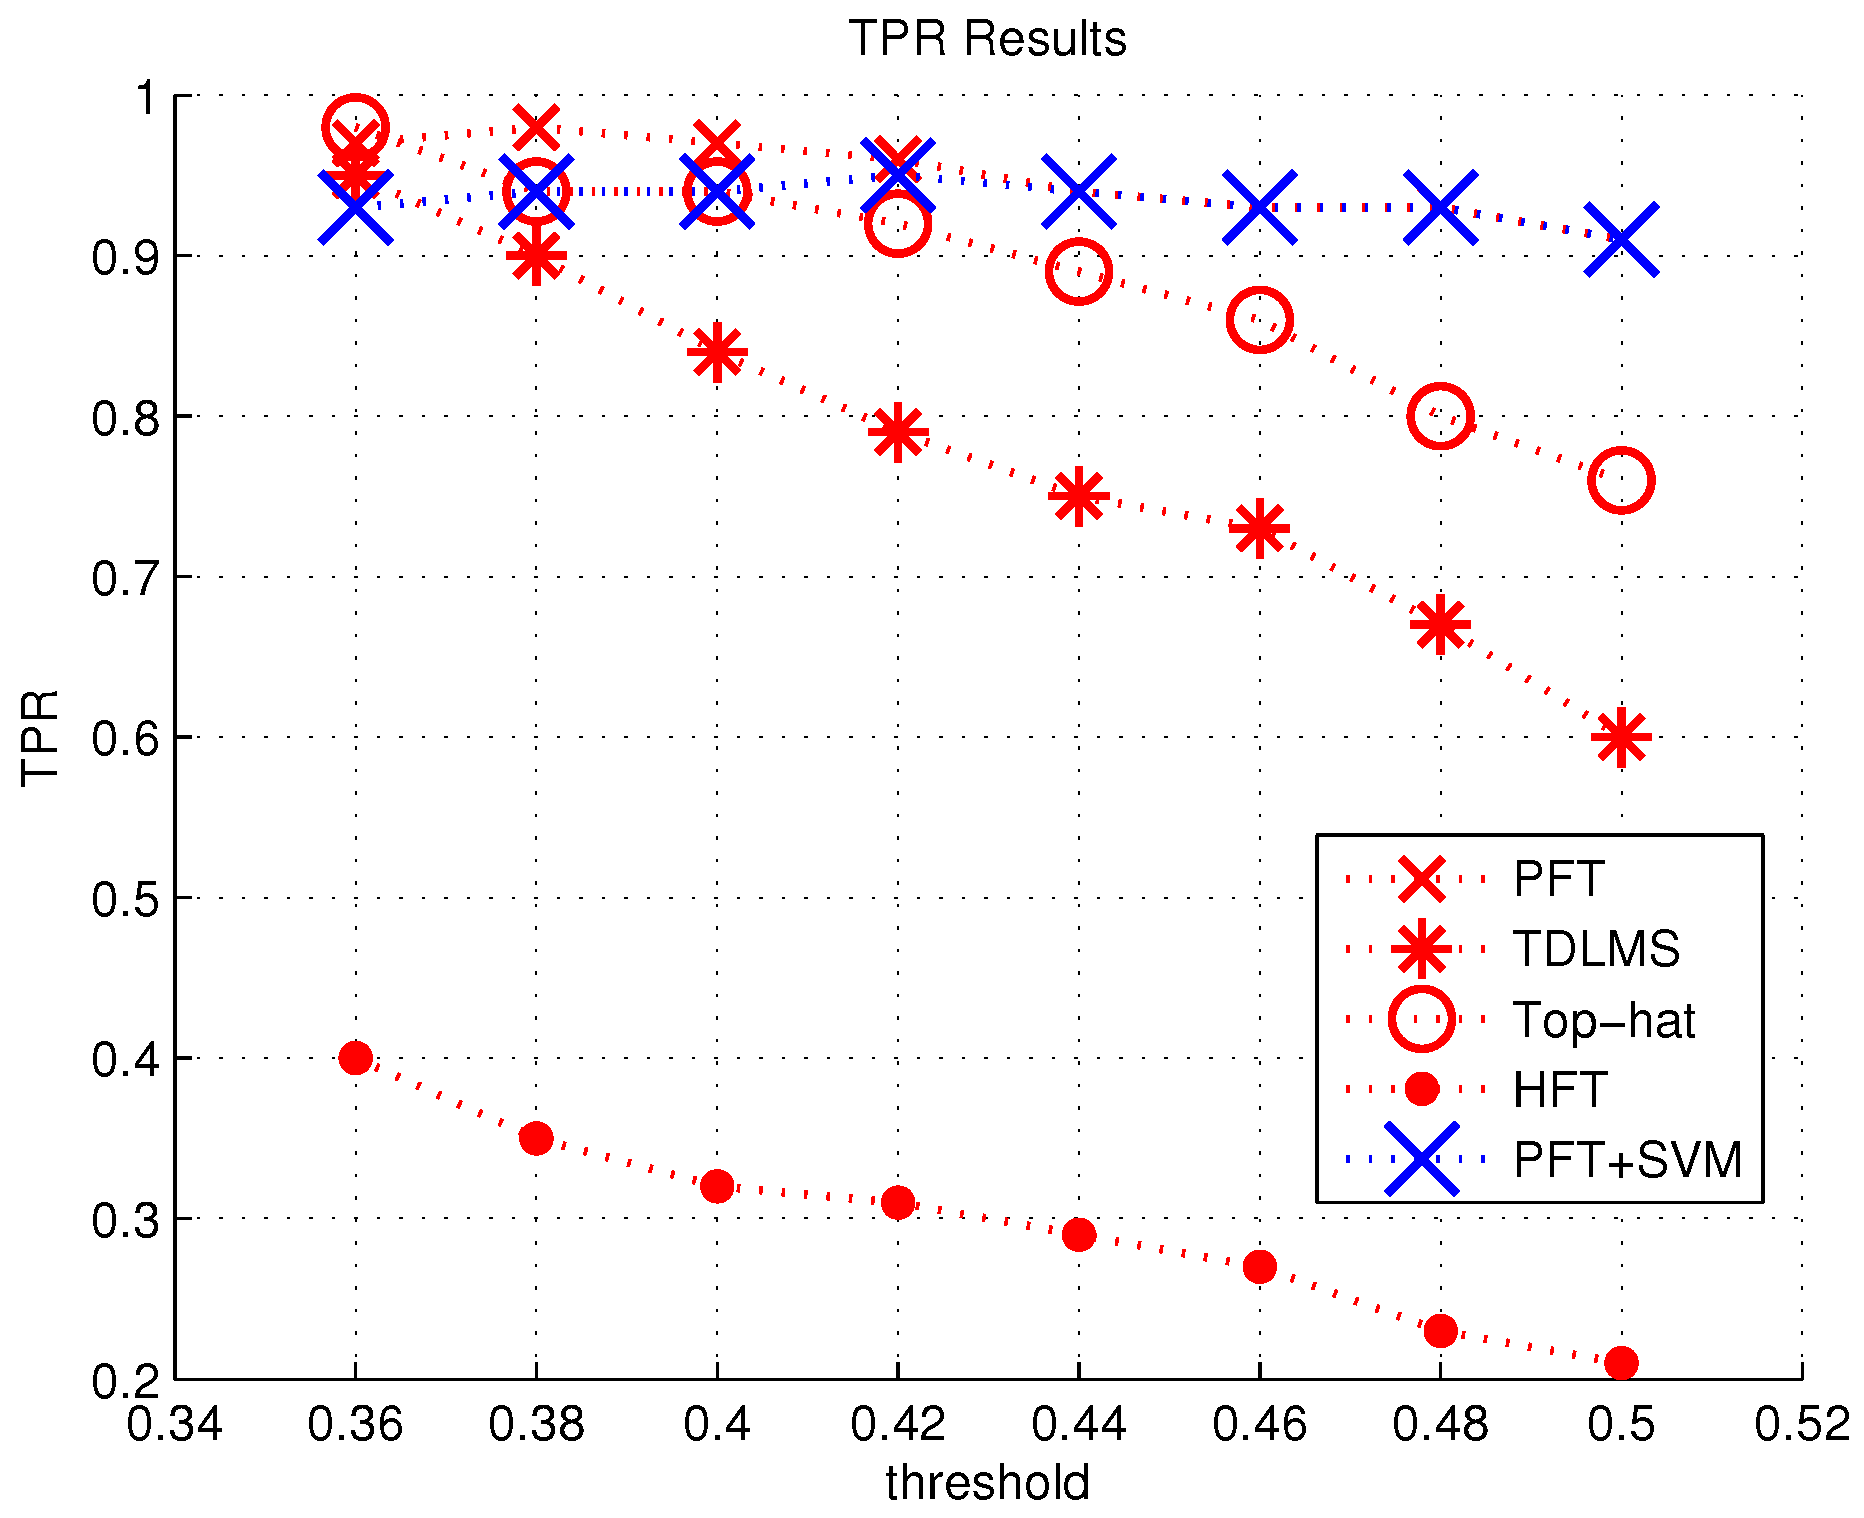
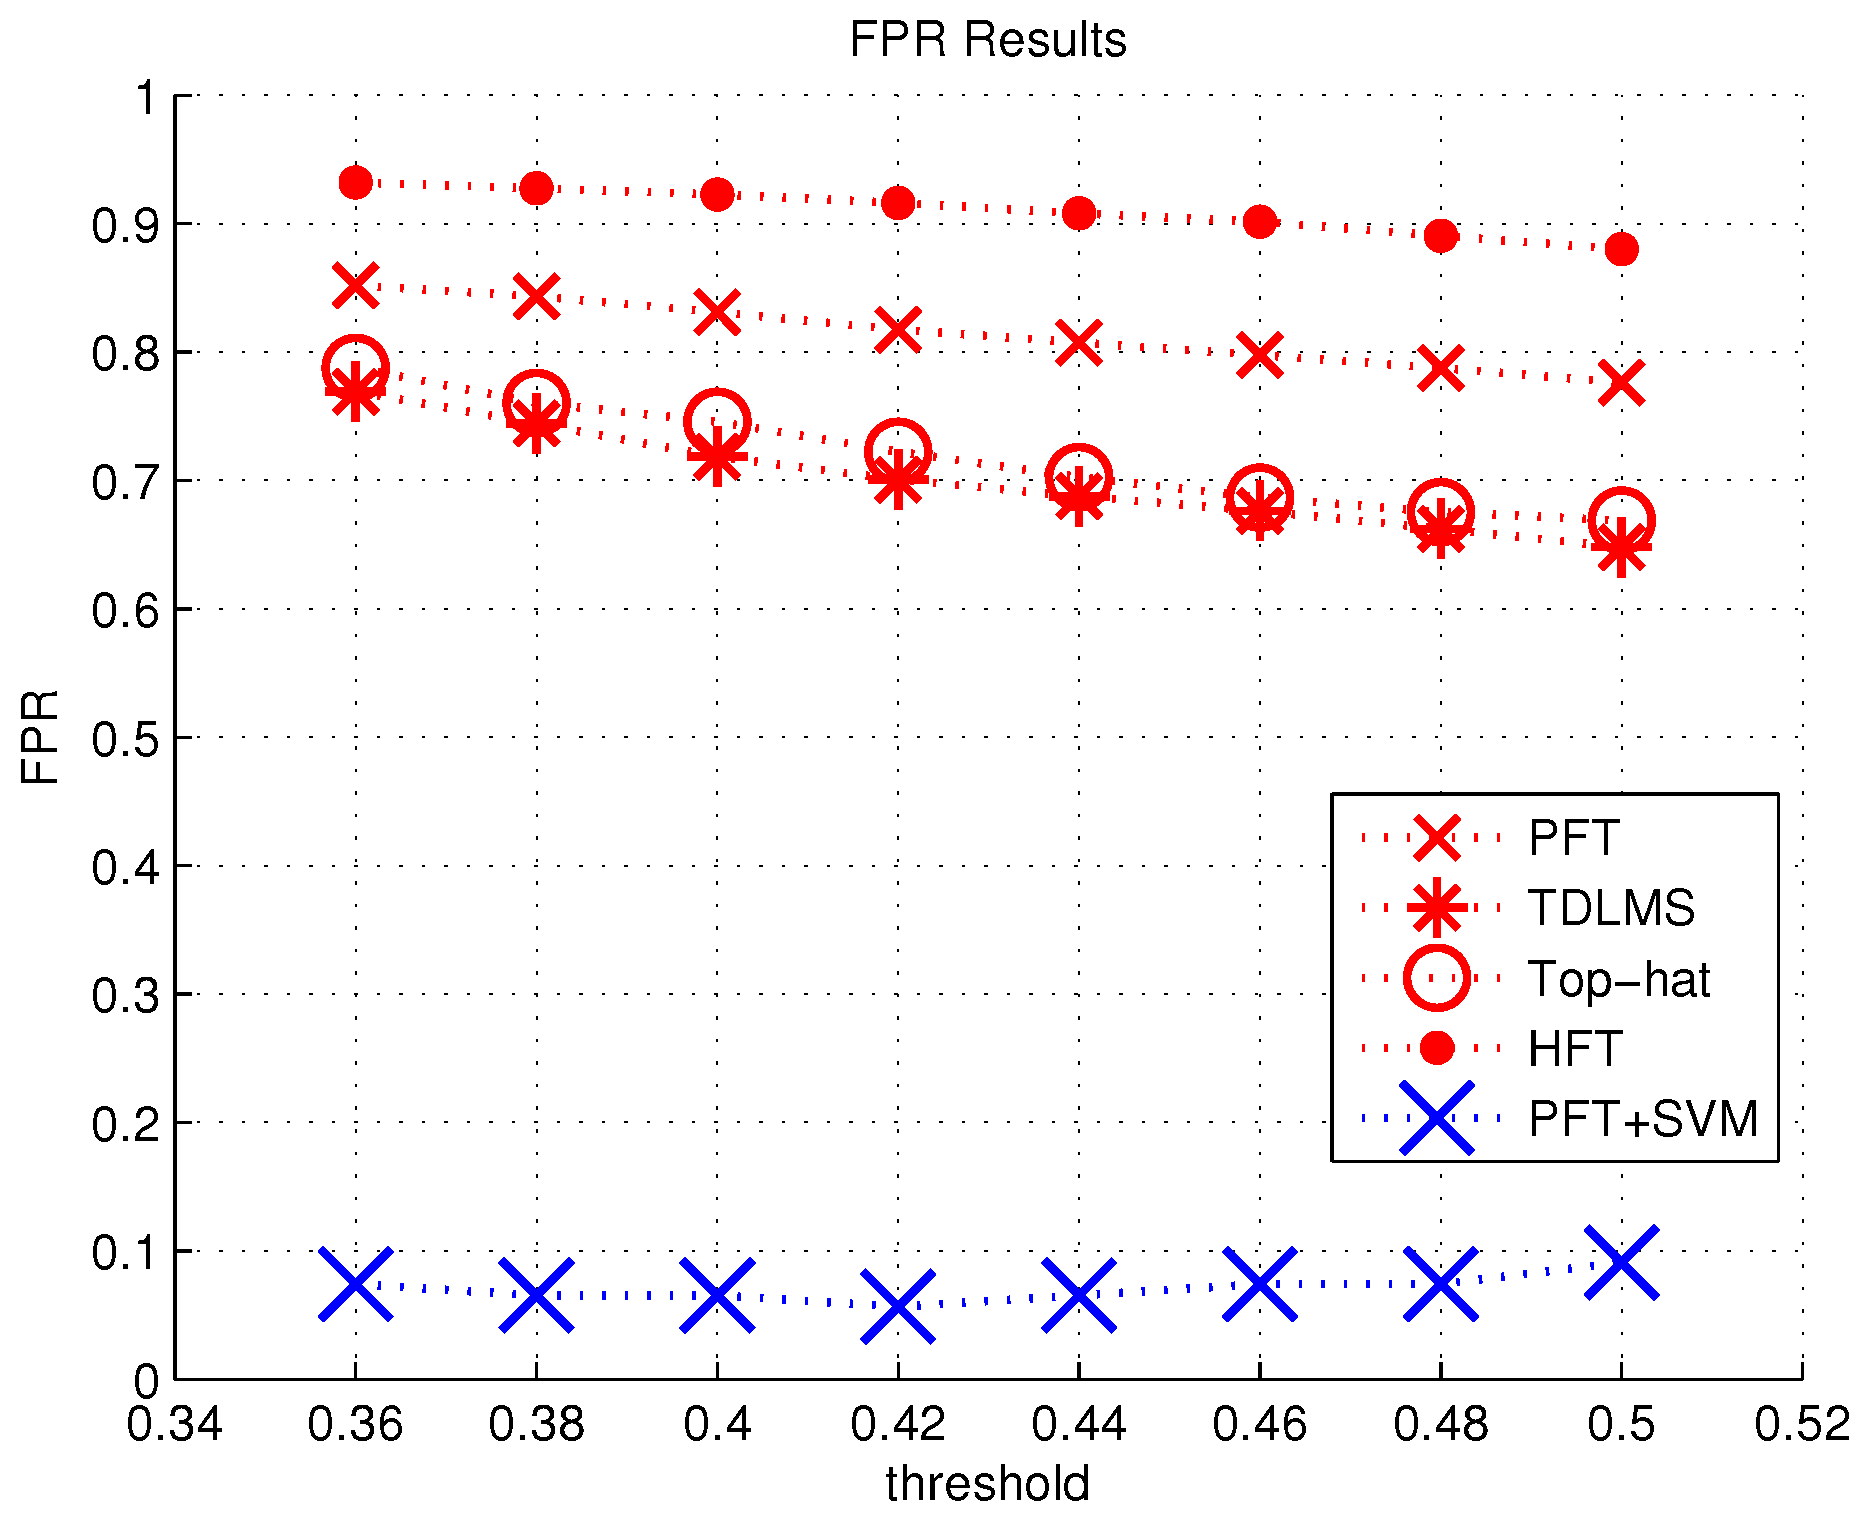
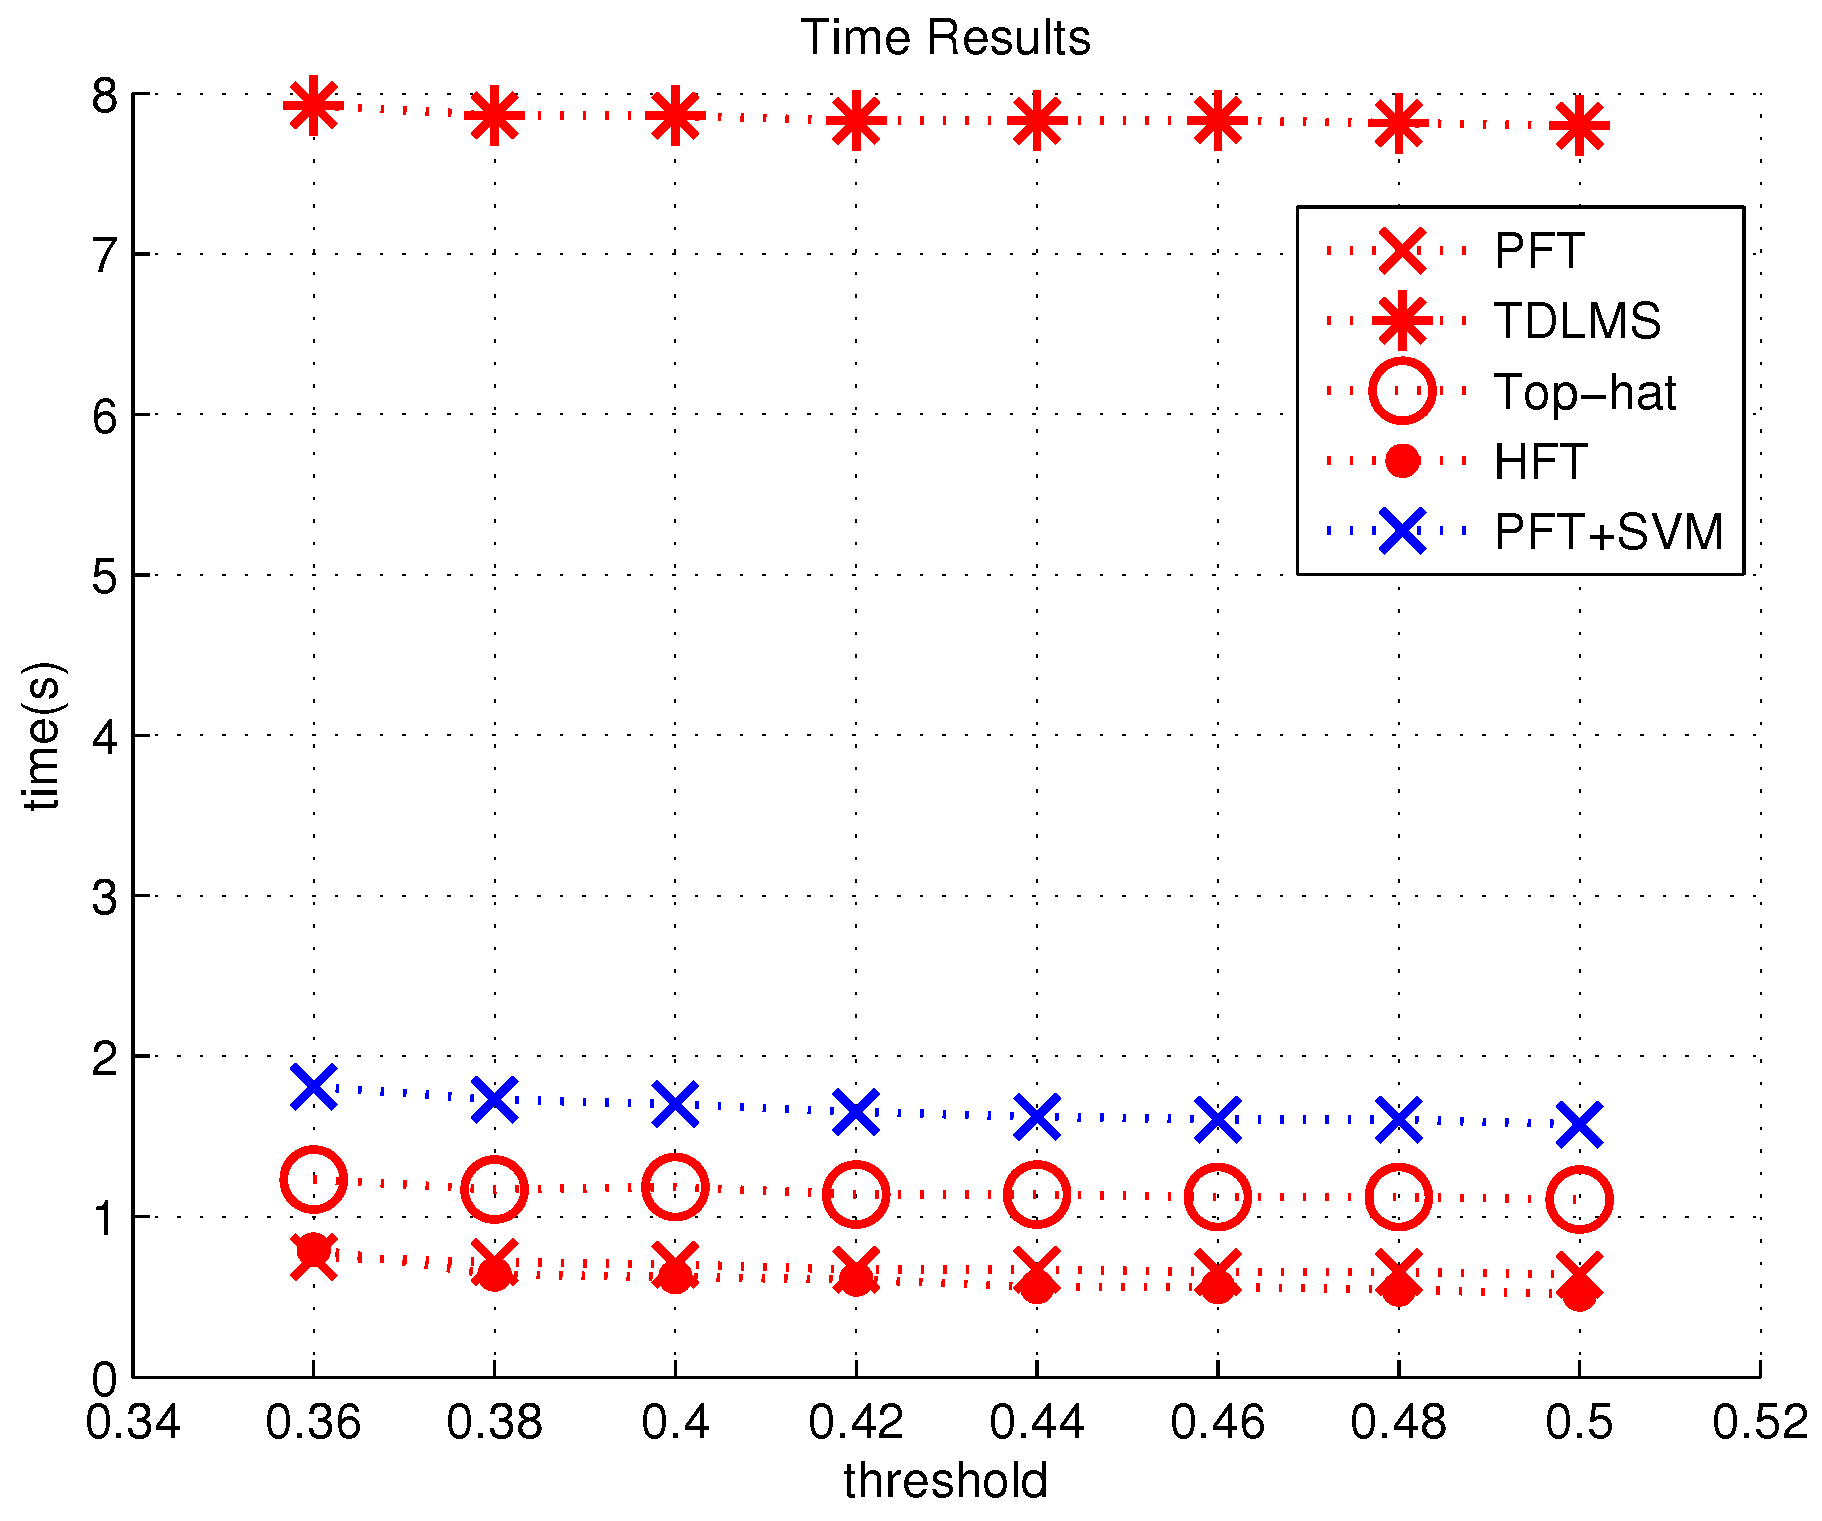
Although the targets are successfully detected, there are still exist many false alarms. We hope that the false alarm rate will be reduced [false positive rate (FPR) defined in Equation (10)] with the SVM classifier.
F P R = Q u a n t i t y o f f a l s e d e t e c t e d i n i m a g e s Q u a n t i t y o f t r u e t a r g e t s e x i s t i n g i n i m a g e s × 100 %
Experimental results using the proposed algorithm are shown in Figure 7. Figure 7a is the detection result of PFT, while Figure 7b is the detection result of PFT and SVM classifier. Obviously, SVM classifier can effectively distinguish the false target and the real goal.
Figure 7. The contrast of one layer method and two layers method. (a) Result of one layer method. (b) Result of two layers method.
Algorithms 08 00541 g007
The Figure 8 reveals that SVM classifier may reduce the detection rate of the algorithm, which is determined by the classifier’s own accuracy. In Figure 9, FPR of methods without SVM classifier are always higher than 70%, nevertheless, FPR of our method is encouraging lower than 30% .
Finally, we compare the computational cost of these detection methods for 100 images (see Figure 10). The experimental results illustrate that HFT and PFT have the fastest computing speed among all these methods. Due to the newly added classification operation, the proposed algorithm is just a few seconds slower.
We choose 0.44 as the threshold to compare the performance of all methods and list the index in Table 1. The result of the experiment shows that traditional algorithms have inevitable difficulties in detecting small target in complex background on the ground. By contrast, the proposed algorithm can greatly reduce the FPR.
Figure 8. True positive rate (TPR) of all methods.
Algorithms 08 00541 g008
Figure 9. False positive rate (FPR) of all methods.
Algorithms 08 00541 g009
Figure 10. Time of all methods.
Algorithms 08 00541 g010
Table 1. Compareation of TPR, FPR and time results between two layers method and one layer method (k = 0.44).
MethodTPRFPRTime(s)
two layers (PFT + SVM)0.940.06541.623
one layer (PFT)0.940.80730.671
one layer (TOP-HAT)0.890.70241.139
one layer (TDLMS)0.750.68757.831
one layer (HFT)0.290.90810.562

4. Conclusions

In this paper, a robust IR small target detection algorithm based on HVS has been proposed. First, we use PFT and a threshold operation to choose the most significant areas. Then SVM classifier separates targets from background clutters. Experimental results show that the proposed algorithm is robust to resist pseudo targets and can achieve a high detection rate in less than 0.02 s with a fast calculation speed. It is worth noting that the FPR of proposed algorithm is far below other algorithms. This algorithm can be either directly used in single-frame target detection or used as a foundation module in sequential target tracking for real-time applications.

Acknowledgments

This work is supported by the National Science Foundation of China (Grant No. 61301207).

Author Contributions

Zheng Cui proposed the method and wrote the manuscript. Jingli Yang perform the data analysis. Changan Wei contributed to the conception of study. Shouda Jiang helped proform the analysis with constructive discussions.

Conflicts of Interest

The authors declare no conflict of interest.

References

  1. GUO, W.; Sun, J.; Lin, H. Dynamic template preparing and application on FLIR target recognition. In Proceedings of the IEEE International Conference on Electrical and Control Engineering (ICECE), Wuhan, China, 25–27 June 2010; pp. 864–867.
  2. Tom, V.T.; Peli, T.; Leung, M.; Bondaryk, J.E. Morphology-based algorithm for point target detection in infrared backgrounds. Pro. SPIE 1993, 1954. [Google Scholar] [CrossRef]
  3. Deshpande, S.D.; Meng, H.E.; Venkateswarlu, R.; Chan, P. Max-mean and max-median filters for detection of small targets. In Proceedings of the SPIE’s International Symposium on Optical Science, Engineering, and Instrumentation, Denver, CO, USA, 18–23 July 1999; pp. 74–83.
  4. Wang, P.; Tian, J.; Gao, C.Q. Infrared small target detection using directional highpass filters based on LS-SVM. Electron. Lett. 2009, 45, 156–158. [Google Scholar] [CrossRef]
  5. Hou, X.; Zhang, L. Saliency detection: A spectral residual approach. In Proceedings of the IEEE Conference on Computer Vision and Pattern Recognition, Minneapolis, MN, USA, 17–22 June 2007; pp. 1–8.
  6. Guo, C.; Ma, Q.; Zhang, L. Spatio-temporal saliency detection using phase spectrum of quaternion fourier transform. In Proceedings of the IEEE Conference on Computer Vision and Pattern Recognition, Anchorage, AK, USA, 23–28 June 2008; pp. 1–8.
  7. Li, J.; Levine, M.D.; An, X.; Xu, X.; He, H. Visual saliency based on scale-space analysis in the frequency domain. IEEE Trans. Pattern Anal. Mach. Intell. 2013, 35, 996–1010. [Google Scholar] [CrossRef] [PubMed]
  8. Gao, C.; Meng, D.; Yang, Y.; Wang, Y.; Zhou, X.; Hauptmann, A.G. Infrared patch-image model for small target detection in a single image. IEEE Trans. Image Process. 2013, 22, 4996–5009. [Google Scholar] [CrossRef] [PubMed]
  9. Li, J.; Shi, D.; Yang, W. Infared target extraction in FLIR imagery based on spatio temporal using fuzzy clustering. In Proceedings of the Second International Symposium on Intelligent Information Technology Application, Shanghai, China, 20–22 December 2008; Volume 1, pp. 848–851.
  10. Zheng, S.; Liu, J.; Tian, J.W. An SVM-based small target segmentation and clustering approach. In Proceedings of the International Conference on Machine Learning and Cybernetics, Shanghai, China, 26–29 August 2004; Volume 6, pp. 3318–3323.

