
An Archaeoacoustics Analysis of Cistercian Architecture: The Case of the Beaulieu Abbey


School of Media Arts and Technology, Solent University (Southampton), East Park Terrace, Southampton SO14 0YN, UK
*
Authors to whom correspondence should be addressed.
Acoustics 2021, 3(2), 252-269; https://0-doi-org.brum.beds.ac.uk/10.3390/acoustics3020018
Submission received: 22 February 2021
/
Revised: 19 March 2021
/
Accepted: 24 March 2021
/
Published: 26 March 2021
(This article belongs to the Collection Historical Acoustics)
Abstract
:The Cistercian order is of acoustic interest because previous research has hypothesized that Cistercian architectural structures were designed for longer reverberation times in order to reinforce Gregorian chants. The presented study focused on an archaeoacacoustics analysis of the Cistercian Beaulieu Abbey (Hampshire, England, UK), using Geometrical Acoustics (GA) to recreate and investigate the acoustical properties of the original structure. To construct an acoustic model of the Abbey, the building’s dimensions and layout were retrieved from published archaeology research and comparison with equivalent structures. Absorption and scattering coefficients were assigned to emulate the original room surface materials’ acoustics properties. CATT-Acoustics was then used to perform the acoustics analysis of the simplified building structure. Shorter reverberation time (RTs) was generally observed at higher frequencies for all the simulated scenarios. Low speech intelligibility index (STI) and speech clarity (C50) values were observed across Abbey’s nave section. Despite limitations given by the impossibility to calibrate the model according to in situ measurements conducted in the original structure, the simulated acoustics performance suggested how the Abbey could have been designed to promote sacral music and chants, rather than preserve high speech intelligibility.
1. Introduction
Archaeoacoustics is the merging of two disciplines: archaeology and acoustics [1]. Methods used to conduct studies within this field can be, besides traditional acoustics measurements, computer modelling and virtual reality technologies as well as acoustics measurements [1,2]. These tools can be used to simulate the acoustics of buildings and structures that either no longer or only partially exist. Creating a methodology to do this is however complex as physical acoustic measurements at such sites are either unrepresentative or impossible [1]. The current paper focuses on the analysis of the Beaulieu Abbey (Hampshire, England), which was destroyed in 1538. The research aimed to investigate the acoustics properties of the original Cistercian structure, to ascertain if the results suggest Cistercian architects had an understanding of the principles of acoustics, that influenced the design. This question is based on previous research by A. Magrini and U. Magrini [3,4]. The following report looks at speech and singing intelligibility in three different scenarios from the pulpit to the nave section, from the altar to the quire area and from quire to the nave section of the Abbey. The results are scrutinised to determine whether a relationship between Cistercian liturgies and acoustics properties of Cistercian architecture can be confirmed. The findings are them compared with representative data from equivalate structures belonging to both the Cistercian faith and other Christian orders.
1.1. Cistercian and Gothic Architecture
Cistercian architecture is strictly related to the Gothic architectural style. Gothic churches, which are located around Europe, are a symbol of immense cultural heritage that should be sustained very conscientiously. The construction of the Gothic churches was carried out between the 12th and 14th century. The majority of Gothic churches could be considered more massive than necessary, for the Ad Gloriam Dei, in order to express the richness of the community and the clergy [5].
One of the essential parts of the cultural heritage are the acoustic properties and the atmosphere of Gothic churches. The split of clergy and laity in different parts of the church interior, as well as the development of church music during the baroque period, were some of the main factors that led to changes in the requirements of the acoustic environment in the Gothic churches [5].
The Abbey of St. Mary of Beaulieu (southern England, UK), located in the heart of the New Forest in Hampshire, was established in 1203 by King John [6]. The Abbey was taken over at the time of the dissolution of the monasteries in England (1538) and three years later was pulled down. In the same period, a lot of the original abbey buildings were ruined [7]. One of them was the church of the abbey in which remains only the cloisters and part of the shell.
Today, the whole of the building has been removed, remaining only the wall of the nave aisle and one course of stones. Nevertheless, the foundations of the church, after excavation, remain except the east end and part of the north wall of the nave aisle. During the Beaulieu church construction, most of the materials were transported by the sea due to the convenient position of the Abbey upon a tidal river. The walls in the interior of the church were consisted of ashlar. Marble was the primary material for the doorways. Hope and Brakspear [8] state that tiles of fair quality were placed on the floors of the church. These days many Gothic and Cistercian churches are maintained in use with a remodelled interior.
For this reason, the question arises in which acoustic properties and parameters should be investigated into analysing the acoustic situation for listeners in the interior of the building. According to Meyer [5], Reverberation time (RT) and Speech Transmission Index (STI) remain the two essential acoustic properties for the acoustic analysis of the Gothic churches. Speech intelligibility of a preacher in institutes of worship has regularly not been seen as a priority for large periods of the Cristian faith [9]. This was partially due to the priest preaching in Latin which was not the congregations’ native tongue.
1.2. Reverberation Time
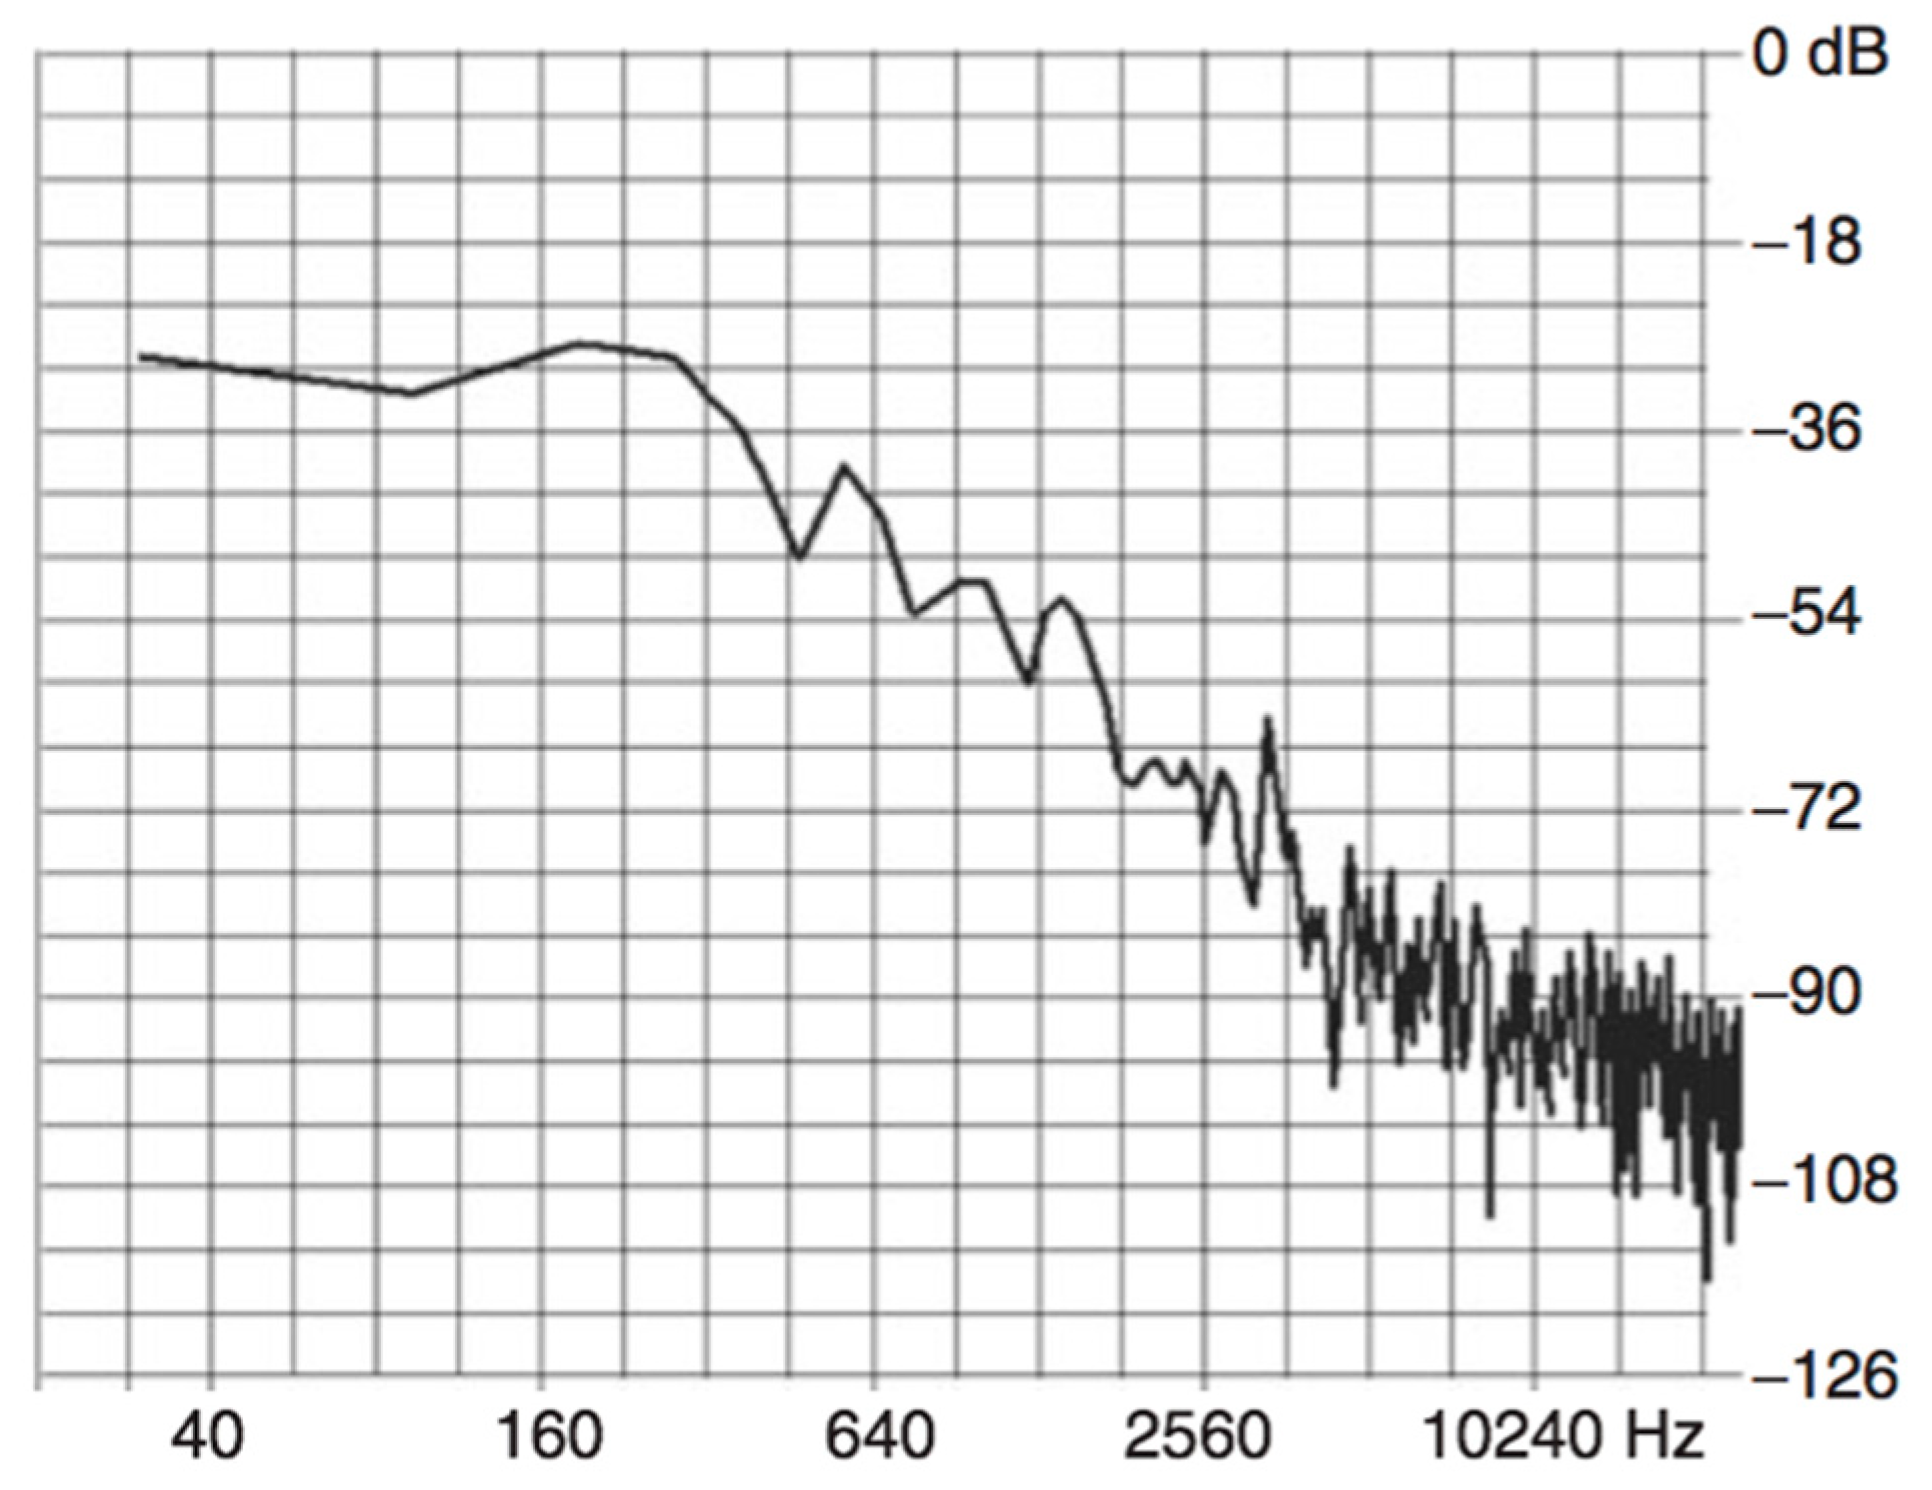
Reverberation time (RT) is considered the most relevant descriptor of room acoustics [10]. According to previous research regarding the acoustics properties of Cistercian Italian abbeys, longer RT values at low frequencies have been observed, that could infer the intent of the Cistercian architects to enhance acoustics properties in accordance with the Gregorian chants sang by the choir (Figure 1), implying a valid acoustics knowledge [3].
Several studies have found similar values in T-30 results. In particular, the analysis of the T-30 values from previous studies shows the typical behavior observed in the majority of Gothic churches [10,11]. Desarnaulds and Carvalho research of five Gothic churches with different volumes [12], observed that in terms of volume, dimensions ≥ 10,000 m3 lead to a significant decrease of the reverberation time for frequency bands > 2 kHz. Greater values of reverberation time have been observed in churches such as St. Petronio Basilica in Bologna due to the enormous volume (170,000 m3). Álvarez-Morales et al. [10] and Desarnaulds and Carvalho [12] agree that air absorption explains this effect in this frequency range.
Another factor for the increase of the reverberation time curve in low frequencies is the architectural style. Accurately, hard surfaces prevail in the Gothic style and there are only small areas like wooden floors or windows that can cause vibration [12]. The windows are considered the most crucial area for low-frequency absorption in Gothic churches. Since the windows do not consist of a closed air cavity behind the vibrating plate no resonance effect exists resulting in sound absorption on very low frequencies [5]. Reported RTs for four different English cathedrals (York, Salisbury, Canterbury and Durham) varied from 5.5 s at mid-high frequencies up to 8 s at low frequencies [13]. In addition, measured T30 values from the Gothic cathedral of Murcia (50,000 m3) varied from approximately 4.5 s at 125 Hz to 2.3 s at 4 kHz in normal occupied conditions, confirming the common RT slope and stressing the relationship between Cistercian and Gothic architectural style.
1.3. C50-C80
Parameter of Clarity index () is generally used to express a value about the perception of clarity referred to music or speech and the quality of the transmission speech intelligibility by a specific transmission channel (e.g., from a speaker to the audience in a room) [14].
In accordance with available research, optimal values of C50m (500 Hz–1 kHz) for both speech and signing are equal to ≥0 dB [15]. Significantly low C50 values varying from a minimum of −11.33 dB up to −6.40 dB averaged over standard frequency bands (125 Hz–4 kHz) have been found in six Cistercian Abbeys [3]. The researchers hypothesized that Cistercian architecture, might have characterized the acoustics of worship environments with poorer C50 values than the above-mentioned requirement for speech and singing. According with research [16], acceptable values for C80m in Gothic cathedrals are equal to ≥0 dB. However, Wolfgang and Wolfgang stated acceptable C80 values for sacral music of −5 dB [17].
1.4. Speech Transmission Index (STI)
The Speech Transmission Index (STI) method is based on the determination above of the modulation frequency broad-band and is defined as a physical quantity that represents speech transmission in respect to intelligibility [18].
According to Sant’Ana and Zannin [19], speech intelligibility is favored by a lower RT, but this condition is not enough to characterize a worship space as sufficient for speech.
Galindo et al. [20] and Álvarez-Morales et al. [10] studies in Gothic churches resulted in “Poor” speech intelligibility and an extremely high T-30 for a “meeting room.” Despite this, Álvarez-Morales et al. [16] state that in the recommended values for Gothic churches, the psychoacoustic and cultural factors should be taken into account. Carvalho and Nascimento [21] published related research between two identical chapels but with different acoustic treatments, asking the users to choose the most adequate for the transmission of a word. The paper noted that users preferred the less reverberant church as suitable for speech only because of the similarity with the acoustic environment of Portuguese churches.
Research into the nave section of Gothic Cathedral’s showed “POOR” STI values at distances ≥8.5 m in the nave of Ripon Gothic Cathedral (31,000 m3) and in the Gothic Cathedral of Murcia (50,000 m3) where values oscillated between 0.40 and 0.47 [22].
2. Materials and Methods
As only ruins of the abbey now exist, in situ measurements of the structures acoustic parameters are not possible. Therefore, the approach taken by the current study was to create an acoustic model of the structure. The acoustics of a space can be modelled in two main frameworks: solving the wave equation and geometrical acoustics (GA) [23]. The current study used GA software CATT Acoustic, v. 9.0 with TUCT (The Universal Cone Tracer) [24]. CATT does not solve the wave equation, instead approximates how simulated sound interacts with objects and spaces based on the geometrical features and programmed properties [25].
2.1. Establishing the Internal Dimensions
The model was initially produced using the program Sketchup [26]. It was then transferred to CATT acoustics using Sketchup extension SU2CATT [27]. The horizontal dimensions for the abbey model were based on the scaled abbey floor published by Hope and Brakspear [8], see the below Figure 2. This image was imported in Sketchup and set to the correct proportions using the scaling function within the program using the dimensions shown on the plan.
There is minimal historical data as to what the vertical dimensions of the abbey would have been. Previous virtual and scale models have been constructed, such as the scale model on display at Beaulieu Museum [28], have been created based on estimations in comparison to the horizontal dimensions. The previous models have only delt with the external dimensions and with no estimations of internal vertical dimensions of the abbey. Therefore, all the proportions used in the current research were ascertained with a large element of conjecture. The approach taken by the current study was to take cross-sections of abbeys and cathedrals built in a similar period and scale their horizontal dimensions to those of Beaulieu Abbey. Then, an average was taken of the heights of the internal pillars and arches. This average was used for the internal vertical dimensions of the abbey. Due to the level of uncertainty of these dimensions, they were cross-referenced with research on equivalent structures to check for their likely accuracy. For example, the calculated tower height of Beaulieu Abbey was 42 m, slightly smaller than that of Bath, St Albans and Tewkesbury Abbey [29]. However, Beaulieu Abbey’s smaller footprint would point towards the calculated height being within an acceptable margin of error.
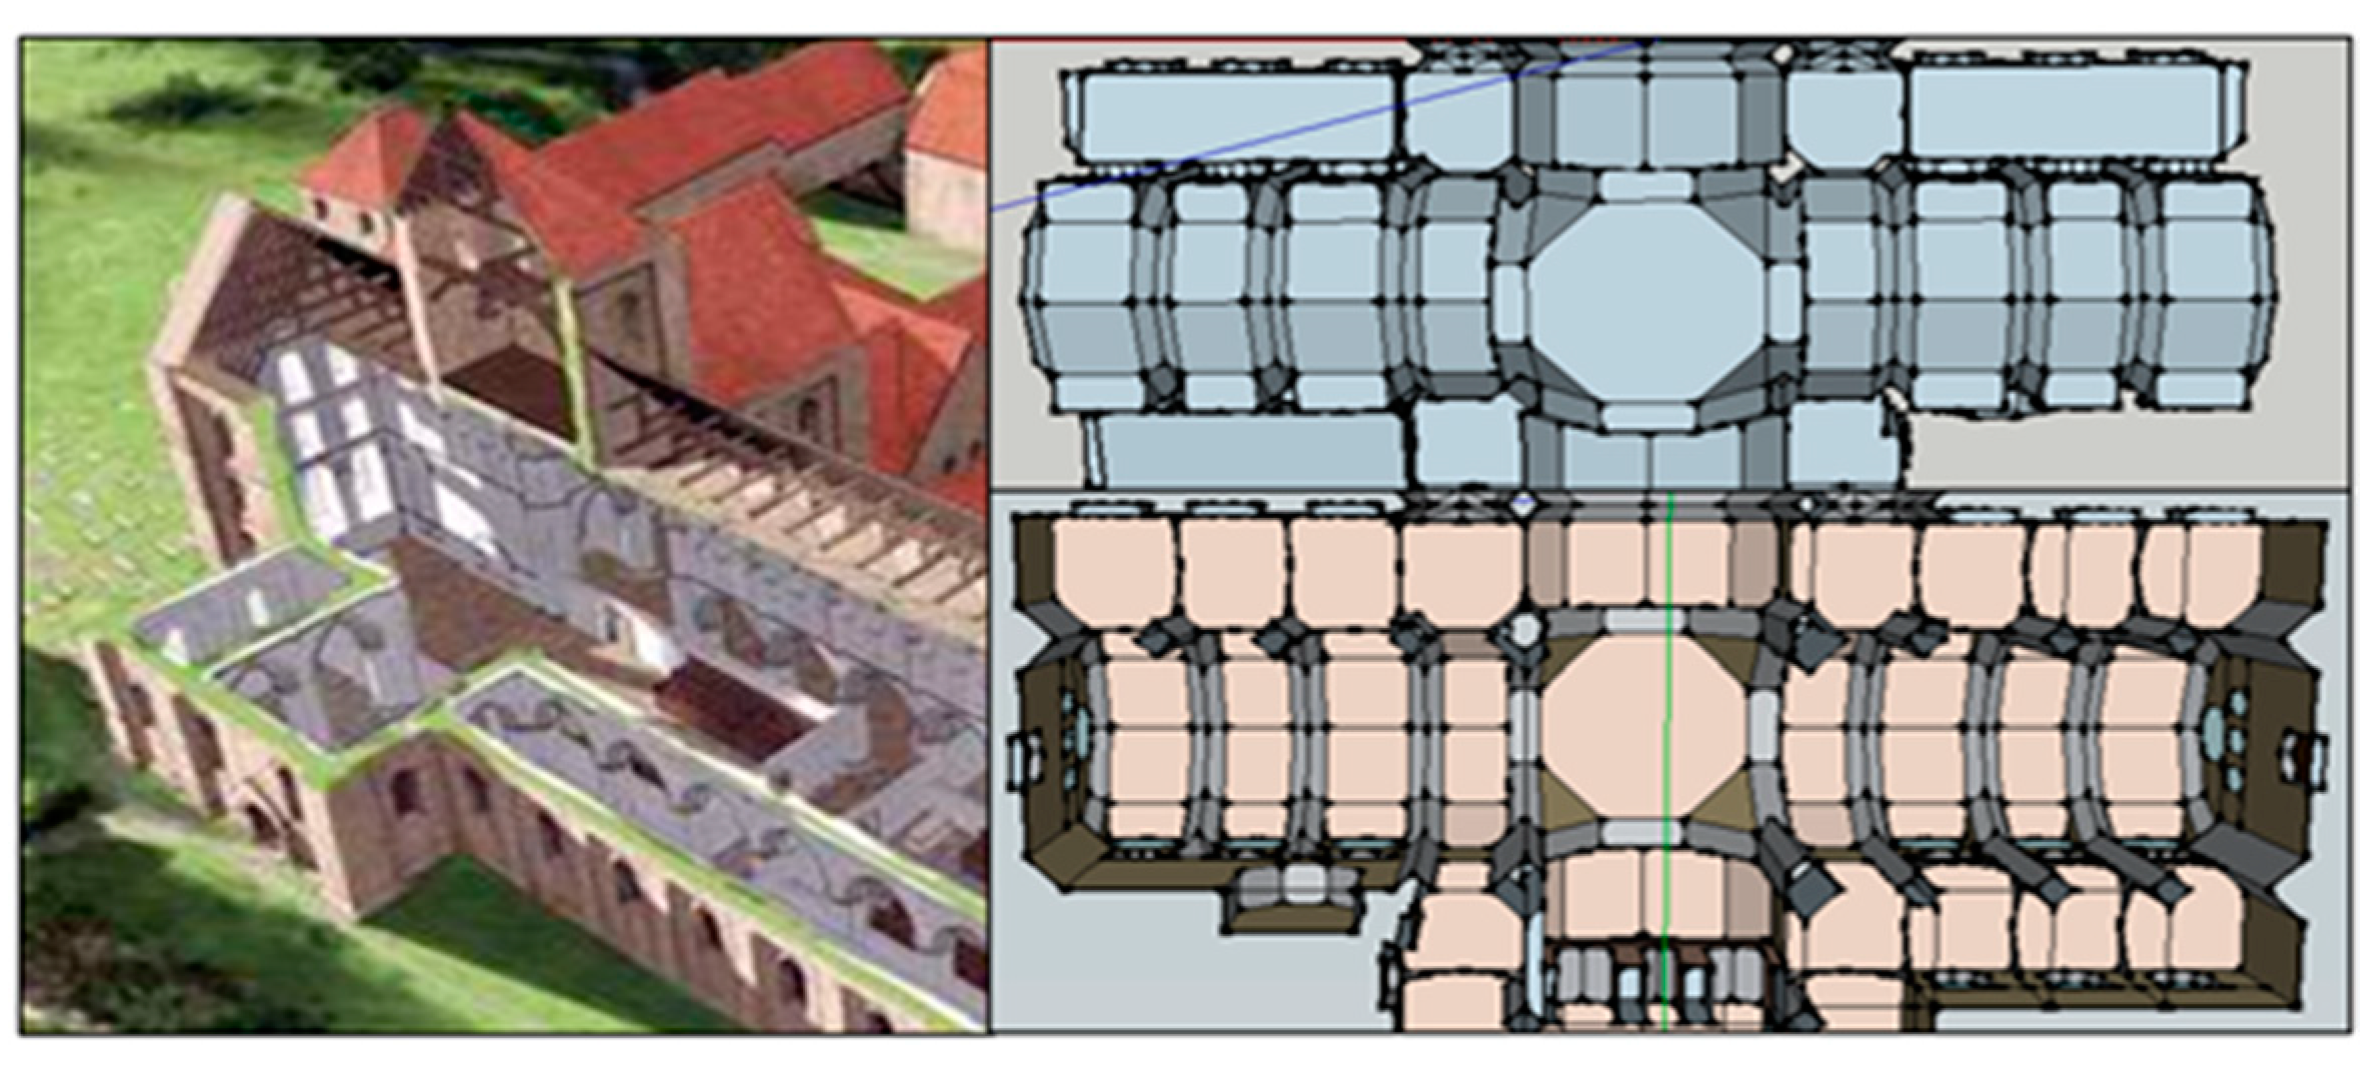
Even upon concluding this procedure, the modelling process still contained a large degree of uncertainty. A key example of this is with the Abbeys tower. In Hope and Brakspear 1906 paper the only reference is that there was likely a tower at the crossing of the transept tower [8]. Many towers of this period are closed such as Roche Abbey [30]. Based on this research the closed tower approach was taken for Beaulieu Abbey. The below Figure 3 is an illustration of Roche Abbey with a closed tower alongside a modelled Beaulieu Abbey tower.
2.2. Model Complexity
The aim when producing a GA model is to create an acoustically accurate simulation not an architecturally accurate model [25]. The necessary complexity of a GA model is a topic that has been extensively researched [31]. It has been argued that limiting the number of surfaces and compensating with a higher scattering coefficient can produce more accurate results [25]. Efforts have also been made to standardise the optimum level of complexity in terms of a ratio between model surfaces to volume [32]. These are shown in Table 1 below.
The results from the Bradley and Wang study concluded that if the geometry of the main structure is constructed accurately then the level of detail has minimal effect on results [32]. The methodology used by the current study was to only model components smaller than 0.5 m, equivalent to 700 Hz wavelength [9]. However, this was only adhered to when it did not jeopardize the inclusion of the structure’s crucial features [32]. Upon exporting the model into CATT, a calculation was conducted in line with Bradly and Wang research and the model’s detail was found to be above recommendations [32]. The model was therefore simplified until the ratio between planes and volume equaled 0.03 (based on a predicted abbey volume of 44,673 m3), with the intention of using scattering coefficients to counterbalance the simplified structure [25].The main simplification was of the arches as displayed below in Figure 4.
2.3. Absorption and Scattering Coefficients
Each plane in a CATT model can be assigned absorption and scattering coefficient, these dictate the amount of simulated sound energy that is absorbed upon interaction and is scattered from the incident wave [9]. The coefficients are expressed as percentages per octave band frequency.
2.3.1. Absorption Coefficients
Absorption coefficients were assigned to each of the materials in accordance with literature values. Table 2 below displays the employed absorption coefficients.
2.3.2. Scattering Coefficients
There is no empirical library of scattering coefficients for the properties of materials in situ [20]. For a model with complexed or curved geometry, as is being modelled with Beaulieu Abbey arches, a scattering coefficient of around 30% has been shown to provide representative results [25]. However, the effect of scattering is dependent on frequency and area of the plane [25]. The methodology used by the current study was based upon research by Alonso et al. and Martellotta that used the ratio between a surface’s geometrical proportions and its irregularities to create an average scattering coefficient for different planes spatial complexity [11,37]. Table 3 below shows research calculated values:
It should be noted that approaches using methodologies implying averaged values for varying irregularities can mean that acoustic trends that would be present in real world measurements can be missing in a simulated model [38]. However, in absence of accurate published data, particularly in instances like the structures of the arches and pillars, this approach was deemed the least flawed. An alteration to the averaged scattering coefficients was however made for the relatively smooth surfaces of the limestone walls and the floor, both of which have been moderately raised to take into account the coarseness of actual surfaces [34]. The full list of scattering coefficients can be seen in Table 4.
2.4. Sound Sources and Receivers
In archaeoacoustics studies it is not always deemed appropriate to use a sound source in line with the signal to noise guidance of BS-EN-ISO-3382-1:2009 [14], as it is unlikely to provide representative speech intelligibility data [29]. Sound sources and receivers’ properties were therefore chosen to better represent typical scenarios including both sacral chants from the quire and speeches from the altar and the pulpit sections. The sound pressure levels for the source used were based on research on octave band levels of human speech at different volumes, measured at 1 m [39]. The directionality of the source was based upon research on human voices [40]. The frequency data used for the first two scenarios can be seen in Table 5 below.
To give a broad range understanding of the acoustic parameters of the abbey, 3 assessment simulations were devised, these were done based on typical activities that would occur in a Cistercian service [41].
2.4.1. Scenario 1: Pulpit to Nave
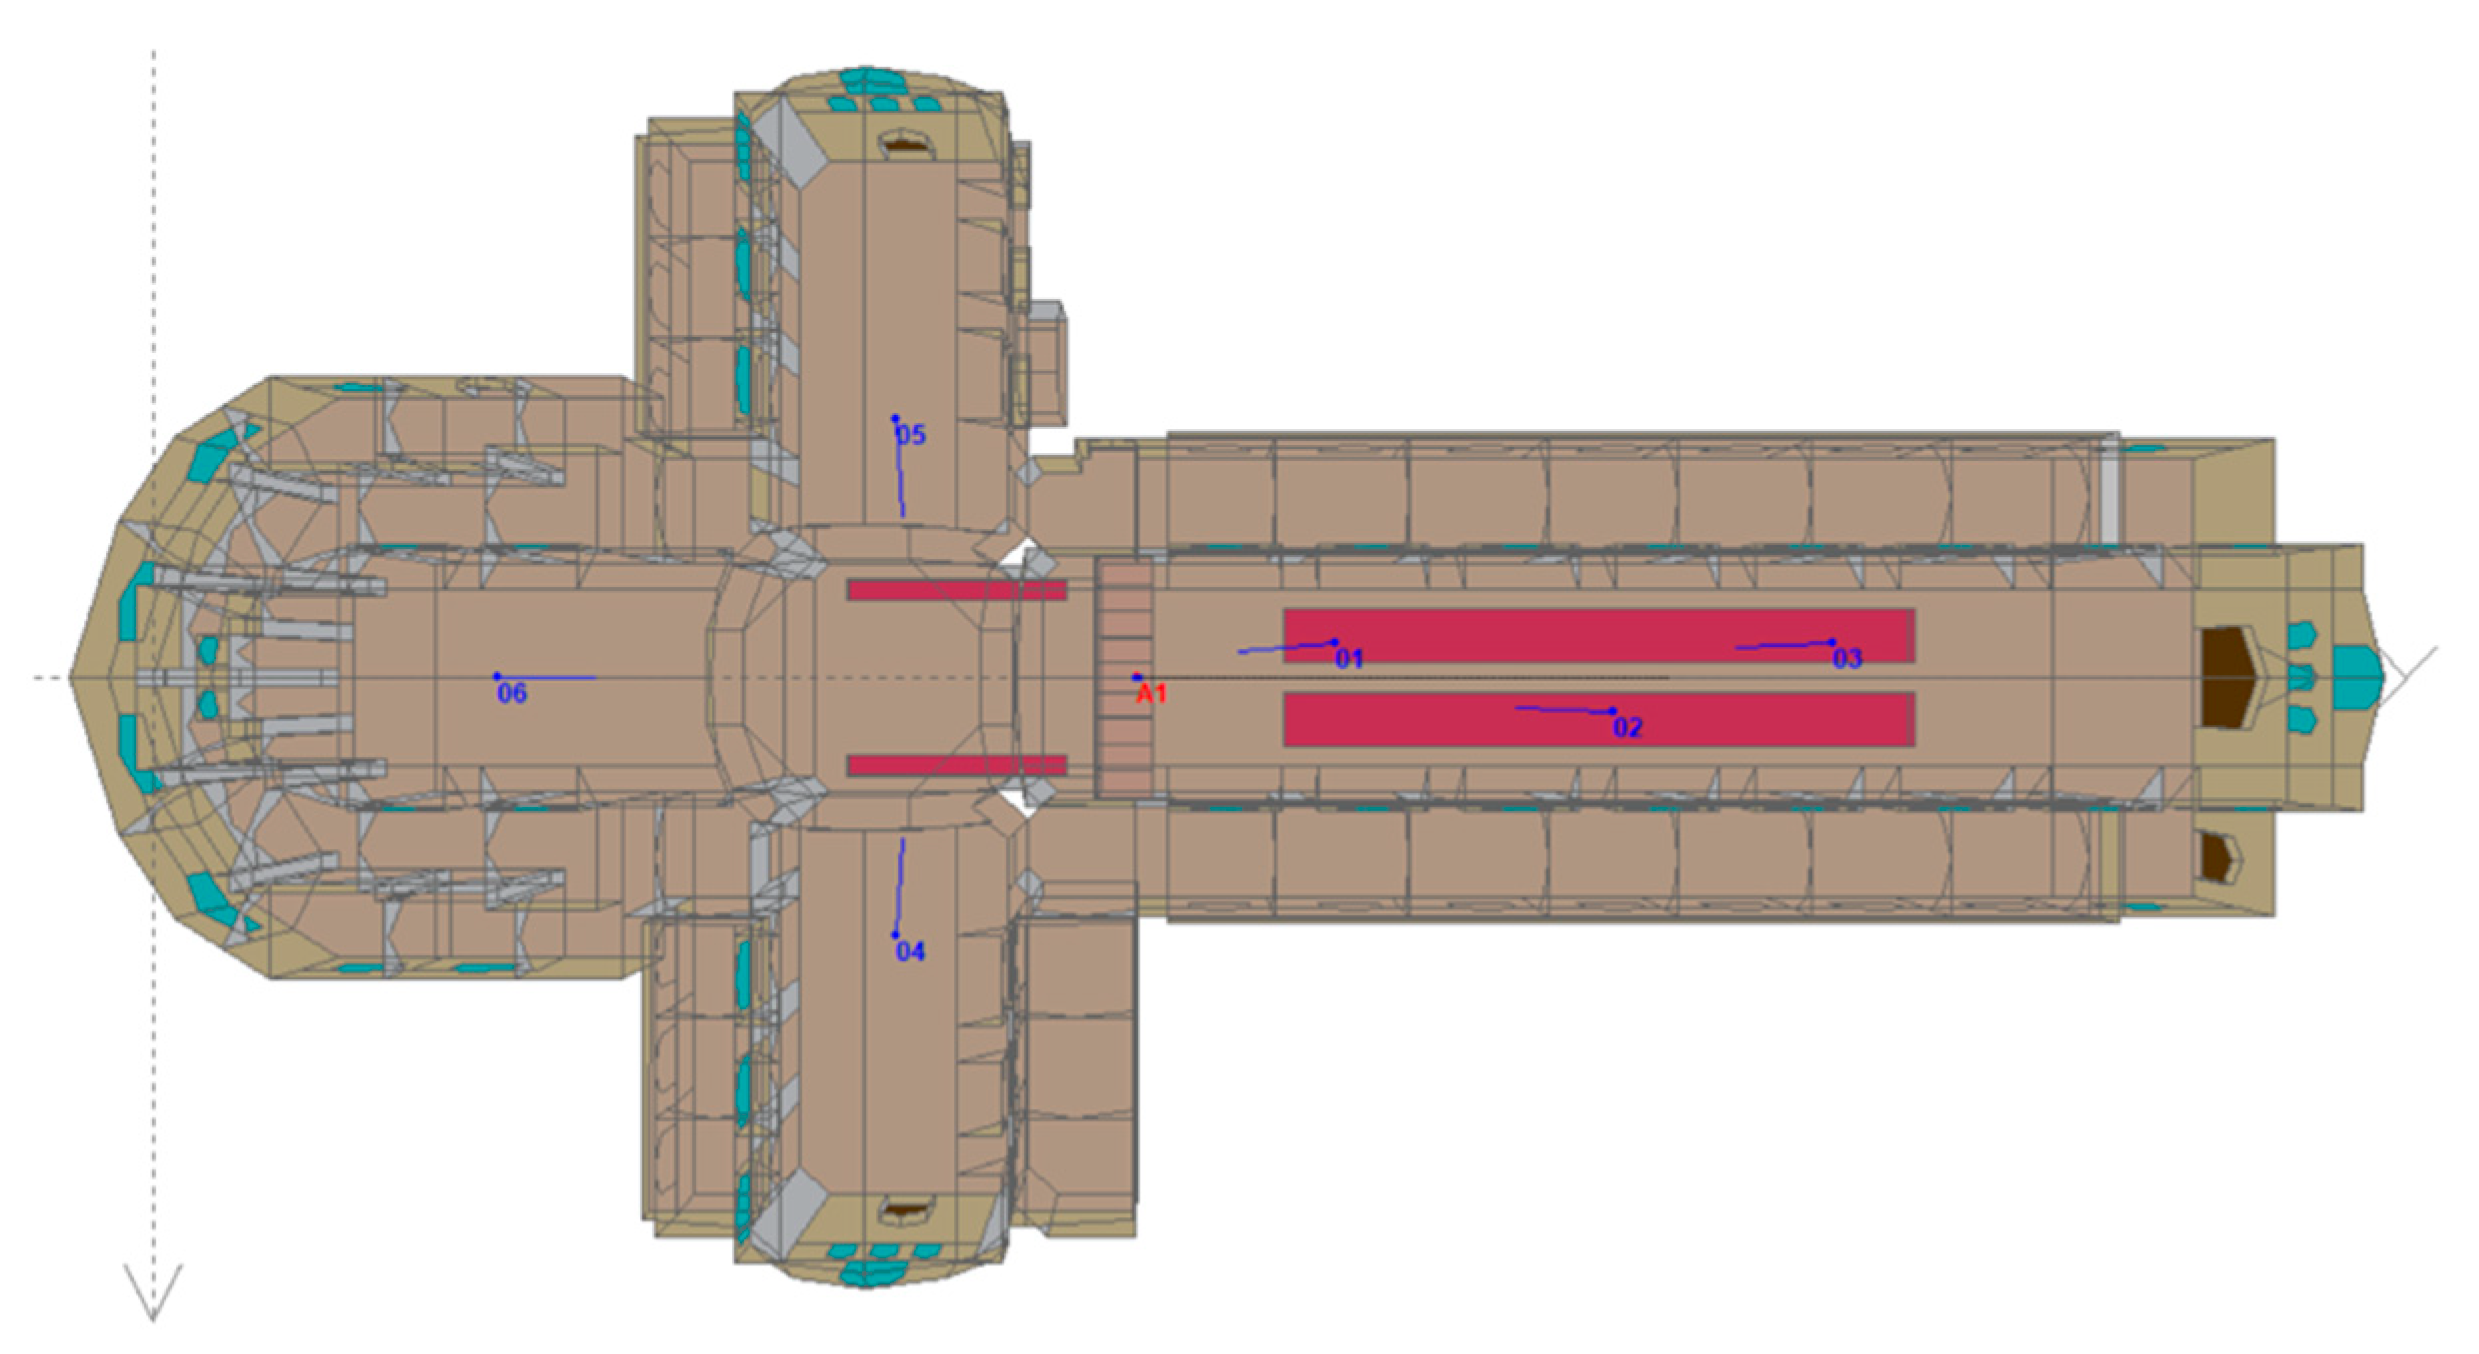
A sound source was created at 1.7 m above the floor of the pulpit, to represent a preacher delivering a service. The proprieties of the sound source were based on those previously discussed. Receiver points were introduced into the model and audience planes were placed across the seating rows of the nave. Figure 5 shows sound source and receiver positions.
2.4.2. Scenario 2: Altar to Quire
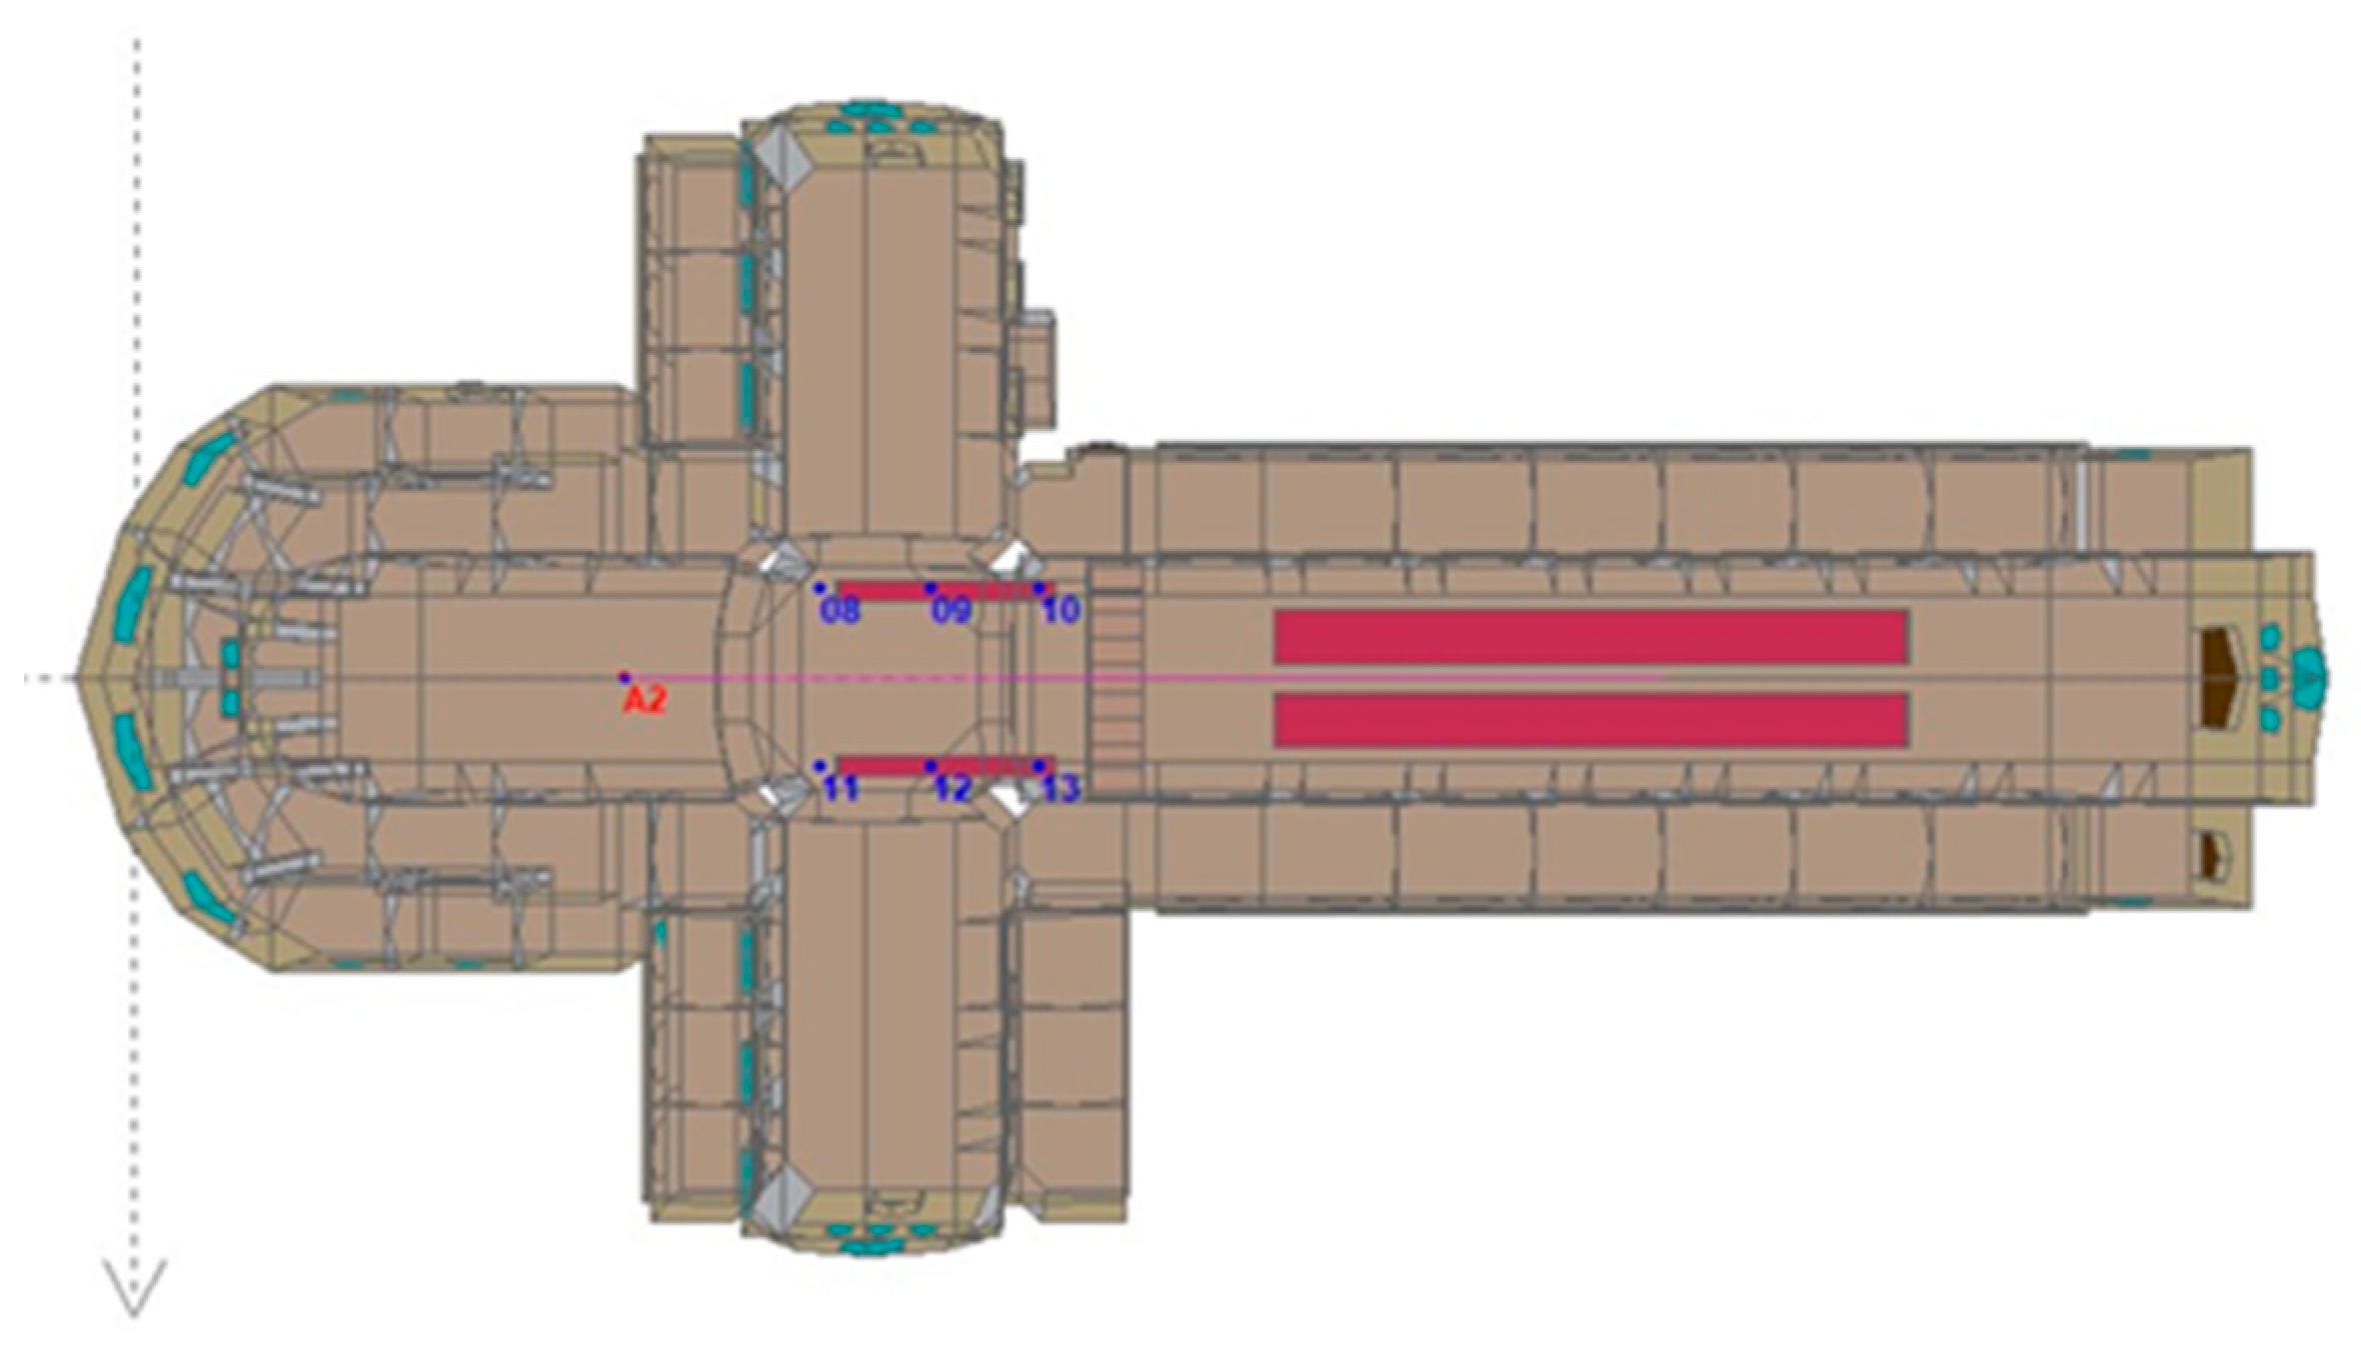
While the same sound source properties used to simulate the speech voice from the pulpit (reported in Section 2.4) were also employed to emulate the priest’s speech from the altar, six receivers were taken into consideration across the quire area at 1.2 m to reproduce seated audience conditions. Figure 6 shows sound source and receiver positions.
2.4.3. Scenario 3: Quire to Nave
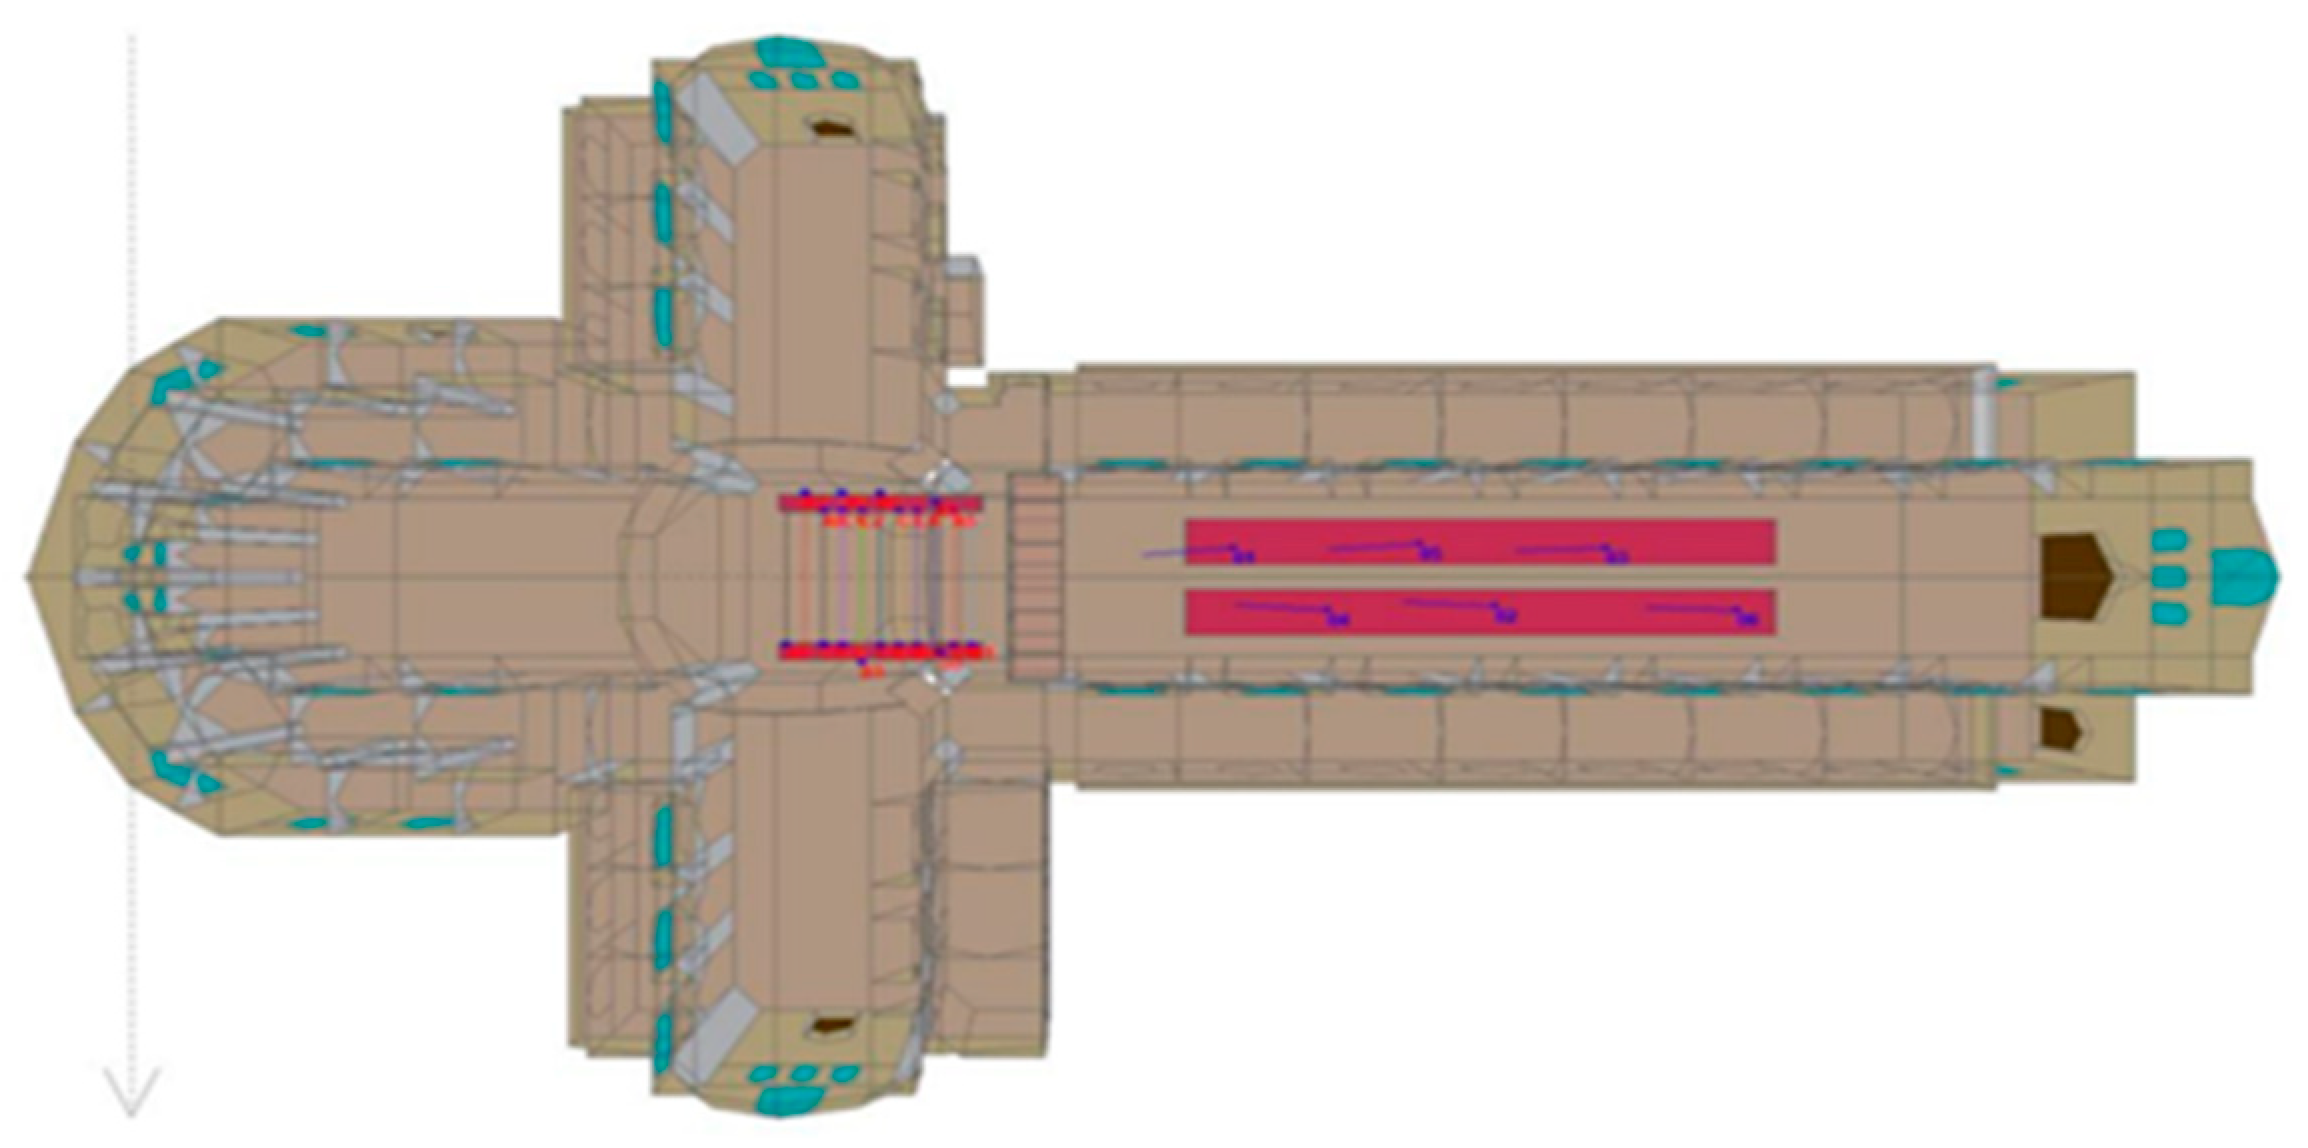
Cistercian abbeys were inhabited by choir monks and lay brothers. While the first two modelled scenarios aimed to evaluate a speech given by a priest either from the pulpit or from the altar areas, a third scenario was implemented to investigate the impact of a singing choir on the acoustics properties of the Abbey. Monks were obliged to perform the divine office and sing the plasms in the choir, lay brothers were exempted from any liturgical practice and were not therefore admitted to the choir [41]. Although no data was available for the Beaulieu abbey, the number of choir monks living in other Cistercian abbeys varied from 30 or less choir monks up to a maximum of 140 monks in the Rievaulx abbey in the early days [42]. Nevertheless, only 22 monks were living at Rievaulx abbey at the time of its suppression in 1538 [43]. A total of 20 individual sound sources were located parallel to each other at the two sides of the quire section to simulate the acoustics properties of the choir monks singing in the Abbey. Sound sources directivity and SPL values at 1 m were taken from available singer’s directivity data [40]. A total of 6 receiver positions were determined across the nave [14]. Sound sources and receiver positions are shown in Figure 7 while the SPLs assigned to the individual sound sources are displayed in Table 6.
2.5. CATTAcoustic Calculation Settings
CATT has 3 algorithms based on the research by Michael Vorländer [33]. Algorithm 1 is based on stochastic diffuse rays, while Algorithms 2 and 3 are based on the split-up of the definite diffuse ray [25,44]. Algorithm 2 is suited for the in-depth study of enclosed spaces, while the 3rd algorithm is shown to be the most suitable for open air venues [44].
Algorithm 2 was used in the render results from pulpit to nave and the presbytery to the quire as it is advisable for closed models with complex geometry [3]. However, due to the large number of sound sources and receivers used in the quire to nave scenario, algorithm 1 was employed to reduce the calculation times. For all calculations 250,000 rays were used, as well as 1000 ms echograms/impulse response based on the TUCT auto feature.
3. Results
3.1. Reverberation Time (RT) rResults
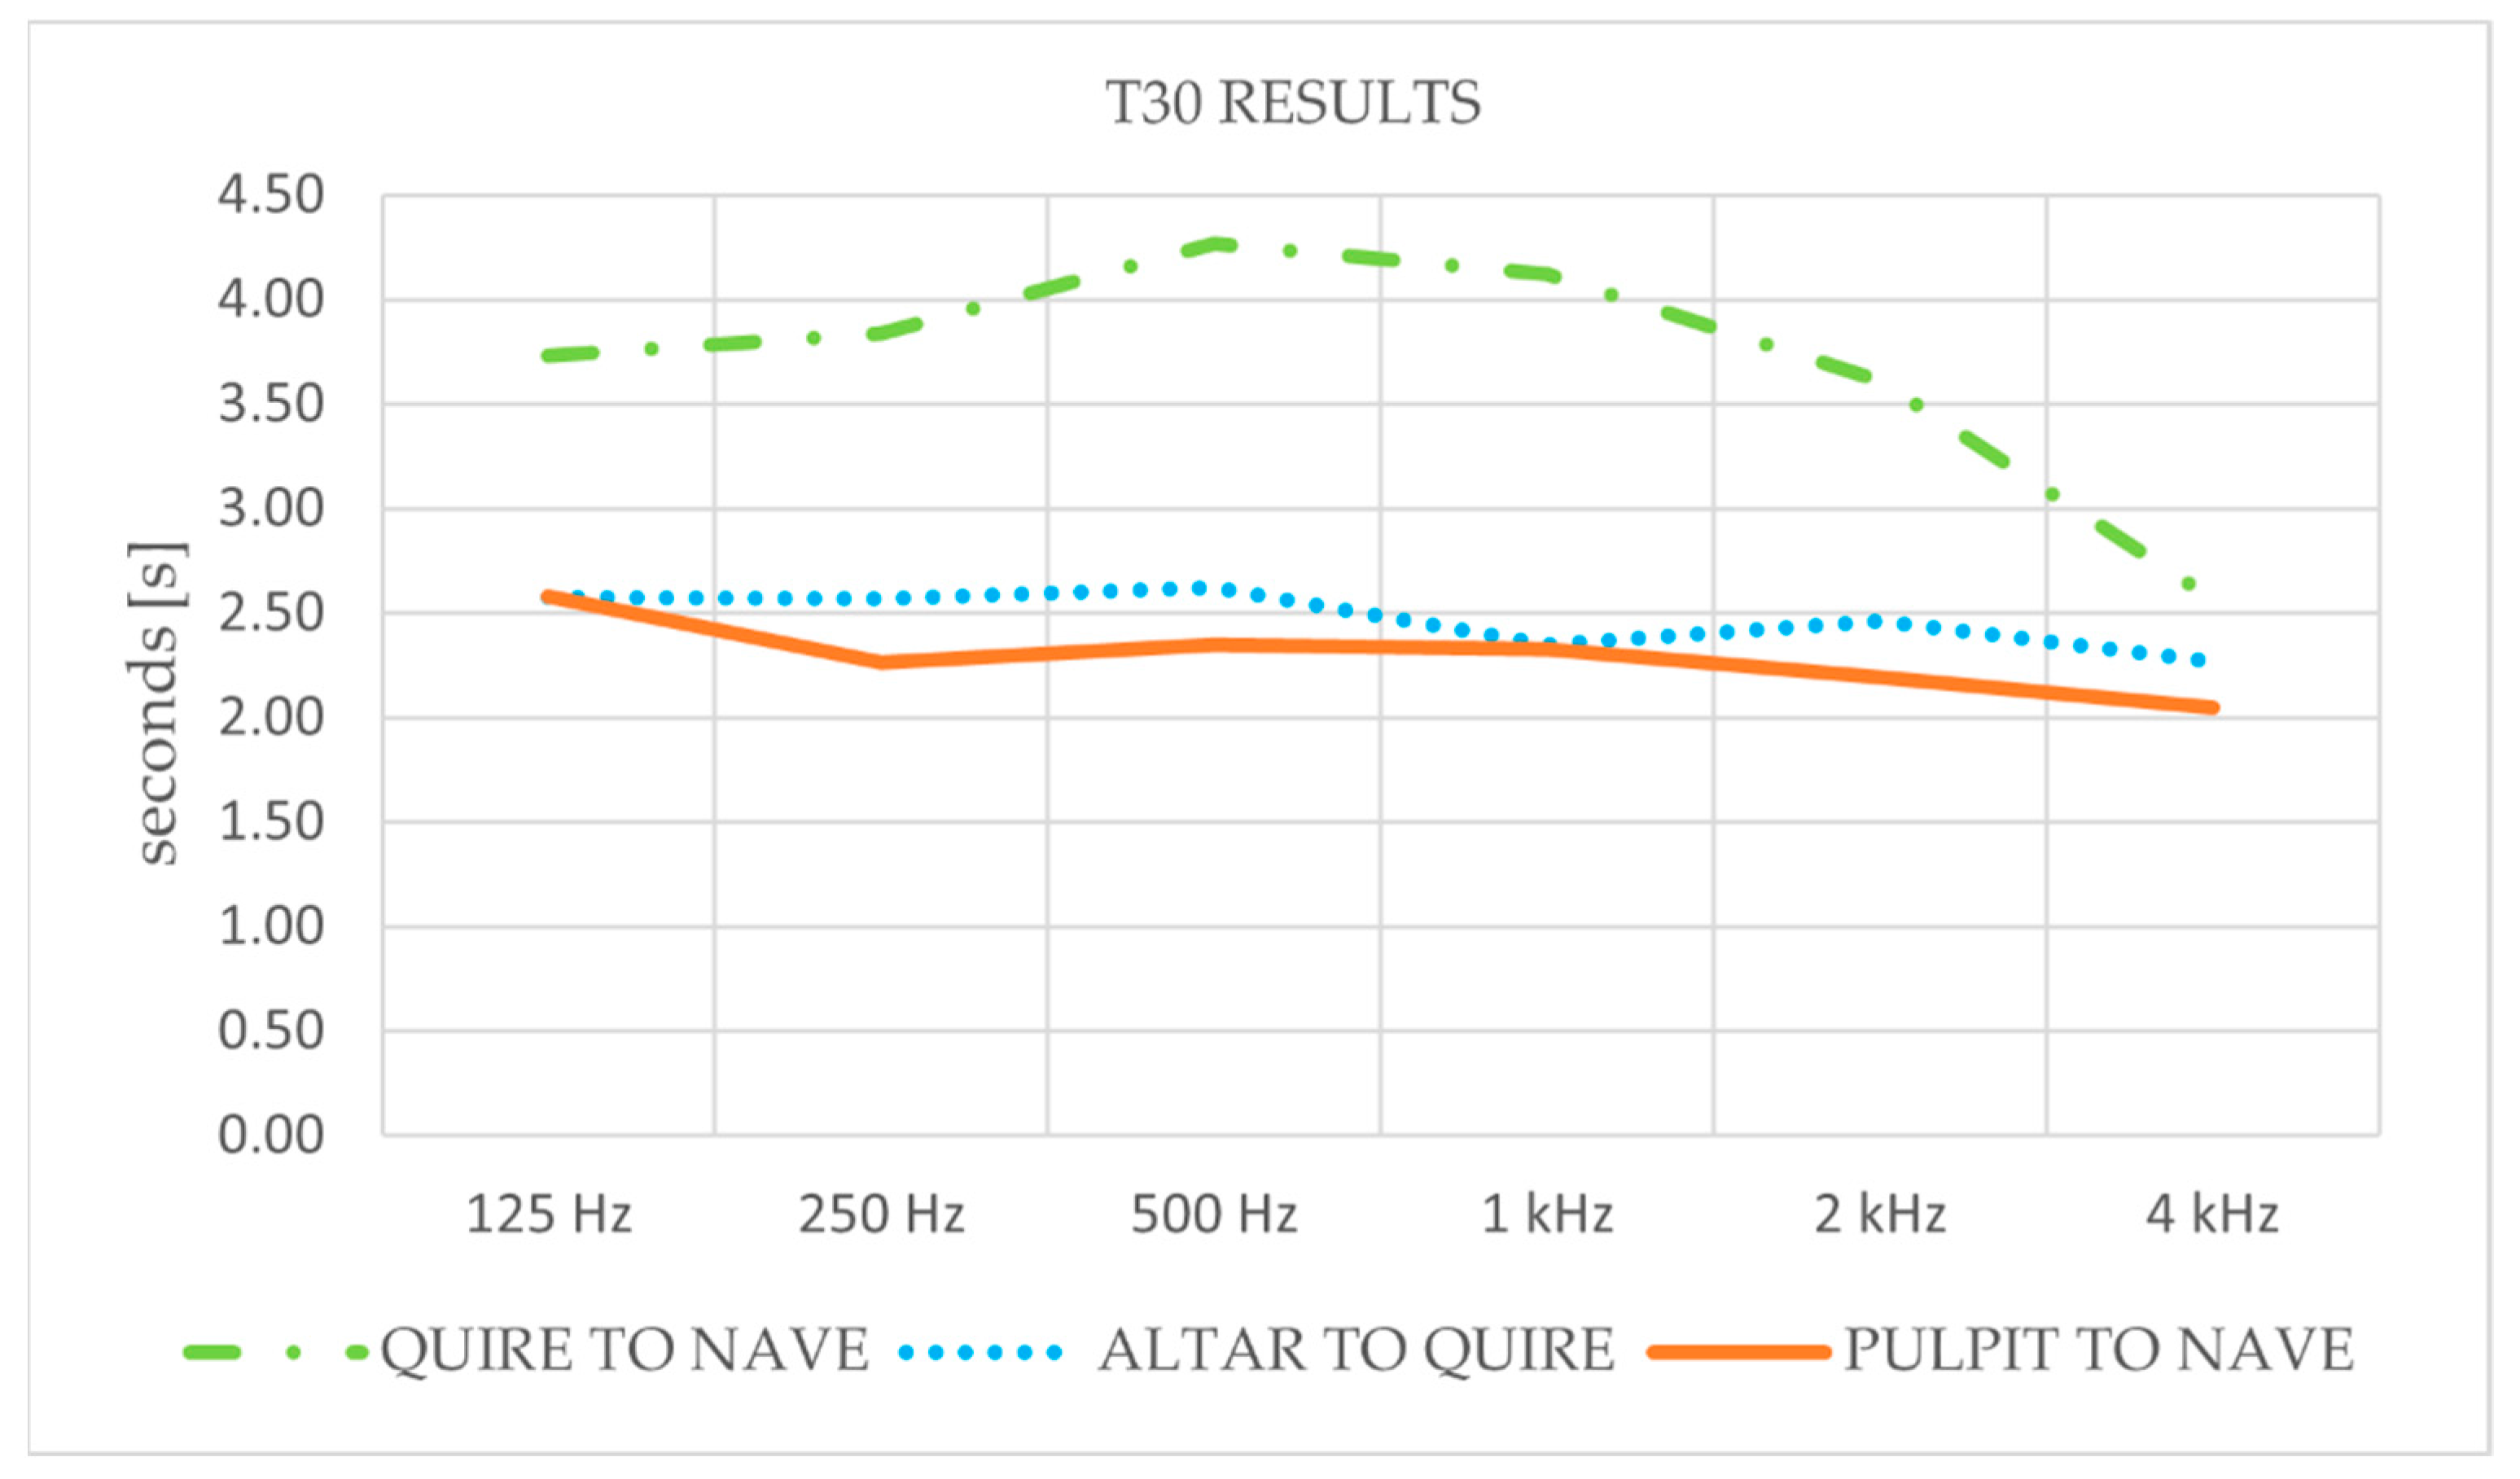
By taking into account the spectral behavior of the spatial-averaged T30 shown in Figure 8, an overall decrease in T30 equal to 1.40 s is found from 125 Hz to 4 kHz for the scenario emulating speech conditions from the altar to the quire area. Similarly, to the results obtained from the quire area, although a smaller decrease from 125 Hz to 4 kHz is noticed (0.40 s), the average T30 results predicted across the nave section from the pulpit show a slight reduction from low to high frequency bands. Nevertheless, a relatively flat and constant decay curve is observed across the investigated standard frequency bands stated in ISO 3382-1 [14]. Finally, differently from the previous analyzed scenarios, while the longest values of T30 predicted from the quire to the nave section are found between 500 Hz and 1 kHz octave bands (4.32 and 4.19 s, respectively), a significant T30 decrease of 3.66 s is noticed from 125 Hz to 4 kHz.
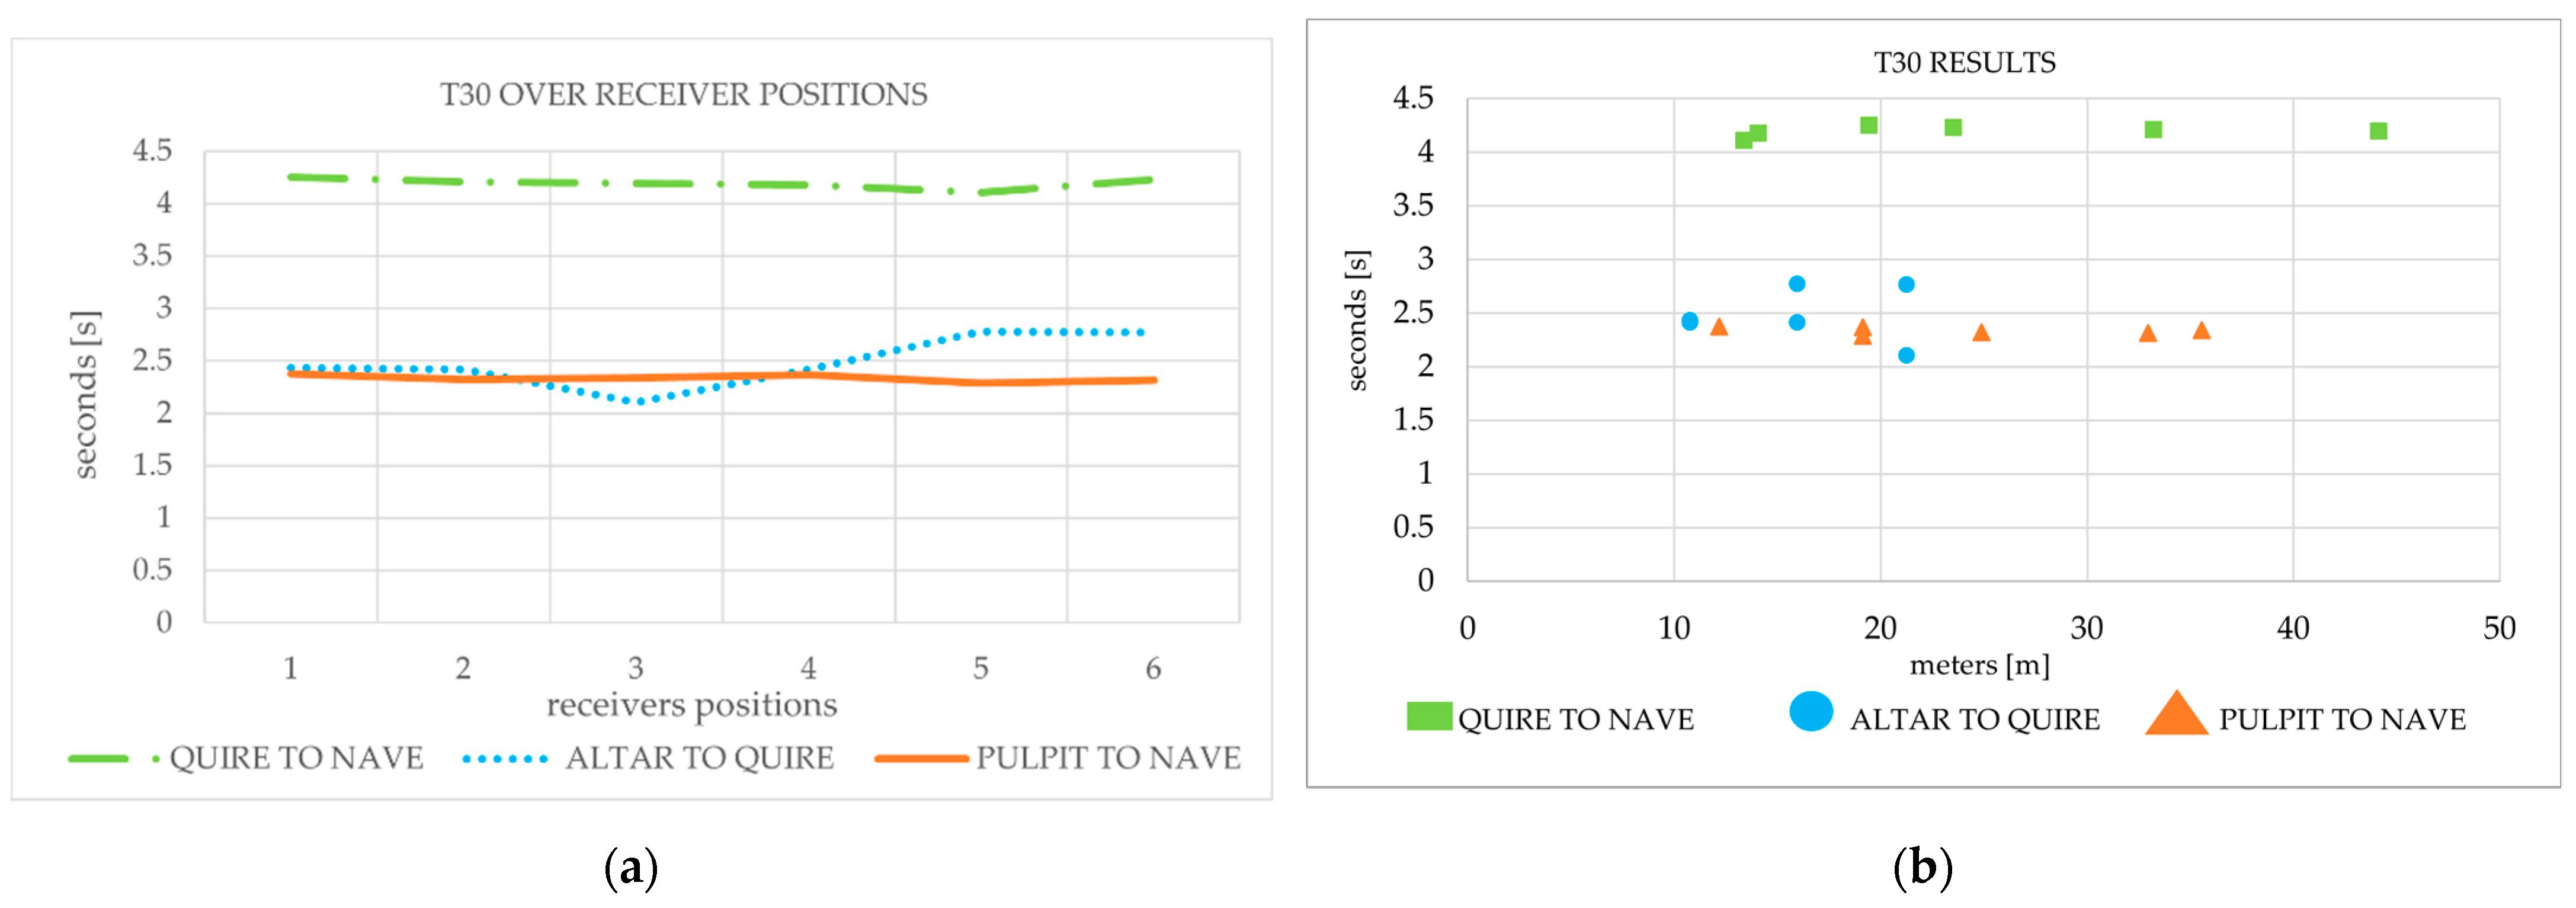
Additionally, Figure 9 reports mid-frequency [500 Hz–1 kHz] averaged T30 results over distance. It can be noticed, by taking into account the standard deviation (SD) values for each simulated scenario, low and similar in T30 results are found both when emulating a speech scenario from the pulpit to the nave area (SD = 0.03) as well as sacral chants sung from the quire to the nave section (SD = 0.04). Conversely, the greatest variation in T30 values is observed when simulating a speech from the altar to the quire section (SD = 0.23). Finally, considering the Just Noticeable Difference (JND) values based on the lowest T30 results from each emulated set, it is observed how variations above standard JND% are only found for the simulated speech scenarios.
3.2. C50 Results
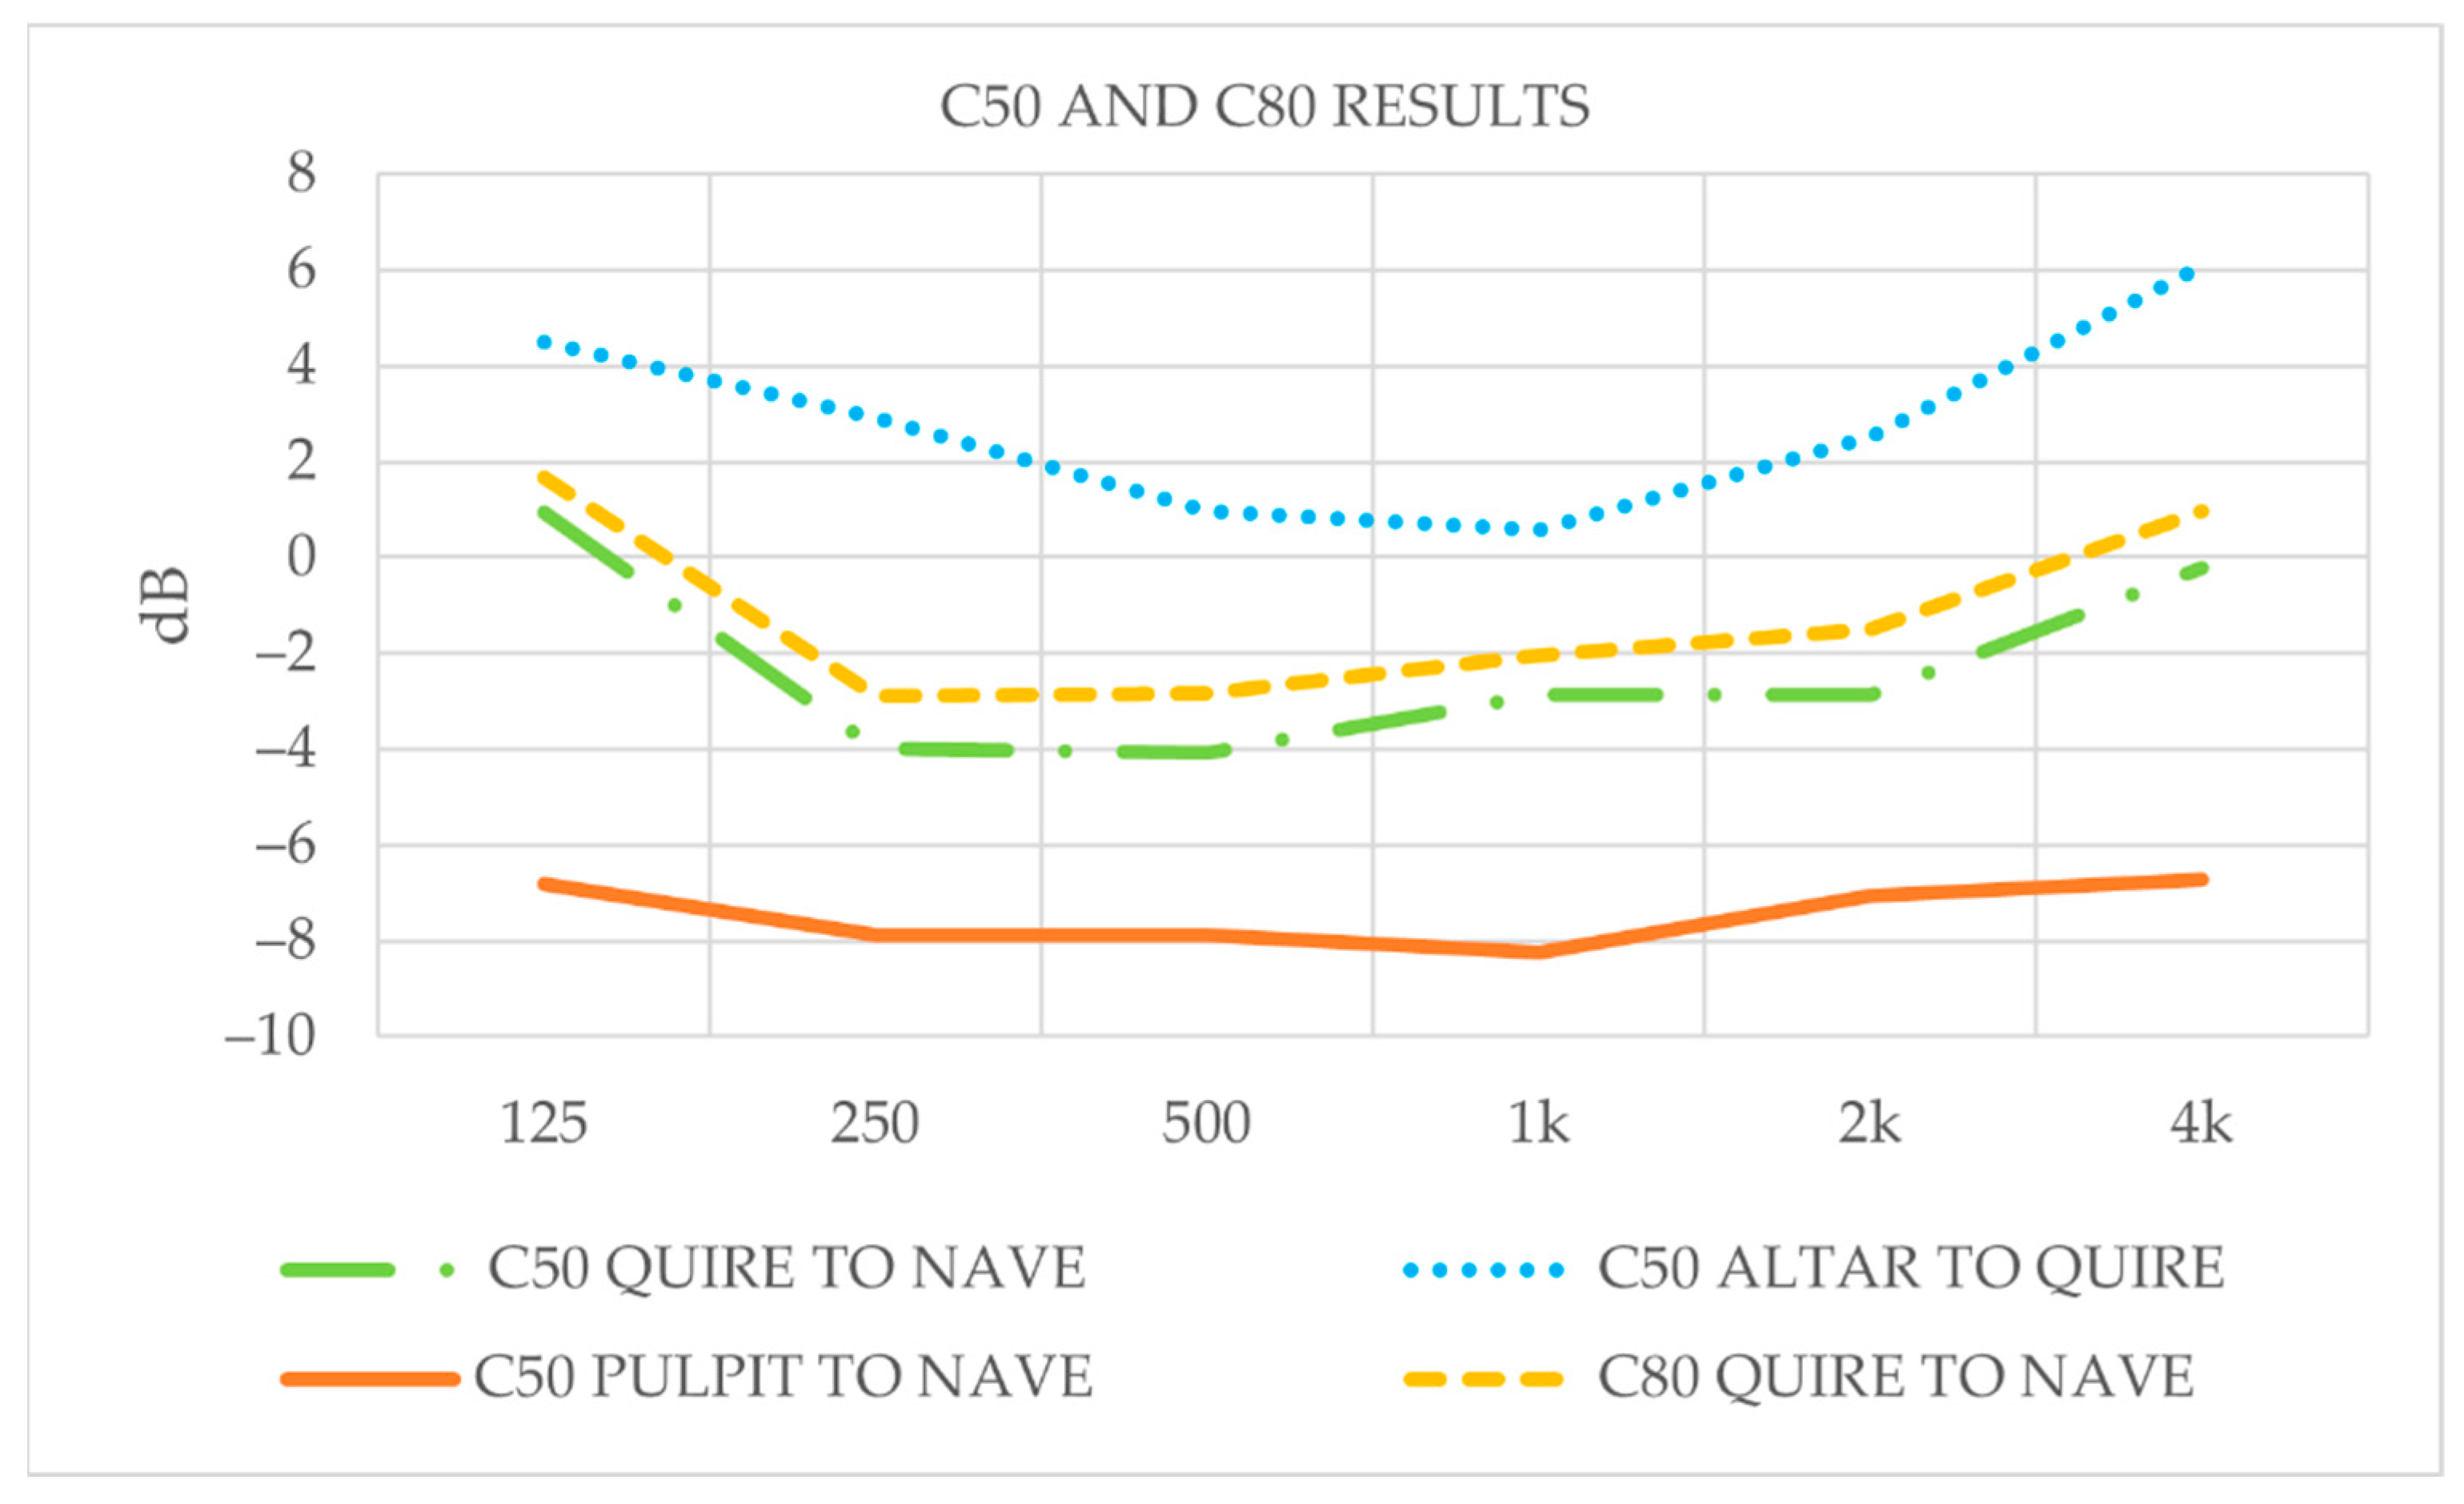
As it can be observed from Figure 10 despite decreases at mid-frequency bands are observed for the spoken simulated scenarios, increases at highest frequency bands in C50 and C80 values are generally found for all the presented scenarios. Specifically, while the lowest C50 values are observed for the modelling settings emulating a speech given from the pulpit towards the nave, highest values are noticed for the same hypothetic sound source, simulating a speech male voice addressed to choir monks disposed within the quire area. On the other hand, considering C50 and C80 values over frequency bands, it is noticed how differences exceeding 1 JND value are found for almost all the analyzed frequency bands (250 Hz–500 Hz–2 kHz–4 kHz–8 kHz).
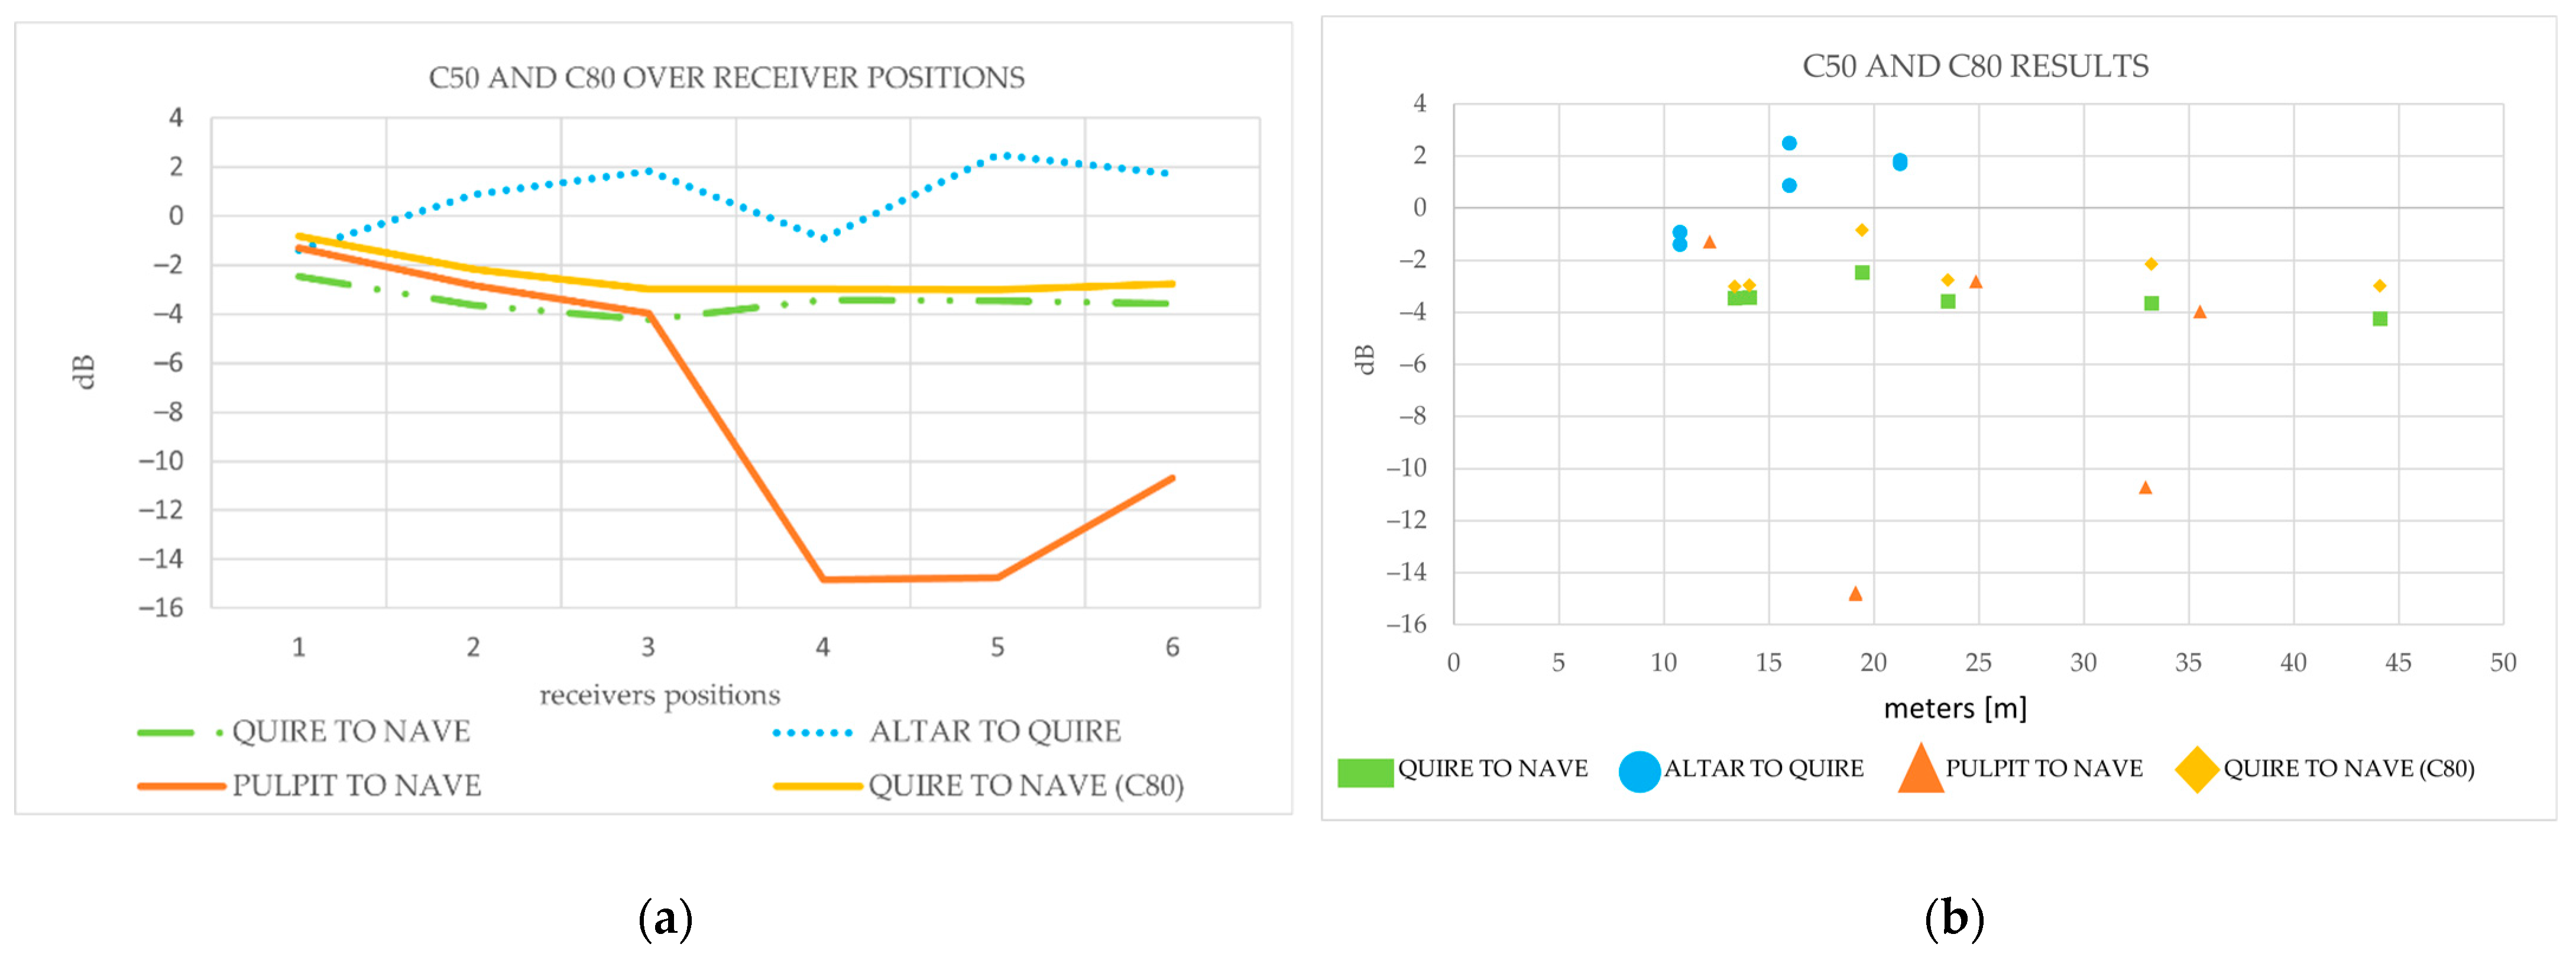
As shown in Figure 11, noticeable decreases of 2.29 dB and 3.21 dB, respectively in C50 and C80 values are observed from the closest to the most distant receivers’ positions across the nave when evaluating the impact of the modelled sound sources located within the quire area. A more significant reduction in C50 is noticed when assessing C50 results given by the sound source positioned on the abbey’s pulpit. A 11 dB reduction is found when comparing the furthest receiver positions within the nave section (3) to the receiver positions modelled within the Abbey’s transepts (4 and 5). In addition, although smaller, a decrease in C50 of 7.54 dB is also to be highlighted from position 3 and 6, located in the altar section, due to the directionality of the sound source and the position of receivers 4, 5 and 6 (located at the back of the sound source).
3.3. STI Results
From Figure 12, while no excellent STI values are found, highest results are provided by the receiver positions in the quire section from the sound source located in the altar. While averaged STI values of 0.44, resulting in POOR intelligibility are obtained across the nave, an averaged STI value of 0.60 is retrieved for the receivers disposed of within the quire.
In evaluating STI results over the different receiver positions (see Figure 13), it can be stated that while STI values generally decrease at further distances from the sound sources, a reduction in STI results is also observed for receivers’ positions located behind the sound source (4, 5 and 6) when emulating a speech male voice from the pulpit. These results are to be expected due to the directionality of the sound source used and the lower signal to noise ratio at receivers further away from the source.
4. Discussions
4.1. RT Considerations
The observed RT decrease at higher frequencies and the consequent longer values at low frequencies are expected trends observed within churches and cathedrals characterized hard reflective surfaces. However, air absorption is responsible for the shorter decay times at frequencies 1 kHz. Similar decrease in RT at high frequencies were observed in different English cathedrals [13]. Measured T30 values from the Gothic cathedral of Murcia (50,000 m3) are in accordance with the RT curve observed in the Beaulieu Abbey, stressing a relationship between Cistercian and Gothic architectural style. The longer RT values at low frequencies are also in accordance with previous research concerning the acoustics of Cistercian Italian Abbeys [3].
Table 7 considers available RT data from both Gothic and Cistercian cathedrals and abbeys. Initially it is noticed how the spatially and frequency averaged simulated T30 values gathered for the 3rd modelled scenario show similarities to the measured values found in Basilica of Saint Mary Major and Murcia Cathedral which provided the closest room volume when compared to the Beaulieu Abbey. In some studied structures with larger room volumes, such as St. Peter’s Basilica in Rome, Basilica of Saint Paul outside Walls and Basilica of St. John Lateran longer RT values are observed. Nonetheless, notable discrepancies are observed when comparing the simulated T30 values gathered for the 3rd modelled scenario with the measured RT spatially and spectrally averaged results from the Cistercian abbeys investigated by Magrini and Magrini [3].
The used scattering and absorption coefficients in the presented research might be observed as the major source of stochastic uncertainties [45], different sound source and receivers positioning as well as the number of sound sources, would have to be considered as a major cause of the variations. In fact, both from Table 7 and from the previously mentioned RT results from Figure 8, a significant discrepancy from 4.20 s to 2.49 and 2.39 s at mid-frequency bands [500 Hz–1 kHz] is observed from the 3rd to the 1st and 2nd modelled scenarios.
Similar differences are encountered from the analysis of T30 results from three different source-receiver combinations investigated within Ripon cathedral [35]. However, this research did not attempt to explain the variations among the different scenarios. Several causes might be related to the significant variations in RTs between the 3rd modelled scenario and the first 2 simulated conditions. The difference could be due to the presence of coupled volumes in the Abbey which can occur when different areas within the same room volume separated by an acoustically transparent opening exhibit different RT characteristics [46]. The effect can usually be encountered in cathedrals and similar worship environments which are characterized by the presence of several subspaces (e.g., choir, dome, transepts) [47]. As it is the case of the investigated Cistercian Abbey which, besides the two lateral transepts, features a 40 m tower within the choir area which is linked to the nave, the transepts and the altar sections (characterized by a height of ≅ 21 m) by acoustically transparent openings. Although it can be hypothesized how the different RT observed with the sound source placed in the choir section is due to weakly coupled volumes. For this reason, further research and analysis should be carried out in accordance with previous recommended methods [48].
In addition, the taller and narrower ceiling in the choir area does not help to reflect the sound toward the nave but it rather focusses the sound energy back to the choir thus decreasing the amount of sound energy reaching the receivers.
The direction of the sound sources might also represent a key aspect for the increased RT values obtained from the 3rd scenario. In fact, as previous research pointed out, the sound source direction can have an effective influence on the RT [49]. It should also be noted that as scenario 3 used 20 sound sources each focusing sound energy in a slightly different vector makes specific comparisons to the first 2 scenarios severely limited.
While there is no strict standard for what the ideal reverberation time of an abbey, proposed optimal RT values for choral music and congregational singing between 1.8–2.5 s in Christian worship environments [50] are considerably lower than the simulated measurements results, suggesting how different Christian religious orders might have been characterized by different RTs. Moreover, a useful assessment can be established comparing the results reported in Figure 9 with the Building Bulletin 93 (BB93) document [51]. The nearest comparison to the Abbey in this table would be Multi-Purpose hall, for which the document advises should have a reverberation time between 0.8 s and 1.2 s for a new build and 0.8 s and 1.5 s for refurbishment. Accordingly, the resulting RTs from all the modelled scenarios proved how the abbey provides an excessive mid-frequency RT (500 Hz–1 kHz) which could not guarantee optimal speech intelligibility conditions.
Overall, it can be concluded how the simulated RT values confirmed a relationship be-tween Cistercian and Gothic architecture and they also stressed the similarity between common RT behaviors observed in Cistercian abbeys and the sound intensity levels of Gregorian chants proposed in previous research [3], highlighting the suitability of Cistercian architecture to host sacral chants.
4.2. C50/C80 Considerations
The shortest distance from the altar to the quire section (<22 m) lead to the highest C50 results which were found close to 0 dB for most of receiver positions, resulting in acceptable speech clarity values [9,17], mid-frequency (500 Hz–1 kHz) averaged values equal to <0 dB are always observed across the nave section for receiver positions located at further distances >10 m. Considering spatially averaged values, the results are in accordance with literature findings reporting considerable low C50 values ranging from −11.33 dB to −6.40 dB from acoustics investigations conducted across six Cistercian Abbeys characterized by smaller room volumes (varying from 3390 m3 up to 14,970 m3). It can be observed from Table 8, it has to be mentioned how the highest frequency and spatially averaged results simulated within the Beaulieu Abbey are higher than the C50 and C80 averaged values found across other examples of similar environments although closest values are observed for results between the Beaulieu Abbey and Murcia cathedral. Overall, the results stress how Cistercian architecture might have characterized the acoustics of worship environments with poorer C50 compared to modern recommended values [13]. In evaluating the suitability of the Abbey for music, although acceptable results in gothic cathedrals are found to be >0 dB [26], available recommended values for sacral music indicate a lower threshold equals to –5 dB [17]. Consequently, the retrieved C80 values predicted across the nave section would suggest the suitability of the Abbey to host sacral music and chants rather than speeches. While the results show that the structures aptness for the performance of Gregorian chants, it should be noted that this does not implicitly imply the Cistercian architects had an understanding of the principles of acoustics that influenced the design.
4.3. STI Considerations
As with the above mentioned C50 results discussion, while the shortest distance from the altar to the quire showed the highest STI values highlighting the impact of distance on speech conditions [52], “POOR” STI values are observed for the remaining investigated acoustics scenarios [18]. “POOR” STI values were also observed in the Gothic cathedrals of Murcia and Ripon [16,22]. Through a comparison among spatially averaged STI simulated values from Gothic cathedrals shown in Table 9 demonstrates how the results from the above table show that the Beaulieu Abbey model would provide equal or higher speech intelligibility ratings compared to the further considered values.
STI measured values from Christian worship buildings showed spatial averages of 0.49 and 0.40, implying similarities between Cistercian and Gothic architecture [12,15]. Finally, it should also be noticed how “FAIR” STI values for non-native speakers can only be reached with values ≥ 0.75 [18]. Therefore, as can also be observed from Table 9, the simulated STI values, as well as the rest of the cathedrals examples, could only provide bad or poor speech intelligibility properties. The observation is in accordance with the fact that before Vatican II in 1963 there was no desire for low RTs and high intelligibility since liturgy was sung in Latin only [53].
5. Limitations
In building the Abbey Model numerous assumptions have had to be made. These include approximations of the vertical dimensions, As well as assumptions on the different surface’s geometrical proportions and irregularities. Therefore, following the previously discussed Alonso et al. and Martellotta research, to create an average scattering coefficient for different planes spatial complexity is problematic with no clear evidence of what the original abbey equivalent planes would look like. The current paper has attempted to overcome these issues by using Alonso et al. plane complexity averages as the basis for the scattering coefficients [37]. As noted in the methodology section that this approach can mean that acoustic trends from the real-world structure could be missing in a simulated model [38]. Therefore, the current paper is not stating categorically that these would have been the real-world results of the acoustic parameters that could be measured within the abbey when it was standing. Rather these are an estimation of the discussed parameters using the information and resources available to the authors.
As the Abbey is destroyed, the current paper has attempted to verify its findings by cross-referencing with relevant research. However, variations in the test methods used in the real-world studies, the parameters used with computer simulated studies and the differences volume in all the buildings studied are among the problems with any cross-referencing methodology. The current paper has tried to counteract these issues by checking both an average of comparable results as well as individual specific equivalent findings. However, as there is no standardised methodology for archaeoacoustics [54], and many studies create a specific procedure for an investigation, meaning most comparisons have a degree of weaknesses [1].
The current papers tailored methodology of using 3 scenarios to analyse the acoustic properties of typical activities in a Cistercian abbey, caused significant limitations in comparing the results from the 3 scenarios. This is especially true when considering scenario 3 which had 20 sound sources all with different directionality considerations, in comparison to scenarios 1 and 2 which had one. The degree of uncertainty in the comparisons is then compounded when the results of the investigation are compared to relevant studies, some with their own bespoke methodology. The limitations of the present study highlight the need for more standardised procedures in the field of archaeoacoustics.
As well as the restrictions in the methodology of obtaining the parameters of ruined historic structures and the complicities of comparing the results to relevant research, there is also a significant limitation in the interpretation of the results. Coimbra states there is a “danger of looking at the past with the mind of a 21st century” [1]. Meaning we are looking for significant data from 21st century knowledge that was not present in the minds of the original designers. This is particularly true in the case of the current paper, that is using modern acoustic parameters to try and understand the intentions of 13th century architects.
Despite, these significant limitations of the current paper and more broadly the field of archaeoacoustics in general, it’s believed to be important to understand our acoustic heritage to enhance the appreciation for ancient sites and monuments [2]. However, when interpreting the results, the scale of the limitations should not be understated.
6. Conclusions
The presented report aimed to investigate the acoustics properties of the Beaulieu Abbey in order to provide an estimation of the original acoustics conditions characterizing the structure destroyed in 1538. A 3D model was implemented on SketchUp software and uploaded into CATT-Acoustics which was used to conduct the acoustics analysis. Similar RT slopes to those simulated by the model were found across other examples of Cistercian and Gothic architecture, supporting the hypothesis of a valid acoustics knowledge by Cistercian architects. Acceptable speech intelligibility conditions could have been provided from the altar to the quire section of the Abbey. However, it was highlighted how only BAD and POOR intelligibility conditions would have been reached across the nave section. Suitable C80 values for sacral music were found in accordance with available recommendations, thus emphasizing the low importance placed on good speech intelligibility suggesting the willingness of Cistercian architecture to achieve optimal conditions for sacral music and chants.
Author Contributions
Conceptualization, S.D., M.C. and I.K.; methodology, S.D., M.C. and I.K.; software, S.D., M.C. and I.K.; validation, S.D., M.C. and I.K.; formal analysis, S.D., M.C. and I.K.; investigation, S.D., M.C. and I.K.; resources, S.D., M.C. and I.K.; data curation, S.D., M.C. and I.K.; writing—original draft preparation, S.D., M.C. and I.K.; writing—review and editing, S.D., M.C. and I.K.; visualization, S.D., M.C. and I.K.; su-pervision, S.D., M.C. and I.K.; project administration, S.D., M.C. and I.K. All authors have read and agreed to the published version of the manuscript.
Funding
This research received no external funding.
Institutional Review Board Statement
Not applicable.
Informed Consent Statement
Not applicable.
Data Availability Statement
The data presented in this study are available on request from the corresponding author.
Acknowledgments
The conference paper of the presented article was published by the Institute of Acoustics (IOA) at the 36th Reproduced Sound conference 2020.
Conflicts of Interest
The authors declare no conflict of interest.
References
- Tjellesen, L.L.; Colligan, K. Archaeoacoustics: An Introduction—A New Take on an Old Science. In Audio Engineering Society Convention 134; Audio Engineering Society: New York, NY, USA, 2013. [Google Scholar]
- Suárez, R.; Alonso, A.; Sendra, J.J. Archaeoacoustics of intangible cultural heritage: The sound of the Maior Ecclesia of Cluny. J. Cultr. Herit. 2016, 19, 567–572. [Google Scholar] [CrossRef]
- Magrini, U.; Magrini, A. Measurements of acoustical properties in Cistercian Abbeys. Build. Acoust. 2005, 12, 255–264. [Google Scholar] [CrossRef]
- Magrini, A.; Magrini, U. Acoustic field in two Medieval Abbeys: Relationships between acoustical parameters and architecture in Morimondo and Chiaravalle Abbeys. Forum Acust. 2005, 4, 2381–2386. [Google Scholar]
- Meyer, J. Acoustics of gothic churches. In Proceedings of the Forum Acusticum 2002, Sevilla, Spain, 16–20 September 2002. [Google Scholar]
- Butler, L.; Given-Wilson, C. Medieval Monasteries of Great Britain; Michael Joseph: Upper Clapton, UK, 1983. [Google Scholar]
- Doubleday, H.A.; Page, W. A History of the County of Hampshire; Victoria County History: London, UK, 1903. [Google Scholar]
- Hope, W.J.S.; Brakspear, H. The Cistercian Abbey of Beaulieu, in the County of Southampton. Archaeol. J. 1906, 63, 129–186. [Google Scholar] [CrossRef]
- Álvarez-Morales, L.; Zamarreño, T.; Girón, S.; Galindo, M. A methodology for the study of the acoustic environment of Catholic cathedrals: Application to the Cathedral of Malaga. Build. Environ. 2014, 72, 102–115. [Google Scholar] [CrossRef]
- Álvarez-Morales, L.; Lopez, M.; Álvarez-Corbacho, A. The Acoustic Environment of York Minster’s Chapter House. Acoustics 2020, II, 3. [Google Scholar] [CrossRef] [Green Version]
- Martellotta, F. Understanding the acoustics of Papal Basilicas in Rome by means of a coupled-volumes approach. J. Sound Vib. 2016, 382, 413–427. [Google Scholar] [CrossRef]
- Desarnaulds, V.; Carvalho, A.P.O.; Monay, G. Church acoustics and the influence of occupancy. Build. Acoust. 2002, 9, 29–47. [Google Scholar] [CrossRef] [Green Version]
- Lubman, D.; Kiser, B.H. The history of Western civilization told through the acoustics of its worship spaces. In Proceedings of the 17th International Congress on Acoustics, Rome, Italy, 2–7 September 2001. [Google Scholar]
- ISO. EN, 3382. Acoustics–Measurement of Room Acoustic Parameters–Part 1: Performance Spaces; ISO: Geneva, Switzerland, 2009; Part 1. [Google Scholar]
- Alvarez-Morales, L.; Giron, S.; Galindo, M.; Zamarreno, T. Acoustic environment of Andalusian cathedrals. Build. Environ. 2016, 103, 182–192. [Google Scholar] [CrossRef]
- Alvarez-Morales, L.; Lopez, M.; Alvarez-Corbacho, A.; Bustamante, P. Mapping the Acoustics of Ripon Cathedral; Universitätsbibliothek der RWTH Aachen: Aachen, Germany, 2019. [Google Scholar]
- Ahnert, W.; Schmidt, W. Appendix to EASERA Manual: Fundamentals to Perform Acoustical Measurements. 2005, pp. 1–53. Available online: https://www.semanticscholar.org/paper/Fundamentals-to-perform-acoustical-measurements-Ahnert/3e00dfaa0b8e3eda94da4469d9b5c71e5b0b8cd6 (accessed on 24 March 2021).
- BS EN ISO 60268-16. Sound System Equipment. Objective Rating of Speech Intelligibility by Speech Transmission Index; British Standards Publications: London, UK, 1998. [Google Scholar]
- De Sant’Ana, D.Q.; Paulo Henrique Trombetta, Z. Acoustic evaluation of a contemporary church based on in situ measurements of reverberation time, definition, and computer-predicted speech transmission index. Build. Environ. 2011, II, 511–517. [Google Scholar] [CrossRef]
- Galindo, M.; Zamarreno, T.; Giron, S. Acoustic simulations of Mudejar-Gothic churches. J. Acoust. Soc. Am. 2009, 126, 1207–1218. [Google Scholar] [CrossRef] [PubMed]
- Carvalho, A.P.; Nascimento, B.F. Acoustical characterization of the underground chapels of the new Holy Trinity church in the Fatima shrine, Portugal. In Proceedings of the Forum Acusticum 2011, Aalborg, Denark, 27 June–1 July 2011; pp. 1429–1434. [Google Scholar]
- Álvarez-Morales, L.; Alonso, A.; Girón, S.; Zamarreño, T.; Martellotta, F. Virtual acoustics of the cathedral of Murcia considering occupancy and different source locations. In Proceedings of the Euronoise, Crete, Greece, 27–31 May 2018. [Google Scholar]
- Savioja, L.; Svensson, U.P. Overview of geometrical room acoustic modeling techniques. J. Acoust. Soc. Am. 2015, 138, 708–730. [Google Scholar] [CrossRef] [PubMed] [Green Version]
- CATT. CATT-A v9.0; User’s Manual; CATT: Gothenburg, Germany, 2011. [Google Scholar]
- Rees, I. Common pitfalls in computer modelling of room acoustics. In Proceedings of the Institute of Acoustics, Chesford Grange, Kenilworth, Warwickshire, UK, 5–6 September 2016; p. 38. [Google Scholar]
- TRIMBLE. SketchUp Make, Sunnyvale. 2017. Available online: http://www.sketchup.com/ (accessed on 22 May 2020).
- RAHE KRAFT. SU2CATT, RAHE-KRAFT. 2015. Available online: http://www.rahekraft.de/rk/en/software/su2catt/ (accessed on 22 May 2020).
- Enterprises, B. Beaulieu, Beaulieu Enterprises Ltd. 2021. Available online: https://www.beaulieu.co.uk/attractions/beaulieu-abbey/ (accessed on 9 March 2020).
- Till, R. Sound archaeology: A study of the acoustics of three world heritage sites, Spanish prehistoric painted caves, Stonehenge, and paphos theatre. Acoustics 2019, 1, 39. [Google Scholar] [CrossRef] [Green Version]
- Fergusson, P.; Harrison, S. English Heritage. 2011. Available online: http://www.emglish-heritage.org.uk/visit/places/roche-abbey/history/ (accessed on 8 February 2020).
- Wang, L.M.; Rathsam, J.; Ryherd, S. Interactions of Model Detail Level and Scattering Coefficients in Room Acoustic Computer Simulation. In Proceedings of the International Symposium on Room Acoustics: Design and Science, Hyogo, Japan, 11–13 April 2004. [Google Scholar]
- Bradley, D.T.; Wang, L.M. Effect of model detail level on room acoustic computer simulations. J. Acoust. Soc. Am. 2002, 111, 2389. [Google Scholar] [CrossRef]
- Vorländer, M.; Summers, J.E. Auralization: Fundamentals of acoustics, modelling, simulation, algorithms, and acoustic virtual reality. Acoust. Soc. Am. J. 2008, 123, 4028. [Google Scholar]
- Berardi, U. Simulation of acoustical parameters in rectangular churches. J. Build. Perform. Simul. 2014, 7, 1–16. [Google Scholar] [CrossRef]
- Iannace, G. Acoustic correction of monumental churches with ceramic material: The case of the Cathedral of Benevento (Italy). J. Low Freq. Noise Vib. Active Control 2016, 35, 230–239. [Google Scholar] [CrossRef]
- Martellotta, F. Identifying acoustical coupling by measurements and prediction-models for St. Peter’s Basilica in Rome. J. Acoust. Soc. Am. 2009, 126, 1175–1186. [Google Scholar] [CrossRef]
- Alonso, A.J.; Sendra, J.; Suarez, R.; Zamarreno, T. Acoustic evaluation of the cathedral of Seville as a concert hall and proposals for improving the acoustic quality perceived by listeners. J. Build. Perform. Simul. 2014, 7, 360–378. [Google Scholar] [CrossRef]
- Lisa, M.; Rindel, J.H.; Christensen, C.L. Predicting the acoustics of ancient open-air theatres: The importance of calculation methods and geometrical details. In Proceedings of the Joint Baltic-Nordic Acoustics Meeting, Mariehamn, Åland, 8–10 June 2004. [Google Scholar]
- Olsen, W.O. Average speech levels and spectra in various speaking/listening conditions. Am. J. Audiol. 1998, 7, 21–25. [Google Scholar] [CrossRef]
- Marshall, A.H.; Meyer, J. The directivity and auditory impressions of singers. Acta Acust. Unit. Acust. 1985, 58, 130–140. [Google Scholar]
- Ziolkowski, J.M. The Juggler of Notre Dame and the Medievalizing of Modernity. In War and Peace, Sex and Violence (epub); Open Book Publishers: Cambridge, UK, 2018; pp. 1, 117–170. [Google Scholar]
- Knowles, D. The Religious Orders in England; Cambridge University Press: Cambridge, UK, 1979; Volume 3. [Google Scholar]
- Willimas, J. Yorkshire Footprint Focus Guide, Bath; Footprint Handbooks Ltd.: Bath, UK, 2013. [Google Scholar]
- Postma, B.N.; Katz, B.F.G. Acoustics of Notre-Dame Cathedral de Paris. In Proceedings of the International Congress on Acoustics (ICA), Buenos Aires, Argentina, 5–9 September 2016. [Google Scholar]
- Vorländer, M. Computer simulations in room acoustics: Concepts and uncertainties. J. Acoust. Soc. Am. 2013, 133, 1203–1213. [Google Scholar] [CrossRef] [PubMed]
- Bradley, D.T.; Wang, L.M. Room acoustics in coupled volume spaces. In Proceedings of the Architectural Engineering Conference (AEI) 2006, Omaha, NE, USA, 29 March–1 April 2006. [Google Scholar]
- Anderson, J.S.; Bratos-Anderson, M. Acoustic coupling effects in St Paul’s cathedral, London. J. Sound Vib. 2000, II, 209–225. [Google Scholar] [CrossRef]
- Xiang, N.; Goggans, P.; Jasa, T.; Robinson, P. Bayesian characterization of multiple-slope sound energy decays in coupled-volume systems. J. Acoust. Soc. Am. 2011, 129, 741–752. [Google Scholar] [CrossRef] [PubMed] [Green Version]
- Soeta, Y.; Ken, I.; Ryota, S.; Shin-ichi, S.; Tomohiro, O.; Yoichi, A. Effects of sound source location and direction on acoustic parameters in Japanese churches. J. Acoust. Soc. Am. 2021, II, 1206–1220. [Google Scholar] [CrossRef] [PubMed]
- Segler, F.M.; Bradley, R. Christian Worship: Its Theology and Practice; B&H Publishing Group: Nashville, TN, USA, 2006. [Google Scholar]
- The Department for Education. Building Bulletin 93: Acoustic Design of Schools: Performance Standards; Crown: London, UK, 2014. [Google Scholar]
- Harvie-Clark, J.; Dobinson, N. The practical application of G and C50 in classrooms. In Proceedings of the INTER-NOISE and NOISE-CON Congress and Conference, Innsbruck, Austria, 15–18 September 2013. [Google Scholar]
- Long, M. Architectural Acoustics; Elsevier: Amsterdam, The Netherlands, 2005. [Google Scholar]
- Debertolis, P.; Mizdrak, S. The Research for an Archaeoacoustics Standard. In Proceedings of the 2nd ARSA Conference (Advanced Research in Scientific Areas), Zilina, Slovakia, 3–7 December 2013. [Google Scholar]
Figure 1.
Sound Intensity over frequency for Gregorian chants [3].
Figure 1.
Sound Intensity over frequency for Gregorian chants [3].

Figure 2.
Beaulieu Abbey floor-plan [8].
Figure 2.
Beaulieu Abbey floor-plan [8].

Figure 3.
Illustration by Peter Urmston of the Roche Abbey Tower (left) was used as an architectural reference to model the Beaulieu Abbey Tower (right) [8].
Figure 3.
Illustration by Peter Urmston of the Roche Abbey Tower (left) was used as an architectural reference to model the Beaulieu Abbey Tower (right) [8].

Figure 4.
Original vs. simplified model comparison.

Figure 5.
Sound source and receivers from the pulpit to the nave section.

Figure 6.
Sound source and receivers from the altar to the quire area.

Figure 7.
Sound source and receivers from quire to nave section.

Figure 8.
T30 comparisons over standard frequency bands.

Figure 9.
mid-frequency [500 Hz–1 kHz] T30 results: (a) T30 results over receiver positions; (b) T30 results over distance.
Figure 9.
mid-frequency [500 Hz–1 kHz] T30 results: (a) T30 results over receiver positions; (b) T30 results over distance.

Figure 10.
C50 and C80 results over standard frequency bands.

Figure 11.
C50 results: (a) C50 results over receiver positions; (b) C50 results over distance.

Figure 12.
STI results for the simulated scenarios.

Figure 13.
STI results: (a) STI results over receiver positions; (b) STI results over distance.


Table 1.
Planes to volume detail ratio [32].
Table 1.
Planes to volume detail ratio [32].
| Level of Detail | # of Surfaces/Volume (m−3) |
|---|---|
| Low | 0.003 to 0.010 |
| Medium | 0.010 to 0.015 |
| High | 0.015 to 0.030 |
Table 2.
Absorption coefficients used in model.
| Material | 125 Hz | 250 Hz | 500 Hz | 1 kHz | 2 kHz | 4 kHz | Reference |
|---|---|---|---|---|---|---|---|
| Arches & Pillars | 16 | 18 | 16 | 16 | 18 | 17 | [9] |
| Limestone Walls | 3 | 3 | 3 | 4 | 5 | 5 | [33] |
| Ceiling | 20 | 15 | 10 | 8 | 7 | 7 | [34] |
| Floor | 4 | 3 | 1 | 1 | 1 | 5 | [35] |
| Audience & Monks | 52 | 68 | 85 | 97 | 93 | 85 | [24] |
| Pulpit | 12 | 12 | 15 | 15 | 18 | 18 | [9] |
| Windows | 35 | 25 | 18 | 12 | 07 | 04 | [36] |
| Door | 14 | 10 | 6 | 8 | 10 | 10 | [9] |
Table 3.
Recommended scattering coefficients [37].
Table 3.
Recommended scattering coefficients [37].
| Alonso et al. Scattering Coefficients (s) | ||||||
| Surface | 125 Hz | 250 Hz | 500 Hz | 1 kHz | 2 kHz | 4 kHz |
| Smooth | 12 | 13 | 14 | 15 | 16 | 17 |
| Moderately Irregular | 20 | 25 | 30 | 35 | 40 | 45 |
| Irregular | 30 | 40 | 50 | 60 | 70 | 80 |
Table 4.
Scattering coefficients used in final model [34].
Table 4.
Scattering coefficients used in final model [34].
| Material | 125 Hz | 250 Hz | 500 Hz | 1 kHz | 2 kHz | 4 kHz |
|---|---|---|---|---|---|---|
| Arches & Pillars | 30 | 40 | 50 | 60 | 70 | 80 |
| Limestone Walls | 14 | 15 | 16 | 17 | 18 | 19 |
| Ceiling | 30 | 40 | 50 | 60 | 70 | 80 |
| Floor | 14 | 15 | 16 | 17 | 18 | 19 |
| Audience & Monks | 30 | 40 | 50 | 60 | 70 | 80 |
| Pulpit | 20 | 25 | 30 | 35 | 40 | 45 |
| Windows | 12 | 13 | 14 | 15 | 16 | 17 |
| Door | 20 | 25 | 30 | 35 | 40 | 45 |
Table 5.
Frequency data used for sound source [40].
Table 5.
Frequency data used for sound source [40].
| REFERENCE | 125 | 250 | 500 | 1 kHz | 2 kHz | 4 kHz |
| Loud male voice | 57 | 65 | 72 | 71 | 66 | 60 |
Table 6.
Frequency data used for sound source (Marshall and Meyer 1985).
| Frequency | 125 | 250 | 500 | 1 kHz | 2 kHz | 4 kHz |
| Singer | 65 | 68 | 71 | 74 | 77 | 80 |
Table 7.
Spatially and frequency averaged RT values comparison.
| Acoustic Environment | RT [s] | |
|---|---|---|
| Beaulieu Abbey | 47,062 | 2.39 s ≤ ≤ 4.20 s 2.29 s ≤ ≤ 3.69 s |
| Senanque Abbey | 8330 | = 5.43 s |
| Silvacane Abbey | 10,100 | = 6.02 s |
| Le Thoronet Abbey | 7360 | = 7.96 s |
| Tiglieto Abbey | 3390 | = 3.13 s |
| Morimondo Abbey | 12,110 | = 3.82 s |
| Chiaravalle Abbey | 14,970 | = 4.41 s |
| St. Peter’s Basilica in Rome | 480,000 | = 9.9 s = 9.6 s |
| Basilica of Saint Paul outside Walls | 160,000 | = 8.3 s |
| Basilica of St. John Lateran | 120,000 | = 5.7 s |
| Basilica of Saint Mary Major | 38,000 | = 4.3 s |
| Murcia cathedral | 50,000 | 4.28 s ≤ ≤ 4.54 s |
Table 8.
Spatially and frequency averaged C50/C80 values comparison.
| Acoustic Environment | C50 and C80 [dB] | |
|---|---|---|
| Beaulieu Abbey | 47,062 | −8.06 dB ≤ ≤ 0.77 dB −7.44 dB ≤ ≤ 2.92 dB = −2.45 dB C80[125 Hz4 kHz] = −1.11 dB |
| Senanque Abbey | 8330 | = −11.13 dB = −8.11 dB |
| Silvacane Abbey | 10,100 | = −11.32 dB = −8.35 dB |
| Le Thoronet Abbey | 7360 | = −11.33 dB = −8.73 dB |
| Tiglieto Abbey | 3390 | = −6.40 dB = −3.88 dB |
| Morimondo Abbey | 12,110 | = −8.29 dB = −5.26 dB |
| Chiaravalle Abbey | 14,970 | = −8.58 dB = −6.50 dB |
| Murcia cathedral | 50,000 | = −5.18 dB = −3.79 dB |
Table 9.
Spatially averaged STI comparisons.
| Acoustic Environment | STI | STI Rating | STI Rating (Non-Native Speakers) | |
|---|---|---|---|---|
| Beaulieu Abbey | 47,062 | 0.45 ≤ ≤ 0.60 | Bad-poor ≤ ≤ Fair-good | Bad-poor ≤ ≤ Bad-poor |
| Malaga cathedral | 118,500 | 0.42 | Bad-poor | Bad-poor |
| Ripon cathedral | 31,000 | 0.49 | Poor-fair | Bad-poor |
| Seville cathedral | 200,000 | 0.52 | Poor-fair | Bad-poor |
| Cordoba cathedral | 155,000 | 0.40 | Bad-poor | Bad-poor |
| Christian Basilica | 100,000 | 0.51 | Poor-fair | Bad-poor |
Publisher’s Note: MDPI stays neutral with regard to jurisdictional claims in published maps and institutional affiliations. |
© 2021 by the authors. Licensee MDPI, Basel, Switzerland. This article is an open access article distributed under the terms and conditions of the Creative Commons Attribution (CC BY) license (http://creativecommons.org/licenses/by/4.0/).
Share and Cite
MDPI and ACS Style
Duran, S.; Chambers, M.; Kanellopoulos, I. An Archaeoacoustics Analysis of Cistercian Architecture: The Case of the Beaulieu Abbey. Acoustics 2021, 3, 252-269. https://0-doi-org.brum.beds.ac.uk/10.3390/acoustics3020018
AMA Style
Duran S, Chambers M, Kanellopoulos I. An Archaeoacoustics Analysis of Cistercian Architecture: The Case of the Beaulieu Abbey. Acoustics. 2021; 3(2):252-269. https://0-doi-org.brum.beds.ac.uk/10.3390/acoustics3020018
Chicago/Turabian StyleDuran, Sebastian, Martyn Chambers, and Ioannis Kanellopoulos. 2021. "An Archaeoacoustics Analysis of Cistercian Architecture: The Case of the Beaulieu Abbey" Acoustics 3, no. 2: 252-269. https://0-doi-org.brum.beds.ac.uk/10.3390/acoustics3020018