
The Binaural Illusion of Wallach (1940) Apparent in Synthetic Aperture Images of the Field of Audition Generated as the Head Turns


1
Environmental Research Institute, North Highland College, University of the Highlands and Islands, Thurso KW14 7EE, UK
2
Inverlorien Acoustics, 5 Drummond Crescent, Inverness IV2 4QW, UK
Acoustics 2021, 3(2), 297-308; https://0-doi-org.brum.beds.ac.uk/10.3390/acoustics3020020
Submission received: 30 March 2021
/
Revised: 23 April 2021
/
Accepted: 23 April 2021
/
Published: 28 April 2021
(This article belongs to the Special Issue Binaural Audition)
Abstract
:Wallach (J. Exp. Psychol. 1940, 27, 339–368) predicted that a human subject rotating about a vertical axis through the auditory centre, having an acoustic source rotating around the same axis at twice the rotation rate of the human subject, would perceive the acoustic source to be stationary. His prediction, which he confirmed by experiment, was made to test the hypothesis that humans integrate head movement information that is derived from the vestibular system and visual cues, with measurements of arrival time differences between the acoustic signals received at the ears, to determine directions to acoustic sources. The simulation experiments described here demonstrate that a synthetic aperture calculation performed as the head turns, to determine the direction to an acoustic source (Tamsett, Robotics 2017, 6, 10), is also subject to the Wallach illusion. This constitutes evidence that human audition deploys a synthetic aperture process in which a virtual image of the field of audition is populated as the head turns, and from which directions to acoustic sources are inferred. The process is akin to those in synthetic aperture sonar/radar technologies and to migration in seismic profiler image processing. It could be implemented in a binaural robot localizing acoustic sources from arrival time differences in emulation of an aspect of human audition.
1. Introduction
Wallach [1,2] hypothesized that, when a human turns their head while listening to sound, the auditory system integrates information on head movement that is generated by the vestibular system and from visual cues, with measurements of arrival time/amplitude differences between acoustic signal arriving at the ears, in order to determine the direction to the source of sound. He tested the hypothesis through the use of an ingeniously devised experiment. He predicted that a human subject turning their head (and, therefore, their binaural antenna) at a certain rotation rate about a vertical axis through the subject’s auditory centre, with a source of sound rotating around the same axis at twice the rotation rate of the head, ought to perceive the sound source to be at rest rather than moving. The source should be apparently located directly behind the subject at the instants when the listener is facing the sound source. The acoustic illusion will only succeed if head movement information, derived from the vestibular system and from visual cues, is combined by the auditory system with arrival time/amplitude difference data, to localize sound as the head turns, and fail otherwise. Wallach [2] described experiments that demonstrated that humans experience the auditory illusion.
Others have since confirmed the occurrence of the illusion [3,4,5,6], but have also found that it does not universally apply. It usually succeeds where the acoustic signal is of sufficiently low frequency [7]; less than approximately 1500 Hz [8]. At these frequencies, the auditory system principally exploits inter-aural time delays for acoustic source localization [9,10]. Where signal has higher frequency content, inter-aural level differences play the more dominant role for disambiguating directions to acoustic sources [9]. If there is sufficiently high frequency bandwidth [3] spectral cues associated with a Head Related Transfer Function [11,12,13,14,15], whilst contributing little to disambiguating the azimuthal component of the direction of incoming acoustic signal, provide additional information to the auditory system for estimating the vertical component. The Wallach illusion occurs more often for low frequency acoustic signals, but, for high frequency signal, the auditory system draws on processes enabling it to disambiguate directions to acoustic sources sufficiently for the illusion to fail. This paper is concerned with circumstances in which the Wallach illusion succeeds, and therefore is relevant for low frequency acoustic signal [3,7,8,9].
It is by no means immediately obvious that a source of sound rotating around a listener’s head at twice the rotation rate of the head should lead to the listener experiencing the illusion of the source of sound seeming to be at rest. Wallach (1940) [2] presented his ideas descriptively, without recourse to a figure for illustration, notwithstanding that the work is masterful in thought and execution.
A binaural synthetic aperture computation, acting as the head is turned, using angles determined from arrival time differences at the ears, integrates information that relates to instantaneously ambiguous directions to an acoustic source, in virtual images of the field of audition, to generate a bright spot constituting a disambiguated, potentially unique solution to the direction to the acoustic source [16,17]. The binaural synthetic aperture computation that is featured in this paper is analogous to that in ‘migration’ applied to seismic profiler data, and to sonar and radar data in synthetic aperture sonar and radar systems [18]. The synthetic aperture calculation in all cases may be carried out by distending over circles in dimensions of space, data acquired as a function of time, based on a velocity model, and allowing constructive and destructive interference to play their part, to yield a processed image with improved resolution when compared to an image of the raw data (as illustrated in Tamsett [16] Appendix C).
In this article, it is shown that the synthetic aperture approach to binaural localization, in common with that experienced for the low frequency acoustic signal by human audition, is subject to Wallach’s binaural illusion. This supports the notion that a synthetic aperture computation may be a process that is executed in the cerebral cortex of which we are not conscious that serves to inform our conscious mind of directions to acoustic sources. It also supports a synthetic aperture computation-based approach to localization as appropriate for incorporation in a binaural robotic system in the emulation of human audition.
2. The Angle between the Auditory Axis and the Direction to an Acoustic Source
If it were not that we are so familiar with binaural audition in animals, we might be surprised that evolution has furnished vertebrates with only two ears and that from sound incident on these we are able to make such good sense of the acoustic environment in which we live. Human engineers would (and do) usually prefer to have three or more sensors that are arranged as a two-dimensional array to enable the directions to acoustic sources to be robustly determined. With just two sensors, arrival time/loudness difference alone, allows for only a single variable to be estimated—the angle, lambda , between the auditory axis, and the direction to the acoustic source. This single instantaneous measurement does no better than determining the co-latitude of a cone sharing an axis with the auditory axis on which the acoustic source is ambiguously located.
In the simulation experiments for exploring the behaviour of a binaural system described in this article, values for lambda () are computed from: the azimuthal angle between the direction to an acoustic source that is measured to starboard from the direction that the head is facing (); the angular elevation of the acoustic source (); and, the angular tilt of the auditory axis across the head (downslope to the right) (); from [16]:
Whilst an instantaneous single value for lambda determines the acoustic source to be located on a cone (strictly speaking, a hyperbolic cone to include near field sources), which can be regarded as a circle if the cone is projected onto the surface of a sphere at far field; a succession of such circles integrated as the head turns while listening to a sound, will intersect at a point, with this location being the solution determined as the direction to the acoustic source. This amounts to a synthetic aperture calculation (described and illustrated in Tamsett [16] Appendix C), providing a pair of ears with the direction finding capability of a large 2-D array of listening sensors. The idea behind synthetic aperture calculation is implicit in Wallach’s conceptualizing his acoustic illusion experiment. In the next section, we look explicitly at how a synthetic aperture integration of data distended over circles as the head turns can be used to explore the Wallach binaural illusion and, more generally, provide solutions to the binaural localization problem.
3. Synthetic Aperture Images of Wallach’s Binaural Illusion
Figure 1 illustrates the basis of the synthetic data generated for the simulation experiments reported and discussed in this article.
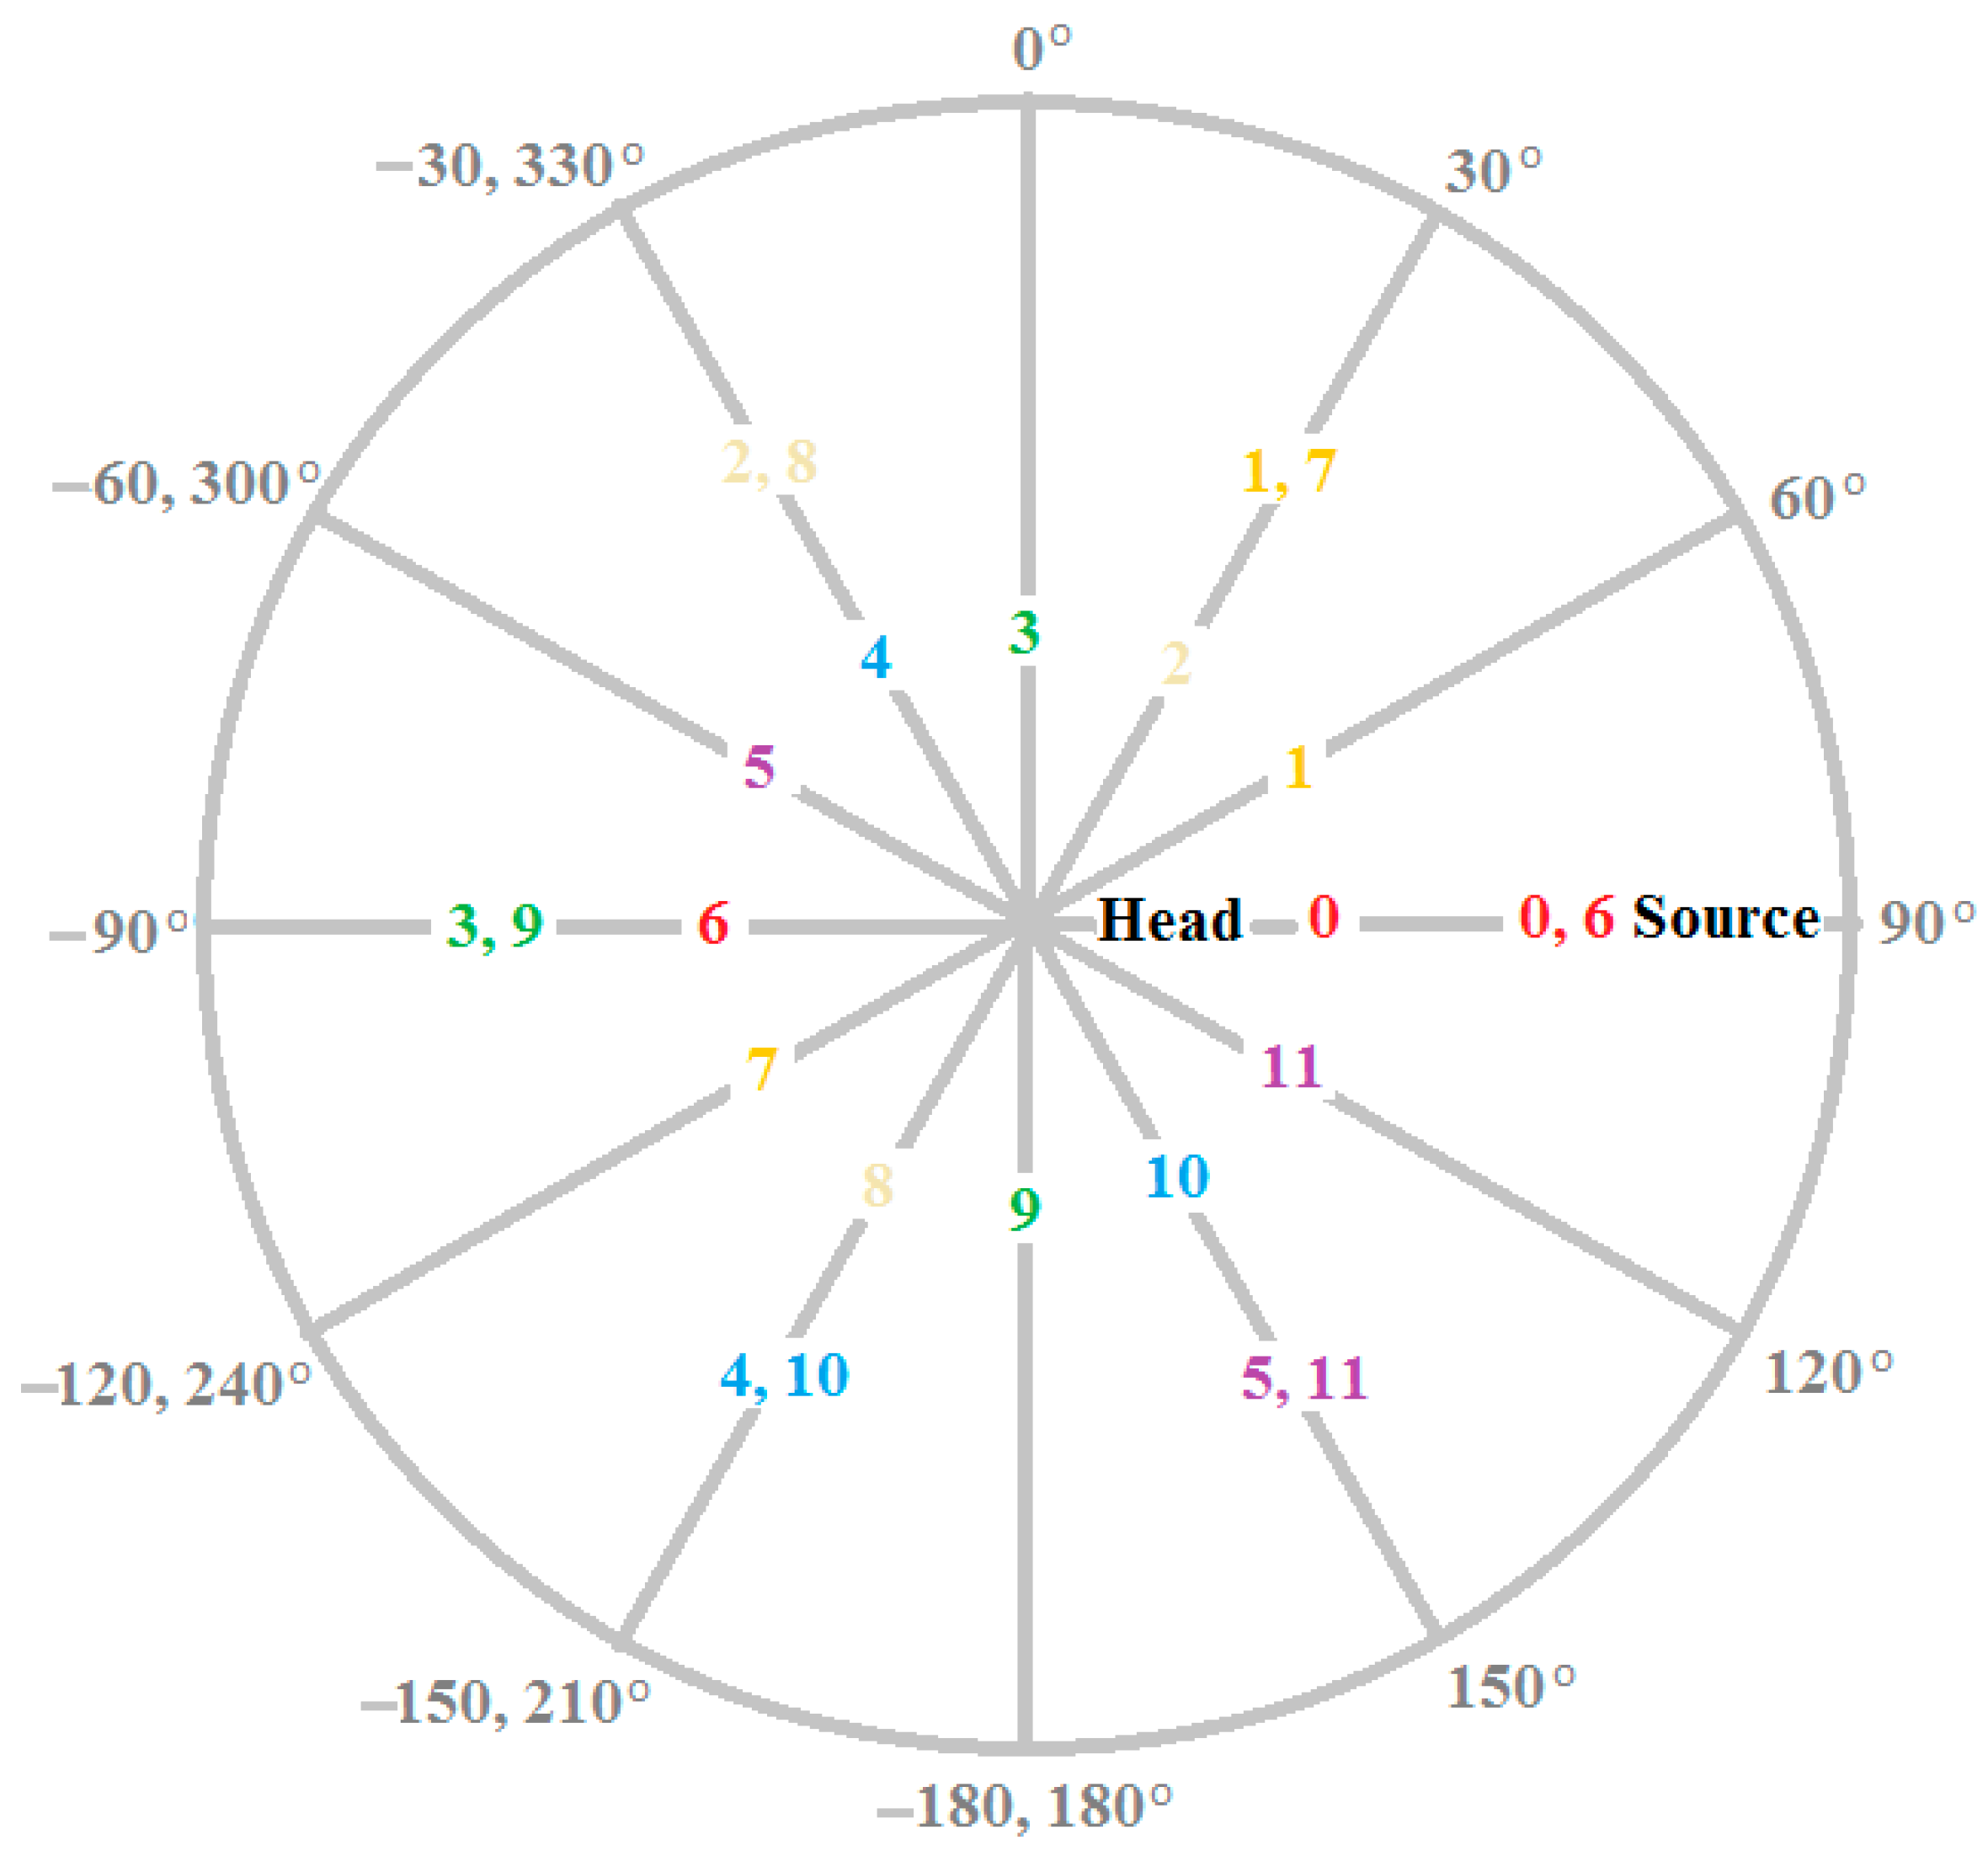
Consider a person that is seated in a chair, having their head immobilized with respect to the chair, turning about a vertical axis through the auditory centre, and having an acoustic source rotating on a circular path around the person. The initial direction that the head is facing is along a real world bearing of 90°, and the initial direction to the source is along the same bearing (90°) (0 in Figure 1, Figure 2, Figure 3, Figure 4, Figure 5, Figure 6 and Figure 7). As the chair rotates anti-clockwise, the source rotates around the person at twice the person’s rate of rotation. At 30° intervals for rotation of the head (corresponding to 60° intervals for rotation of the source about the head) (1–11 in Figure 1, Figure 2, Figure 3, Figure 4, Figure 5, Figure 6 and Figure 7), lambda colatitudes are computed and, using a colour code, drawn into a skeletonized image of the field of audition.
This procedure is followed in each of five simulation experiments labelled A–E, for which the angular elevation of the source and/or the angular tilt of the auditory axis from the horizontal are varied. Table 1 summarizes the variables for the five experiments.
The values of lambda computed for one full rotation of the head (two rotations of the source) for each of the five experiments A–E are tabulated in Table 2.

Table 2.
For each of five experiments (A–E) twelve instantaneous values for lambda λ are computed Equation (1) at 30° intervals in a 360° anticlockwise rotation of the binaural antenna, corresponding to 60° intervals in a 720° rotation of the acoustic source. The direction the head is facing and the direction to the acoustic source are initiated on a bearing of 90°. The indices in the table (0–11) are the same as those used to illustrate the skeletonized acoustic images of the field of audition in Figure 1, Figure 2, Figure 3, Figure 4, Figure 5, Figure 6 and Figure 7.
| Lambda (λ) Circle Index | Bearing Head is Facing (World Datum) θH | Bearing to Source (World Datum) θS | Azimuth of Source Relative to Head θ = θS − θH | λA | λB | λC | λD | λE |
|---|---|---|---|---|---|---|---|---|
| 0 | 90° | 90° | 0° | 90° | 89.7° | 90° | 80.2° | 89.5° |
| 1 | 60° | 30° | −30° | 120° | 118° | 116° | 104° | 115° |
| 2 | 30° | −30° | −60° | 150° | 144° | 139° | 122° | 138° |
| 3 | 0° | −90° | −90° | 180° | 160° | 150° | 130° | 149° |
| 4 | −30° | −150° | −120° | 150° | 144° | 139° | 122° | 138° |
| 5 | −60° | 150° | −150° | 120° | 118° | 116° | 104° | 115° |
| 6 | −90° | 90° | −180° | 90° | 89.9° | 90° | 80.2° | 89.5° |
| 7 | −120° | 30° | −210° | 60° | 61.9° | 64.3° | 54.7° | 63.8° |
| 8 | −150° | −30° | −240° | 30° | 35.5° | 41.4° | 28.9° | 40.7° |
| 9 | −180° | −90° | −270° | 0° | 19.9° | 30° | 10.0° | 29.0° |
| 10 | −210° | −150° | −300° | 30° | 35.5° | 41.4° | 28.9° | 40.7° |
| 11 | −240° | −210° | −330° | 60° | 61.9° | 64.3° | 54.7° | 63.8° |
The lambda circles that are drawn into the acoustic images of the field of audition in Figure 2, Figure 3, Figure 4, Figure 5, Figure 6 and Figure 7 are shown simply, as skeletonized coloured lines, for the purpose of demonstrating the principle governing the generation of synthetic aperture acoustic images. In a real system, for example, a binaural robot, values corresponding to some measure of the strength or intensity of a signal would be distended along the trajectories of the lambda circles and be stored in data bins arranged as a 2-D array corresponding to a virtual image of the field of audition. At the points at which circles intersect, the bin values would accumulate/integrate. The values might also be displayed as an explicit image of the field of audition for monitoring system performance, debugging, or as an aid for ongoing system development. The location of bright spots (large bin values) would correspond to solutions (be they real or illusory) to acoustic source localization.
3.1. Simulation Experiment A
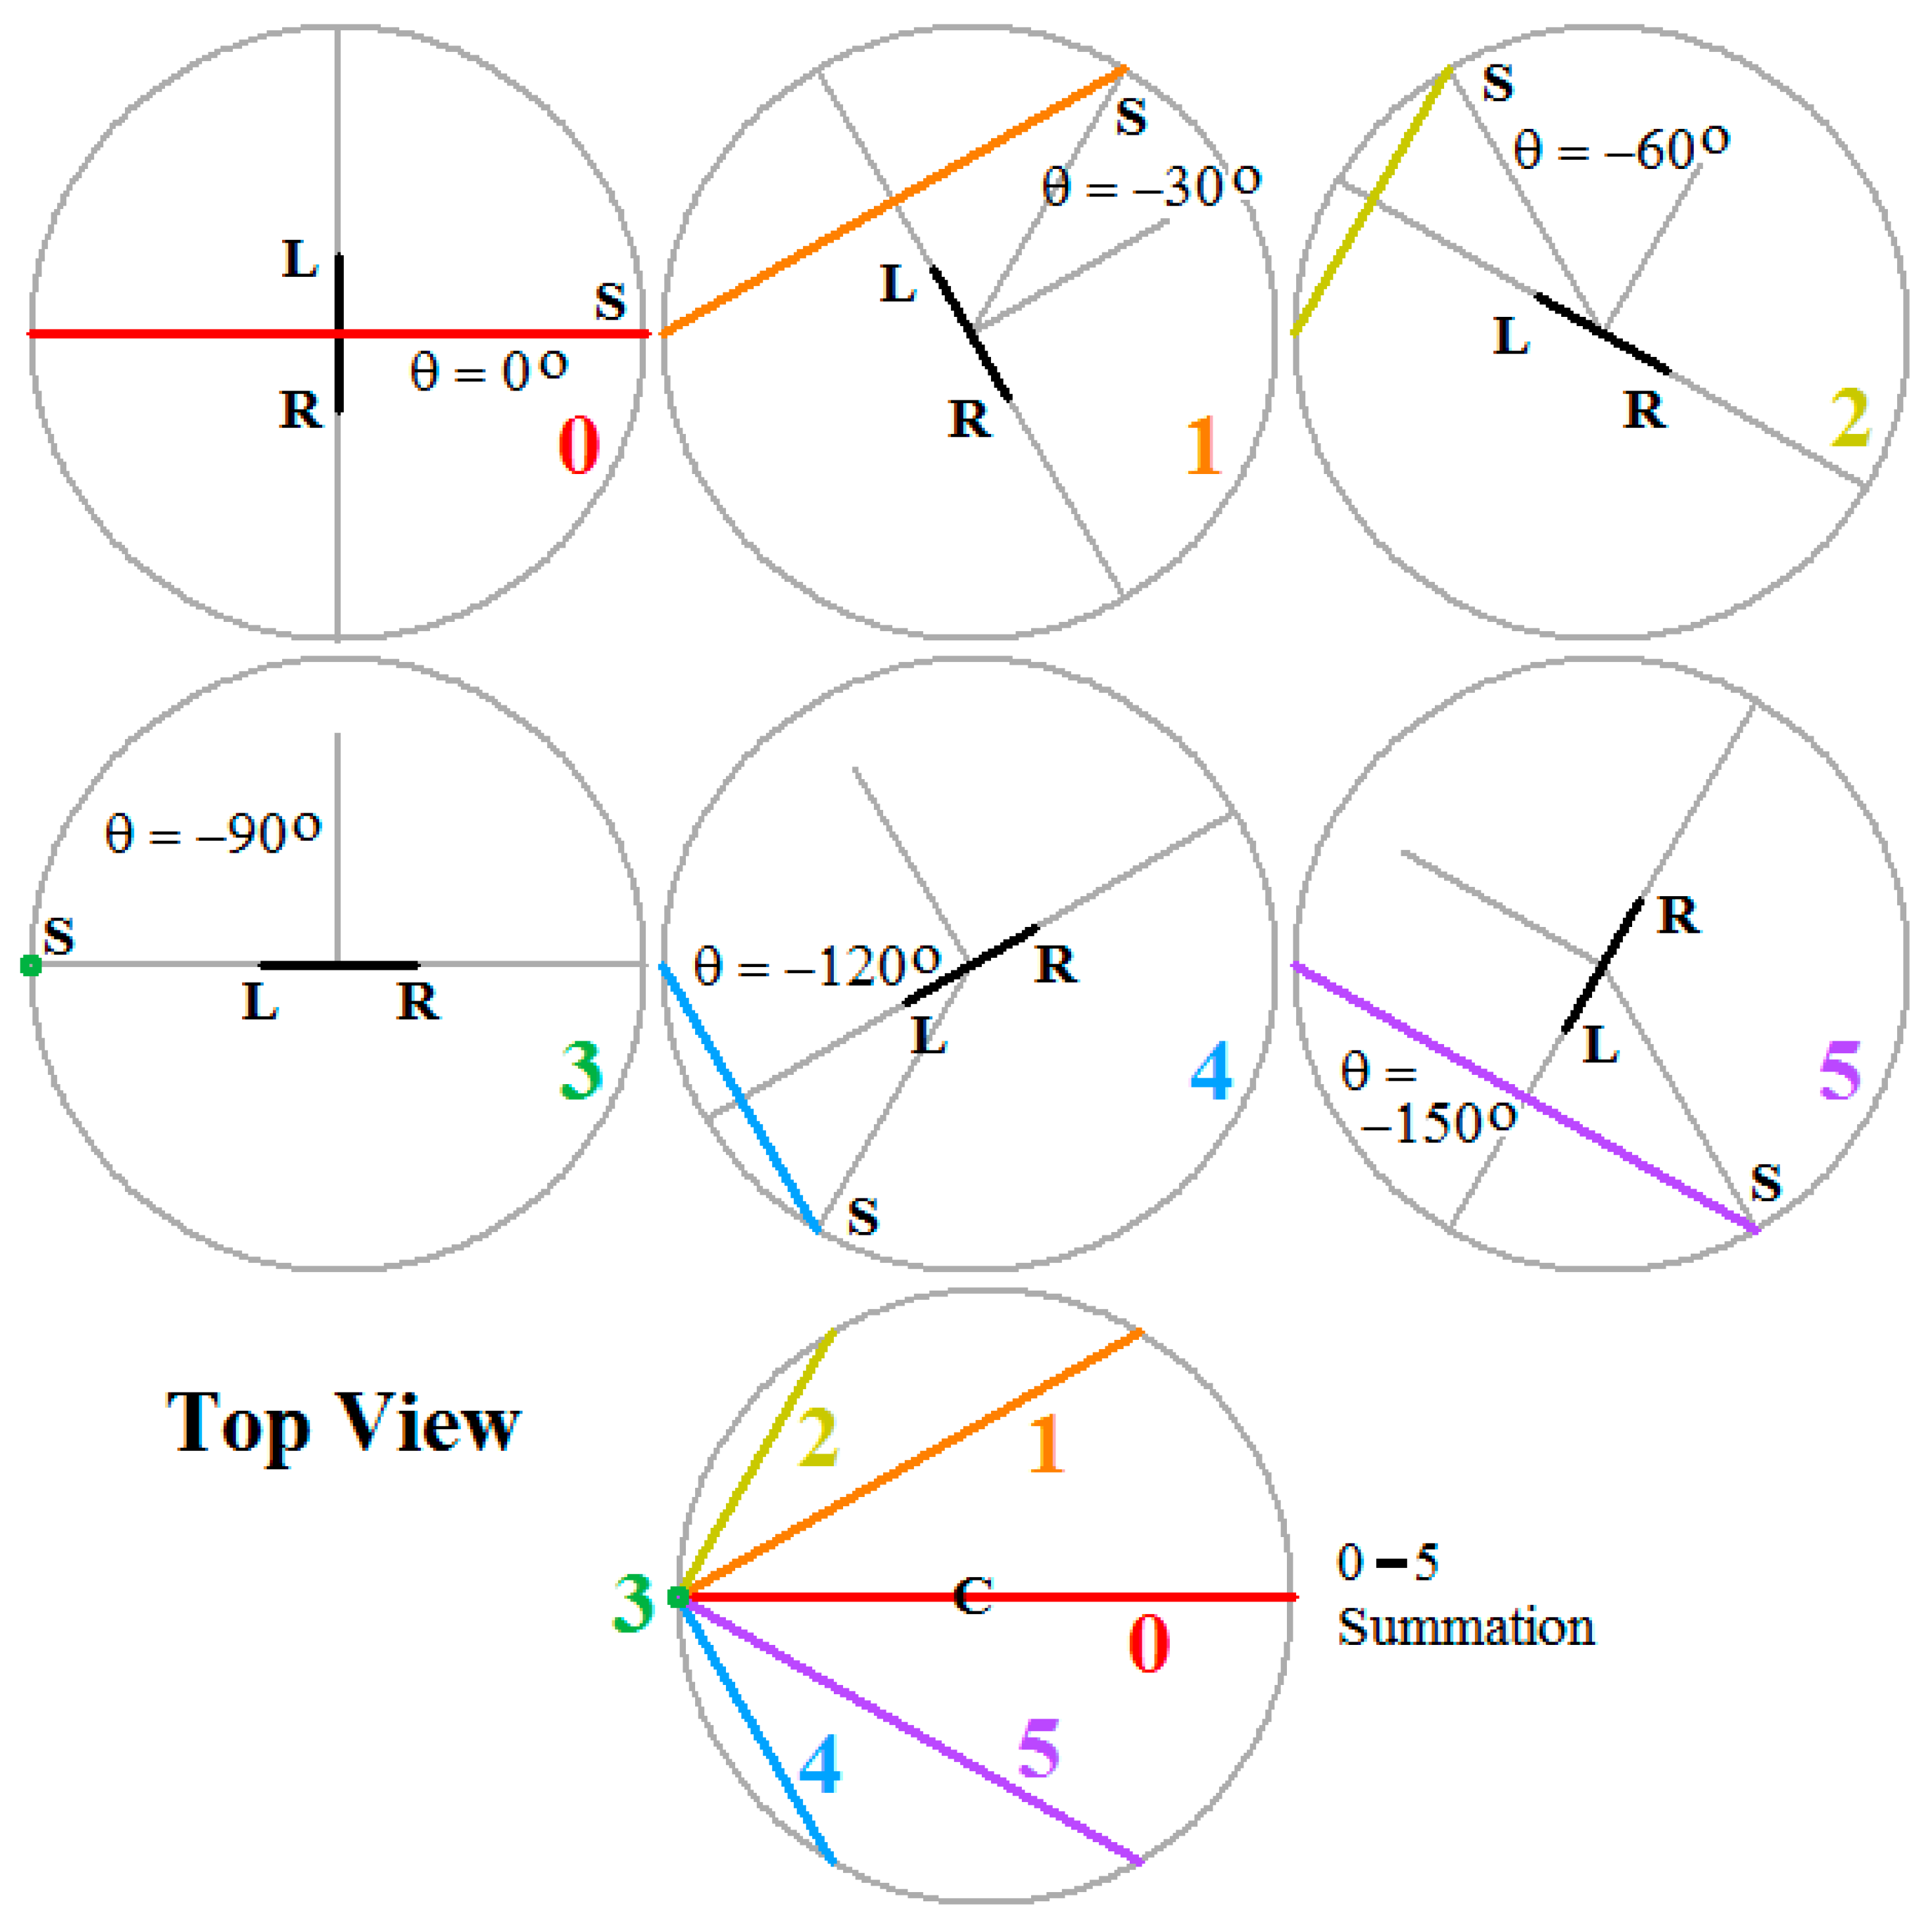
The simplest experiment is one in which the source follows the horizon with no vertical elevation, and the auditory axis across the head is horizontal. Figure 2 presents the orientations of the head, the positions of the acoustic source, and the lambda circles, for a half rotation of the binaural antenna, in top view.
In top view, for a horizontal auditory axis, the lambda circles project onto a horizontal plane as straight lines. Figure 2 demonstrates that, whilst the best that can be achieved in localizing an acoustic source from a single instantaneous measurement of lambda is to locate the source on the trajectory of a circle of colatitude with respect to the auditory axis, the lambda circles integrated over time (the bottom of Figure 2) have, in common, a single point located on a bearing of −90°. Thus, the direction-finding capability of a pair of ears is raised to that of a 2-D array of antennae. The intersection of the lambda circles on a bearing of −90° corresponds to the apparent location of the acoustic source that is inferred from the synthetic aperture calculation. However, this solution is illusory, for, in fact, for the half rotation of the head needed to generate the data for Figure 2, the acoustic source is in constant motion and it makes a full rotation around the head. It seems likely that Wallach must have sketched a diagram similar to that shown in Figure 2 to crystalize his thoughts in devising his experiment to predict the binaural illusion.
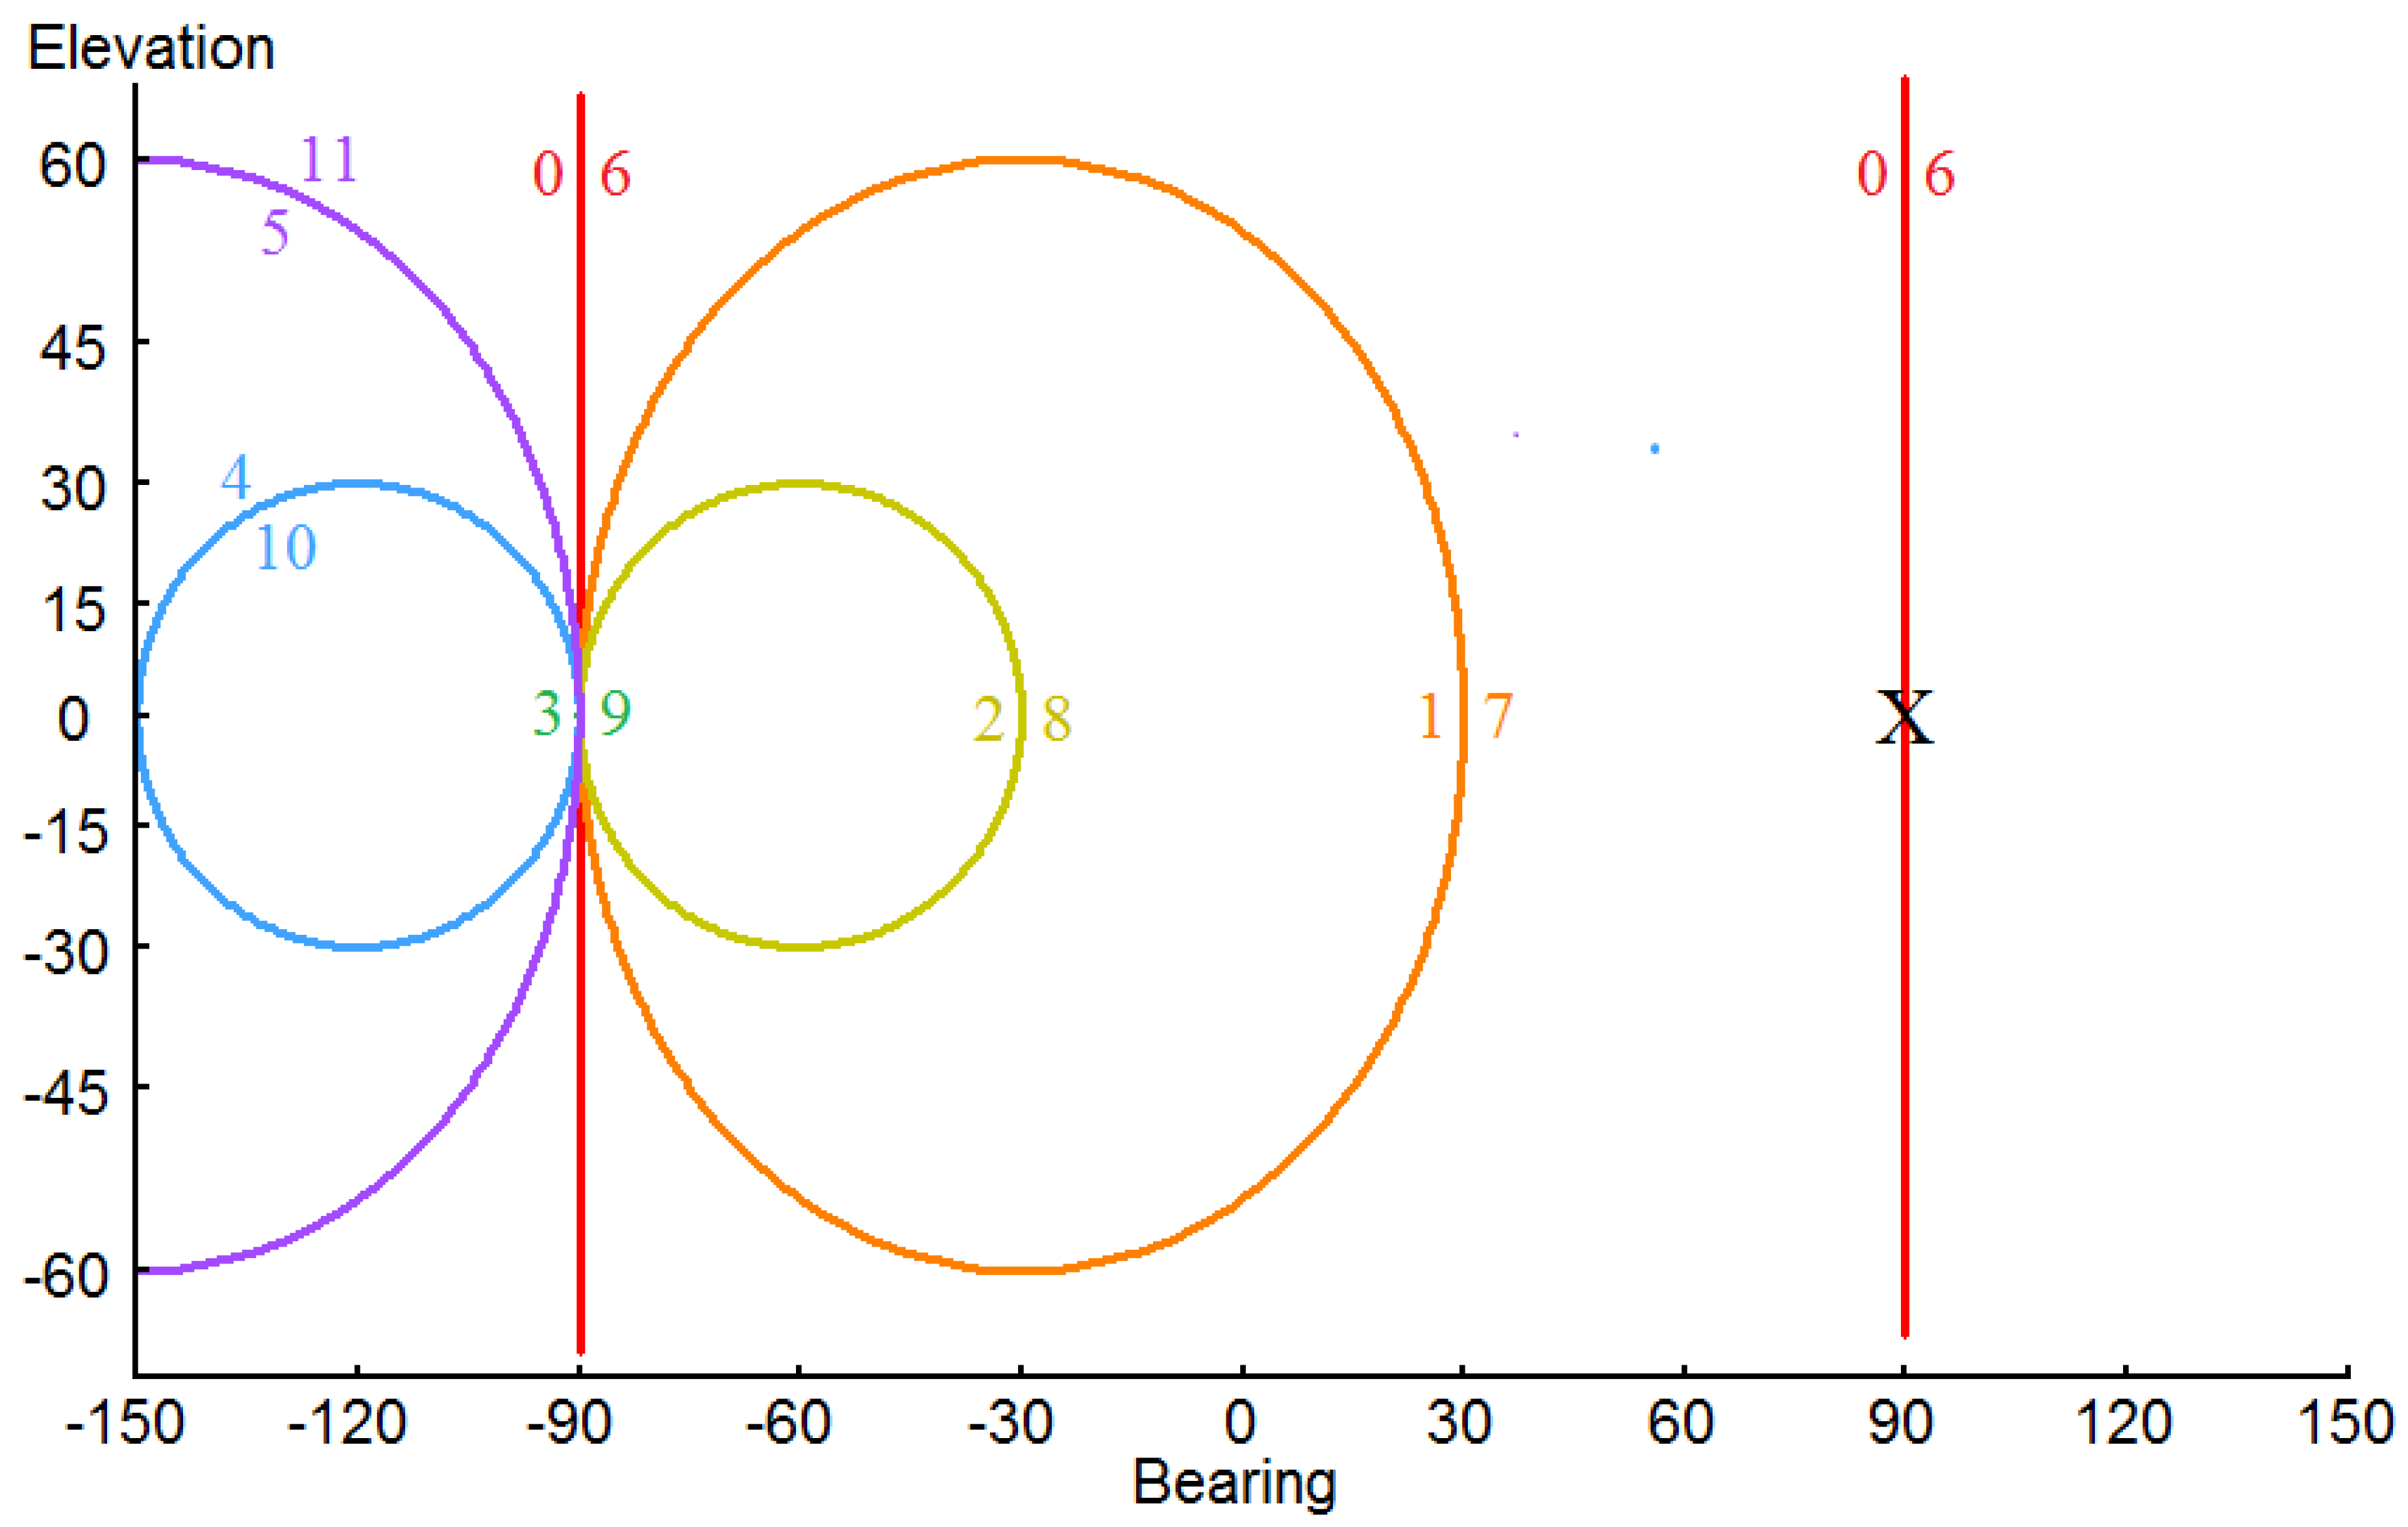
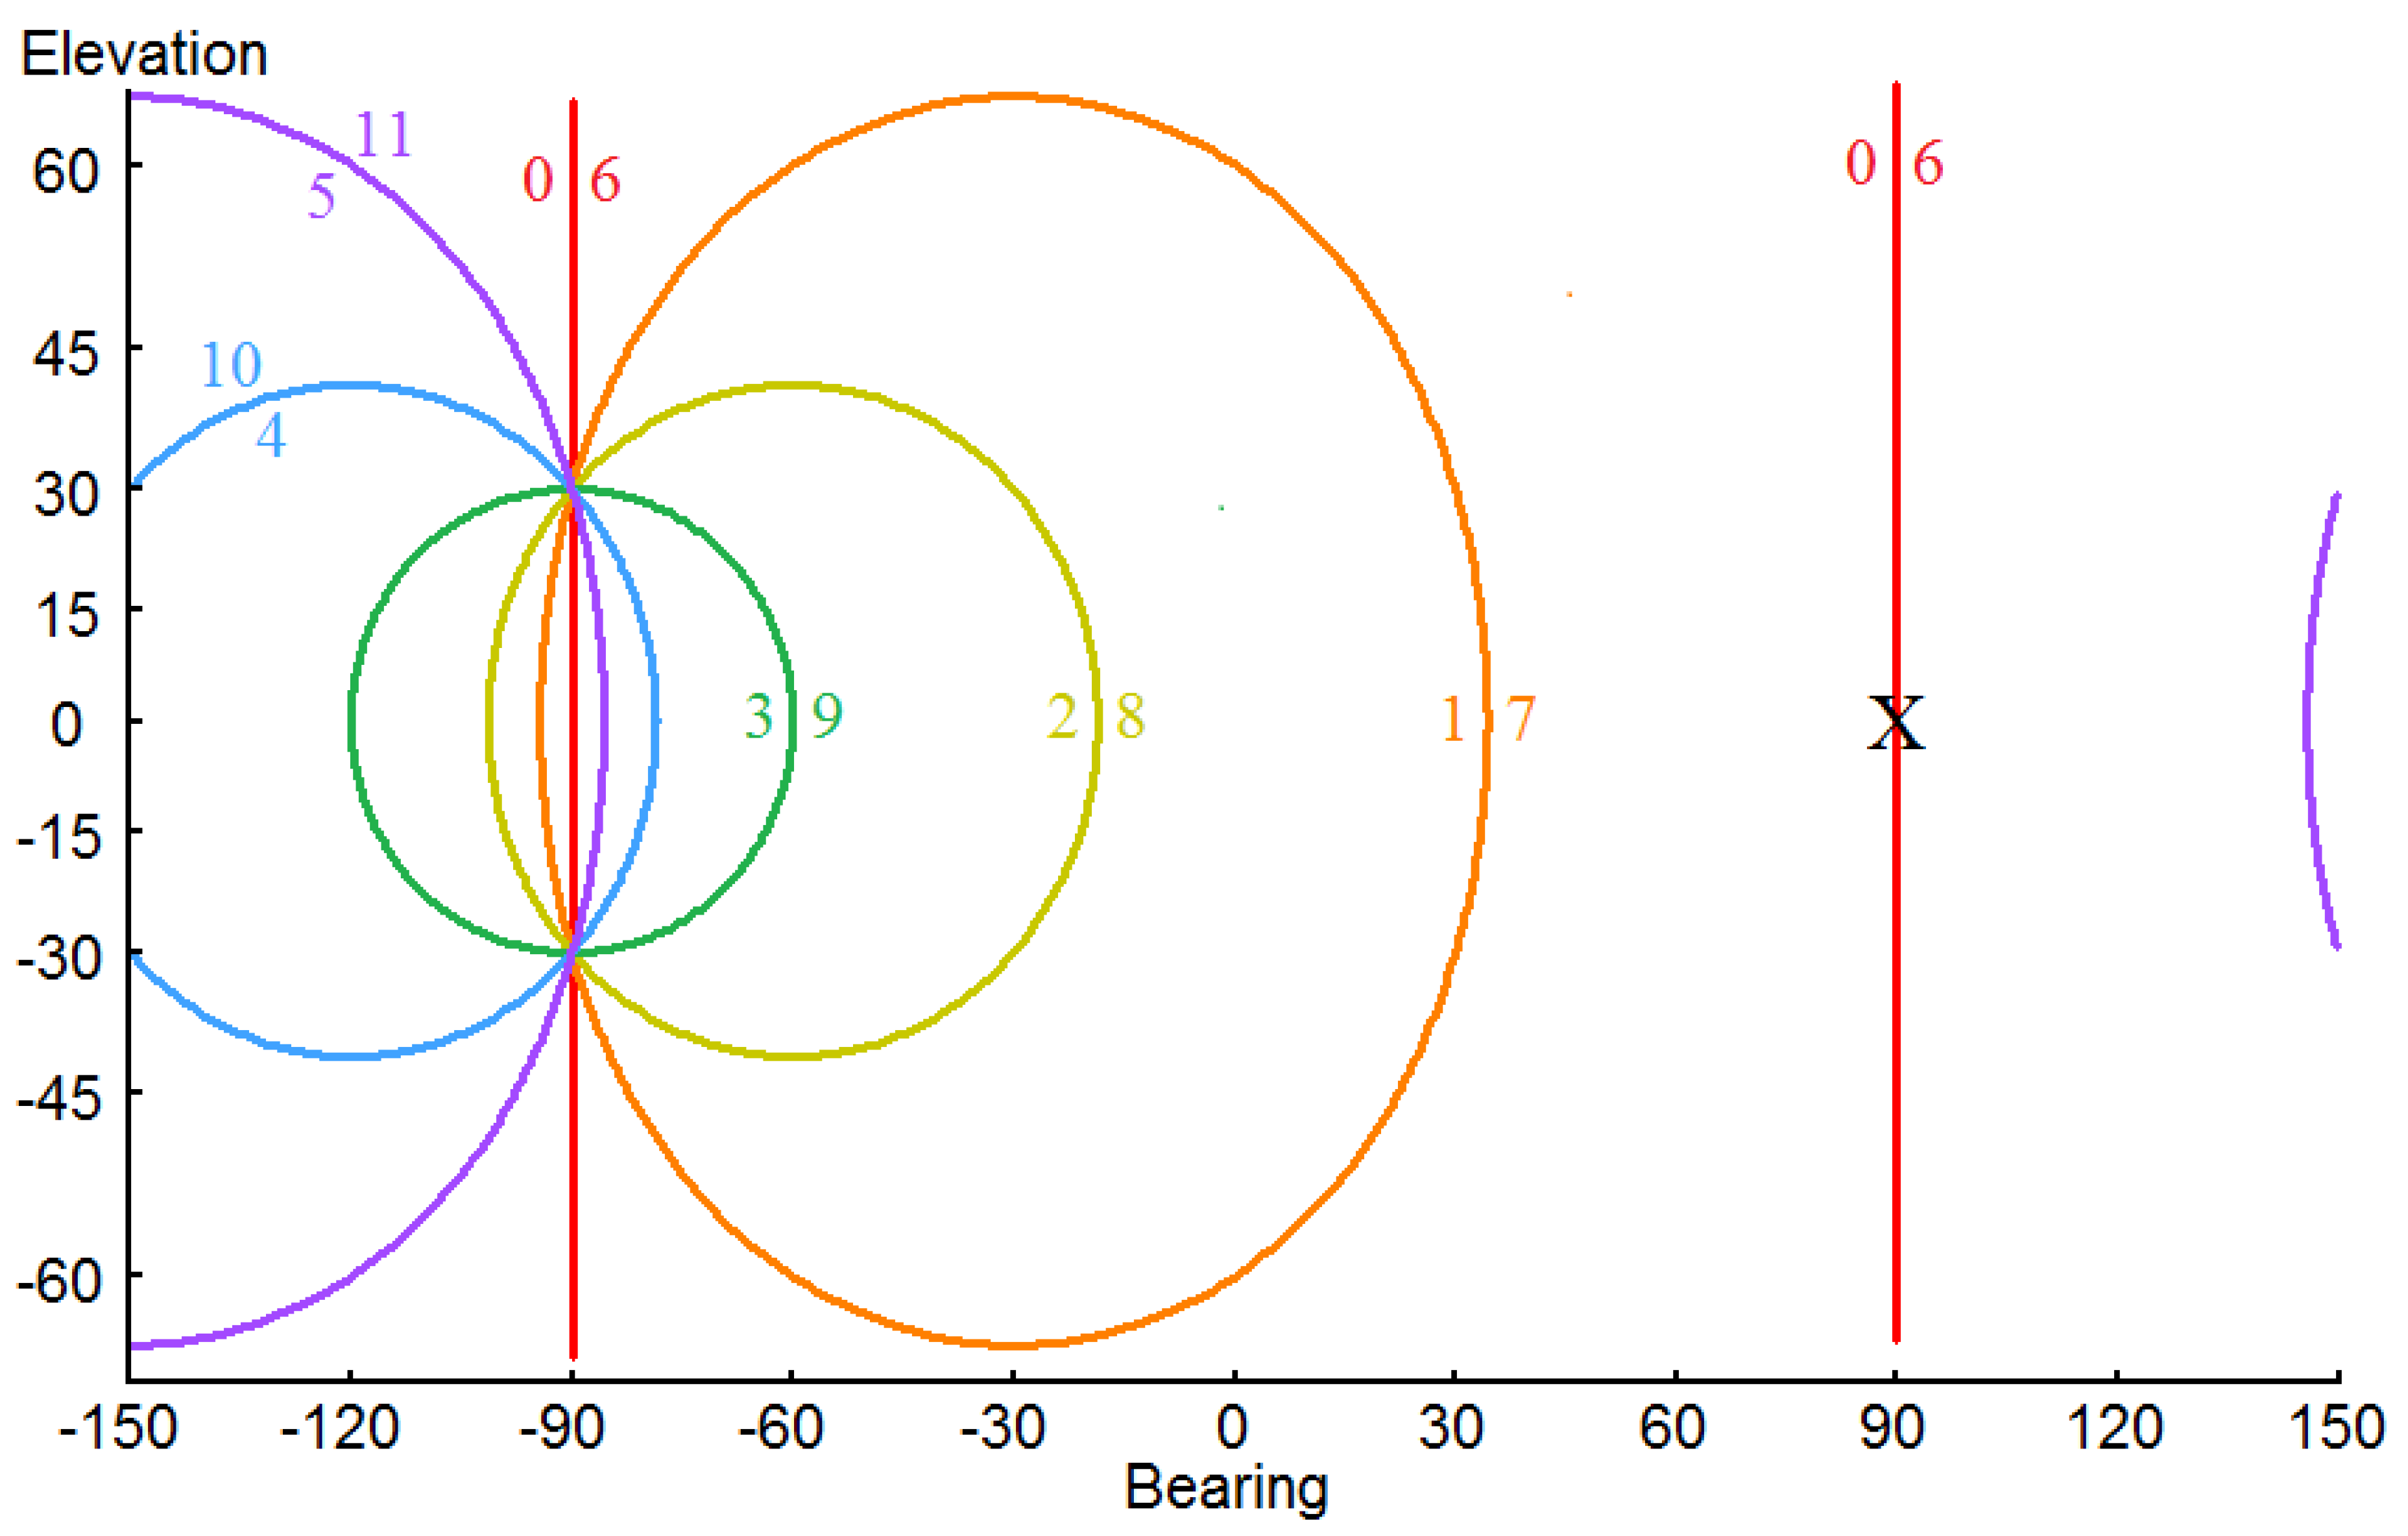
The lambda circles of colatitude generated for a complete rotation of the head for all twelve discrete orientations of the head as it turns through 360° are shown as a skeletonized acoustic image of the field of audition in Figure 3. The use of the Mercator projection is a commonly employed means of representing spherically distributed data on a plane (Tamsett [16] Appendix B). The principal advantage of this projection over others is that azimuth for all latitudes is preserved. A disadvantage is that area is increasingly exaggerated with increasing distance from the equator. Thus, latitudes as the poles are approached cannot conveniently be included. The lambda circles intersect on the bearing of −90°, i.e., the source is apparently stationary along a bearing of −90°, demonstrating that the synthetic aperture approach to source localization, in common with human audition (for low frequencies) [3,7,8,9], is subject to Wallach’s binaural illusion. In Figure 3, it is seen that the azimuthal component of the illusory location of the acoustic source is accurately determined. However, the lambda circles all pass through the horizontal axis vertically and, so, the apparent location of the source in elevation is inaccurately determined.
3.2. Simulation Experiment B
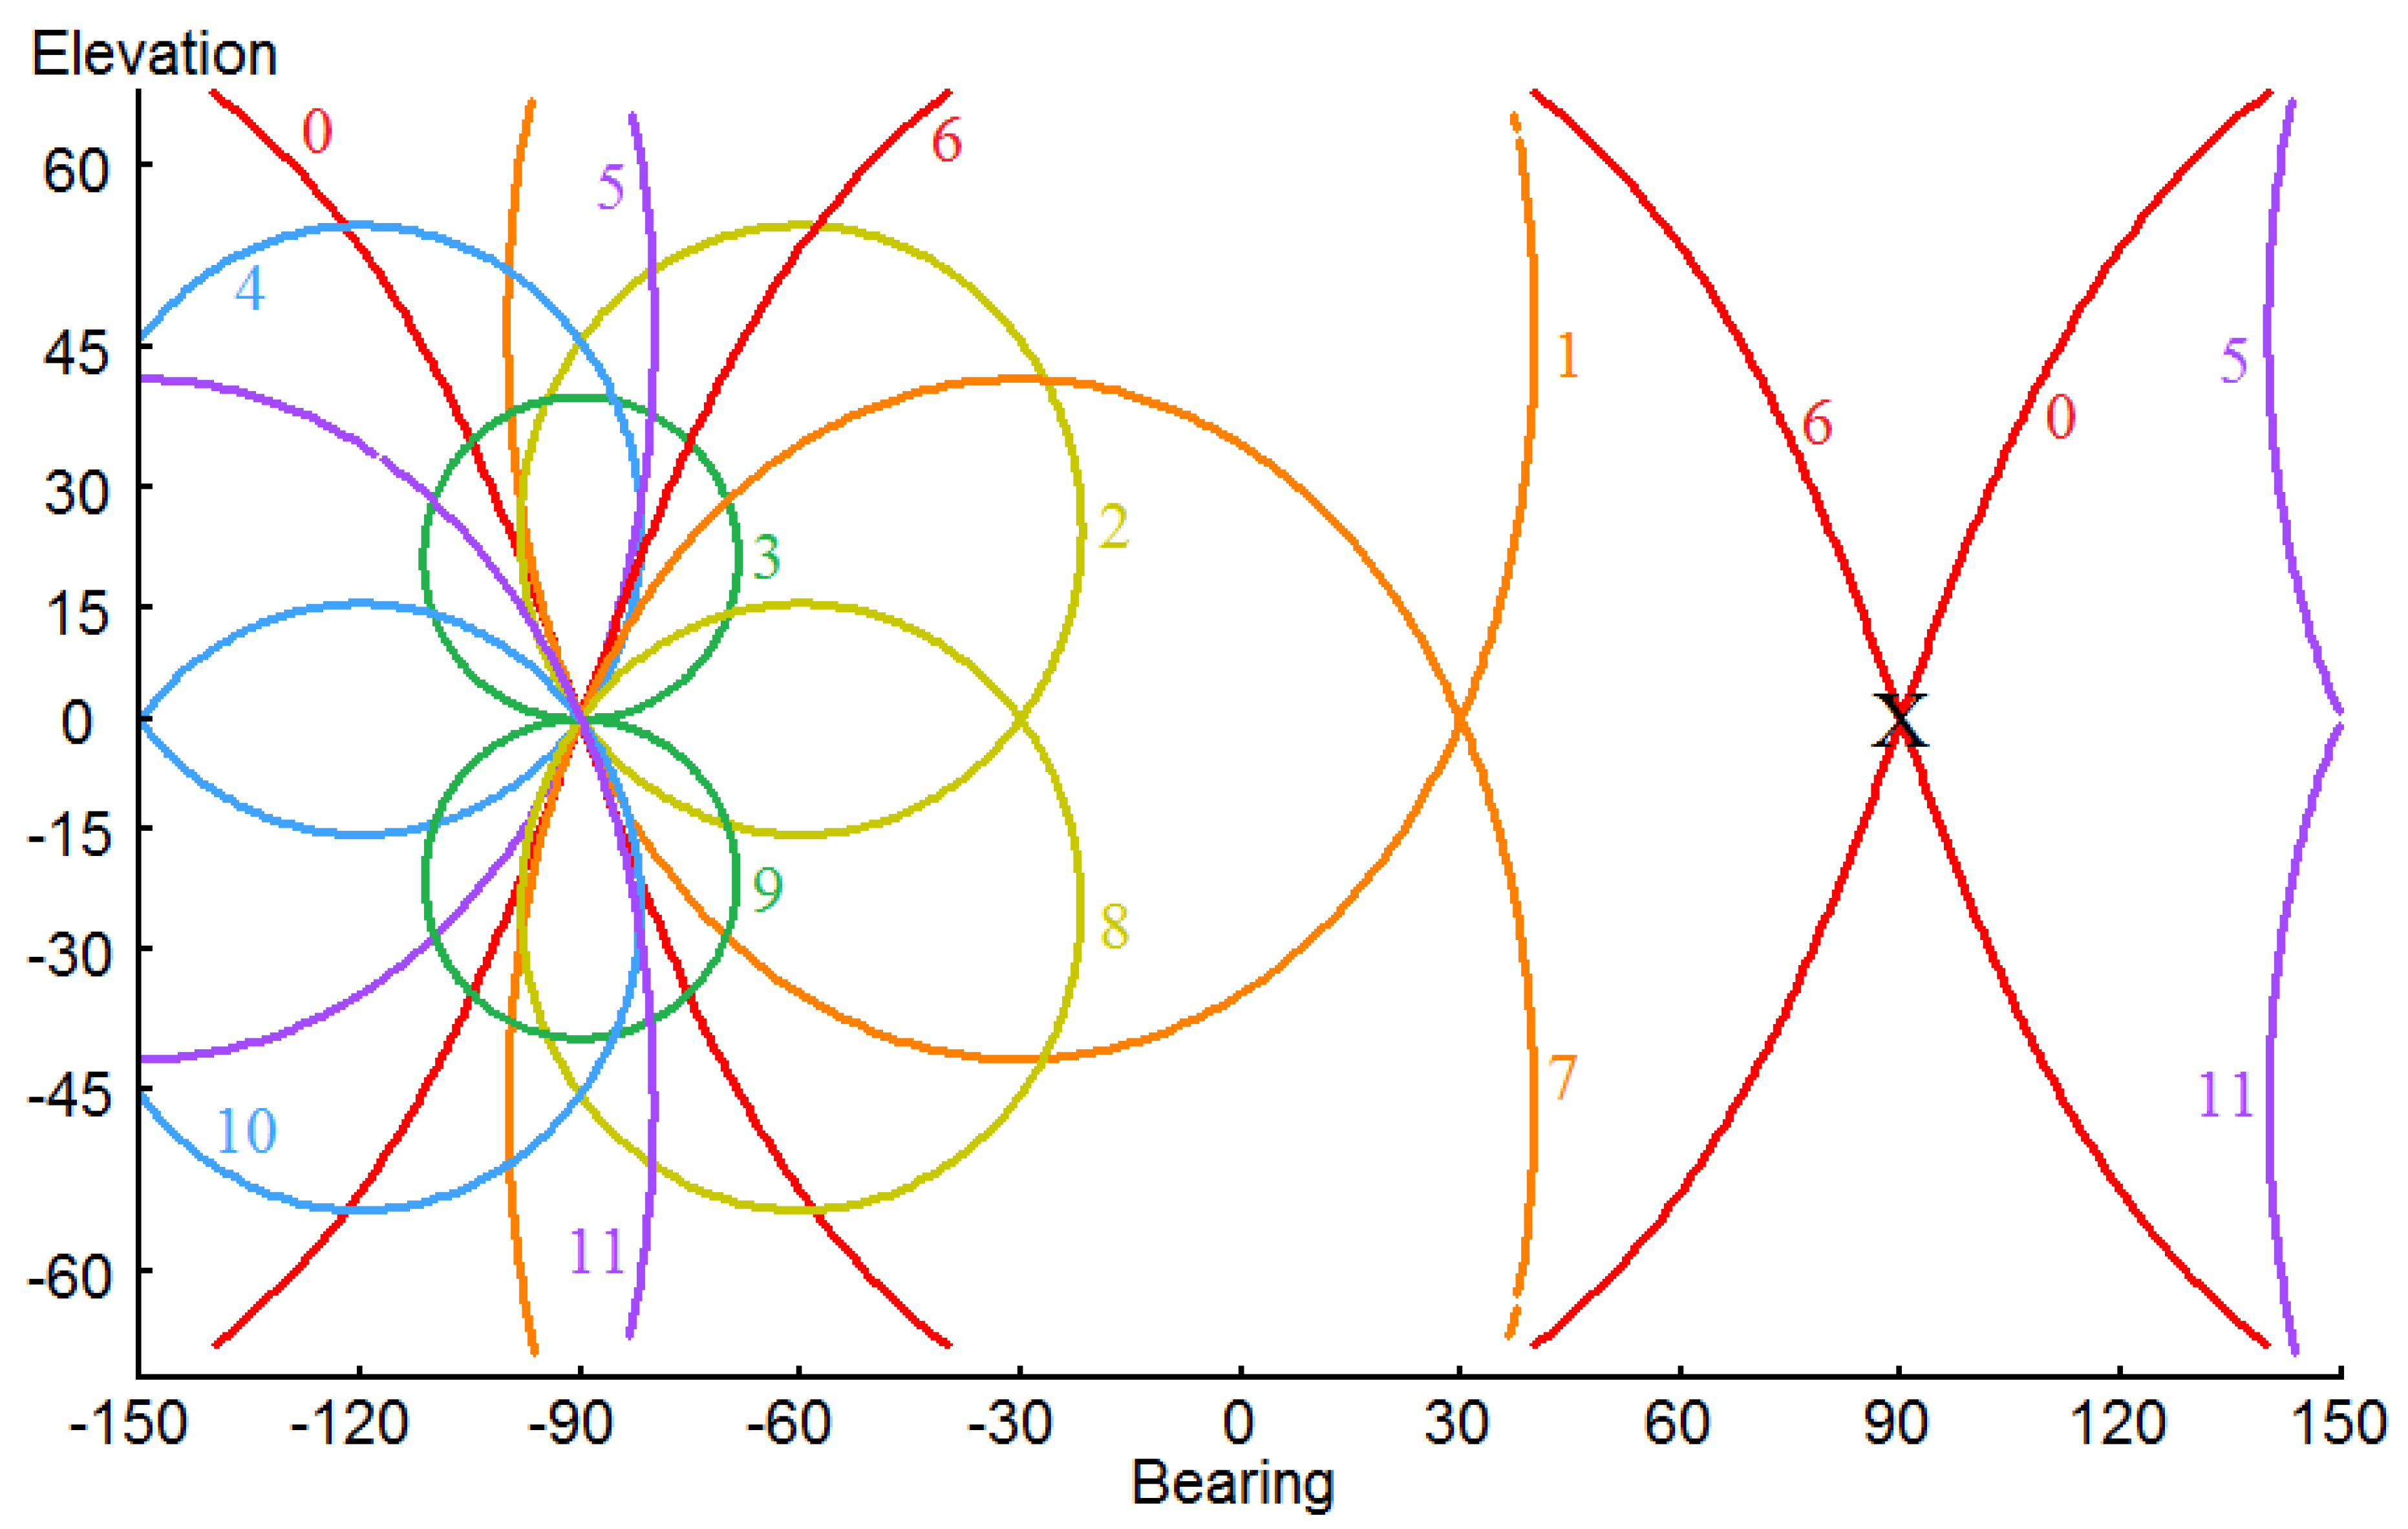
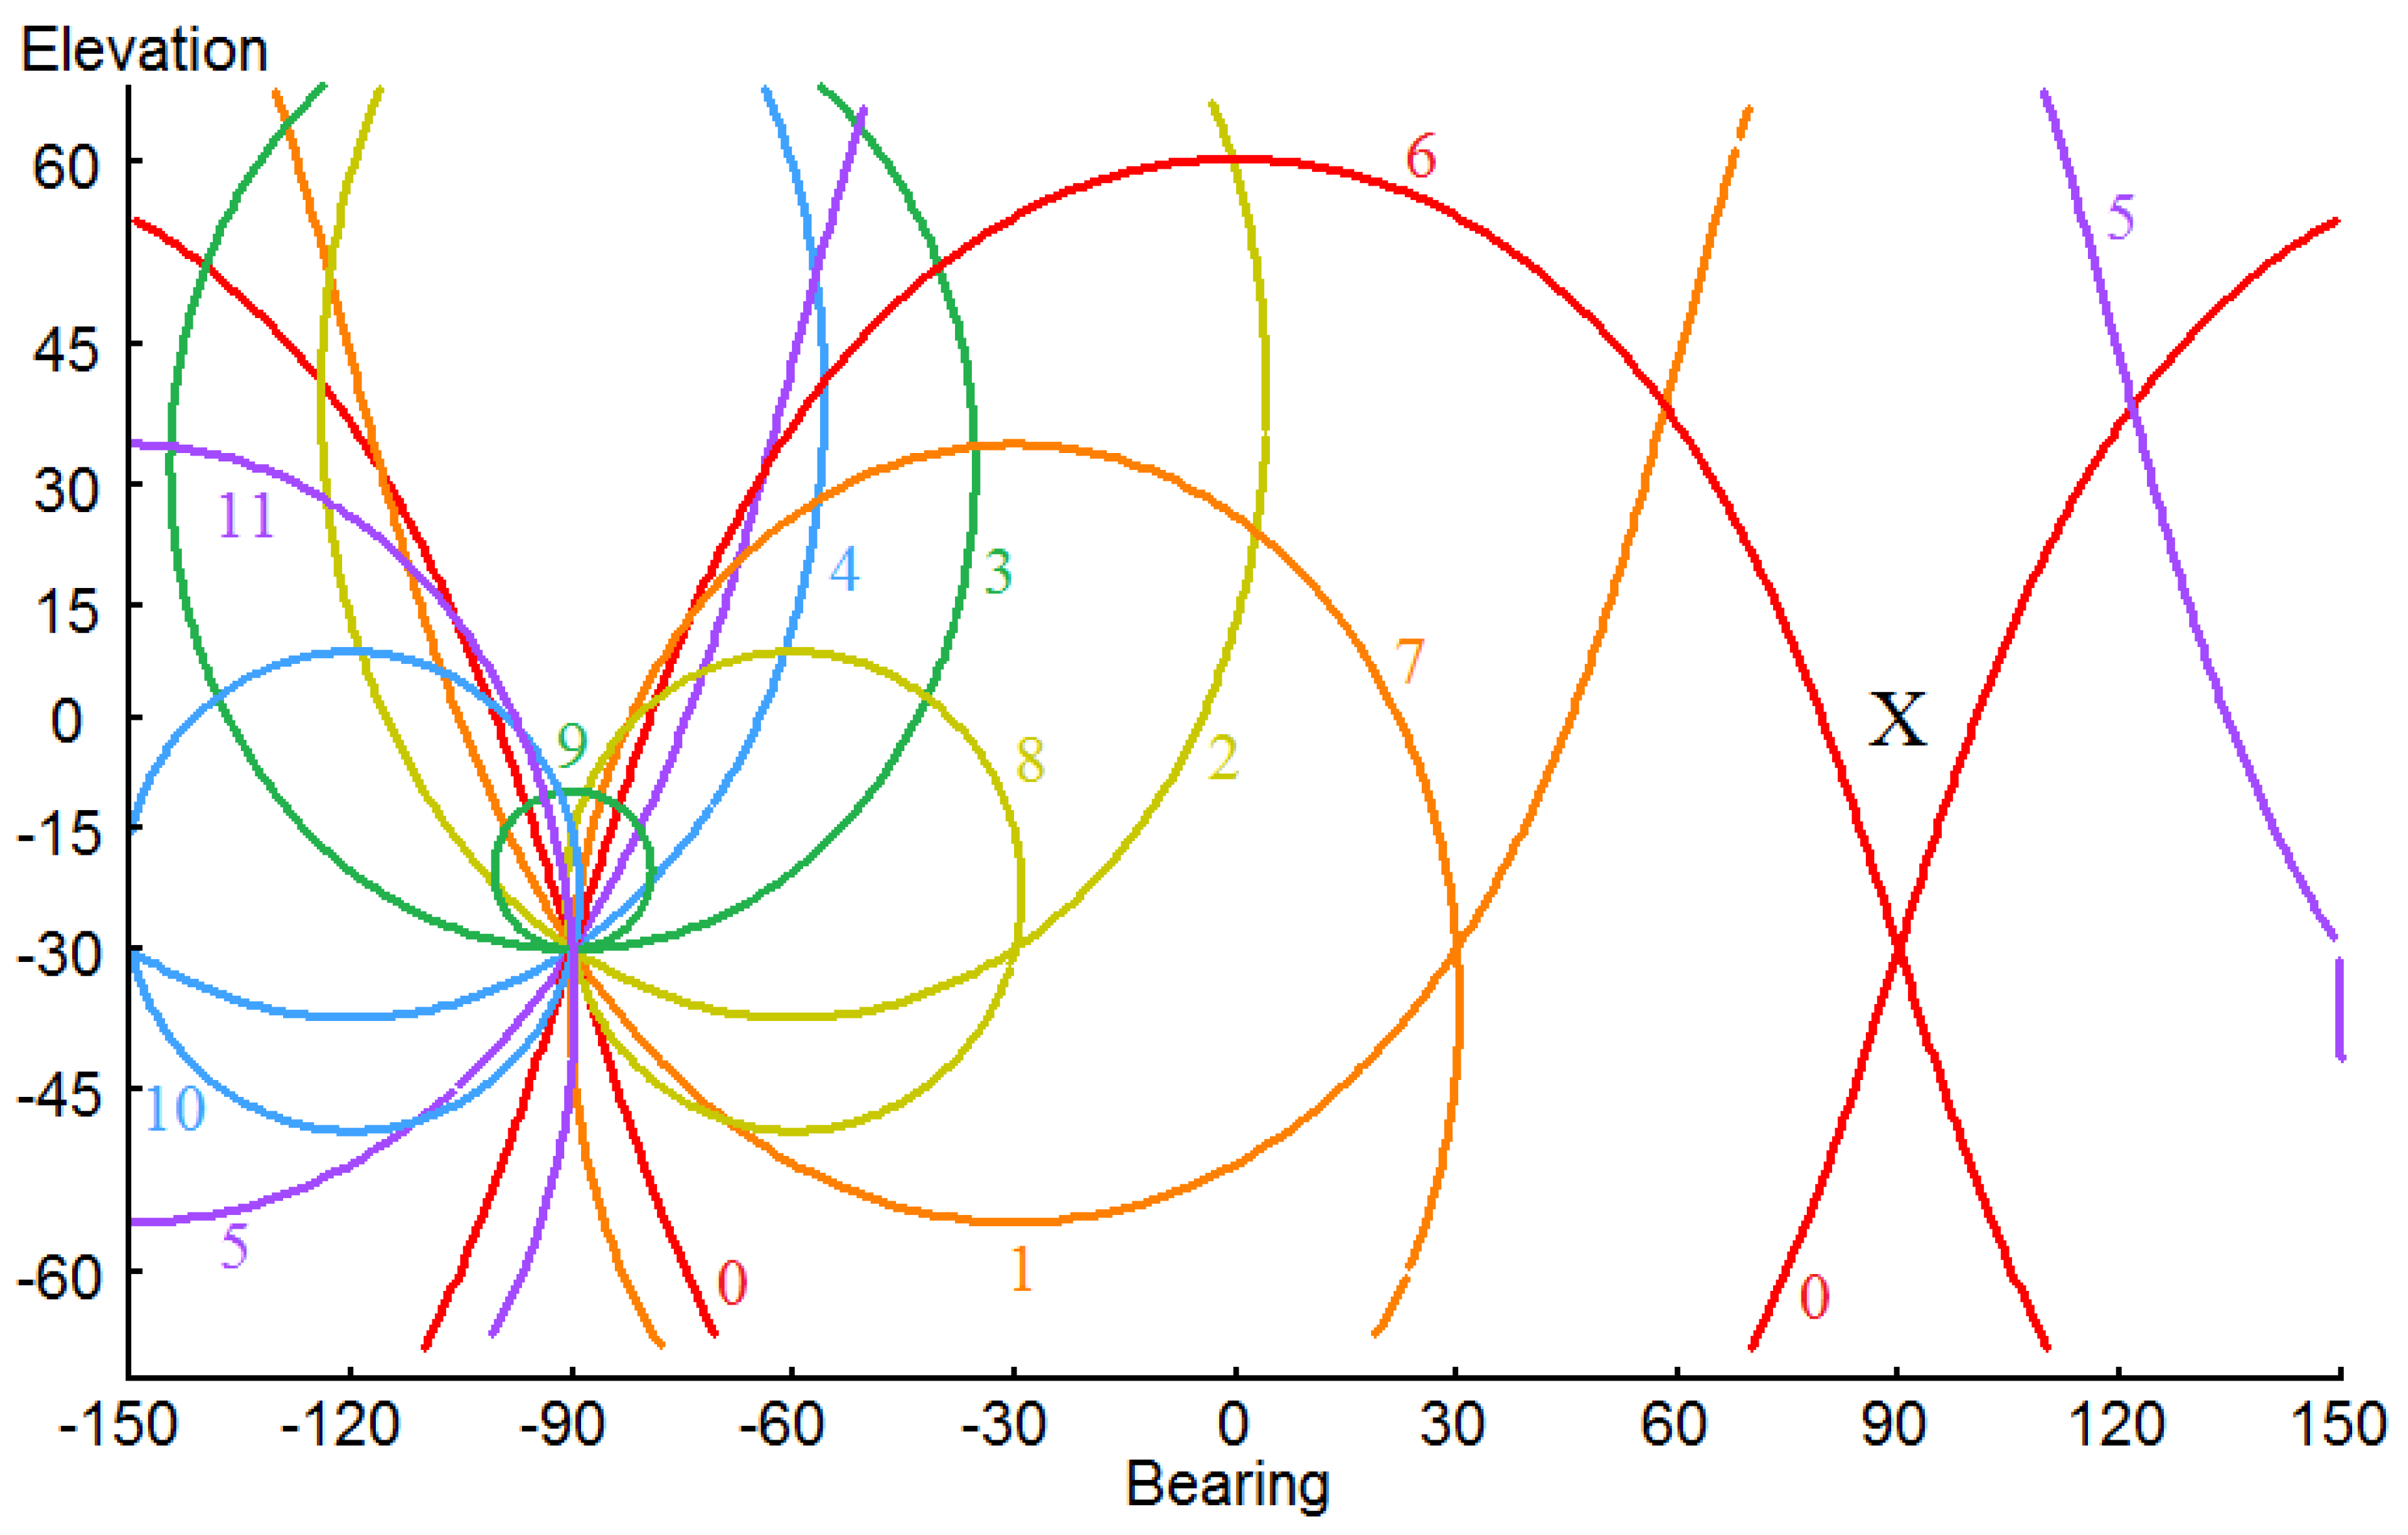
This is similar to Experiment A, except that the auditory axis is now tilted 20° downslope to the right across the head in emulation of an attribute of species of owl including the barn owl [19,20,21,22,23]. Whilst the results for Experiment A could be relatively intuitively predicted in advance of undertaking a computation to generate results, it is more difficult to predict in advance, either by hand waving assisted thinking, or by intuition, what that calculation would reveal for the Wallach illusion, as it might be experienced by a barn owl. The ensuing lambda circles for a single rotation of the head are shown in an image of the field of audition in Figure 4. It is seen that the illusion is still operative. The apparent location of the source is now accurately determined in both azimuth and elevation as compared to Experiment A, though now more accurately determined in elevation at some cost to the accuracy of the determination in azimuth. Nevertheless, a barn owl seeking to locate a mouse as prey in pitch darkness would do better guided by the information that is presented in Figure 4 than by that in Figure 3, suggesting that the tilt of the auditory axis across the head in owls might be an evolutionary adaptation for synthetic aperture computation to provide an improved acoustic direction-finding capability. However, the barn owl would be disappointed on this occasion to discover that what is hoped to be prey is actually an illusion.
3.3. Simulation Experiment C
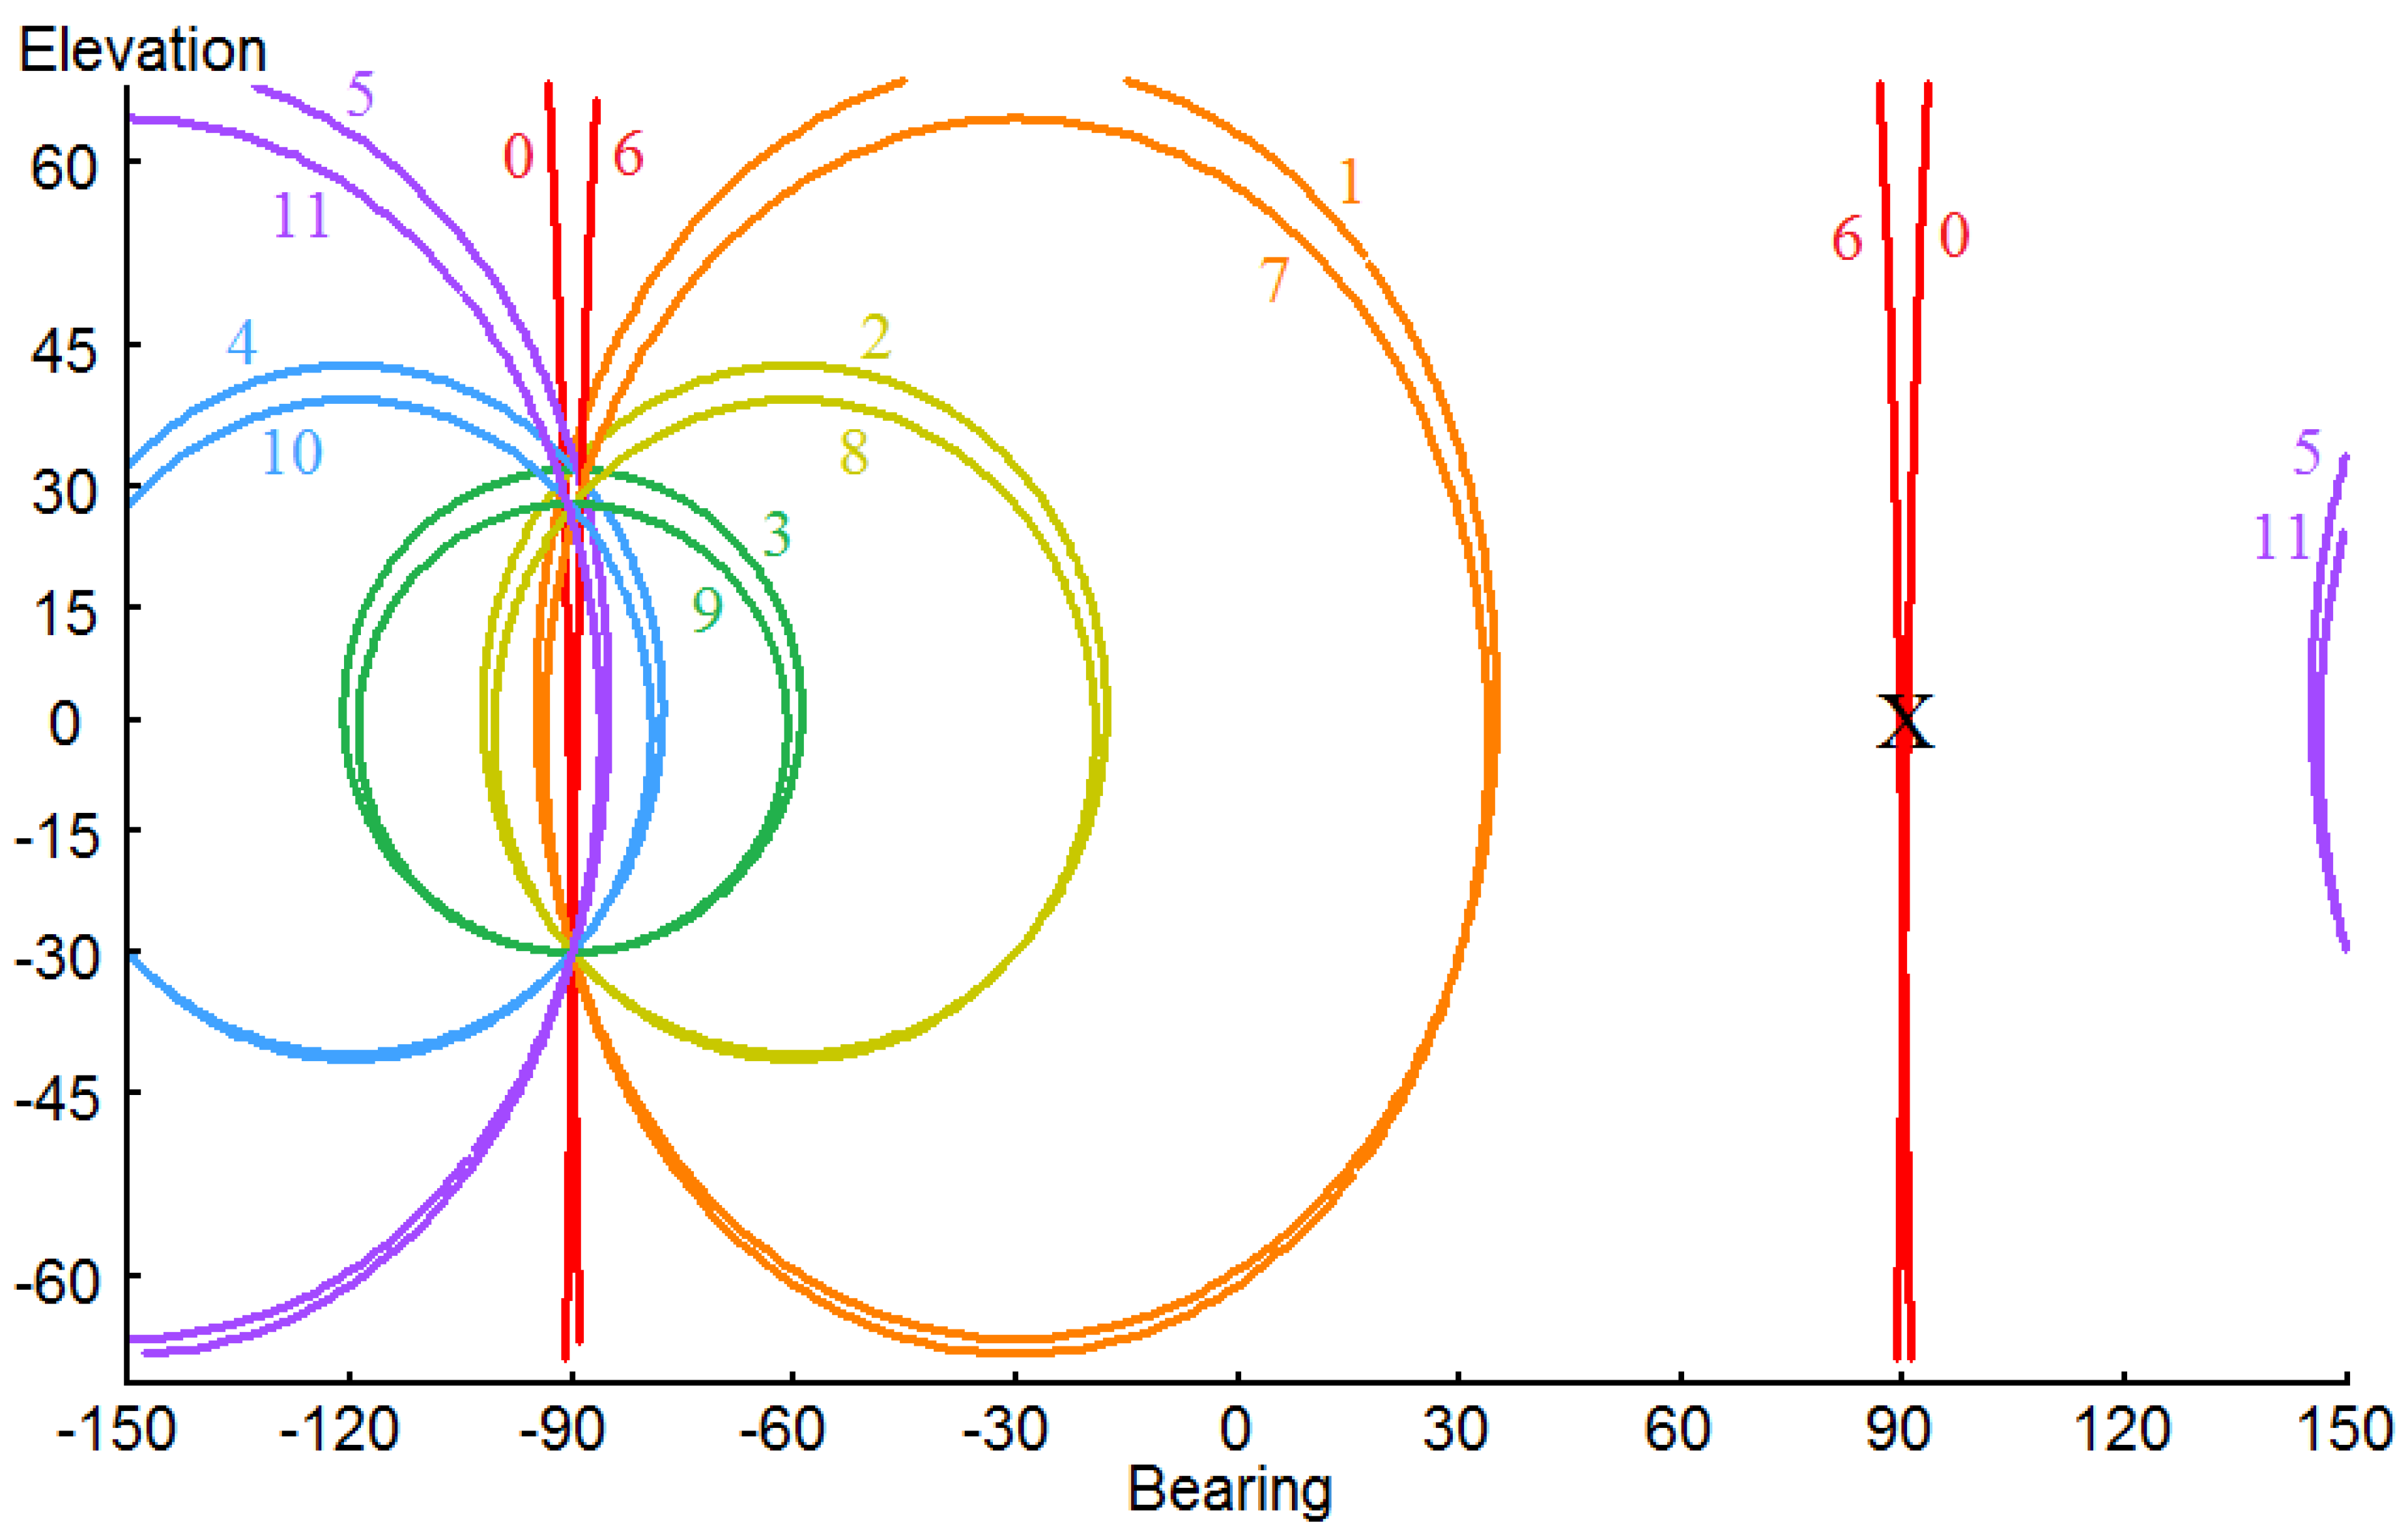
We return to considering the results for a horizontal auditory axis for the next experiment; however, the source is now held at an elevation of −30° (i.e., below the horizon) as it turns twice around the head for a single rotation of the binaural antenna. Figure 5 shows the results displayed as an acoustic image.
The lambda circles of colatitude generated for a complete rotation of the head intersect on the bearing of −90° at two elevations: +30° and −30° from the horizontal i.e., the source is apparently stationary at two locations along a bearing of −90°. What sense a real listener might make of such a solution is difficult to predict. Would a real listener recognize that there are two solutions? That seems unlikely. Or would the two solutions be effectively vector summed and the listener locate the source to be apparently at zero elevation? That would seem more likely. I will return to this for further comment in a later section of the paper (Experiment E).
The two solutions disposed symmetrically with respect to the horizontal axis arise from the rotation of the head sweeping the auditory axis within the confines of a single plane, with this being the horizontal plane.
3.4. Simulation Experiment D
We now repeat the last experiment in which the elevation of the source is −30°, except that the auditory axis is now tilted 20° downslope to the right across the head in emulation of the barn owl. Figure 6 displays the results.
Note that the unresolved above–below axis confusion apparent in the previous Experiment (C) for a horizontal auditory axis is now satisfactorily fully resolved for the tilted auditory axis. This again indicates an evolutionary advantage in having an inclined auditory axis, rather than a horizontal one for localizing a sound source, though, as before, the advantage on this occasion is illusory rather than real. The unique solution in this experiment arises from the rotation of the head sweeping a tilted auditory axis through space, such that the plane within which the auditory axis lays continuous changes, in contrast to the situation for Experiment C.
3.5. Simulation Experiment E
There is considerable discussion in the literature about the front–back confusion often experienced by listeners in situations where their heads are immobile while listening to a sound. A front–back confusion is readily resolved by head movement while listening to a sound in real subjects, and in the result of a synthetic aperture calculation as the head is turned while listening to a sound [16]. An above–below horizon confusion is not so often mentioned. Wallach (1940) [2] was aware that such a confusion might be expected, but he did not report any observation of the phenomenon amongst his subjects in the presentation of his results. A question worthy of investigation in this regard is what might be the effect of an almost indiscernibly small head movement on direction finding performance? In Experiment E, we repeat Experiment D, but, for a fixed tilt of the auditory axis, or roll of the head, of just 1°. Figure 7 shows the result.
The result is perhaps surprising. The apparent localization solution below the horizontal is, as expected, well and accurately determined. However, the apparent solution that was located 30° above the horizon in Experiment C (Figure 5) is now spread out and diffused over a fuzzy circle disposed across a relatively large area approximately 10° across in both azimuth and elevation. Thus, a very small, possibly indiscernible, roll of the head is sufficient in yielding a unique solution rather than an unresolved above–below horizon confusion of two apparently equally valid solutions that are generated for an auditory axis perfectly constrained within the horizontal plane. This observation might contribute to an explanation of why humans so infrequently experience an above/below horizon confusion, despite the absence of a built-in hardware tilt of the auditory axis across the head through the ears. Small deviations from a zero angular roll of the head, even if indiscernible to the subject, might nevertheless be sufficient to enable our direction-finding capability to be informed by a synthetic aperture calculation process. Indeed, Wallach (1940) [2] himself hinted at such an explanation (the middle of his page 343). This result strongly indicates that in experiments on human audition involving real people it should not be regarded as sufficient to instruct subjects ‘to keep their heads as still as possible’ or to attempt to immobilize their heads by having subjects ‘rest their chins on a chinrest’. A synthetic aperture calculation acting upon even very small movements of the head may invalidate inferences based on an assumption of complete head immobility. Experiments involving real human subjects for which head immobility is a requirement should ensure the immobility of the head despite the logistical difficulties that this might involve, supported by accurate measurement of head movement for quality control. These difficulties are circumvented through use of virtual sources perceived via headphones that were attached to the head. Though we might perhaps expect that the decoupling of what is heard, from vestibular and visual cues, to lead to a certain amount of confusion in subjects not familiar with wearing headphones. For example, it is common to turn the head towards a sound of interest to place the source of sound on the listener’s auditory median plane (a sensorimotor response). An attempt to do this when listening to virtual sound sources through headphones will not succeed. In practice, it seems likely that we treat real and virtual sources differently after a certain amount of becoming familiar with virtual sources that are experienced through headphones.
4. Discussion
It is surely of interest that a synthetic aperture calculation-based approach to acoustic source localization experiences the very same binaural illusion that humans do when subjected to Wallach’s ingenious experiment for a low frequency [3,7,8,9] acoustic source. The auditory illusion in humans is an example of perception illusion described and discussed by Gregory [24].
A robot deploying an array of 2-D microphones as a listening antenna, even for low frequency acoustic signal, would most probably not experience the illusion and be more likely to correctly direction-find the source on its passage around the head as the head and source turn in much the same way that humans often can for high frequency acoustic signal [3].
The influence of a tilted auditory axis on the localization of acoustic sources is interesting. It is thought its utility might be largely one based on a spectral effect e.g., [20]. However, there might be utility for performing a synthetic aperture calculation. For a head with a tilted or sloping auditory axis, a rotation of the head about a horizontal axis through the head (a nod, or pitch inducing action), as well as a rotation about a vertical axis (a head shake, or yaw inducing action) is capable of being exploited for acoustic source localization. Wallach [2], reporting on his experiments, stated that nodding (or pitching) in human subjects was ineffective for localizing sound sources. A synthetic aperture calculation for a nodding head having a horizontal auditory axis will also not disambiguate acoustic source location. However, a nodding head having a tilted auditory axis (or a superimposed head roll) would be able to disambiguate acoustic source location through use of a synthetic aperture calculation. Thus, the evolutionary advantage of the sloping or tilted auditory axis of a barn owl might include the possibility that a synthetic aperture calculation during a nodding action of the head enables acoustic localization in elevation in the field of audition as well as laterally.
The human visual system makes extensive use of images and image processing in performing astounding feats of perception and interpretation of an environment that is irradiated by visible light. Whilst we do not, at least consciously, visualize sound in the way we do objects that are irradiated by visible light, it is most likely that bats and dolphins do so perceive their acoustically informed view of the world. After all, bats living in a light deprived environment may have relatively straightforwardly redeployed for audition a biological imaging system that humans are familiar with for vision. It might even be possible that bats perceive their acoustically informed world in as much colour as we do our visual perception of the world e.g., [25,26].
The results that were generated by Wallach’s (1940) [2] experiment exploring an auditory illusion experienced by human subjects, coupled with the demonstration presented here that a synthetic aperture calculation yields acoustic source localization that is subject to the same illusion that human subjects’ experience, constitutes evidence to suggest that humans might employ synthetic aperture calculation for acoustic source localization, at least for low frequency (<~1500 Hz) [3,7,8,9] acoustic signal. In this way, not only do humans compensate for head rotation (and for that matter translation) to maintain their auditory perception of their acoustic environment to be at rest relative to the real world [4], but they might also be able to exploit the information gained through head movement for disambiguating the directions to acoustic sources. Nevertheless, whether or not humans perform synthetic aperture calculation, the process might be a powerful tool to deploy for robotic binaural localization in emulation of human acoustic perception. The movement of the head in response to a sound needing investigation is often in humans an innate motor command. The feedback control loop between information that is gleaned by the auditory system as the head turns and continuing motor commands is likely to be a sophisticated development in humans. A simplified control system could be implemented in the early stages of incorporating synthetic aperture audition in a binaural robot.
5. Summary
In a series of five simulation experiments, it is shown that an auditory illusion predicted and demonstrated by Wallach (1940) [2] occurring in human subjects (for low frequency acoustic signal) [3,7,8,9] is also seen in synthetic aperture images of the field of audition that is generated for a binaural auditory system as the head turns to localize an acoustic source. The synthetic aperture calculation made as the head turns provides a binaural auditory system with the acoustic source direction finding capability of a 2-D array of listening sensors. These experiments constitute evidence that the human auditory system might deploy synthetic aperture calculation as the head turns while listening to low frequency sound [3,7,8,9] for the purpose of acoustic source localization.
It is shown that an inclination (tilt) of the auditory axis across the head in emulation of a species of owl eliminates an above–below horizon non-uniqueness in solutions to localization in principle present when the auditory axis is perfectly horizontal and, furthermore, a tilted axis generally yields greater overall accuracy in both azimuth and elevation for localization solutions than a horizontal auditory axis does. Thus, a tilted auditory axis in owls may have arisen as an evolutionary advantage conveyed for acoustically locating prey in low visibility conditions through the use of synthetic aperture acoustic imaging.
It is demonstrated that, for even a very small inclination or roll of the auditory axis across the head of just 1°, such as might arise even should a subject attempt to maintain a perfectly immobile head with no lateral tilt, is sufficient for significantly contributing to differentiating between solutions that, for a perfectly horizontal auditory axis, would be non-unique.
Funding
This research received no external funding.
Institutional Review Board Statement
Not applicable.
Informed Consent Statement
Not applicable.
Data Availability Statement
The data presented in this study are available on request from the corresponding author.
Acknowledgments
I raise a Covid19 locked-in illusory pint pot of real ale in salute to the genius of Hans Wallach. I thank two anonymous reviewers for their greatly appreciated efforts helping to improve the paper.
Conflicts of Interest
The author declares there to be no conflict of interest.
References
- Wallach, H. On sound localization. J. Acoust. Soc. Am. 1939, 10, 270, 274. [Google Scholar] [CrossRef]
- Wallach, H. The role of head movement and vestibular and visual cues in sound localisation. J. Exp. Psychol. 1940, 27, 339–368. [Google Scholar] [CrossRef] [Green Version]
- Yost, W.; Pastore, M.T.; Pulling, K.R. Sound-source localization as a multisystem process: The Wallach azimuth illusion. J. Acoust. Soc. Am. 2019, 146, 382, 398. [Google Scholar] [CrossRef] [PubMed]
- Yost, W.A.; Zhong, X.; Najam, A. Judging sound rotation when listeners and sounds rotate: Sound source localization is a multisystem process. J. Acoust. Soc. Am. 2015, 138, 3293, 3310. [Google Scholar] [CrossRef] [PubMed]
- Sun, L.; Zhong, X.; Yost, W. Dynamic binaural sound source localization with interaural time difference cues: Artificial listeners. J. Acoust. Soc. Am. 2015, 137, 2226. [Google Scholar] [CrossRef]
- Zhong, X.; Sun, L.; Yost, W. Active binaural localization of multiple sound sources. Robot. Auton. Syst. 2016, 85, 83–92. [Google Scholar] [CrossRef]
- Perrett, S.; Noble, W. The effect of head rotations on vertical plane sound localization. J. Acoust. Soc. Am. 1997, 102, 2325–2332. [Google Scholar] [CrossRef] [PubMed]
- Brughera, A.; Danai, L.; Hartmann, W.M. Human interaural time difference thresholds for sine tones: The high-frequency limit. J. Acoust. Soc. Am. 2013, 133, 2839. [Google Scholar] [CrossRef] [PubMed] [Green Version]
- Macpherson, E.A.; Middlebrooks, J.C. Listener weighting of cues for lateral angle: The duplex theory of sound localization revisited. J. Acoust. Soc. Am. 2002, 111, 2219–2236. [Google Scholar] [CrossRef] [PubMed] [Green Version]
- Wightman, F.L.; Kistler, D.J. The dominant role of low frequency interaural time differences in sound localization. J. Acoust. Soc. Am. 1992, 91, 1648–1661. [Google Scholar] [CrossRef] [PubMed]
- Shimoda, T.; Nakashima, T.; Kumon, M.; Kohzawa, R.; Mizumoto, I.; Iwai, Z. Sound localization of elevation using pinnae for auditory robots. In Robust Speech Recognition and Understanding; Grimm, M., Kroschel, K., Eds.; I-Tech: Vienna, Austria, 2007; p. 460. ISBN 987-3-90213-08-0. [Google Scholar]
- Rodemann, T.; Ince, G.; Joublin, F.; Goerick, C. Using binaural and spectral cues for azimuth and elevation localization. In Proceedings of the IEEE/RSJ International Conference on Intelligent Robots and Systems, Nice, France, 22–26 September 2008; pp. 2185–2190. [Google Scholar]
- Mironovs, M.; Lee, H. Vertical amplitude panning for various types of sound sources. In Interactive Audio Systems Symposium; University of York: York, UK, 2016; pp. 1–5. [Google Scholar]
- Kohnen, M.; Bomhardt, J.; Fels, J.; Vortander, M. Just noticeable notch smoothing of head-related transfer functions. In Proceedings of the Fortschritte der Akustik—DAGA 2018: 44. Jahrestagung fur Akustik, Munich, Germany, 19–22 March 2018. [Google Scholar]
- Raine Clarke, J. The Perceptual Contribution of Pinna Related Transfer Function Attributes in the Median Plane. Master’s Thesis, University of Huddersfield, Huddersfield, UK, 2019. [Google Scholar]
- Tamsett, D. Synthetic aperture computation as the head is turned in binaural direction finding. Robotics 2017, 6, 3. [Google Scholar] [CrossRef] [Green Version]
- Tamsett, D. Binaural range finding from synthetic aperture computation as the head is turned. Robotics 2017, 6, 10. [Google Scholar] [CrossRef] [Green Version]
- Lurton, X. Seafloor-mapping sonar systems and Sub-bottom investigations. In An Introduction to Underwater Acoustics: Principles and Applications, 2nd ed.; Springer: Berlin/Heidelberg, Germany, 2010; pp. 75–114. [Google Scholar]
- Knudsen, E.I.; Konishi, M. Mechanisms of sound localization in the barn owl (Tyto alba). J. Comp. Physiol. A 1979, 133, 13–21. [Google Scholar] [CrossRef]
- Knudsen, E.I. The hearing of the barn owl. Sci. Am. 1981, 245, 113–125. [Google Scholar] [CrossRef]
- Bala, A.D.S.; Spitzer, M.W.; Takahashi, T.T. Prediction of auditory spatial acuity from neural images of the owl’s auditory space map. Nature 2003, 424, 771–774. [Google Scholar] [CrossRef] [PubMed]
- Martin, G.R. The Sensory Ecology of Birds, 1st ed.; Oxford University Press: Oxford, UK, 2017; p. 296. [Google Scholar]
- Krings, M.; Rosskamp, L.; Wagner, H. Development of ear asymmetry in the American barn owl (Tyto furcate pratincola). Zoology 2018, 126, 82–88. [Google Scholar] [CrossRef] [PubMed]
- Gregory, R. Knowledge in perception and illusion. Phil. Trans. R. Soc. Lond. B 1997, 352, 1121–1128. [Google Scholar] [CrossRef] [PubMed]
- Dawkins, R. Chapter 2—Good design. In The Blind Watchmaker; Penguin Books: London, UK, 1986. [Google Scholar]
- Tamsett, D.; McIlvenny, J.; Watts, A. Colour sonar: Multi-frequency sidescan sonar images of the seabed in the Inner Sound of the Pentland Firth, Scotland. J. Mar. Sci. Eng. 2016, 4, 26. [Google Scholar] [CrossRef] [Green Version]
Figure 1.
Top/plan view schematic illustrating simulation experiments to explore Wallach’s (1940) [2] binaural illusion. A head with a binaural antenna at the centre of the circle rotates anti-clockwise about a vertical axis through the auditory centre. A source of sound rotates around the circumference of the circle in the same direction through two revolutions in the time taken for the antenna to rotate through one. The directions the binaural antenna faces, and to the acoustic source, are initialized on the bearing of 90°. The acoustic source is perceived to be at rest on a bearing of −90°.

Figure 2.
Experiment A. The figure corresponds to the upper half of Table 2 and to Figure 3 (0–5) for an anti-clockwise half rotation of the head, and a full rotation around the head by an acoustic source. It shows the orientations of the head, the directions to the acoustic source, and the lambda circles of colatitude (labelled 0–5), which, projected onto a horizontal plane, appear as straight lines for Experiment A. The positions of the left and right ears, and the acoustic source, are labeled L, R, and S, respectively. The azimuthal directions of the source relative to the directions the head is facing are labeled. On the lowest figure the lambda circles for the six positions of the head are shown together.

Figure 3.
Experiment A: a skeletonized synthetic aperture image of the field of audition in Mercator projection. The acoustic source has zero elevation ( = 0°) and the auditory axis is horizontal ( = 0°). The initial bearings the head faces, and to the source, are 90° (labelled X). Thereafter, for every 30° anti-clockwise rotation of the head, the source rotates around the head through 60°.

Figure 4.
Experiment B: a skeletonized synthetic aperture image of the field of audition in Mercator projection. As in experiment A the acoustic source has zero elevation ( = 0°), however the auditory axis is now tilted downslope across the head to the right, in emulation of the barn owl. The initial bearings the head faces, and to the source, are 90° (labelled X).

Figure 5.
Experiment C: a skeletonized synthetic aperture image of the field of audition in Mercator projection. The acoustic source is below the horizontal at an elevation () of −30°, and the auditory axis is horizontal (). The initial bearings the head faces, and to the source, are 90° (labelled X).

Figure 6.
Experiment D: a skeletonized synthetic aperture image of the field of audition in Mercator projection. As in experiment C the acoustic source has an elevation , but the auditory axis is now tilted downslope to the right across the head. The initial bearings the head faces, and to the source, are 90° (labelled X).

Figure 7.
Experiment E: a skeletonized synthetic aperture image of the field of audition in Mercator projection. The acoustic source is below the horizontal at an elevation of , and the auditory axis has a roll of just downslope to the right across the head. The initial bearings the head faces, and to the source, are 90° (labelled X).

Table 1.
Five simulation experiments are reported and discussed (labelled A to E). Elevation of the source φ is negative below the horizon (positive above). The tilt angle i of the auditory axis is positive for inclination downslope across the head to the right.
Table 1.
Five simulation experiments are reported and discussed (labelled A to E). Elevation of the source φ is negative below the horizon (positive above). The tilt angle i of the auditory axis is positive for inclination downslope across the head to the right.
| Experiment | Acoustic Source Elevation φ | Auditory Axis Tilt i | Acoustic Image |
|---|---|---|---|
| A | 0° | 0° | Figure 2 and Figure 3 |
| B | 0° | 20° | Figure 4 |
| C | −30° | 0° | Figure 5 |
| D | −30° | 20° | Figure 6 |
| E | −30° | 1° | Figure 7 |
Publisher’s Note: MDPI stays neutral with regard to jurisdictional claims in published maps and institutional affiliations. |
© 2021 by the author. Licensee MDPI, Basel, Switzerland. This article is an open access article distributed under the terms and conditions of the Creative Commons Attribution (CC BY) license (https://creativecommons.org/licenses/by/4.0/).
Share and Cite
MDPI and ACS Style
Tamsett, D. The Binaural Illusion of Wallach (1940) Apparent in Synthetic Aperture Images of the Field of Audition Generated as the Head Turns. Acoustics 2021, 3, 297-308. https://0-doi-org.brum.beds.ac.uk/10.3390/acoustics3020020
AMA Style
Tamsett D. The Binaural Illusion of Wallach (1940) Apparent in Synthetic Aperture Images of the Field of Audition Generated as the Head Turns. Acoustics. 2021; 3(2):297-308. https://0-doi-org.brum.beds.ac.uk/10.3390/acoustics3020020
Chicago/Turabian StyleTamsett, Duncan. 2021. "The Binaural Illusion of Wallach (1940) Apparent in Synthetic Aperture Images of the Field of Audition Generated as the Head Turns" Acoustics 3, no. 2: 297-308. https://0-doi-org.brum.beds.ac.uk/10.3390/acoustics3020020