
Factors Affecting the Dependency of Shear Strain of LRB and SHDR: Experimental Study

Earthquake Engineering Research & Test Center, Guangzhou University, Guangzhou 510405, China
*
Author to whom correspondence should be addressed.
†
These authors comtributed equally to this work.
Actuators 2021, 10(5), 98; https://0-doi-org.brum.beds.ac.uk/10.3390/act10050098
Submission received: 23 March 2021
/
Revised: 25 April 2021
/
Accepted: 27 April 2021
/
Published: 7 May 2021
(This article belongs to the Special Issue Vibration Control and Structure Health Monitoring)
Abstract
:In this research we conducted a sensitivity experimental study where we explored the dependency of the shear strain on the seismic properties of bearings, namely lead rubber bearing (LRB) and super high damping rubber bearing (SHDR). The factors studied were vertical pressure, temperature, shear modulus of the inner rubber (G value), loading frequency, and loading sequence. Six specimens were adopted, i.e., three LRBs and three SHDR bearings. A series of test plans were designed. The seismic characteristics of the bearings were captured through a cyclic loading test, which included post-yield stiffness, characteristic strength, area of a single cycle of the hysteretic loop, equivalent stiffness, and equivalent damping ratio. A whole analysis of variances was then conducted. At the same time, to explore certain phenomena caused by the factors, an extended discussion was carried out. Test results showed that the temperature is the most dominant feature, whereas the G value is the least contributing factor, with the effect of the loading frequency and the loading sequence found between these two. The increment of the post-yielded stiffness for LRB from 100% to 25% is a significant reduction from a low temperature to high one. The slope of the characteristic strength versus the shear strain for LRB under high temperature is larger than the one under low temperature.
1. Introduction
By lengthening the natural period of an isolation structure and dissipating the earthquake energy, the earthquake action of the isolation structure can be reduced considerably [1]. At present, this innovative technology is used widely in buildings and bridges, and it has successfully withstood many real earthquakes [2,3]. Elastomeric bearings are mostly applied in this technology, which includes linear natural rubber bearing (LNR), lead rubber bearing (LRB), elastic sliding bearing (ESB), and high damping rubber bearing (HDR). In China, LNR and LRB are most extensively used, followed by ESB, and lastly, HDR. There is little damping for LNR, which is a bearing constructed of alternating elastomeric layers bonded to intermediate steel plates; here, the elastomeric rubber is natural. When lead is poured into the central hole of LNR, LNR becomes LRB. There is a certain yielded strength for lead; when lateral shear displacements occur, it is easy for lead to yield, and this provides the hysteresis dissipating function. ESB is made up of two parts, namely one natural bearing and one pair of sliding friction plates; the former provides a restorative force, and the latter provides sliding dissipating damping. In LNR, the natural rubber is added into a special material, such as active carbon; after it is vulcanized under high temperature, dissipative damping can be provided after the shear deformation of bearing takes place, where LNR becomes HDR. Depending on the amount of the damping ratio [4], there can be two kinds of bearings, HDR and super high damping rubber bearing (SHDR); the former is less than 18%, and the latter is more than 18%. Because bearings not only support a great amount of vertical force but also bear a large horizontal deformation during an earthquake, the safety of bearings is most important for the whole isolation structure. Accurately grasping the mechanical properties, especially the horizontal properties under different shear strain states, is especially significant. In the past years, investigations about the horizontal mechanical properties of elastomeric bearings by testing were carried out, and some useful numerical models were also put forward.
Roeder C. et al. in 1990 [5] conducted research on the low-temperature performance of elastomeric bearings. Nakano O. et al. in 1993 [6] explored the temperature dependency of isolation bearings. Kim D.K. et al. in 1996 [7] researched the effects of the temperature and the strain rate on the seismic performance of LNR and LRB. Liu W.G. et al. in 2002 [8] researched the dependence and durability of shear properties of LRB by tests, including vertical pressure dependence, shear strain dependence, frequency dependence, temperature dependence, and the durability of aging and creeping. Yakut A. et al. in 2002 [9] evaluated LNR performance at low temperatures. Yakut A. et al. in 2002 [10] also conducted research about parameters’ effect on the performance of LNR at low temperatures. Li H. et al. in 2006 [11] conducted experimental research about the properties of LRB at extremely low temperatures, such as −50 °C. Li L. et al. in 2009 [12] studied the temperature dependence of shear properties of LRB tested from −40 °C to 40 °C. Fuller K. et al. in 2010 [13] explored the effect of low-temperature crystallization on the mechanical properties of LNR and HDR. Shirazi A. in 2010 [14] researched the thermal degradation of the performance of LNR. Cardone D. et al. in 2011 [15] researched the effect of temperature on the horizontal properties of LNR and HDR. Shen C.Y. et al. in 2012 [16] conducted test research about the dependency of HDR. Shen C.Y. et al. in 2014 [17] investigated various dependencies of seismic performance of LNR and LRB, in which the hardness was ultra-low. Basit Q. in 2016 [18] looked into the performance of LRB in a full-size field experience bridge at low temperature. Wang J.Q. et al. in 2016 [19] conducted an experimental study of the vertical pressure dependency on the shear properties of LRB, and in 2016 the authors of [20] also investigated the same properties of HDR. Rohola R. et al. in 2019 [21] performed numerical research on the effect of the number of cores of LNR. Zhang R.J. et al. in 2020 [22] performed test research on temperature dependency and shear strain dependency of high-performance rubber bearings. Rohola R. et al. in 2020 [23] presented research on the analysis of static and dynamic stability of LNR. Javad S. et al. in 2020 [24] conducted a numerical analysis on LNR with a steel ring. Radkia, S. et al. in 2020 [25] investigated the effects of isolators on structures considering soil-structure interaction. Sheikhi, J. et al. in 2021 [26] performed a numerical analysis on LNR with steel and shape memory alloys.
In the above literatures, most of the researchers paid more attention to the temperature on the seismic performance of elastomeric bearings, especially low temperature, such as Roeder C. et al., Yakut A. et al., Li. H. et al., Li L. et al., and Basit Q. At the same time, there is literature on the dependency of elastomeric bearings. The studies by Liu W.G. et al., Shen C.Y. et al., and Kim D.K. et al. focused on temperature and shear dependency. Wang J.Q. gave more attention to vertical pressure and shear strain dependency, while Zhang R.J. focused on temperature and shear strain dependency. In most of the above literatures, the authors only focused on a single factor for one dependency, such as shear strain dependency; the only additional factor for some was the different shear strains. In a real earthquake, the vertical load supported on the bearing would be changed because of the tension and compression action caused by the horizontal seismic load. Because there are tremendous differences in the frequencies of the seismic waves during an actual earthquake, using a single loading frequency in a test might be not proper. The shear modulus of the inner rubber of the bearing might also be different and can be from 0.196 to 2.0 MPa. Moreover, in China there is a great difference in temperature between the north and the south. For the shear strain dependency, using only one single value for the vertical pressure, the loading frequency, shear modulus, and temperature condition cannot give a true reflection of the feature. Although Wang J.Q. and Zhang R.J. respectively considered the vertical pressure and the temperature effect on the shear strain dependency, other factors were neglected. In [27,28], although the integrated expression formula was given for the shear strain dependency of LRB and SHDR separately, the shear strain was only considered as a single factor; the former was based on Olies’s company test data in Japan, and the latter was based on test data from Bridgestone’s company test data in Japan. As a whole, in the above literatures, for the shear strain dependency of LRB or SHDR, only one or two factors affecting it was considered, which may be inadequate.
In this paper, the seismic performance of the shear strain dependency of LRB and SHDR is investigated comprehensively, in which various factors are considered. Three isolators of LRB and three of SHDR are made and tested. Factors including vertical pressure, loading frequency, shear modulus of inner rubber, temperature, and loading sequence, etc., are explored, especially the effect of high temperature, which we paid more attention to.
2. Experimental Setup
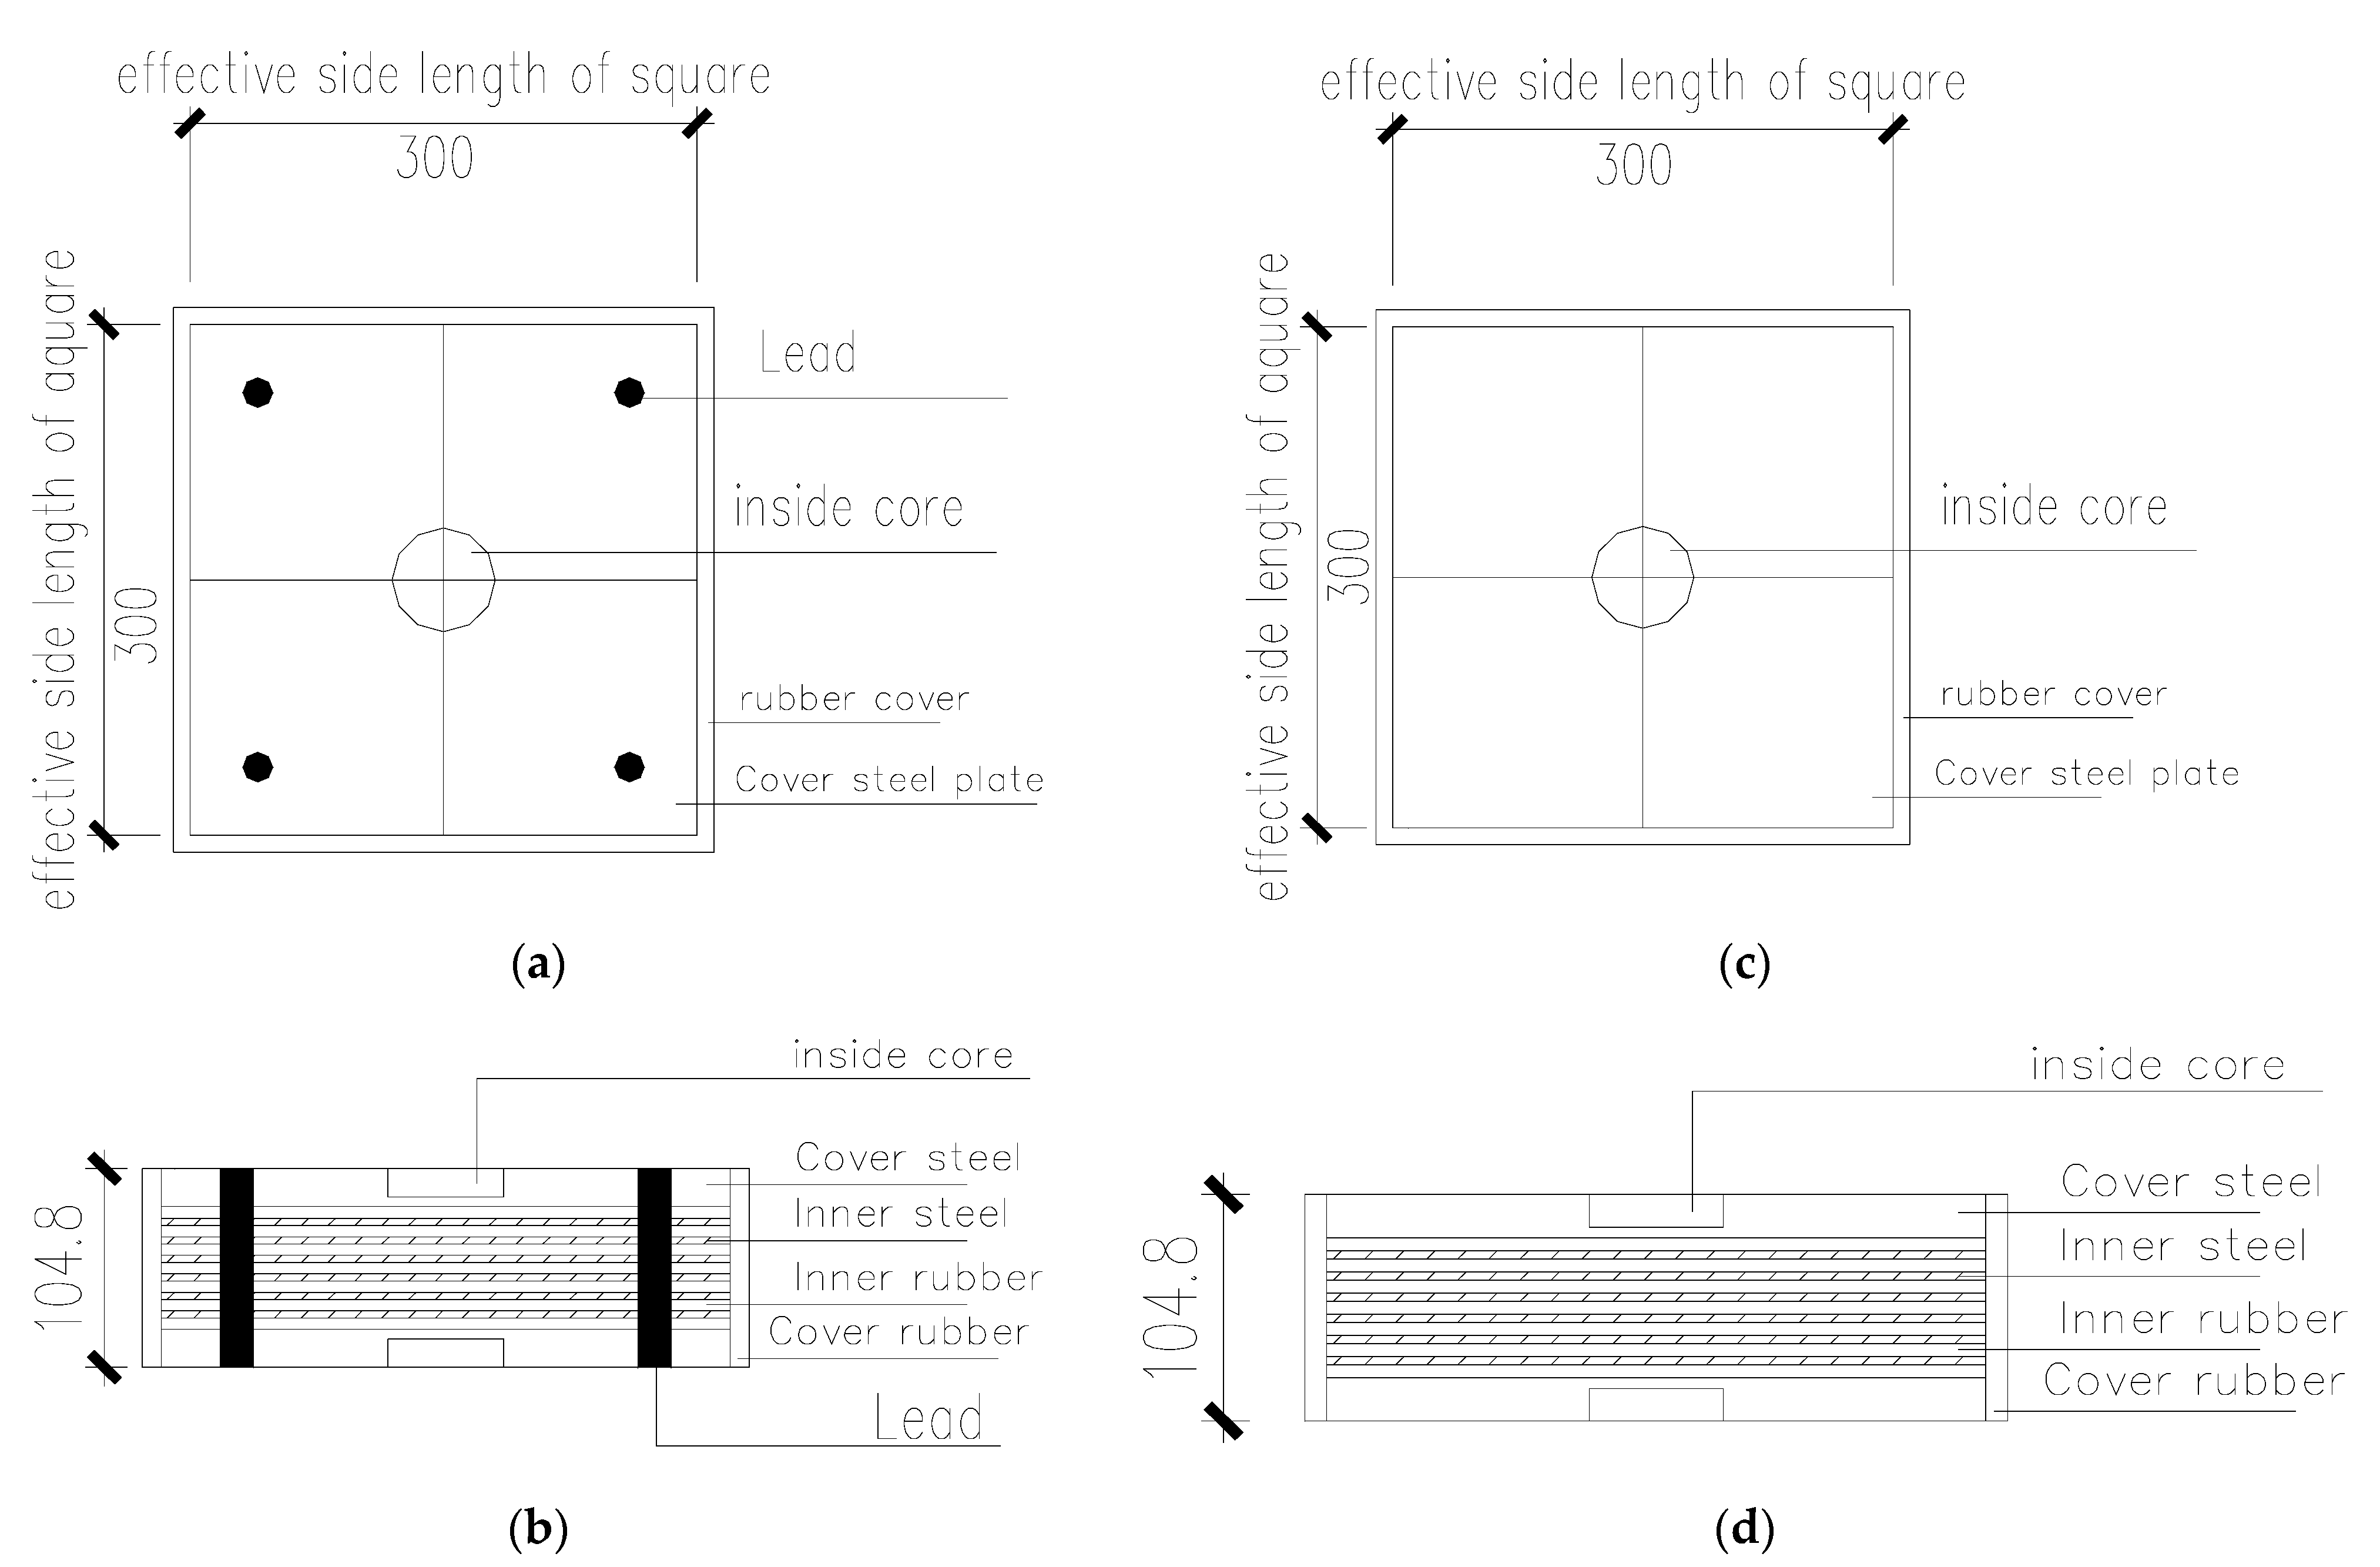
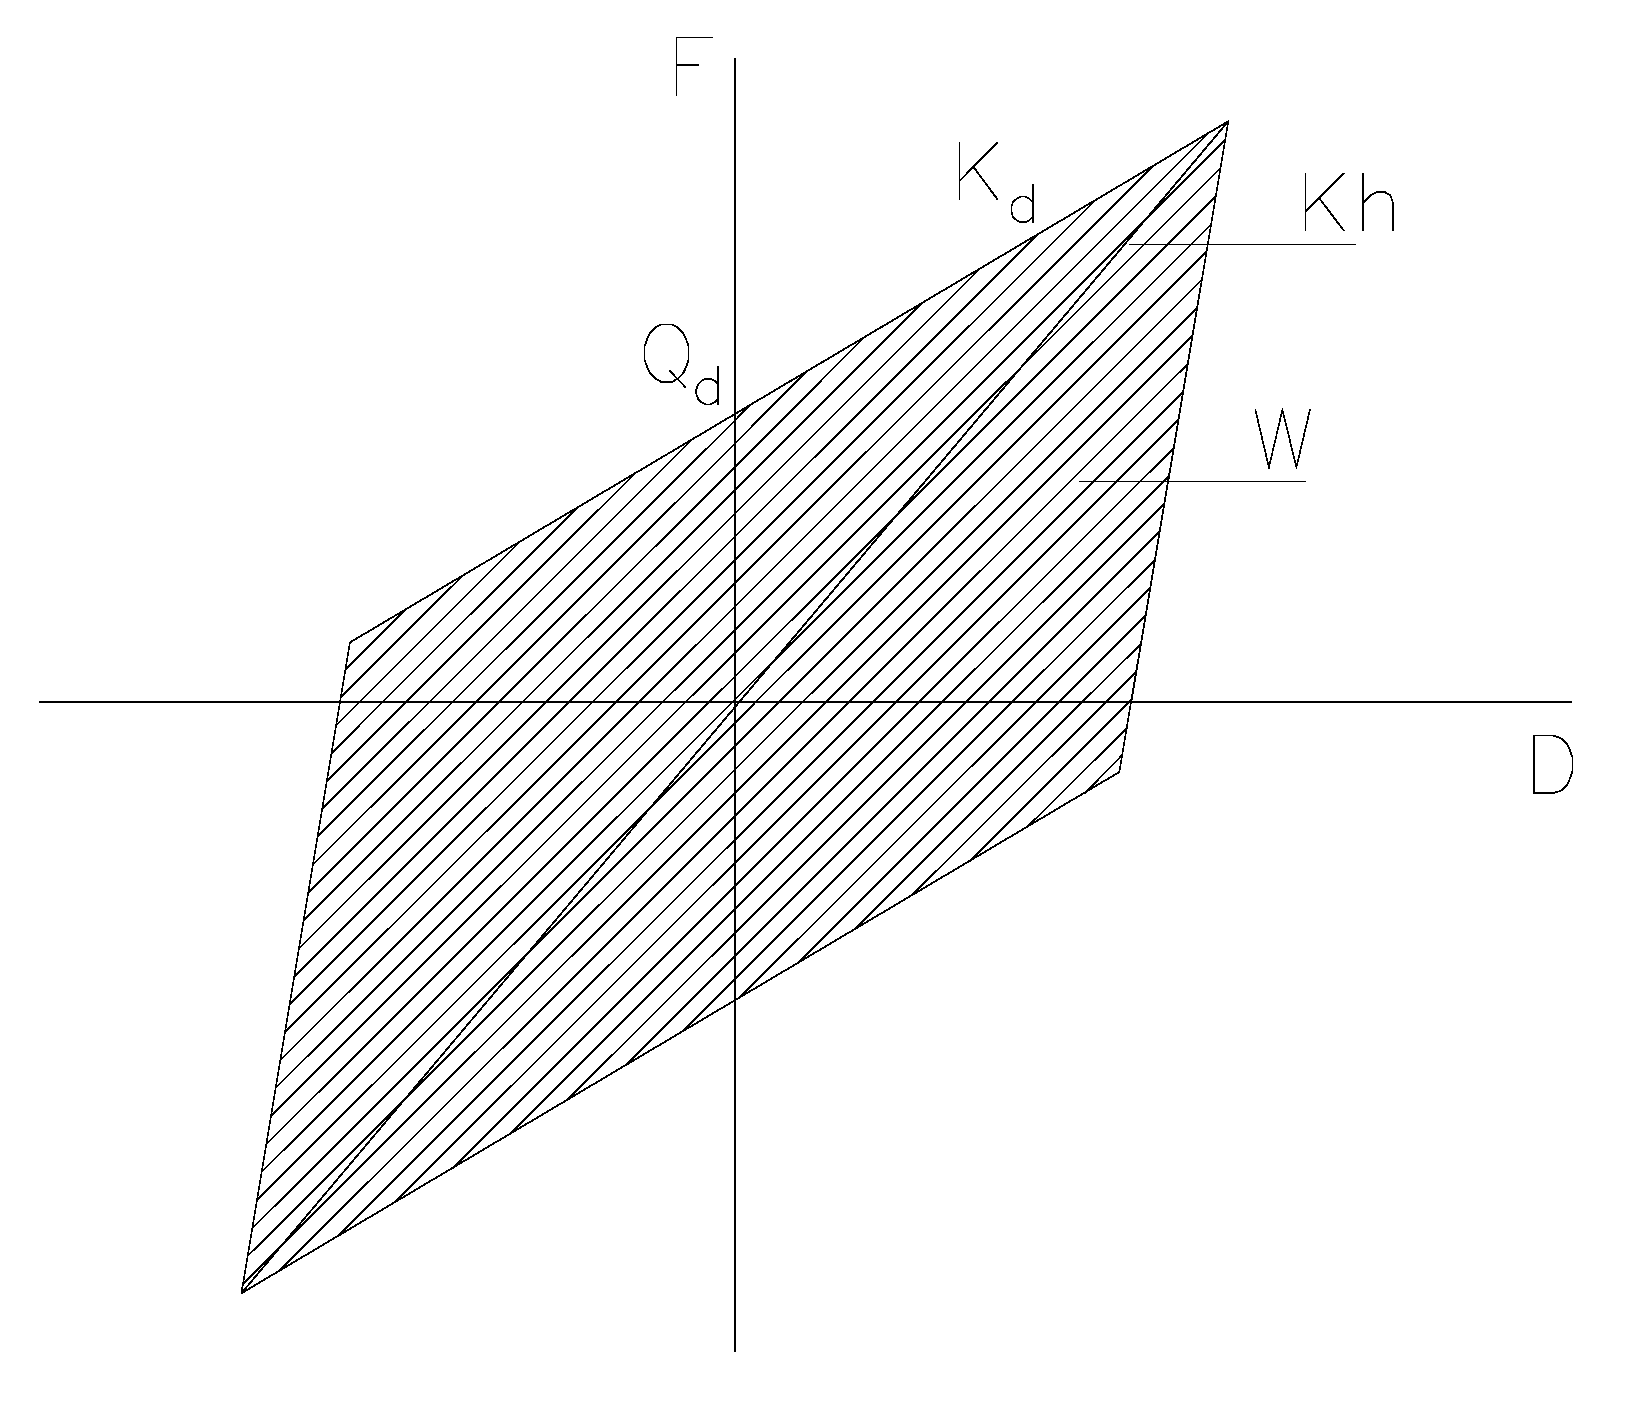
There were a total of six isolators to be made, i.e., three LRBs and three SHDRs. They have the same inner structure, and only the shear modulus of the inner rubber (i.e., G value; see Table 1 and Figure 1) was different. The specimens used in the test were square; the effective length of each side was 300 mm (i.e., the length of the inner steel plate), and the height was about 104.8 mm. According to the literature [29], they belonged to type I. Three different G values were selected, i.e., 0.8, 1.0, and 1.2 MPa. In the literature [30], it was said that when the shear strain was more than 250%, nonlinearity might appear. For this reason, the values of 25%, 50%, 100%, 150%, 175%, and 200% were adopted in the test. The method of the test was referred to in the literature [29], i.e., the method of three cycles was adopted, and the mechanical properties of the bearings were decided by the third cycle. To ensure integrity of the curve of the third cycle, four cycles were completed in each test. The factors of vertical pressure, frequency of loading, temperature, G value, and loading sequence were all investigated. All of the test programs are shown in Table 2. The post-yield stiffness (), the characteristic strength (), the area of a single cycle of the hysteretic loop (), the equivalent stiffness (), and the equivalent damping ratio () were investigated in this paper for both LRB and SHDR. ,,, and are marked in Figure 2, and was derived by Equation (1) [1]:
where is the area of a single cycle of the hysteretic loop (see the dashed area in Figure 2), is the shear strain, and is the total thickness of the inner rubber of the bearing.
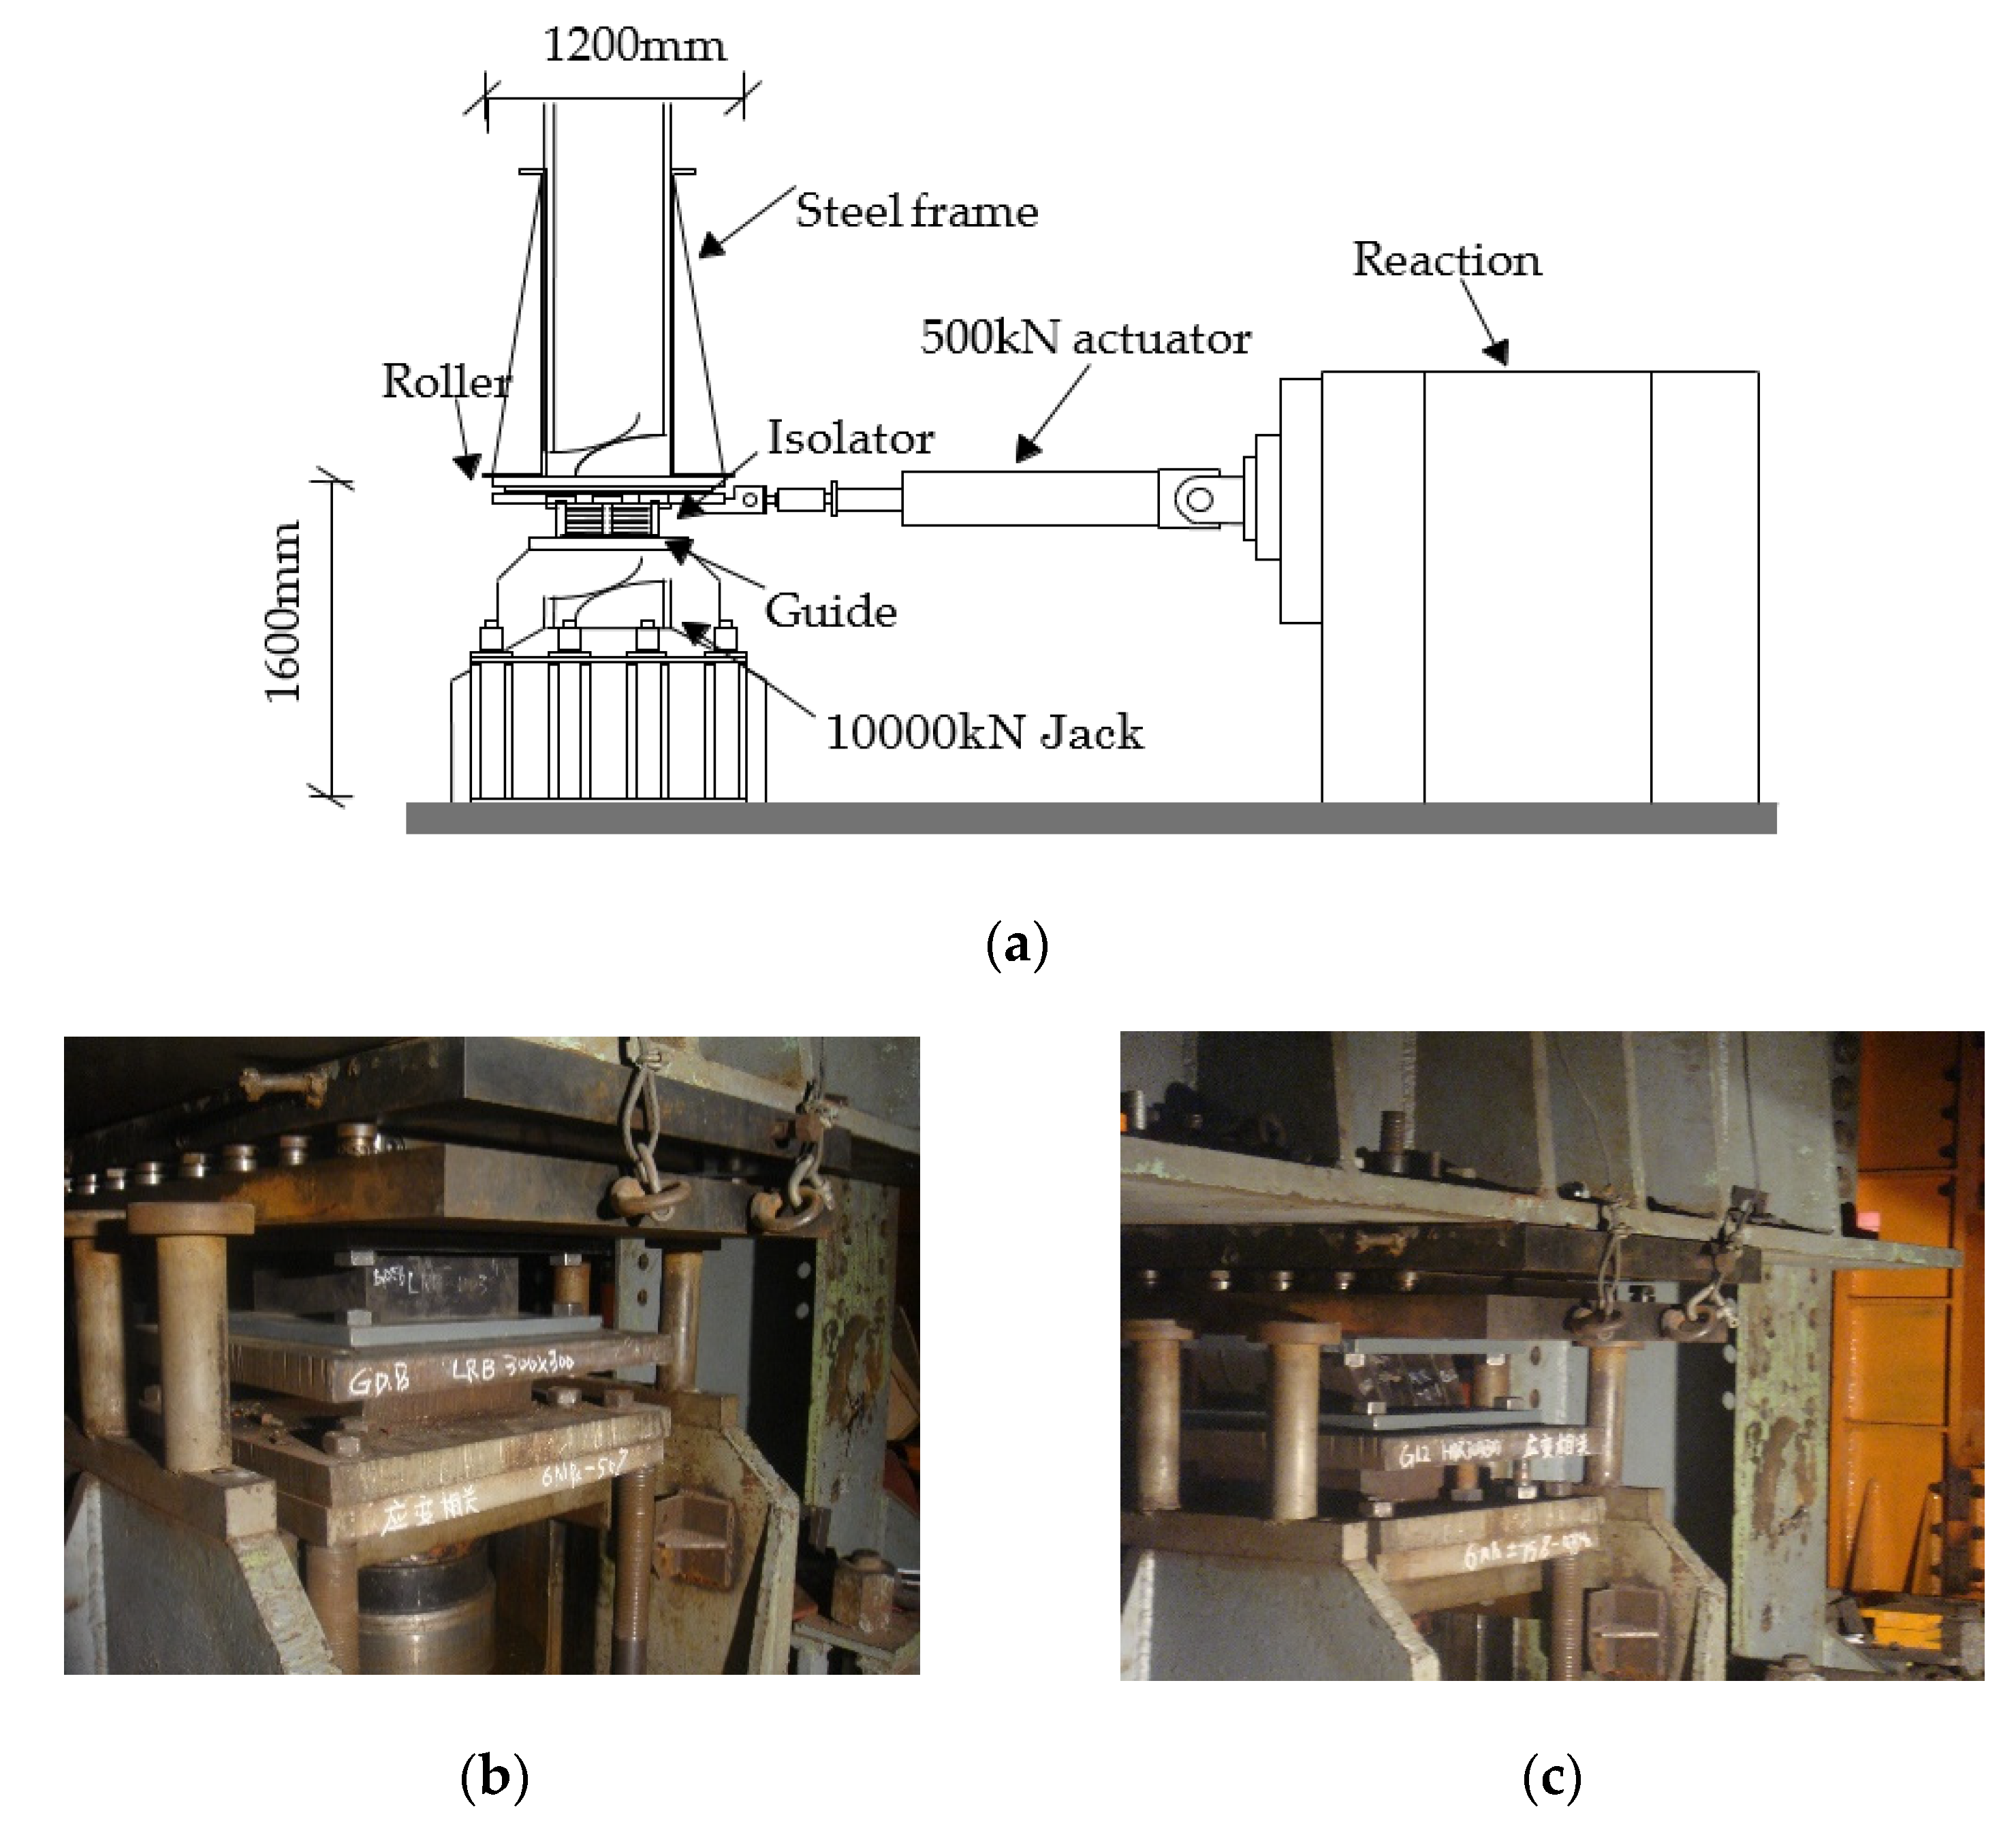
All of the tests were done in the Earthquake Engineering Research and Test Center at Guangzhou University. Figure 3 shows the test equipment and specimen used for testing.
3. General Observation of Tests
Of the five parameters, i.e., , , , , and , the first four were obtained directly from the third cycle of the hysteretic loop tested, while the last one, , was derived from and (shown in Equation (1)). The effect of various factors (such as vertical pressure, loading frequency, temperature, etc.) on these parameters is discussed in the following subsections.
3.1. Post-Yield Stiffness
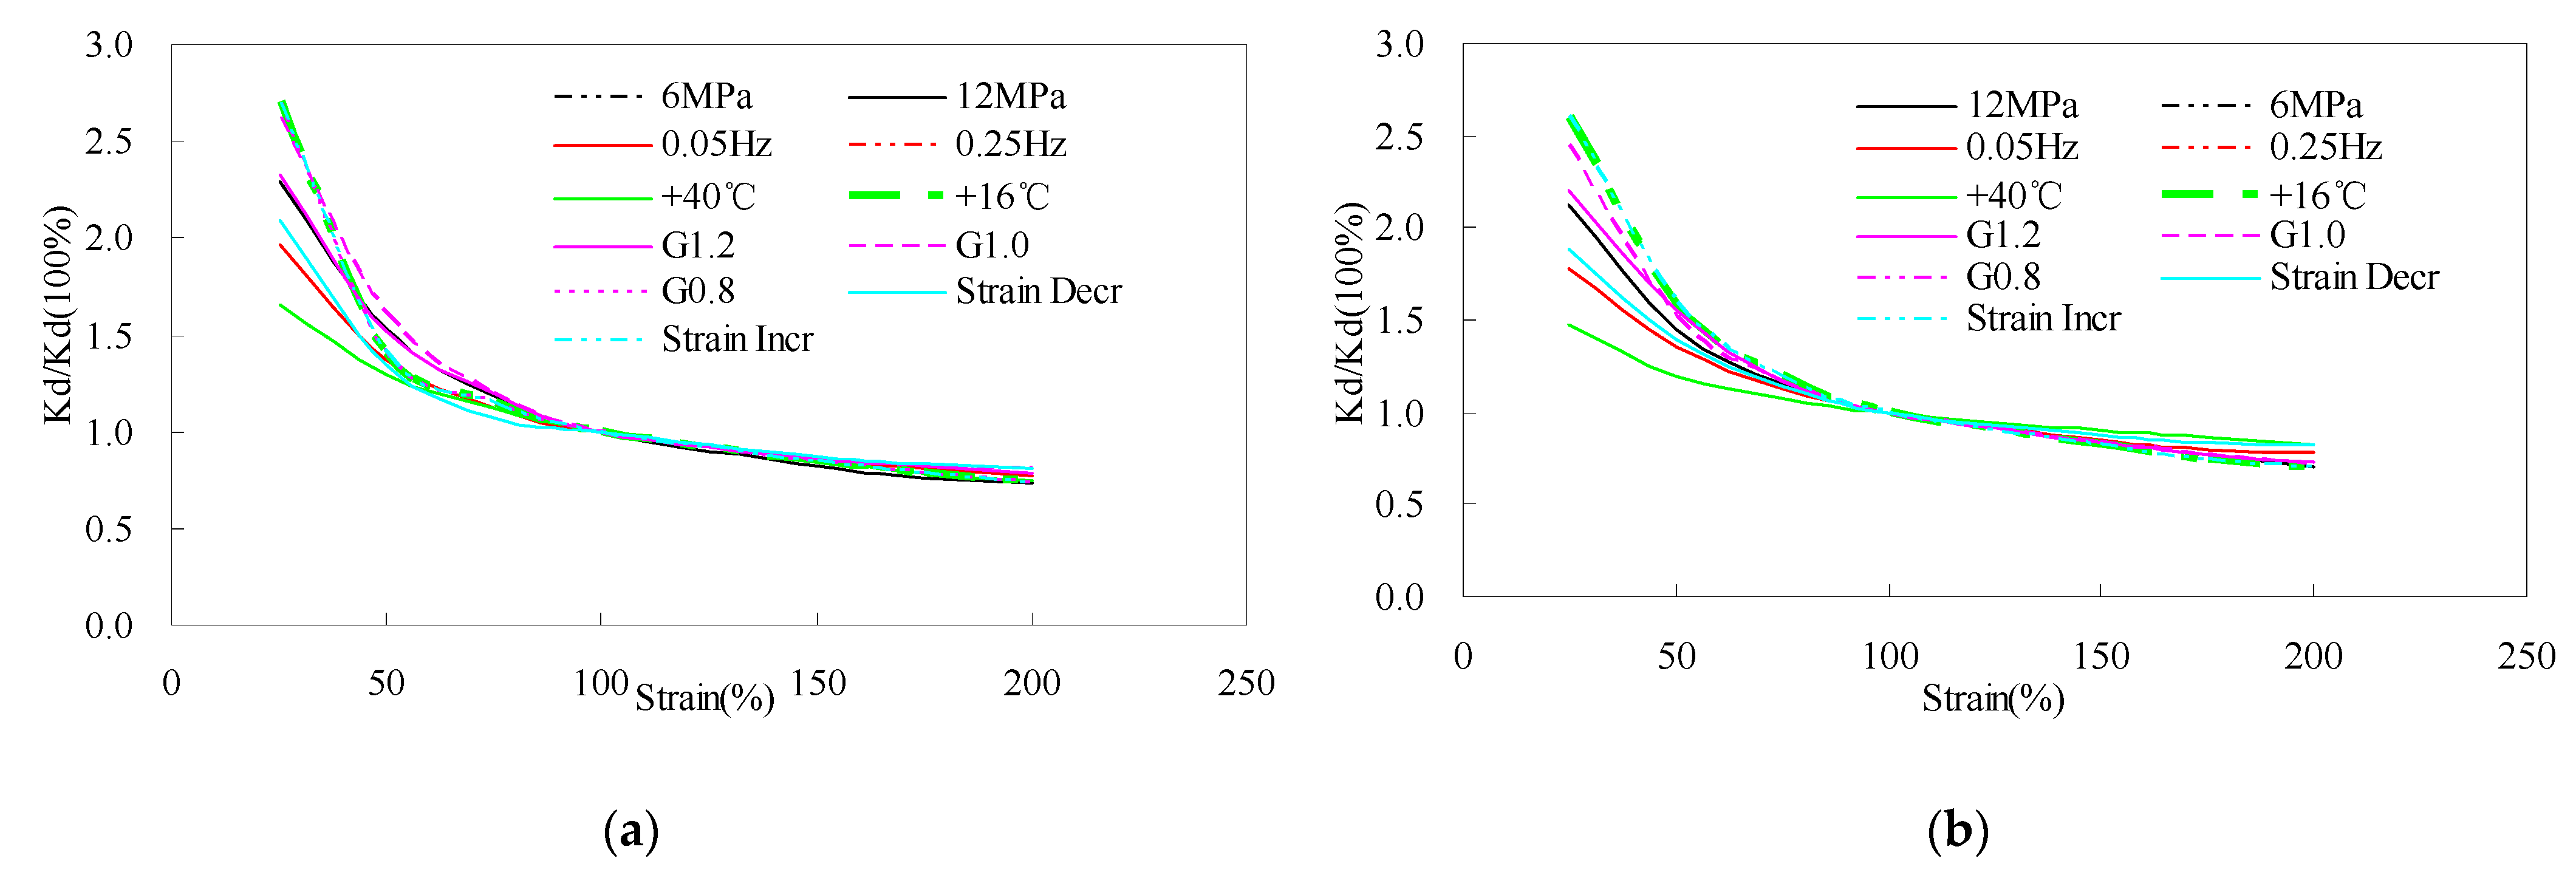
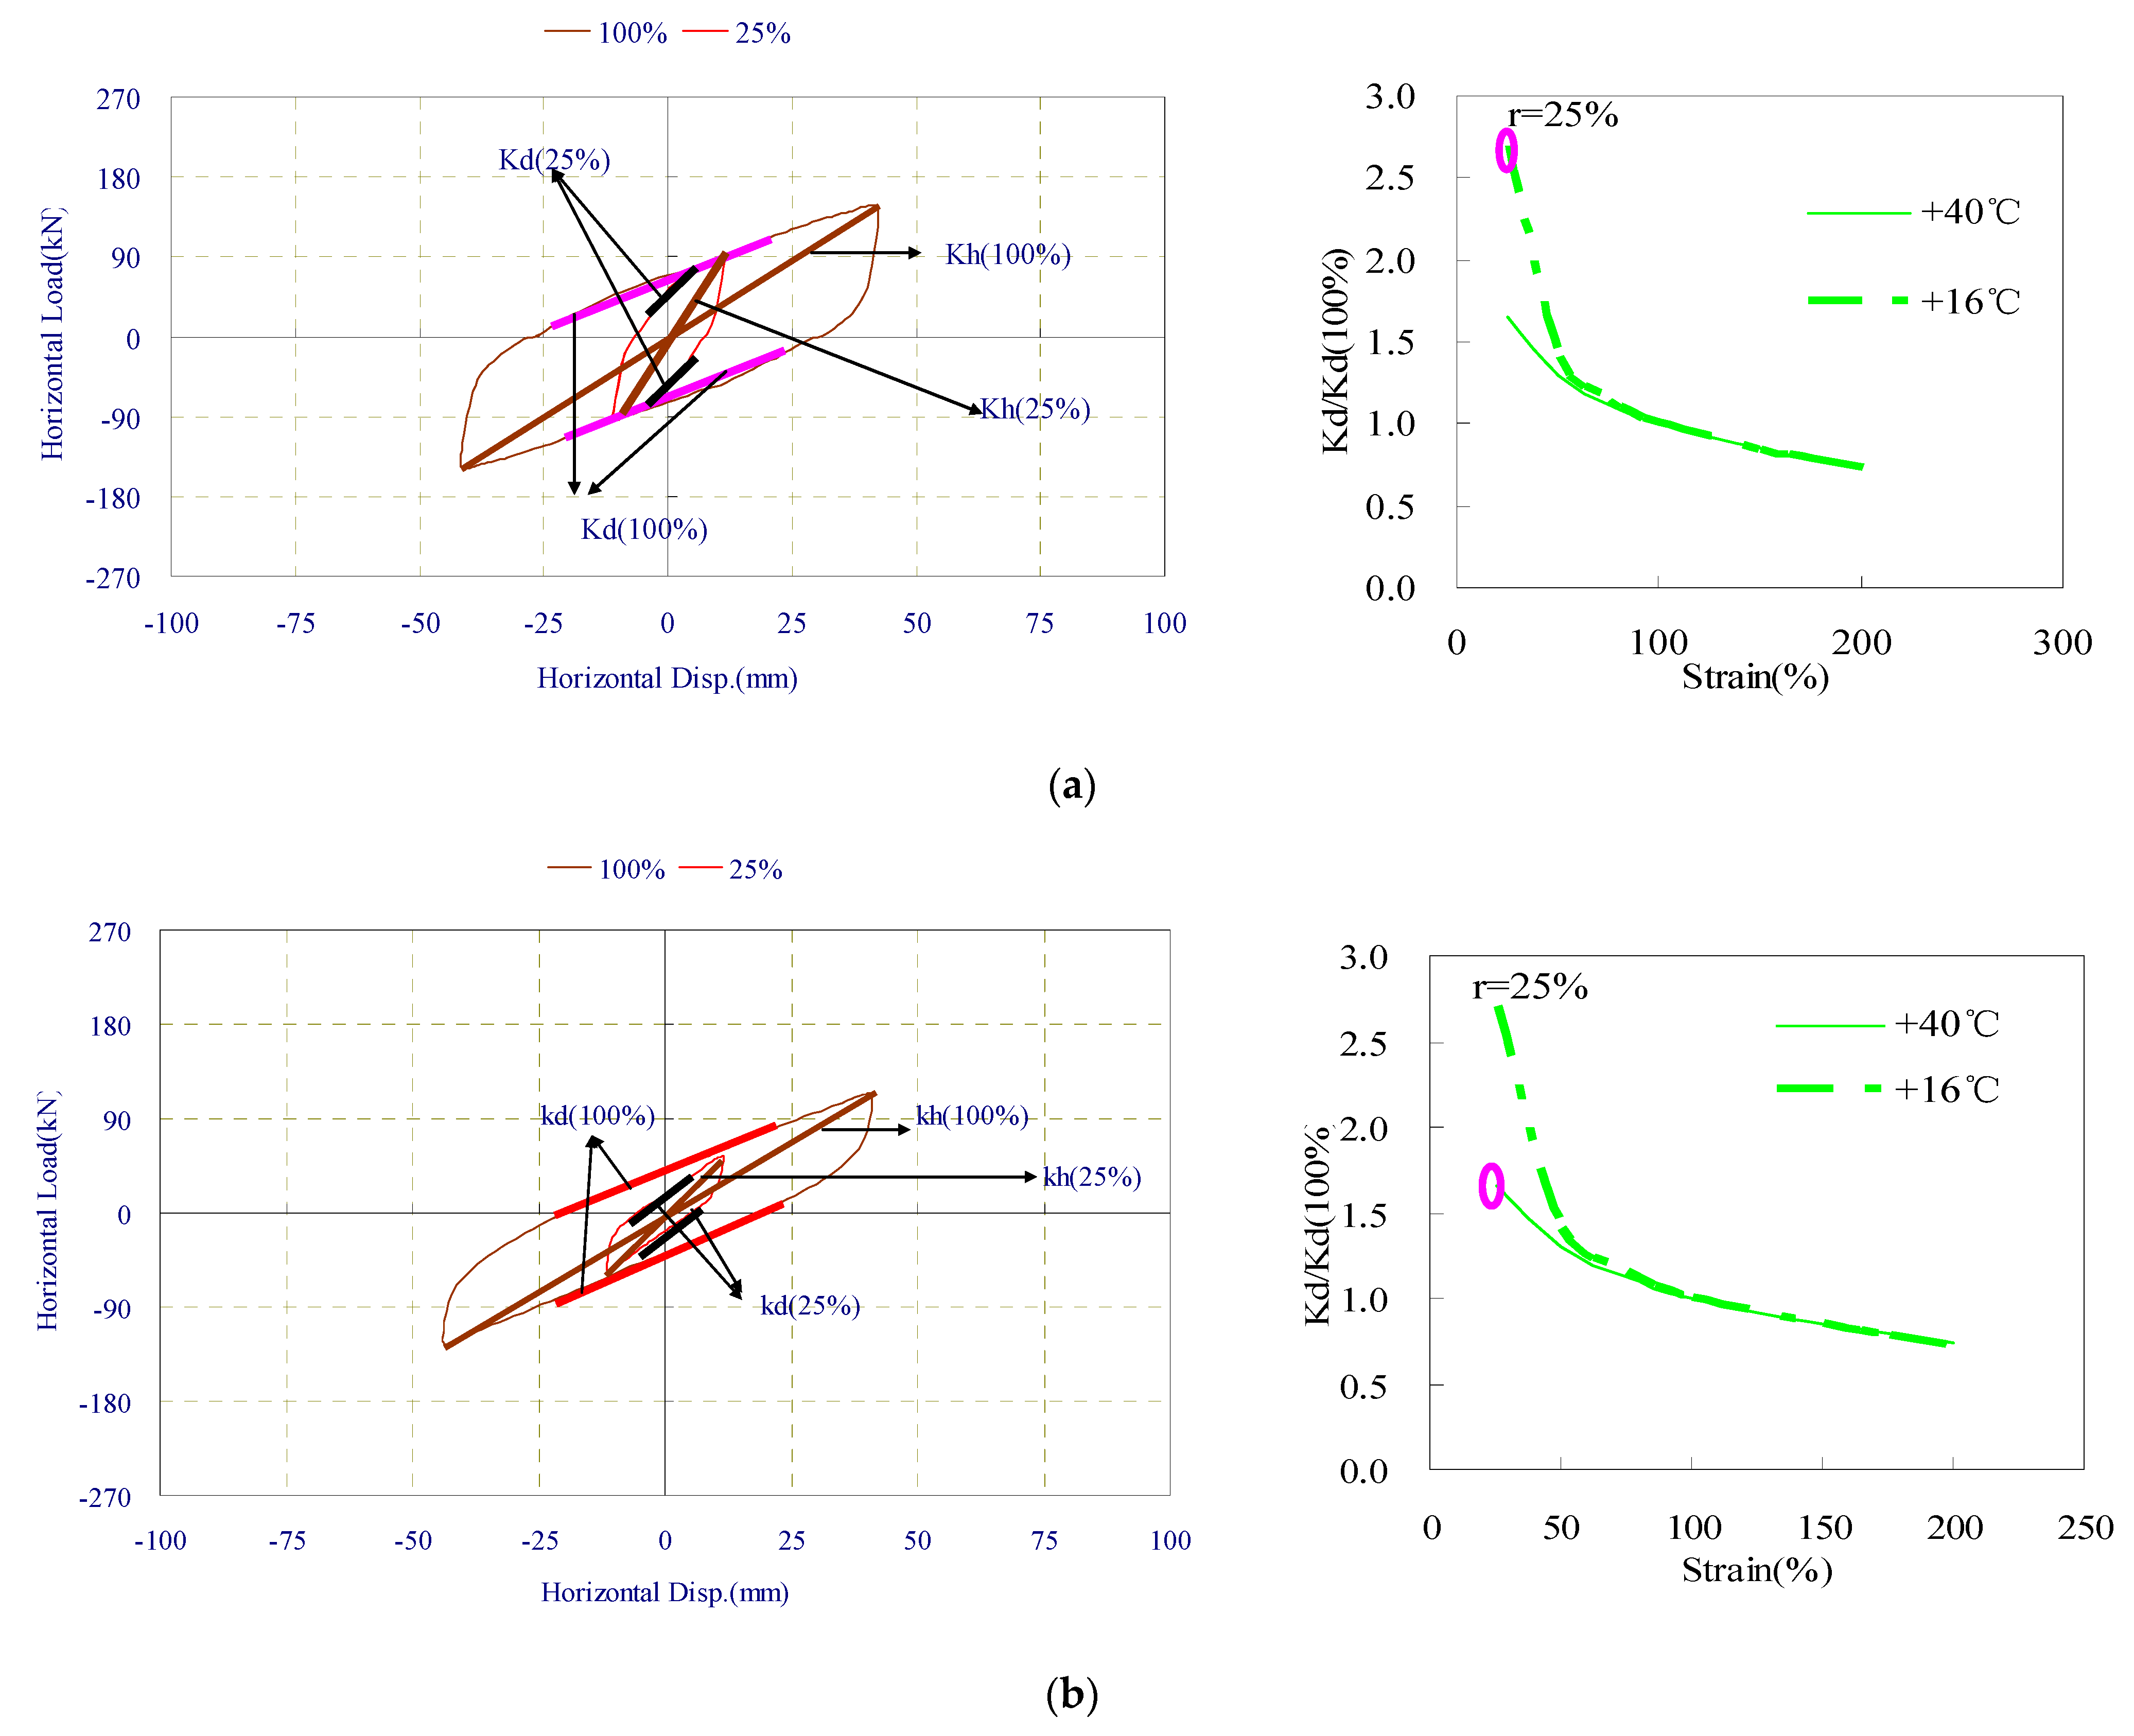
To better observe the variation trend of the dependency of shear strain under different conditions, in each condition, the value of at 100% was adopted as the referenced value, and all other data are divided by this value. The curves of the normalized post-yield stiffness of LRB, which varies with the shear strain under different conditions, are plotted in Figure 4a. It can be clearly observed that when the shear strain is more than 75%, the influence of each condition is very little; when the shear strain is less than 75%, an apparent impact under different conditions can be observed. The temperature may be the biggest impact factor. Especially at 25%, the normalized value at 40 °C is about 1.658, while at 16 °C it is about 2.697; the ratio of the former to the latter is 61%, showing a 39% reduction. The second impact factor may be the loading frequency. Although the trend is still decreasing, the reduction is about half of that of the temperature. The third one of impact is the loading sequence, where the trend seen is further reduction. The fourth one is the pressure. At 25%, there is about a 15% reduction from 6 to 12 Mpa, but at 50% there is a slight magnification. The G value may be the last impact factor, that is, the one with the least influence, although there is some difference seen near the 50% shear strain when the G values were 1.2 and 1.0 MPa.
The influence of the different factors on the post-yield stiffness of SHDR is also shown in Figure 4b. The same variation trend can be found in a comparison of Figure 4b with Figure 4a. The influence is mainly found for small shear strains, i.e., 25% and 50%; there is little effect on large shear strains. The temperature is also the biggest impact factor here. At a 25% shear strain, the normalized value of decreased from 2.60 at 16 °C to 1.48 at 40 °C, with a reduction of about 43%, which is slightly more than the reduction of that of LRB caused by temperature. Similar to LRB, the second impact factor here is the loading frequency. From 0.25 to 0.05 Hz, the reduction of the normalized value of of SHDR is slightly more than that of LRB under the same shear strain stage. The third and the fourth impact factors are the loading sequence and pressure—same as that for LRB—and it can be seen that their influence on SHDR is slightly more than that on LRB. The last impact factor is still the G value, except for the 50% shear strain; at other shear strain stages, there is a similar effect on both LRB and SHDR.
3.2. Characteristic Strength
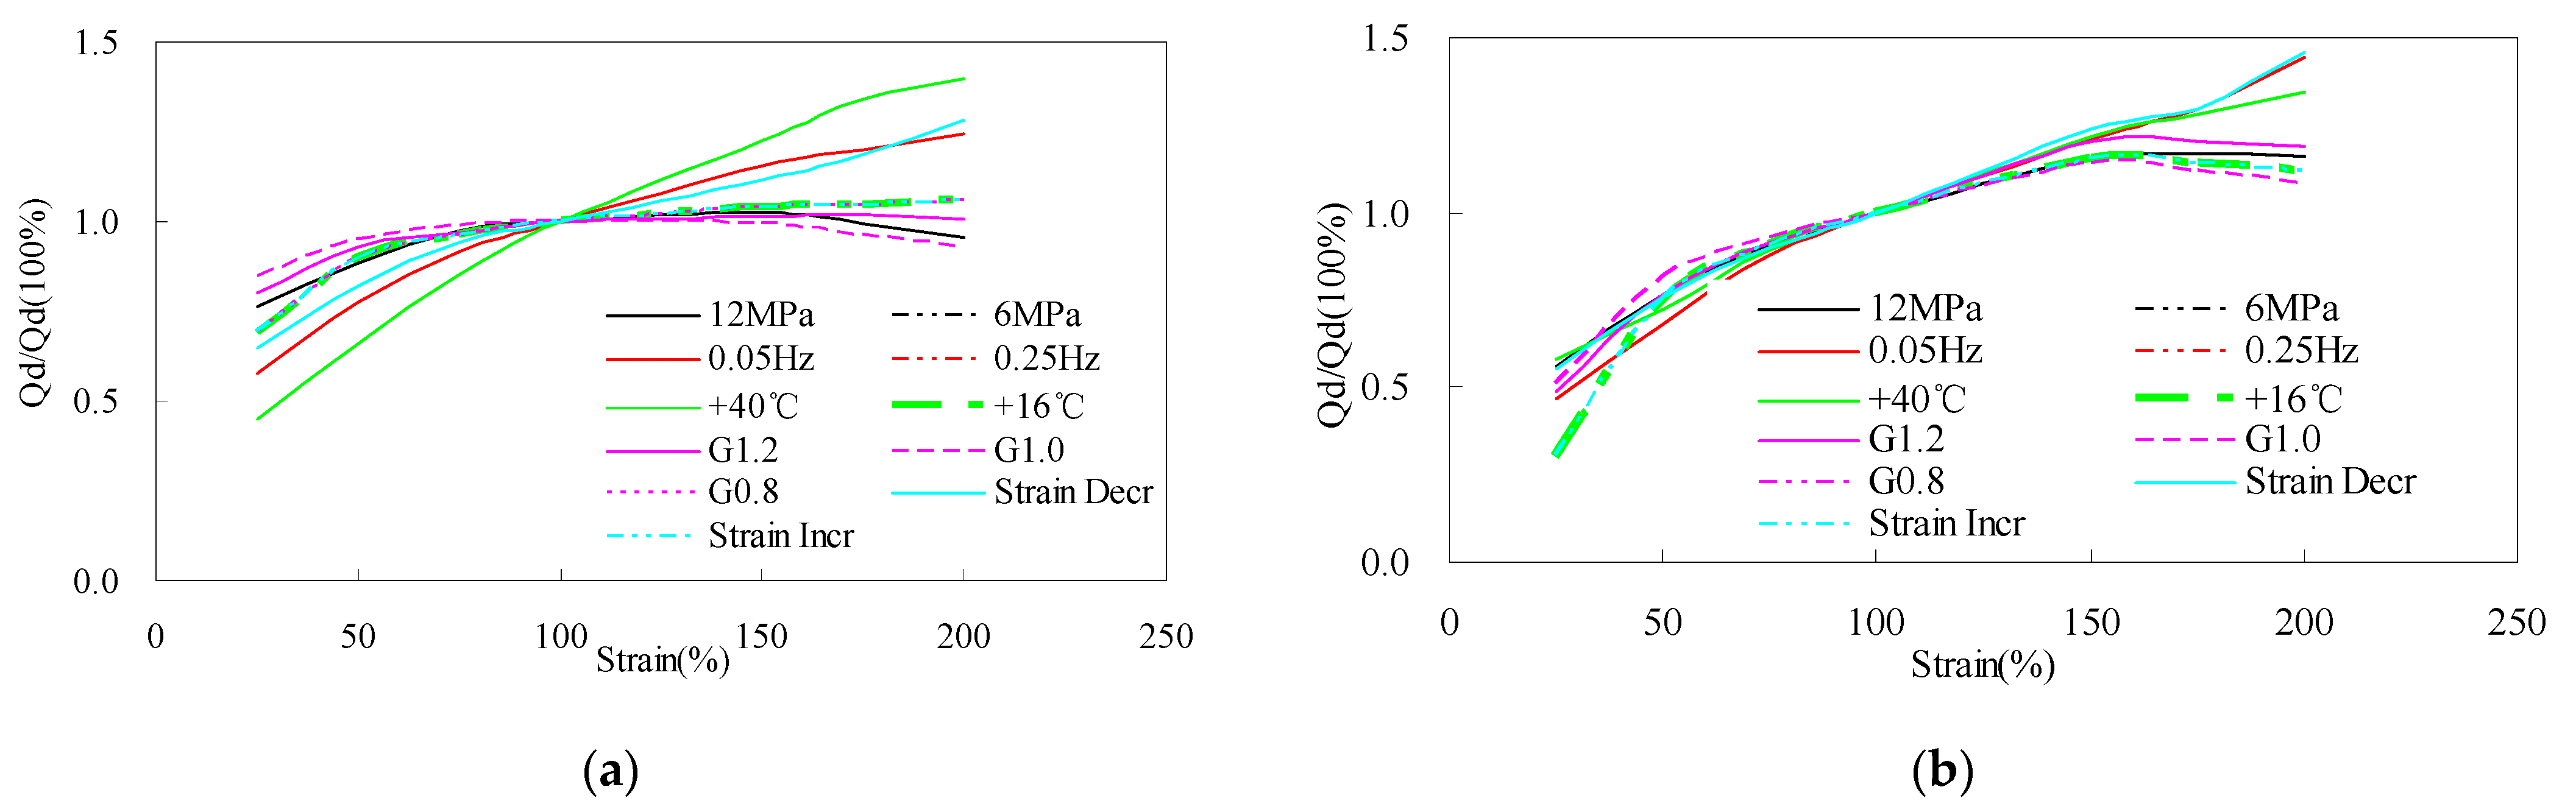
For LRB, Figure 5a shows the influence of different factors on the shear strain dependency of the characteristic strength parameter . Other than , no matter how small or large the shear strain stages are, there is a certain effect on for each factor. In all of the factors, the temperature is also the one with the largest impact. At the 25% shear strain, the normalized value of at 16 °C is about 0.695, while at 40 °C it is about 0.448, with a reduction of about 36%, which is slightly less than the reduction of . At the 200% shear strain, the normalized value is 1.4 at 40 °C and 1.06 at 16 °C, with the former being about 1.32 times more than the latter, resulting in a change of about 30%. The second impact factor is still the loading frequency at most of the shear strain stages, except for the 200% shear strain. At the 25% shear strain, the normalized value at 0.05 Hz is 0.578, while at 200% it is 1.246; both changes in relation to the value at 0.25 Hz are about 17%. The third one of impact is the loading sequence. The changes at most of the shear stages are slightly less than that those under the loading frequency. The last one of impact may be the pressure or G value, as there is little difference between them; the biggest change in these two factors happens at the 10% shear strain at a G value of 6 MPa and 0.8 MPa, respectively.
For SHDR, Figure 5b shows the influence of the different factors on the shear strain dependency of . In comparison to LRB, the difference of the factors’ effect on SHDR becomes less. Excluding the 200% strain, the temperature and loading sequence may be the largest impact factors. The influence of the loading frequency is small at the small shear strain stages and is large at the large shear strain stages. There is a similar small effect for the G value and pressure.
3.3. Area of Single Cycle of Hysteretic Loop
Figure 6a shows how the different factors affect the shear strain dependency of the area of a single cycle of LRB’s hysteretic loop. It can be observed that for all of the factors, there is little effect at the small shear strain stages, while some influence can be found at the large shear strain stages, i.e., 150%, 175%, 200%. For all of the factors, the temperature may still be the biggest one of impact, such as at the 200% strain where there is about a 25% increment from 16 to 40 °C. The loading sequence and loading frequency may be the second ones of impact. In these two factors, there is little difference, as the maximum increment is about 20% at 200%. The third ones of impact may be the pressure and G value; there are few changes from 6 to 12 Mpa or from the G value of 0.8 to 1.0 MPa and 1.2 MPa.
For SHDR, the different factors’ effects on are shown in Figure 6b. In comparison to LRB, the similarity is that the effect of all factors can be found at large strain stages; in terms of difference, the biggest factor of impact is not the temperature but the loading sequence. The second factor of impact is the temperature and the loading frequency, with the maximum change of about 25% at the 200% strain. The G value and pressure may be the third factors of impact; there is little difference for the two factors, with the maximum change being at 8% at the 200% strain.
3.4. Equivalent Stiffness
Figure 7a shows the different factors’ effect on the equivalent stiffness of LRB. Some effect at the small shear strain stages can be observed; however, there is little effect at the large shear strain stages. The temperature is still the biggest impact factor, with the greatest induction being 28% at the 25% shear strain. The loading frequency and the loading sequence may be the second impact factors; the influence difference between them is very little, and the largest change caused by the two factors is about 18% at the 25% shear strain. The G value and pressure may be the third impact factors, with the largest change caused by them being about 10% in all of the shear strains.
For SHDR, the different factors’ effects on the equivalent stiffness parameter are shown in Figure 7b. Compared to Figure 7a, there is an apparent difference at large shear strain stages. For example, at the 200% strain for SHDR, there is a certain effect on the shear strain dependency, especially under different temperatures, loading frequencies, and loading sequences. However, the G value and pressure still show little influence at large shear strain stages. In the small shear strain stages, influence at the 25% strain may be the largest. In all of the factors, the temperature may be still the largest impact factor. From 16 to 40 °C, the reduction of the normalized value of at the 25% shear strain is about 22%. The loading frequency and the remaining factors do not seem to cause much impact in comparison to the temperature; the biggest change caused by these factors is about half that of the temperature, i.e., about 10%.
3.5. Equivalent Damping Ratio
According to Equation (1), the equivalent damping ratio can be calculated from the area of a single cycle of the hysteretic loop and the equivalent stiffness. Figure 8a shows the influence of the different factors on the equivalent damping ratio of LRB. At the large shear strain stage, an obvious influence can be found for the temperature, such as at the 200% strain stage, where there is about an 18% change for the normalized value of from 16 to 40 °C. At the smaller shear strain stages, there are some changes at the 50% shear strain under the temperature’s effect, but there is little effect at the 25% shear strain. However, the loading sequence plays the biggest impact role at the 25% strain, where there is an 8% change, while the change caused by other factors is about 6%. For SHDR, in Figure 8b, different phenomena can be found; only the temperature plays the single role in affecting the shear strain dependency of .
3.6. Fitted Curve
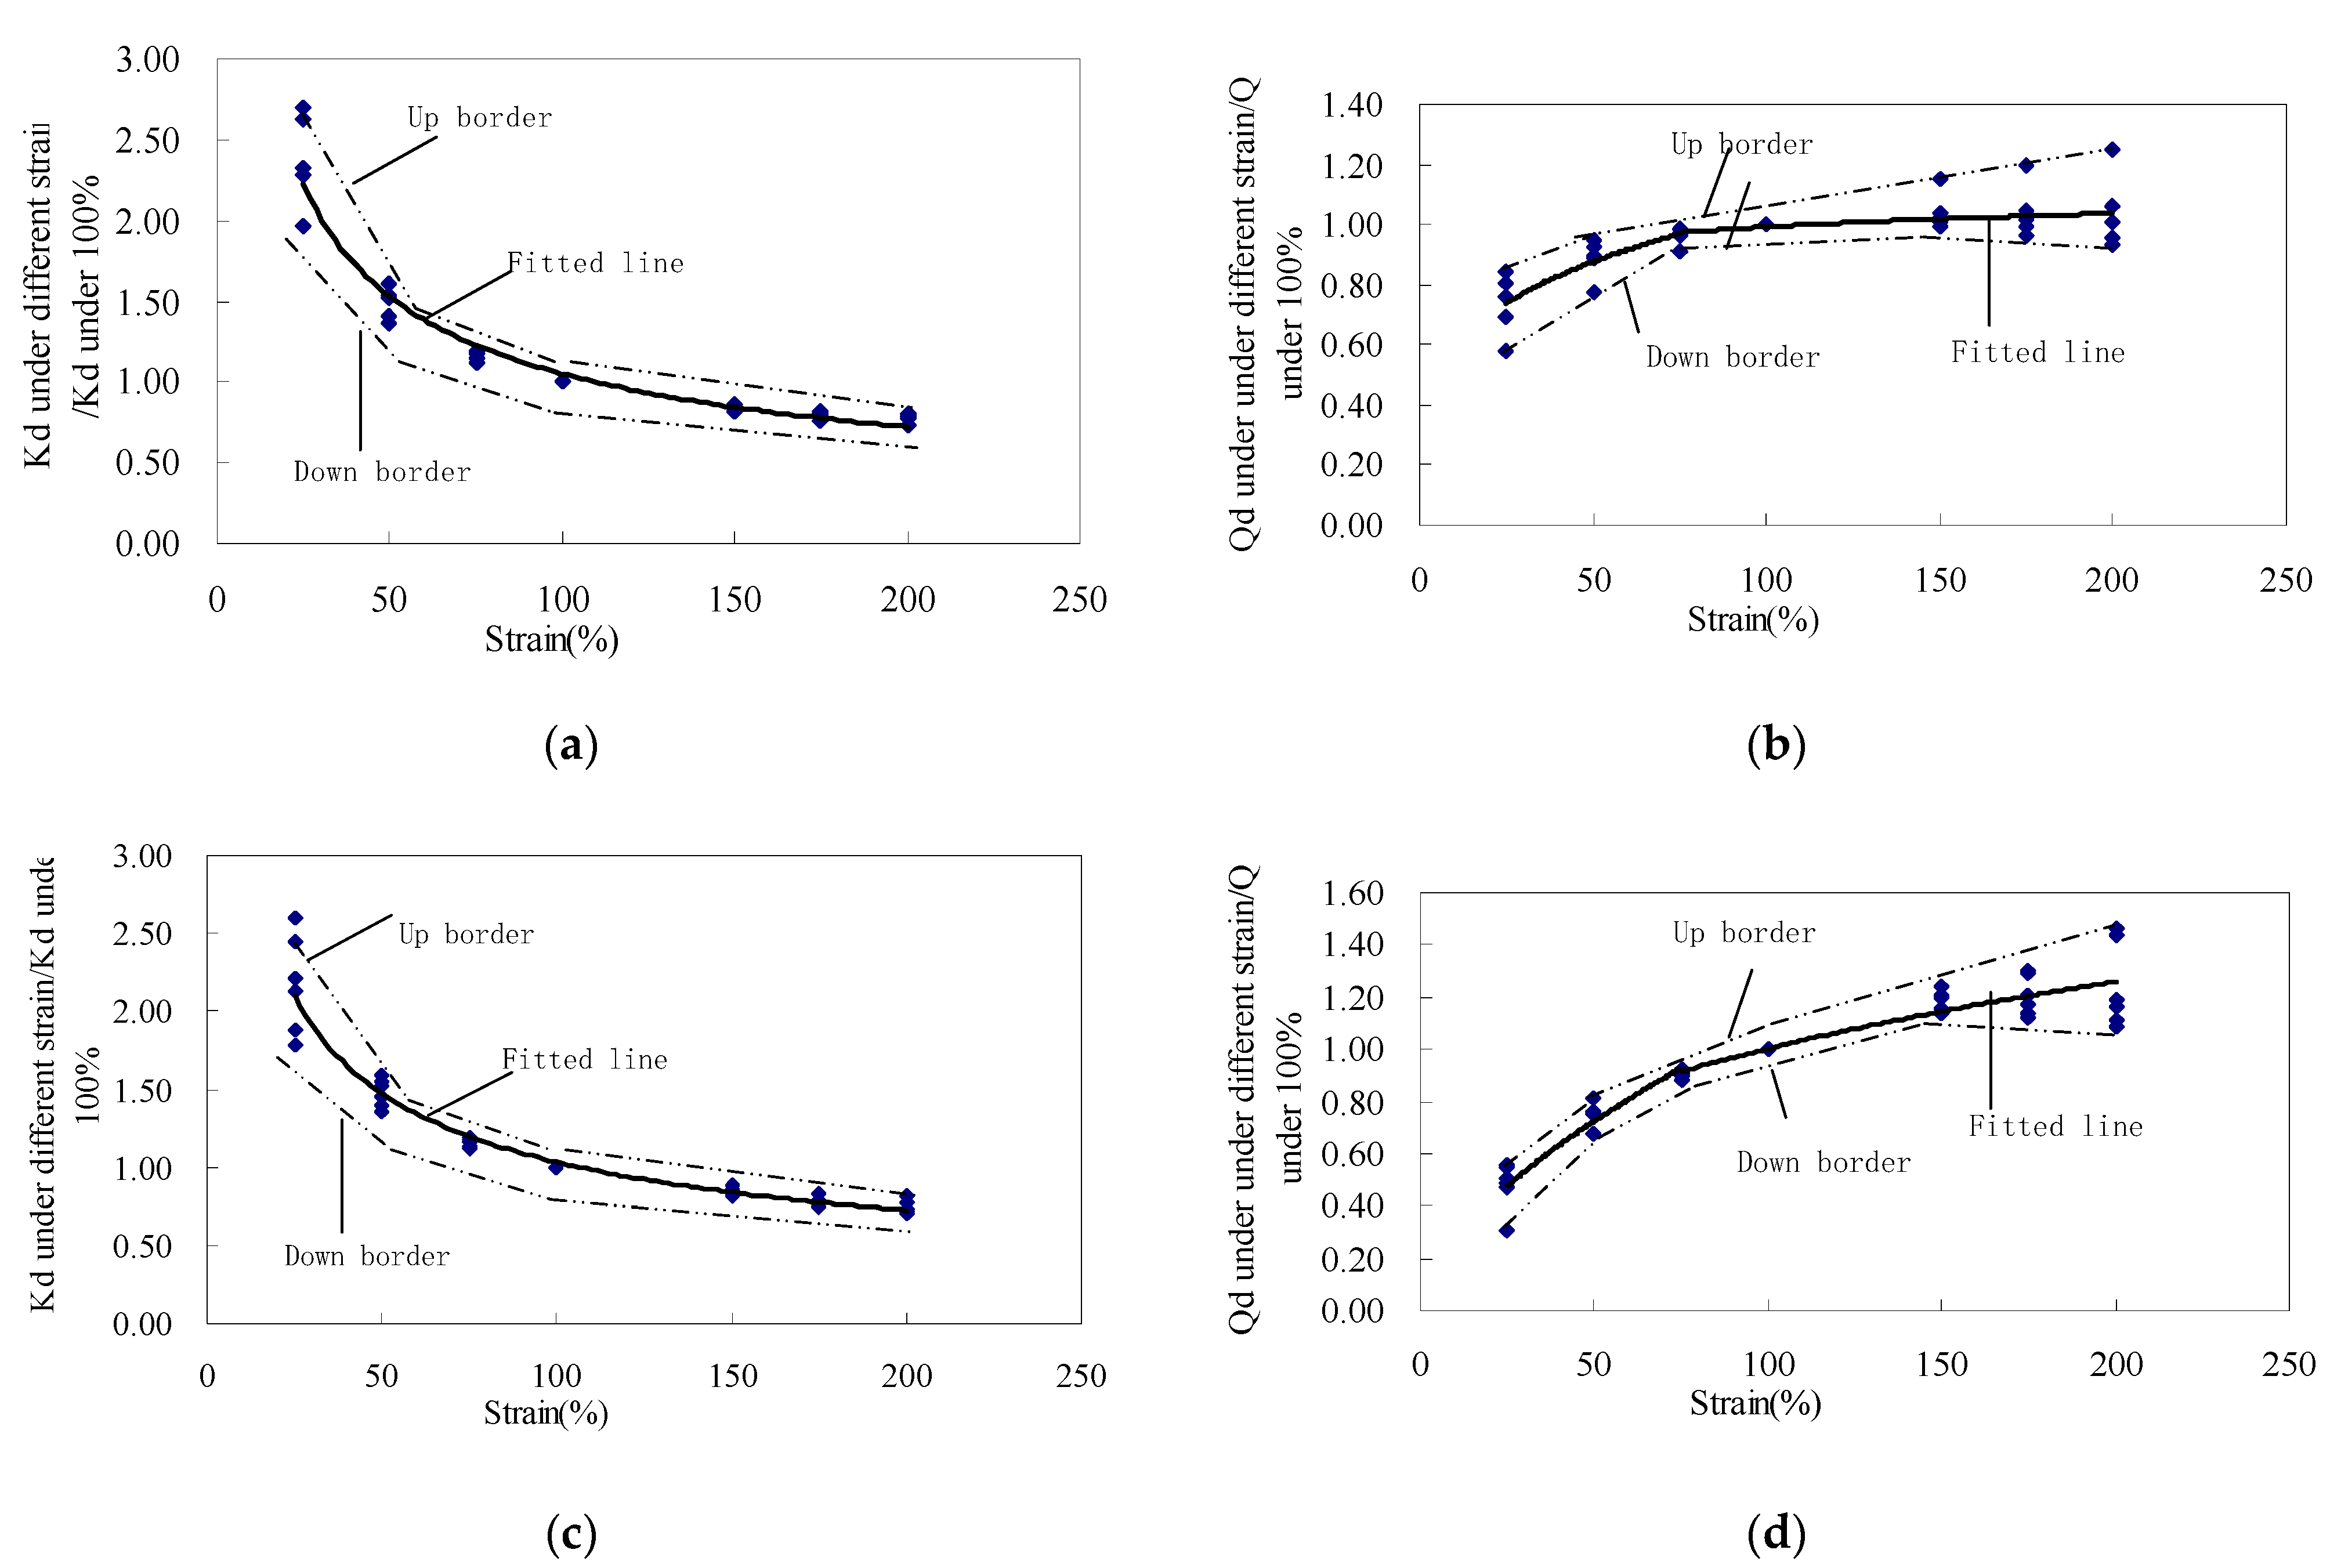
According to the observations in Section 3.1, Section 3.2, Section 3.3, Section 3.4 and Section 3.5, in most of the conditions, the temperature shows a significant influence on the dependence of shear strain, whether it be for LRB or SHDR, while other factors show a relatively lesser effect. When analyzing the isolation structure, two main parameters, namely, the post-yield stiffness and characteristic strength, need special consideration. For the data to be conveniently adopted by engineers, excluding those for the temperature factor, all of the test data for and were collected. The corresponding fitted curves were plotted in Figure 9, and the fitted equations for LRB were also given in Equations (2) and (3), SHDR in Equations (4) and (5):
Figure 9a,c shows the difference between the fitted value of and the test values, which are given separately for LRB and SHDR. The main difference occurs at the small shear strain stages, especially at the 25% strain, but the maximum deviation is about 13%. The difference for between the fitted value and test values is shown in Figure 9b for LRB and Figure 9d for SHDR. In contrast to , the main deviation appears at the large shear strain stages for both types of bearings. The maximum deviation is about 19% and is slightly more than that of .
The curves of the two shear strain dependency parameters and for LRB (i.e., Equations (6) and (7)) and SHDR (i.e., Equations (8) and (9)) from [27,28] are plotted in Figure 10a–d. To compare the differences between them and the fitted curves (i.e., Equations (2)–(5)), the expression from Equations (2)–(5) is also plotted in Figure 10.
where .
For LRB, Figure 10a,b shows the difference between the test values taken from Olies (i.e., Equations (6) and (7)) and Equations (2) and (3). Little difference can be found at large shear strain stages, whether for or . However, at small shear strain stages, there is an obvious difference; moreover, with the shear strain decreasing, the difference increases. For example, at the 25% shear strain, the normalized value of from Olies is about 1.41, while that from Equation (2) is about 1.92, showing a 26% reduction. Under the same shear strain stage, the normalized value of from Olies is about 0.90, while that of Equation (3) is about 0.75, showing an increase of around 20%.
For SHDR, Figure 10c,d shows the difference between the test values from Bridgestone (i.e., Equations (8) and (9)) and Equations (4) and (5). Compared to LRB, little difference is found between them, except that there is a little difference at a certain individual point for . If this point cannot be considered, the maximum variation is about 8%. The G value of the specimens from Bridgestone is about 0.62 MPa; however, those in this paper are 0.8, 1.0, and 1.2 MPa. With this in view, we can conclude that as mentioned earlier, the G value has little effect on the dependency of the shear strain of SHDR.
4. Discussion on Special Experimental Results
4.1. Comparing Slope of for LRB under Low and High Temperatures
In Figure 5a, a significant phenomenon for LRB can be found, namely that the slope of the shear strain dependency parameter of characteristic strength is far smaller when the temperature is at 16 °C than at 40 °C. To explore the reason for this, hysteretic loops at different shear strains at 16 °C and 40 °C are plotted in Figure 11a,b. In Figure 11a, from shear strains of 25% to 200%, there is little change for , but in Figure 11b, there is an almost linear increase with the shear strain increasing. The reason may lie in the characteristic strength of lead and also the interaction between the lead and the inner rubber of the bearing. When the temperature is low, the lead has high characteristic strength, and when the temperature is high, the characteristic strength of the lead decreases much more. From 16 to 40 °C, the Qd value at the latter temperature may be half of that at the former. Although the stiffness of the inner rubber may decrease, the change is very small; according to the literature [31], it is around 10%. From this, we can conclude that because the restraining function of the inner rubber on the lead under low temperature is far less than that under high temperature, the abovementioned phenomenon appears.
4.2. Normalized Value of of LRB at Low Strain under Low Temperature Being Greather than That under High Temperature
For LRB, in Figure 4a, one significant phenomenon can be found. At 16 °C, the normalized value of at the 25% strain versus that at 100% is about 2.697, but at 40 °C, the value is about 1.658, meaning that the difference is very large. To explore the reason, the hysteretic loops of the horizontal force–displacement at the two different temperatures are plotted in Figure 12a,b.
According to the literature [27,32], for LRB, is made up of two parts: one is the inner rubber, and the other is lead; the equation is in the following [27,32]:
where is the stiffness provided by the inner rubber at and is the stiffness provided by lead at . is calculated as:
where is the shear modulus of the inner rubber. is calculated as
where is the shear modulus of lead.
According to the literature [31], for LNR, there is little effect for the shear strain on the horizontal stiffness (i.e., ); from shear strains of 100% to 25%, only a 5% increase was found, and so Equation (10) can be slightly transformed to the following equation:
where can be considered as the amplification factor of stiffness strengthening provided by the lead, and it can be determined by the function of lead restraint on the inner rubber in the bearings.
In Figure 12a,b, an interesting phenomenon can be observed. The shape of the loop curve at 16 °C resembles a spear, whereas at 40 °C it resembles a rectangle. The former is likely as a curve of a steel-reinforced concrete element yielded incompletely, while the latter is a curve of an element yielded completely. At the same time, at a temperature of 16 °C and at a 25% shear strain, the value of is about 48 kN; at 100% shear strain, the value is about 69.5 kN, meaning that the former is around 70% of the latter. At a temperature of 40 °C and at a 25% shear strain, is about 17.1 kN; at 100% shear strain, the value is about 38.2 kN, meaning that the former is around 45% of the latter. The change under high temperature is more than that under low temperature. At 16 °C and at a 25% shear strain, although the value of is slightly less than that at 100%, its incompletely yield state provides more restraint on the inner rubber, thus causing to be larger than that at the 100% shear strain. At 40 °C, on the one hand, the value of at 25% is far less than that at 100%, while on the other hand, the completely yielded state at 25% causes to increase in a limit. These could be the reasons that the normalized value of at a low shear strain at 40 °C is less than that at 16 °C.
5. Conclusions
To investigate different factors’ effect on the dependency of the shear strain of LRB and SHDR, three LRBs and three SHDR bearings were adopted. Both types of bearings have the same inner structure; only the G values were different. The shear strains used were 25%, 50%, 100%, 150%, 175%, and 200%. The factors of vertical pressure, loading frequency, G value, temperature, and loading sequence were studied. Tests on the mechanical properties, i.e., the post-yield stiffness, the characteristic strength, the area of a single cycle of the hysteretic loop, the equivalent stiffness, and the equivalent damping ratio, were conducted. Based on the test results, the following conclusions can be drawn:
- In most of the conditions, the temperature may be the most significant factor in the shear strain dependency of LRB or SHDR.
- The G value and pressure may be the least impactful factors, especially the G value, whose effect can be neglected, whether for LRB or SHDR.
- For the loading frequency and loading sequence, there are certain impacts; in most of the conditions, their level of effect is found between the temperature and G value.
- For LRB, excluding the temperature, the fitted curves of the post-yielded stiffness and the characteristic strength were given. By comparing them with those given by Olies, a little difference is found at small shear strains.
- For SHDR, the corresponding fitted curves fit well with those given by Bridgestone.
- For LRB, during all the shear strains, the change of the characteristic strength is very little under low temperature. However, the slope of characteristic strength versus the shear strain under high temperature is large.
- For LRB, the post-yielded stiffness at 25% is larger than that at 100% under low temperature; however, the increase shows a significant reduction under high temperature. The reason is caused by the high yield strength of lead at low temperature and its incompletely yielded state.
In this paper, most of results are based on the test of small size bearings. For the future, more research about large size bearings can be carried out, especially the effect of shear strain dependency of LRBs and SHDRs on seismic isolation, which needs to be more extensively investigated.
Author Contributions
Conceptualization, C.-Y.S. and X.-Y.H.; investigation, C.-Y.S. and Y.-Y.C.; writing—original draft preparation, C.-Y.S. and X.-Y.H.; writing—review and editing, Y.-H.M.; funding acquisition, X.-Y.H. and Y.-H.M. All authors have read and agreed to the published version of the manuscript.
Funding
This work was supported by the Major Program of National Nature Science Foundation of China (Grant No. 51991393), the National Key Research and Development Plan of China (Grant No. 2017YFC1500705), the National Key R&D Program of China (Grant No. 2019YFE0112500), the Natural Science Foundation of Guangdong Province (Grant No. 2016A030313544), the National Nature Science Foundation of China (Grant No. 51578168).
Institutional Review Board Statement
Not applicable.
Informed Consent Statement
Not applicable.
Data Availability Statement
The raw/processed data required to reproduce these findings cannot be shared at this time as the data also forms part of an ongoing study.
Conflicts of Interest
The authors declared no potential conflicts of interest with respect to the research, authorship, and/or publication of this article.
References
- Zhou, F.L. Earthquake Energy Absorbing Control on Engineering Structure; Seismological Press: Beijing, China, 1997. [Google Scholar]
- Li, A.Q. Investigation and consideration of seismic isolation and energy dissipation structures in Tohoku earthquake. Eng. Mech. 2012, 29, 69–77. [Google Scholar]
- Yutaka, N.; Tetsuya, H.; Masanobu, H. Report on the effects of seismic isolation methods from the 2011 Tohoku-Pacific Earthquake. Seism. Isol. Prot. Syst. 2011, 2, 57–74. [Google Scholar]
- China Ministry of Transport. High Damper Rubber Bearings for Bridges on Road, JT/T 842-2012; China Communications Press: Beijing, China, 2012.
- Roeder, C.; Stanton, J.; Feller, T. Low-temperature performance of elastomeric bearings. J. Cold Reg. Eng. 1990, 4, 113–132. [Google Scholar] [CrossRef]
- Nakano, O.; Nishi, H.; Shirono, T. Temperature-dependency of base-isolated bearings. In Proceedings of the Second U.S-Japan Workshop on Earthquake Protective Systems for Bridges, Technical Memorandum, Tsukuba Science City, Japan, 7–8 December 1992; Public Works Research Institute: Tsukuba Science City, Japan, 1993. [Google Scholar]
- Kim, D.K.; Mander, J.; Chen, S. Temperature and strain rate effects on the seismic performance of elastomeric and lead-rubber bearings. In Proceedings of the Fourth World Congress on Joint Sealants and Bearing Systems for Concrete Structures, Sacramento, CA, USA, 29 September–3 October 1996. [Google Scholar]
- Liu, W.G.; Zhuang, X.Z.; Zhou, F.L.; Feng, D.T.; Kato, Y. Dependence and durability properties of Chinese lead plug rubber bearings. Earthq. Eng. Eng. Vib. 2002, 22, 114–120. [Google Scholar]
- Yakut, A.; Yura, J.A. Evaluation of Elastomeric Bearing Performance at Low Temperatures. J. Struct. Eng. 2002, 128, 995–1002. [Google Scholar] [CrossRef]
- Yakut, A.; Yura, J.A. Parameters Influencing Performance of Elastomeric Bearings at Low Temperatures. J. Struct. Eng. 2002, 128, 986–994. [Google Scholar] [CrossRef]
- Li, H.; Du, Y.F.; Di, S.K.; Tu, J.M.; Yang, W.X.; Li, Q.F. Cyclic test of laminated rubber damping bearing at low temperature and calculation of equivalent viscous damping ratio. J. Lanzhou Univ. Technol. 2006, 32, 116–119. [Google Scholar]
- Li, L.; Ye, K.; Jiang, Y.C. Thermal effect on the mechanical behavior of Lead-Rubber Bearing. J. Hua Zhong Univ. Sci. Technol. 2009, 26, 1–3. [Google Scholar]
- Fuller, K.; Gough, J.; Thomas, A.G. The effect of low temperature crystallization on the mechanical behavior of rubber. J. Polym. Sci. Part B Polym. Phys. 2010, 42, 2181–2190. [Google Scholar] [CrossRef]
- Shirazi, A. Thermal degradation of the performance of elastomeric bearings for seismic isolation. Ph.D. Thesis, University of California, San Diego, CA, USA, 2010. [Google Scholar]
- Cardone, D.; Gesualdi, G.; Nigro, D. Effects of air temperature on the cyclic behavior of Elastomeric seismic isolators. Bull. Earthq. Eng. 2011, 9, 1227–1255. [Google Scholar] [CrossRef]
- Shen, C.Y.; Zhou, F.L.; Cui, J.; Huang, X.; Zhuang, X.; Ma, Y. Dependency test research of mechanical performance of HDR and its parametric value analysis. Earthq. Eng. Eng. Vib. 2012, 32, 95–103. [Google Scholar]
- Shen, C.Y.; Tan, P.; Cui, J.; Ma, Y.H.; Huang, X.Y.; Wang, C. Experimental study on dependency of the horizontal mechanical property of elastomeric isolators with ultralow hardness. Earthq. Eng. Eng. Vib. 2014, 34, 204–216. [Google Scholar]
- Basit, Q. Low temperature performance of elastomeric bearings in a full size field experience bridge. Master’s Thesis, State University of New York at Buffalo, Buffalo, NY, USA, 2016. [Google Scholar]
- Wang, J.Q.; Xin, W.; Li, Z.; Zhao, Z. Experimental study on vertical pressure dependency about shear properties of lead rubber bearing. Earthq. Eng. Eng. Vib. 2016, 36, 200–206. [Google Scholar]
- Wang, J.Q.; Zhang, Z.Y.; Li, Z. Experimental research on the vertical pressure dependency about shear properties of High Damping Rubber Bearing. J. Railw. Eng. Soc. 2017, 220, 47–117. [Google Scholar]
- Rohola, R.; Rovert, J.T. Numerical evaluation of steel-rubber isolator with single and multiple rubber cores. Eng. Struct. 2019, 198, 1–15. [Google Scholar]
- Zhang, R.J.; Li, A.Q. Experimental study on temperature dependence of mechanical properties of scaled high-performance rubber bearings. Compos. Part B 2020, 190, 107932. [Google Scholar] [CrossRef]
- Rohola, R.; Helder, D.C.; Rbecc, N. Static and dynamic stability analysis of a steel-rubber isolator with rubber cores. Structures 2020, 26, 441–455. [Google Scholar]
- Javad, S.; Mojtaba, F. Natural Rubber Bearing Incorporated with Steel Ring Damper. Int. J. Steel Struct. 2020, 20, 23–34. [Google Scholar]
- Radkia, S.; Rahnavard, R.; Tuwair, H.; Gandomkar, F.A.; Napolitano, R. Investigating the effects of seismic isolators on steel asymmetric structures considering soil-structure interaction. Structures 2020, 27, 1029–1040. [Google Scholar] [CrossRef]
- Sheikhi, J.; Fathi, M.; Rahnavard, R.; Napolitano, R. Numerical analysis of natural rubber bearing equipped with steel and shape memory alloys dampers. Structures 2021, 32, 1839–1855. [Google Scholar] [CrossRef]
- Masahiko, H.; Shin, O. Response Control. and Seismic Isolation of Buildings; Taylor & Francis Press: London, UK; New York, NY, USA, 2005. [Google Scholar]
- Bridgestone Corporation Seismic Isolation Products & Engineering Development. In Technical Report: High.-Damping Rubber Bearings for Base Isolation; Product Code: HDR-X0.6R; Yokohama, Japan, 2010.
- International Standardization Organization. Elastomeric Seismic-Protection Isolators-Part. 1: Test. Methods. ISO 22762-1; ISO: Geneva, Switzerland, 2005. [Google Scholar]
- The Society of Architecture of Japan. Recommendation for the Design of Base Isolated Buildings; Gihodo Shuppan Co., Ltd.: Tokyo, Japan, 2001. [Google Scholar]
- Shen, C.Y.; Ma, Y.H.; Zhuang, X.Z.; Chen, Y.Y.; Lin, J.; Wang, S.B. Experimental Research on dependencies of mechanical property of elastomeric isolator with lower hardness and parameters analysis. Appl. Mech. Mater. 2012, 166–169, 2982–2994. [Google Scholar] [CrossRef]
- International Standardization Organization. Elastomeric Seismic-Protection Isolators-Part 3: Applications for Buildings—Specifications. ISO 22762-3; ISO: Geneva, Switzerland, 2005. [Google Scholar]
Figure 1.
Details of isolator: (a) planar view (LRB); (b) top-down view (LRB); (c) planar view (SHDR); (d) top-down view (SHDR).
Figure 1.
Details of isolator: (a) planar view (LRB); (b) top-down view (LRB); (c) planar view (SHDR); (d) top-down view (SHDR).

Figure 2.
Meanings of , , and in the hysteresis loop of bearing.

Figure 3.
Test equipment and isolator used for testing. (a) Top-down view of test equipment; (b) LRB in testing; (c) SHDR in testing.
Figure 3.
Test equipment and isolator used for testing. (a) Top-down view of test equipment; (b) LRB in testing; (c) SHDR in testing.

Figure 4.
The mechanic properties of the bearings under different conditions: (a) LRB; (b) SHDR.

Figure 5.
The mechanic properties of the bearings under different conditions: (a) LRB; (b) SHDR.

Figure 6.
The mechanic properties of bearings under different conditions: (a) LRB; (b) SHDR.

Figure 7.
The mechanic properties of bearings under different conditions: (a) LRB; (b) SHDR.

Figure 8.
The mechanic properties of bearings under different condition: (a) LRB; (b) SHDR.

Figure 9.
The test data and fitted curve of LRB and SHDR: (a) for LRB; (b) for LRB; (c) for SHDR; (d) for SHDR.
Figure 9.
The test data and fitted curve of LRB and SHDR: (a) for LRB; (b) for LRB; (c) for SHDR; (d) for SHDR.

Figure 10.
The difference of fitted curve of LRB and SHDR. (a) for LRB; (b) for LRB; (c) for SHDR; (d) for SHDR.
Figure 10.
The difference of fitted curve of LRB and SHDR. (a) for LRB; (b) for LRB; (c) for SHDR; (d) for SHDR.

Figure 11.
The different shear strain hysteresis loops of LRB at different temperature: (a) LRB at 16 °C; (b) LRB at 40 °C.
Figure 11.
The different shear strain hysteresis loops of LRB at different temperature: (a) LRB at 16 °C; (b) LRB at 40 °C.

Figure 12.
The 25% and 100% shear strain hysteresis loops of LRB at different temperatures: (a) LRB at 16 °C; (b) LRB at 40 °C.
Figure 12.
The 25% and 100% shear strain hysteresis loops of LRB at different temperatures: (a) LRB at 16 °C; (b) LRB at 40 °C.


Table 1.
Detailed structures of LRB or SHDR.
| Effective Side Length of Square (mm) | Shear Modulus of Inner Rubber (MPa) | Diameter of Lead (mm) | Number of Layers of Inner Rubber | Thickness of Single Inner Rubber (mm) | Thickness of Single Inner Steel (mm) | Thickness of Cover Rubber (mm) | Thickness of Cover Steel (mm) |
|---|---|---|---|---|---|---|---|
| 300 | 0.8/1.0/1.2 | 4 × 42.5 | 7 | 6 | 3.8 | 10 | 20 |
Table 2.
Test program.
| Test Case | Specimen | Values Used for Factors | |
|---|---|---|---|
| LRB | SHDR | ||
| Different frequency of loading | 300 × 300 (G0.8) | 300 × 300 (G0.8) | 0.05 Hz, 0.25 Hz |
| Different sequence of loading | 300 × 300 (G0.8) | 300 × 300 (G0.8) | Shear strain increasing or decreasing |
| Different pressure | 300 × 300 (G0.8) | 300 × 300 (G0.8) | 6 MPa, 12 MPa |
| Different shear modulus of inner rubber | 300 × 300 (G0.8/G1.0/G1.2) | 300 × 300 (G0.8/G1.0/G1.2) | 0.8 MPa, 1.0 Mpa, 1.2 MPa |
| Different temperature | 300 × 300 (G0.8) | 300 × 300 (G0.8) | 16 °C, 40 °C |
| Shear strain | 25%, 50%, 100%, 150%, 175%, 200% | ||
Publisher’s Note: MDPI stays neutral with regard to jurisdictional claims in published maps and institutional affiliations. |
© 2021 by the authors. Licensee MDPI, Basel, Switzerland. This article is an open access article distributed under the terms and conditions of the Creative Commons Attribution (CC BY) license (https://creativecommons.org/licenses/by/4.0/).
Share and Cite
MDPI and ACS Style
Shen, C.-Y.; Huang, X.-Y.; Chen, Y.-Y.; Ma, Y.-H. Factors Affecting the Dependency of Shear Strain of LRB and SHDR: Experimental Study. Actuators 2021, 10, 98. https://0-doi-org.brum.beds.ac.uk/10.3390/act10050098
AMA Style
Shen C-Y, Huang X-Y, Chen Y-Y, Ma Y-H. Factors Affecting the Dependency of Shear Strain of LRB and SHDR: Experimental Study. Actuators. 2021; 10(5):98. https://0-doi-org.brum.beds.ac.uk/10.3390/act10050098
Chicago/Turabian StyleShen, Chao-Yong, Xiang-Yun Huang, Yang-Yang Chen, and Yu-Hong Ma. 2021. "Factors Affecting the Dependency of Shear Strain of LRB and SHDR: Experimental Study" Actuators 10, no. 5: 98. https://0-doi-org.brum.beds.ac.uk/10.3390/act10050098
Note that from the first issue of 2016, this journal uses article numbers instead of page numbers. See further details here.