Quasi-3D Aerodynamic Analysis Method for Blended-Wing-Body UAV Configurations


1
UAV Integrated Research Center, Center for Interdisciplinary Research and Innovation, Aristotle University of Thessaloniki, 57001 Thermi, Greece
2
Laboratory of Fluid Mechanics and Turbomachinery, Department of Mechanical Engineering, Aristotle University of Thessaloniki, 54124 Thessaloniki, Greece
*
Author to whom correspondence should be addressed.
Aerospace 2021, 8(1), 13; https://0-doi-org.brum.beds.ac.uk/10.3390/aerospace8010013
Submission received: 17 December 2020
/
Revised: 30 December 2020
/
Accepted: 31 December 2020
/
Published: 6 January 2021
Abstract
:The current study presents a low-fidelity, quasi-3D aerodynamic analysis method for Blended-Wing-Body (BWB) Unmanned Aerial Vehicle (UAV) configurations. A tactical BWB UAV experimental prototype is used as a reference platform. The method utilizes 2D panel method analyses and theoretical aerodynamic calculations to rapidly compute lift and pitching moment coefficients. The philosophy and the underlying theoretical and semi-empirical equations of the proposed method are extensively described. Corrections related to control surfaces deflection and ground effect are also suggested, so that the BWB pitching stability and trimming calculations can be supported. The method is validated against low-fidelity 3D aerodynamic analysis methods and high-fidelity, Computational Fluid Dynamics (CFD) results for various BWB configurations. The validation procedures show that the proposed method is considerably more accurate than existing low-fidelity ones, can provide predictions for both lift and pitching moment coefficients and requires far less computational resources and time when compared to CFD modeling. Hence, it can serve as a valuable aerodynamics and stability analysis tool for BWB UAV configurations.
1. Introduction
Following the research advances in aviation during the 21st century, various technologies have been developed for commercial airliner jets, in an attempt to enhance the aerodynamic efficiency and performance specifications of the well-established, tube-and-wing configuration [1]. This design philosophy, which is almost a century old, guarantees a reliable combination of performance, stability and compliance with the aviation regulations and, as such, is ideal for commercial airliner platforms [2]. However, its shape has some inherent limitations in terms of aerodynamics and performance [3], therefore, to keep up with the targets for enhanced performance specifications and reduced fuel burn set in the last decades [4], novel technologies constantly emerge, including configurations, flow control techniques and propulsion architectures.
Those technologies can also be applied to other applications as well, such as fixed-wing Unmanned Aerial Vehicles (UAVs), possibly unlocking a new aerodynamic efficiency and performance enhancement potential. The figures of the booming, multi-billion, UAV market [5], can arguably support the effort of investing towards this potential, since a more efficient UAV is more likely to have an advantage in the market, for example, in terms of flight time and payload capacity [6]. On top of that, the absence of humans on board means that the strict regulations do not apply, meaning that more innovative layouts can be considered for investigation and the impact of novel technologies can be fully exploited.
Taking those technologies and investigating their effect on an unconventional fixed-wing UAV platform is the primary goal of the EURRICA (Enhanced Unmanned aeRial vehicle platfoRm using integrated Innovative layout Configurations And propulsion technologies) project. More specifically, EURRICA is a research project supported by the Hellenic Foundation for Research and Innovation (H.F.R.I.) under the “2nd Call for H.F.R.I. Research Projects to support Post-Doctoral Researchers” in Greece. Novel configuration layouts, flow control techniques and propulsion architectures are considered for evaluation in terms of aerodynamic efficiency and performance enhancement potential for fixed-wing UAV applications. The reference platform is based on the innovative Blended-Wing-Body (BWB) layout, as it is arguably one of the most promising alternatives to the tube-and-wing configuration layout, offering a 30% increase in terms of aerodynamic efficiency (Lift-to-drag, L/D) and a corresponding enhancement in terms of performance and fuel burn [7,8]. Its unique streamlined shape also leads in a considerable increase in internal volume, which means that various payload components can be installed, not to mention the potential for larger fuel tanks or Hybrid-Electric Propulsion Systems (HEPS) [9]. At the same time, the large internal volume increases the versatility of the platform, by allowing the installation of various combinations of payload components, depending on the mission profile of the UAV.
The investigation of novel technologies is conducted at the initial stages of the design and, more specifically, during the conceptual design phase [3]. Therefore, rapid and accurate methods are required for the prediction of aerodynamic and stability coefficients, as well as for the facilitation of performance calculations. Concerning the latter, an in-house tool has been developed, which is based on well-established textbook methods [3,10,11]. It can be used to quickly evaluate layout changes and assess their impact on the performance and is fully compliant with the corresponding airworthiness regulations [1,8,12]. However, when it comes to the rapid prediction of aerodynamic and stability coefficients for a BWB UAV, the available literature is considerably more limited and commercial-airliner-oriented.
Existing analysis methods and codes [3,10,13] can provide accurate and reliable results for conventional configurations. Investigating a BWB configuration, though, is considerably more challenging, due to its inherently complex design. References [14,15] utilize a low-fidelity panel method for the inverse design of a BWB aircraft wing twist, towards the optimization of spanwise loading distribution. Reference [16] utilizes a mean surface panel method (WINGBODY) and an actual surface panel method (PANAIR) to investigate the low Mach load cases of a transonic BWB aircraft. Reference [17] integrates a Vortex Lattice Method (VLM) and a first order panel method into a tool calculating a BWB aircraft’s controllability. Reference [18] combines a VLM code for lift, induced drag and moment calculations, a friction code for friction and form drag calculations and the Korn equation for wave drag, while employing CFD for optimization and inverse design procedures. A particularly thorough investigation on low-fidelity, “quasi-3D” aircraft design methods applied on the design of BWB aircraft, has materialized through the Silent Aircraft initiative, as documented throughout its course in References [19,20,21]. These studies employ the vortex lattice code AVL for airfoil twist design and the MSES v3.02 code for the design and analysis of airfoils at the compressible and viscous regime, as well as the estimation of wave drag. One common characteristic of the aforementioned studies is that the proposed low-fidelity employed methods are aimed at specialized applications and not at a general treatment of the conceptual design as a whole. References [14,15,17] present the application of their method on some specific tasks, such as inverse twist design and do not describe a complete aerodynamic and stability analysis, let alone the underlying methodology. On the other hand, references [16,18,19,20,21] mainly deal with commercial airliner platforms where the Reynolds numbers are relatively high (between 1 × 10⁷ and 5 × 10⁷ [1,3]) when compared to smaller-scale aircraft and UAVs (ranging from 1 × 10⁵ to 2 × 10⁶ [8,22,23]). Most importantly, though, the flow examined in those articles is compressible. This in turn allows the use of specific methods and assumptions [24], which are not suitable when a BWB UAV configuration is considered. Another common issue of these studies is the deviation between the proposed methods and the CFD modeling results. What is more, the pitching moment prediction is either inaccurate or not conducted at all. In a configuration such as the BWB, though, investigating the aerodynamic features cannot be conducted independently of the pitching stability. The aerodynamic efficiency and performance specifications of a BWB UAV are derived using both lift and pitching moment data, since they both affect critical parameters such as operating angle of attack and control surfaces trimming. The aforementioned comments lead into the conclusion that no rapid, low-fidelity, aerodynamic analysis method exists for BWB UAV configurations, whereas the existing methods fail to accurately predict the pitching moment coefficients for BWB configuration in general, be it commercial airliner or UAV. For example, existing low-fidelity methods cannot be used to conduct a trimming analysis, which is arguably one of the most important tasks during the conceptual design phase [3].
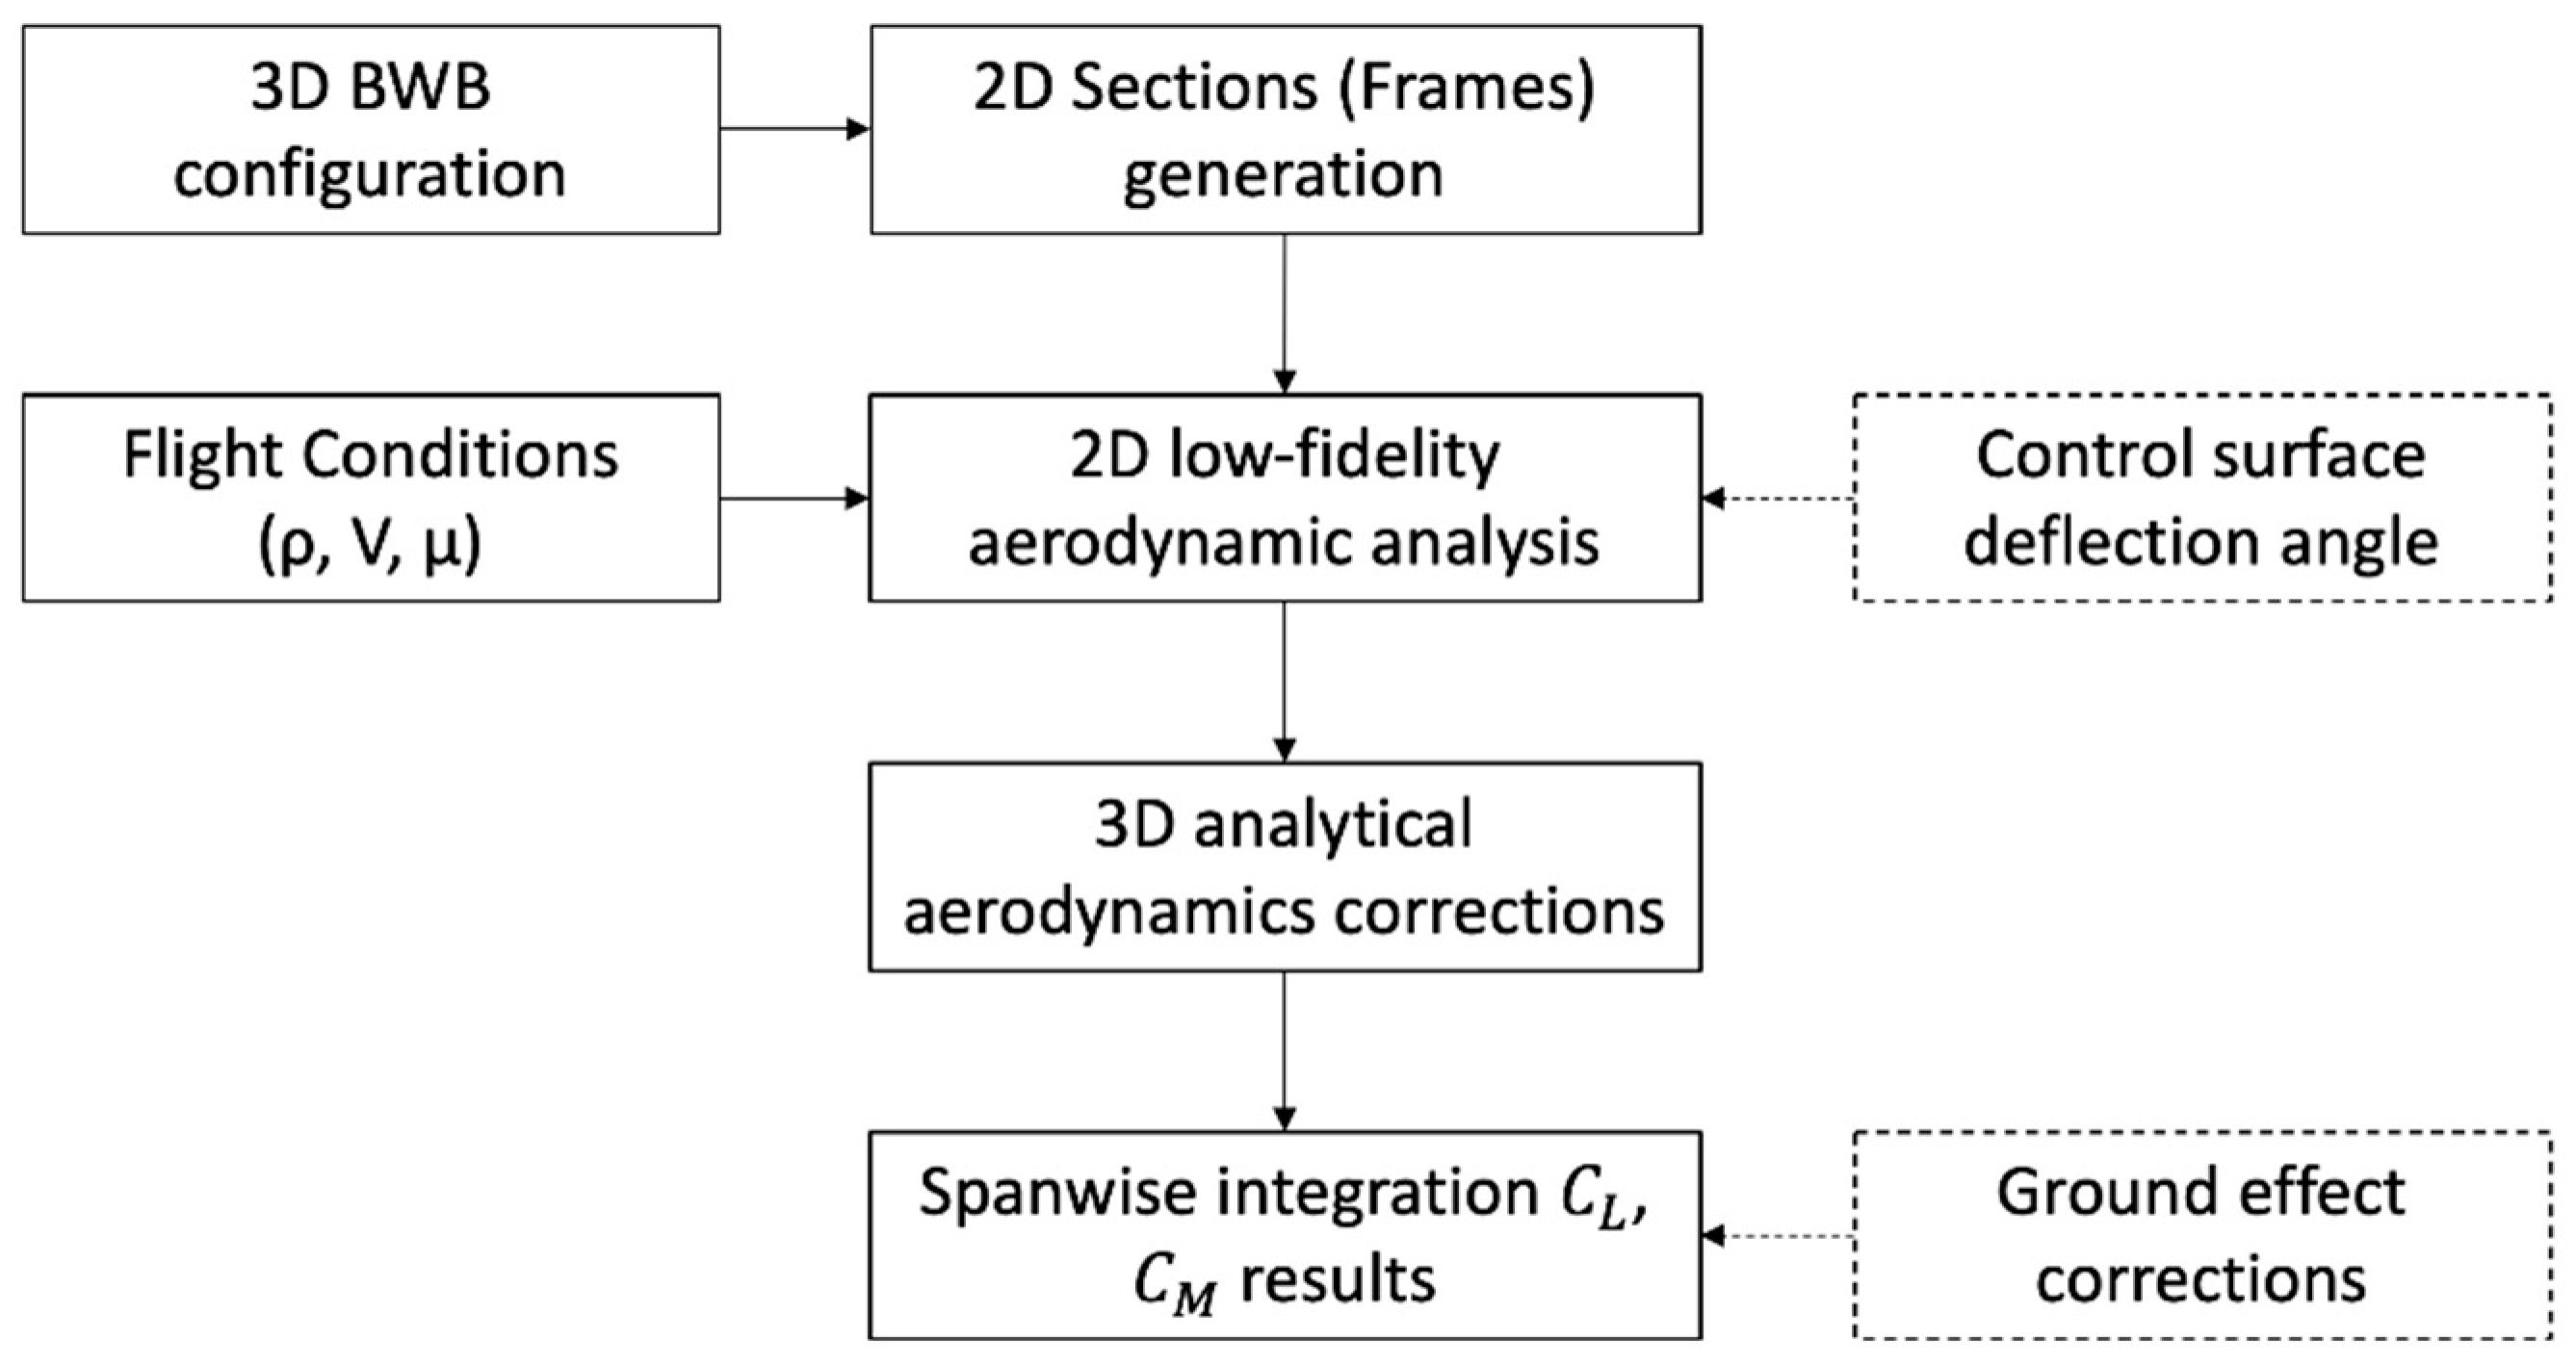
The current paper proposes a low-fidelity method that predicts the lift and pitching moment coefficients of a BWB UAV, while demanding far less computational time and resources when compared to CFD modeling. At the same time, it is far more accurate when compared to existing low-fidelity tools. The general philosophy of the method is presented in Figure 1. It is based on a spanwise (i.e., along the Y axis) division of the BWB configuration into several XZ-plane cross-sections (airfoils). The 2D behavior of each airfoil is calculated using the XFOIL code [13] and, following a series of theoretical (textbook) aerodynamics relations, the 3D lift, drag and moment coefficients are derived. The effect of the control surfaces is also taken into account using dedicated relations, whereas ground effect corrections are proposed to allow the evaluation of takeoff and landing flight segments. A step-by-step presentation of the underlying philosophy and the governing equations is made, followed by a comparison with existing high- and low-fidelity tools. It should be noted at this point that the aim of this study is to develop a method capable of investigating BWB UAV configurations in general and not just the EURRICA one, which serves as a reference configuration. Hence, apart from the main reference platform, a set of published data for BWB UAV configurations is also used for validation purposes, to display the versatility and the limitations of the proposed method.
2. Reference Platform
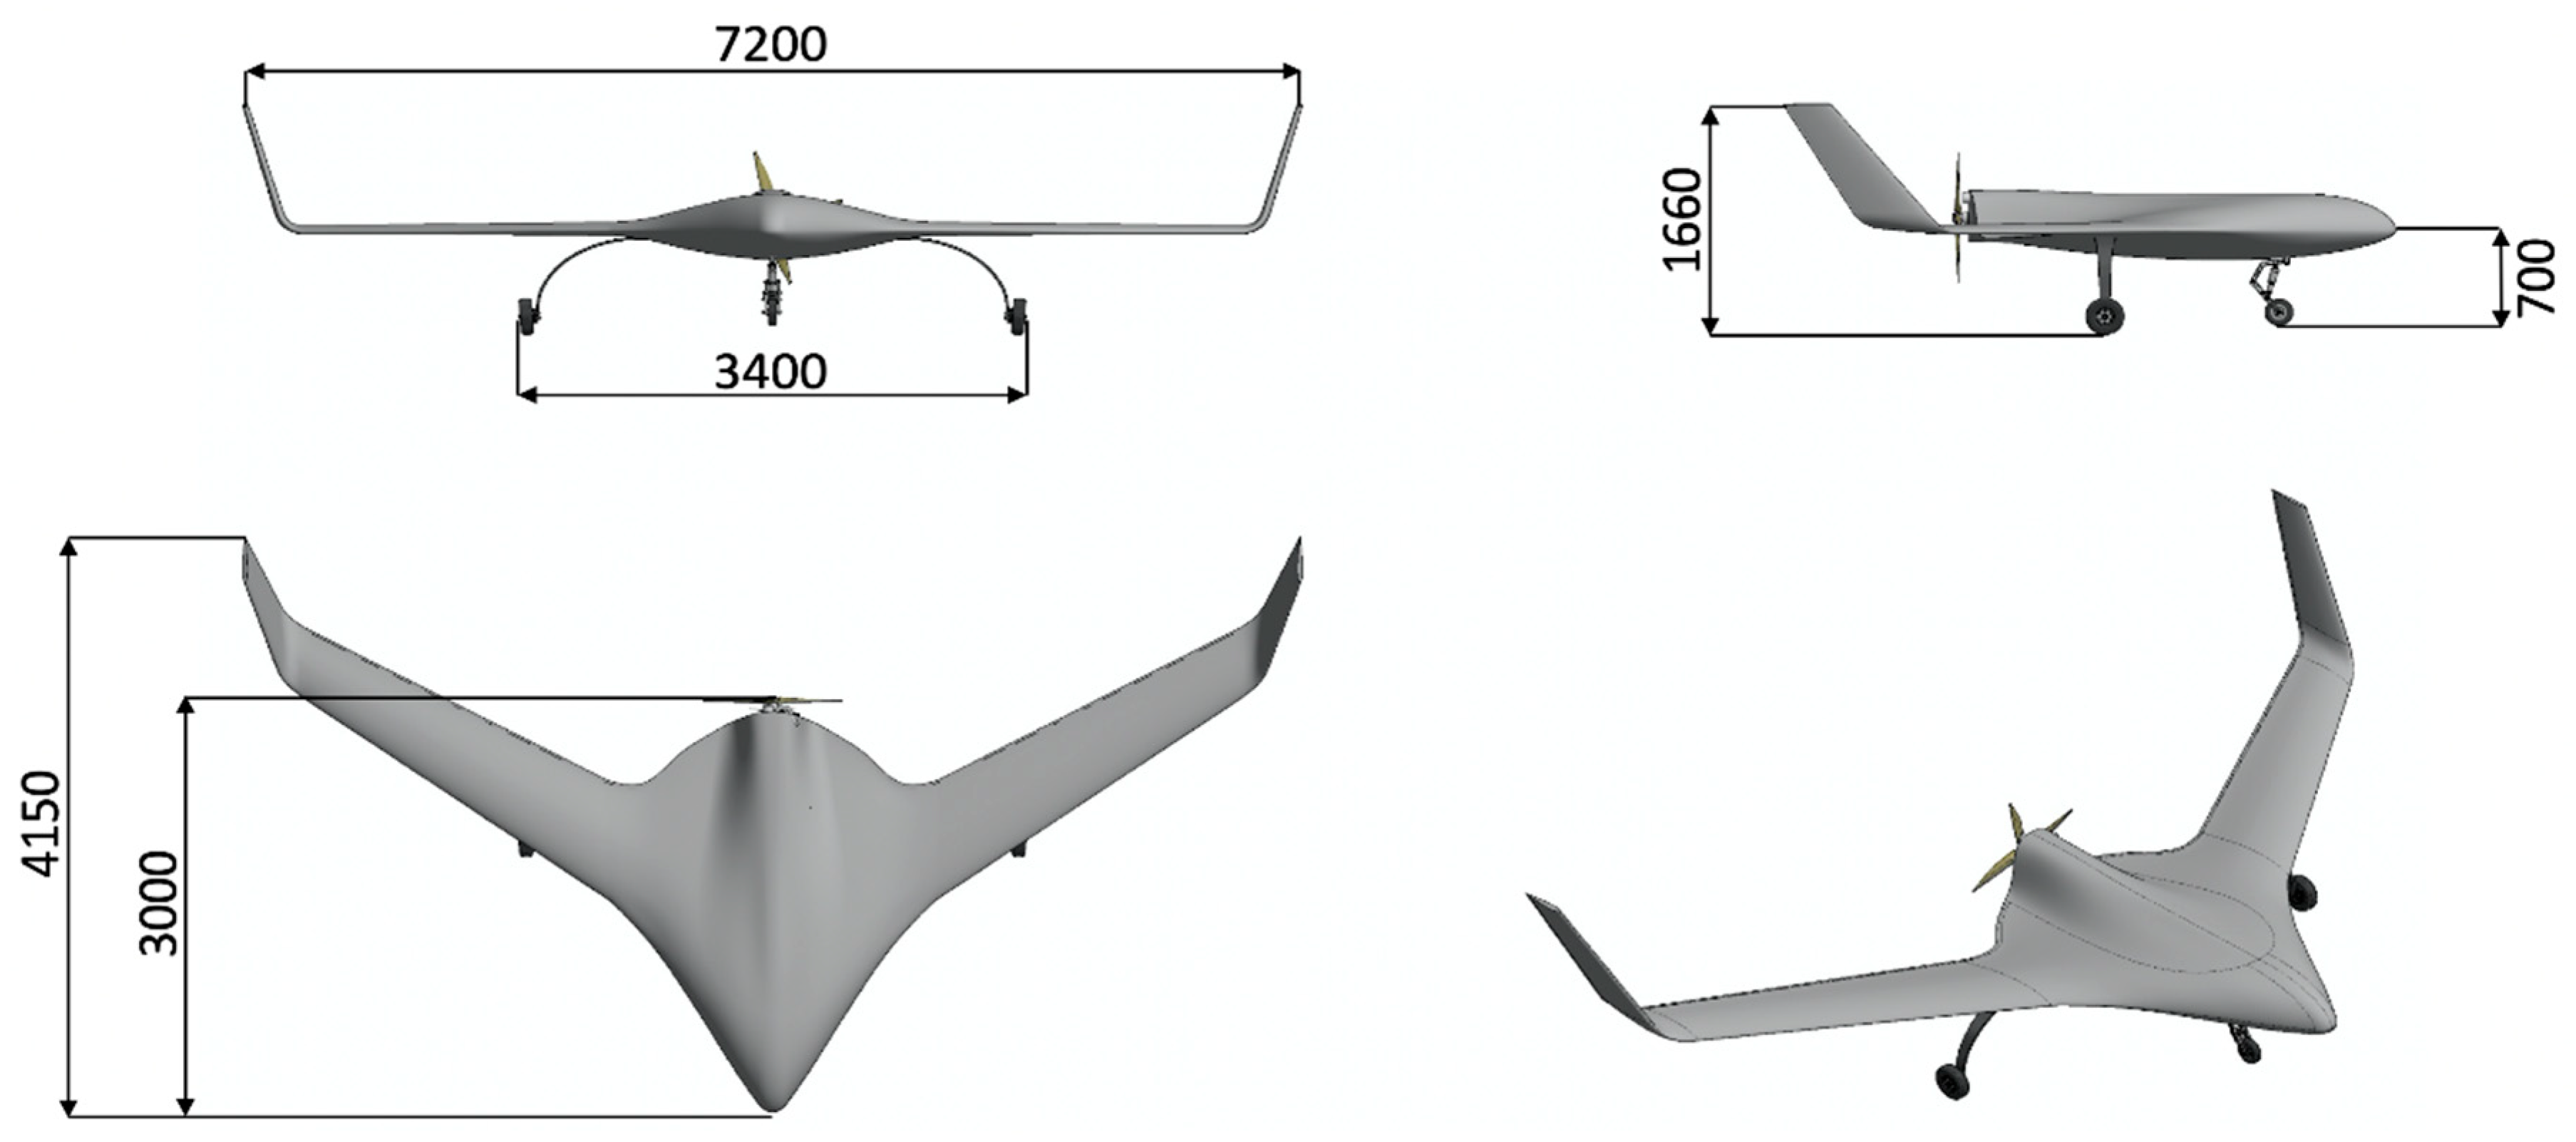
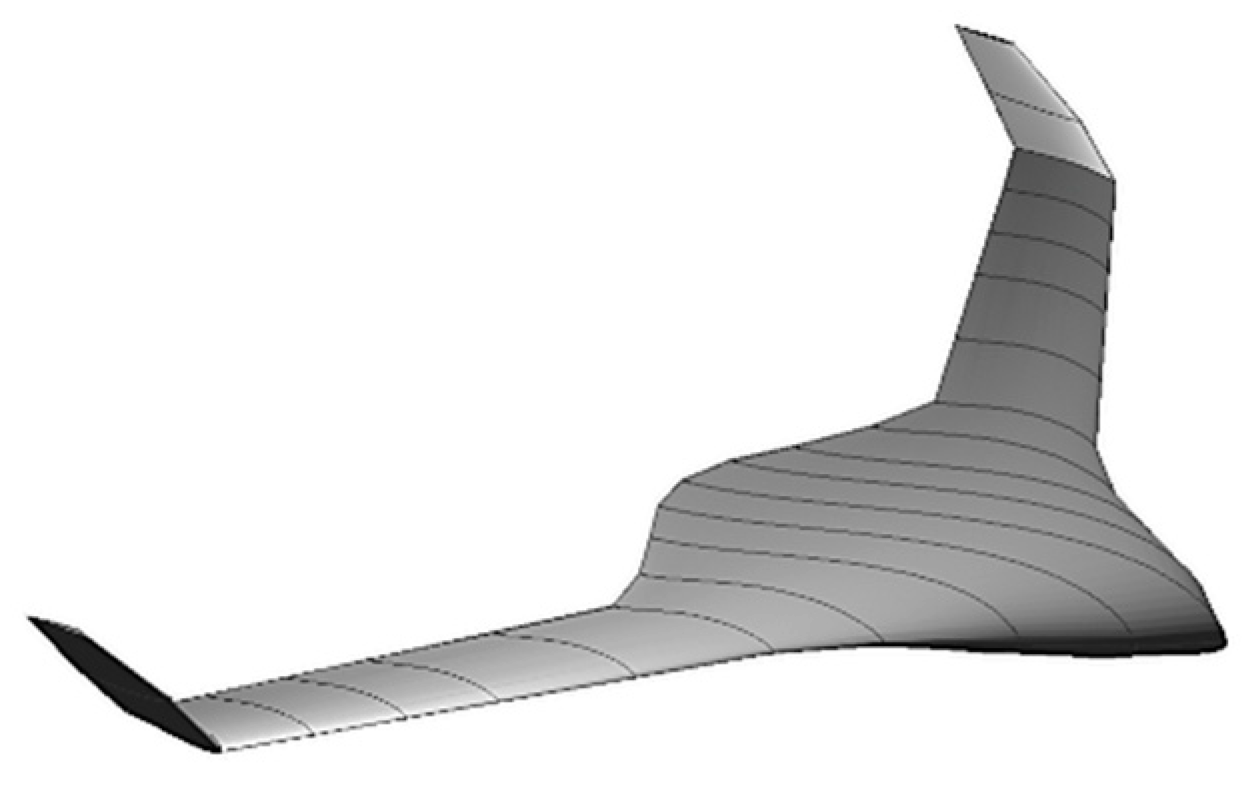
The reference platform for the current study is a fixed-wing, tactical BWB UAV configuration. The configuration resembles the DELAER RX-3 prototype, which has been developed following a dedicated conceptual and preliminary design study [8,25], backed by applied aerodynamics investigations and parametric studies [26] conducted at the Laboratory of Fluid Mechanics and Turbomachinery (LFMT), at the Faculty of Mechanical Engineering, at the Aristotle University of Thessaloniki (AUTH), in Greece. The layout design and sizing, as well as the aerodynamic, stability and performance analyses have been conducted according to well-established design methods, using dedicated in-house tools, whereas the entire development procedure is compliant with the corresponding airworthiness regulations. The RX-3 is equipped with a 53hp Wankel-cycle, water-cooled, engine in a pusher configuration and has the vertical stabilizers located at the winglets. The external layout is presented in Figure 2, whereas more details about the configuration, such as airfoil profiles, can be found in References [8,25]. The operating specifications of the reference platform resemble those of tactical UAVs (Table 1), as the latter are described in References [8,27,28,29].
Note that, based on the work presented in Reference [28] two different scenarios are defined, that is, a short- and a long-endurance. Scenario I corresponds to the short-endurance one and features a large payload capacity, fit for search and rescue missions. On the other hand, Scenario II covers Intelligence, Surveillance and Reconnaissance (ISR) related missions, where a part of the useful payload is replaced with extra fuel for long-endurance flights.
3. Proposed Quasi-3D Method
In the current section a step-by-step presentation of the proposed method is made. More specifically, the steps can be listed as follows:
- Definition of the inputs related to geometric and flight conditions
- 2D rapid solver
- 3D analytical corrections
- Additional corrections related to control surfaces deflection and ground effect
3.1. Geometric and Flight Conditions Inputs
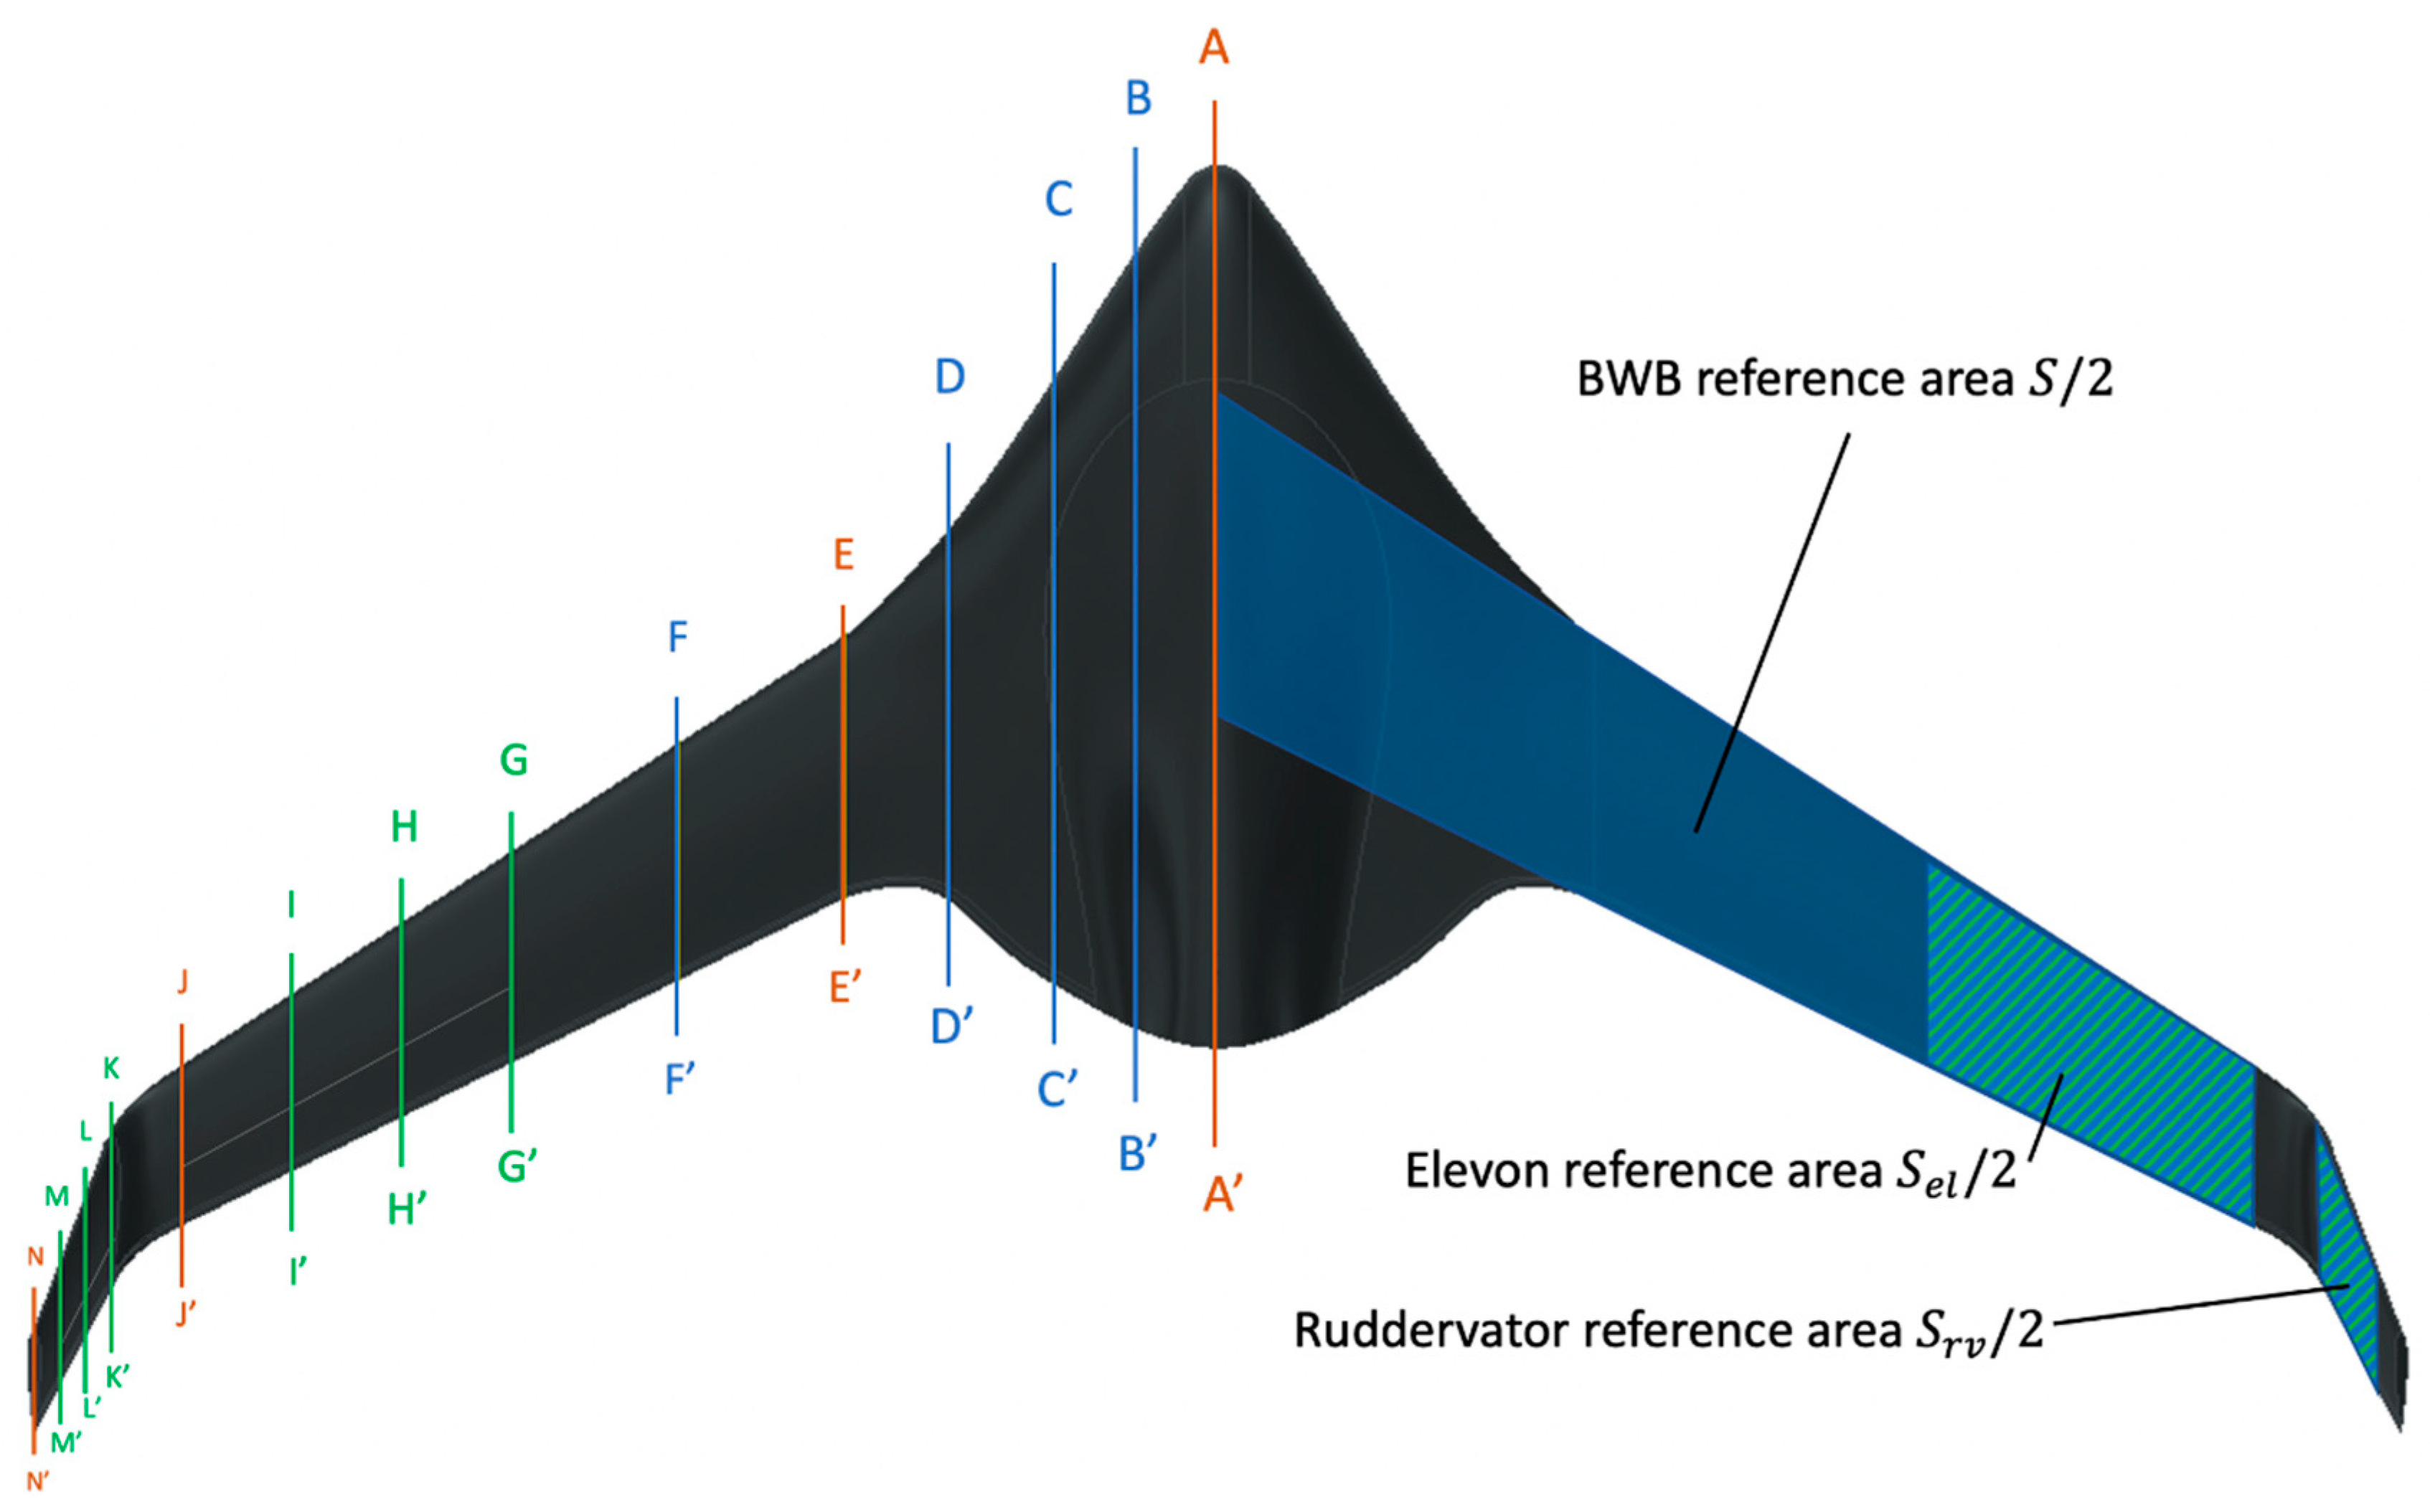
As shown in Figure 3, the basic inputs of the proposed quasi-3D method are divided into two categories: geometric data and flight conditions. The most critical geometric data are the 2D sections topology (airfoil types) constituting the wing and their spanwise positions, followed by the span, twist, sweep and reference area of the wing. These data can accurately be extracted from the 3D CAD model of the UAV. Some of the airfoil sections are selected during the design of the reference platform and their geometry is a-priori known. In the present study, this is the case with the root (y/b = 0), kink (y/b = 0.32), tip (y/b = 1) and winglet airfoils [25].
The rest of the sections are generated through lofting, therefore their topology is taken from the 3D CAD model and translated into custom “point clouds,” one for each airfoil section. The flight conditions refer to air density and viscosity, flight velocity and angle of attack. Note that, for each 2D section, both the UAV angle of attack and the local incidence angle of each section due to wing twist, are accounted for.
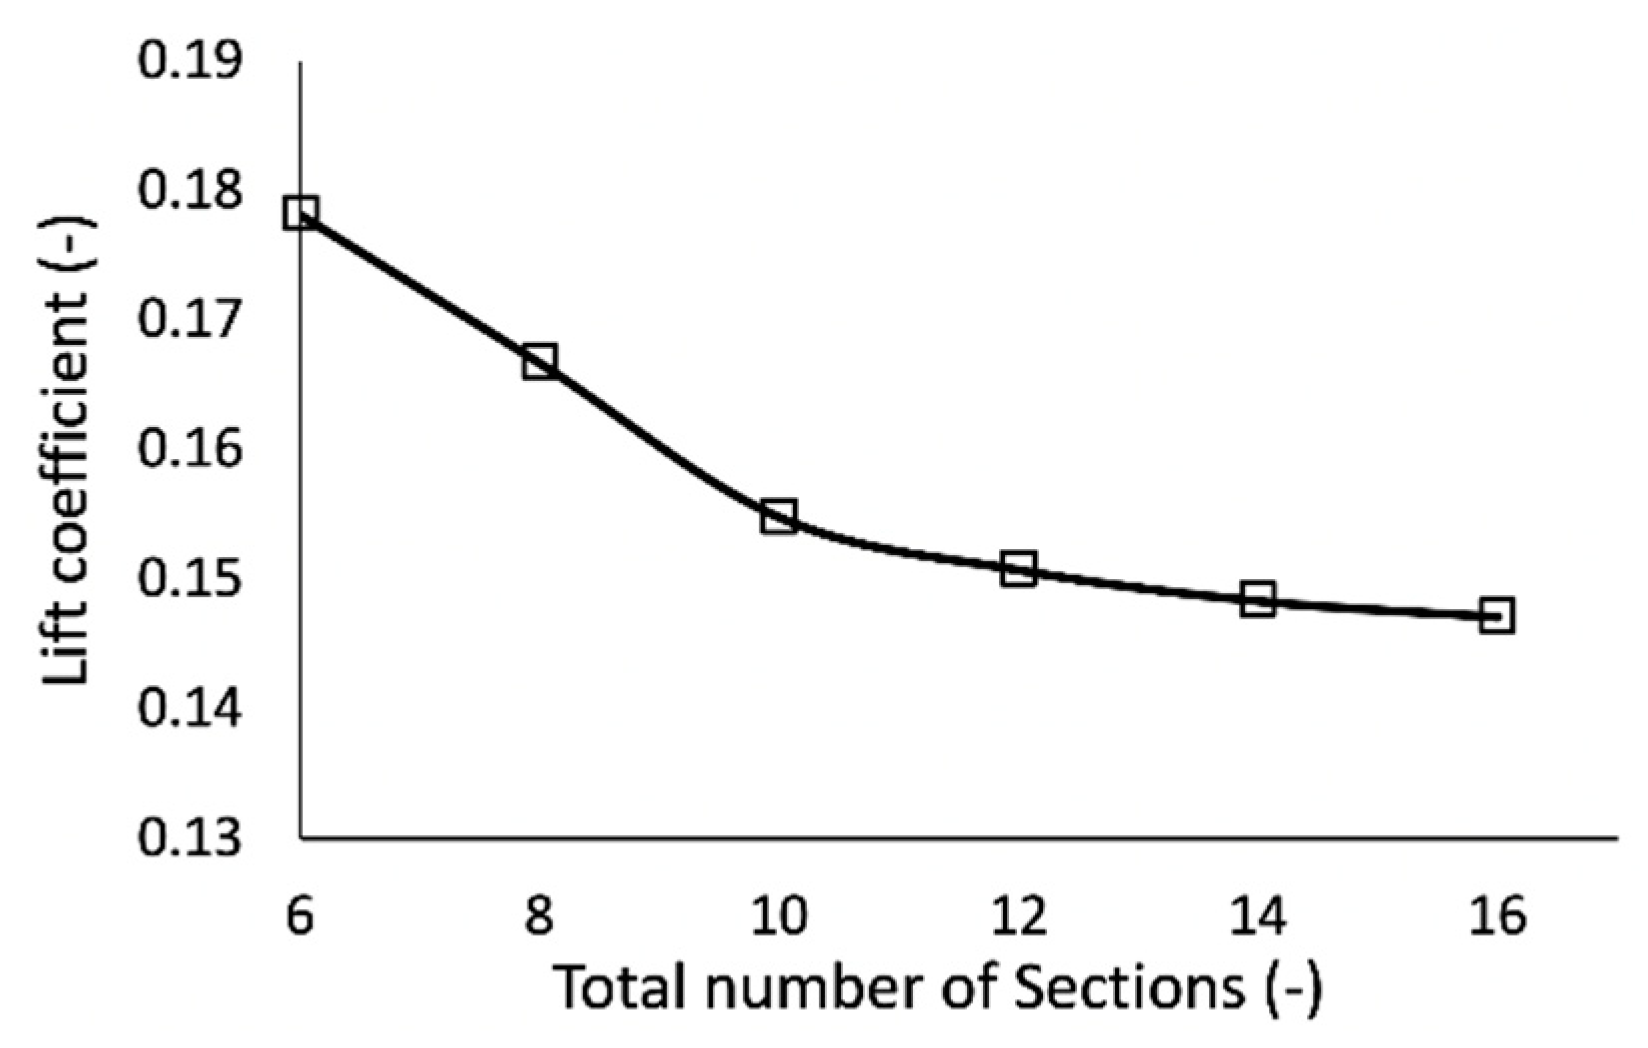
After all the corresponding inputs have been defined, the BWB configuration is divided into a number of 2D sections (Figure 3). As expected, the accuracy of the results increases with the number of sections. More specifically, a dedicated parametric study (Figure 4) showed that a number of 14 sections is the optimal choice for the reference BWB UAV configuration, as the percentage deviation when comparing the proposed method and the corresponding CFD results is 0.5% and 7.3% for lift and moment coefficient, respectively. Indicatively, dividing the BWB in 16 sections leads in an increase in prediction accuracy of less than 1% (when comparing lift coefficient prediction accuracy between 14 and 16 sections).
3.2. 2D Low-Fidelity Solver
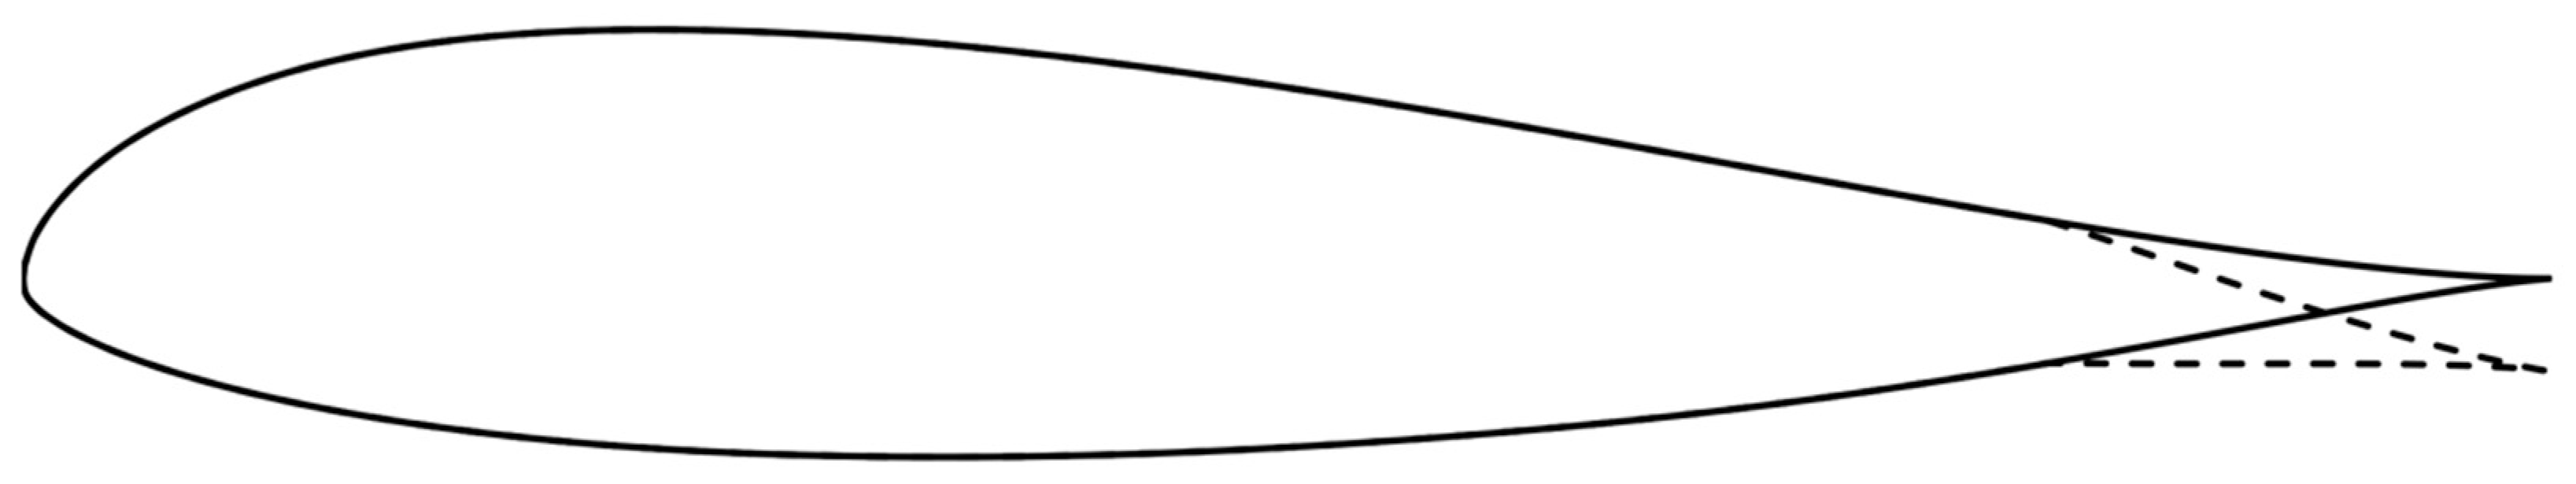
For the 2D analyses, the XFOIL code is employed. It is a well-established, 2D, low-fidelity aerodynamic analysis tool and its results have been validated against experimental results [13]. The airfoil geometry is generated using a cloud of points and, more specifically, their Cartesian (x,y) coordinates, as shown in Figure 5. The coordinates are normalized using the local airfoil chord. Control surfaces can in turn be defined at every desired airfoil frame, by specifying a deflection angle and a chord length, as a percentage of the frame (Figure 5).
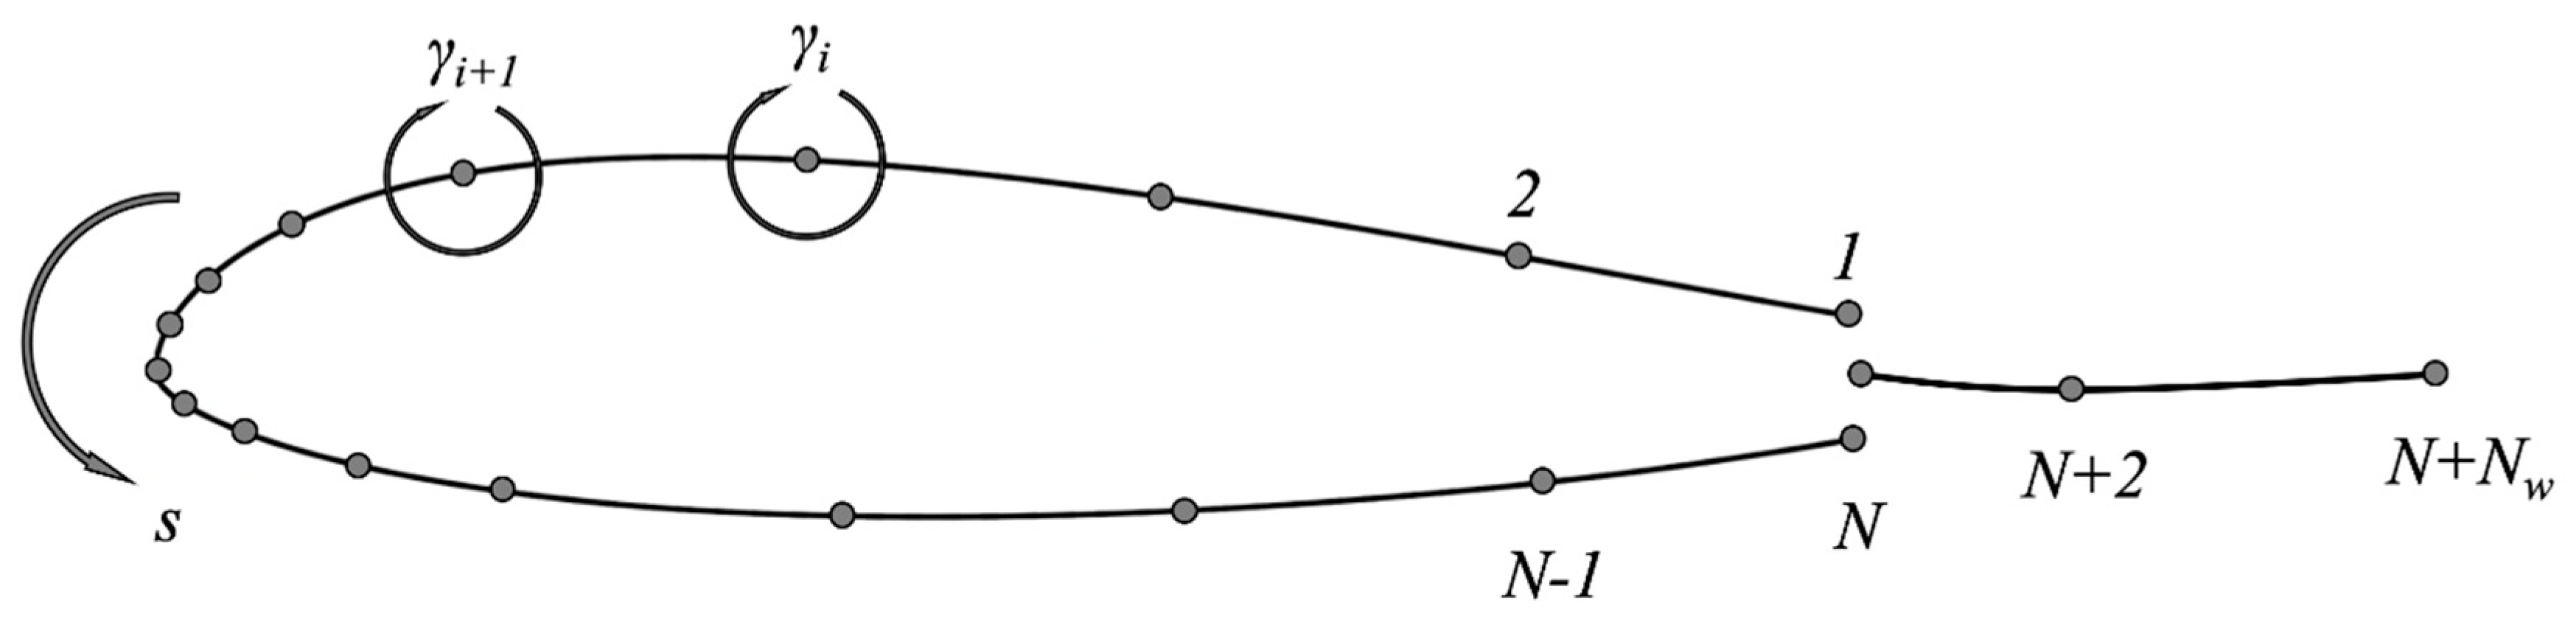
XFOIL code uses a panel method analysis, based on the assumption that a two-dimensional airfoil can be generated by combining a freestream flow, a vortex sheet of strength γ on the airfoil surface and a source sheet of strength σ on the airfoil surface and wake (Figure 6). The airfoil contour and wake trajectory are discretized into flat panels, with N panel nodes on the airfoil and Nw nodes on the wake. Depending on the type of the trailing edge (finite or smooth), a slightly different approach is applied for the source strength σTE and vortex strength γTE [30]. The stream-function is in turn set equal to some constant value Ψ0 at each node on the airfoil, whereas the Kutta condition is also employed [31].
The corresponding airfoil stream function is shown in Equation (1), where s is the coordinate along the vortex and source sheets, r is the magnitude of the vector between the point at s and the field point x, y, θ is the vector’s angle and q∞cosα, q∞sinα are the freestream velocity components [13,31]. For the N node values γi and the airfoil surface stream-function a linear (N + 1) × (N + 1) system is defined. The above methodology is slightly adjusted for viscous flows, including the boundary layer equations.
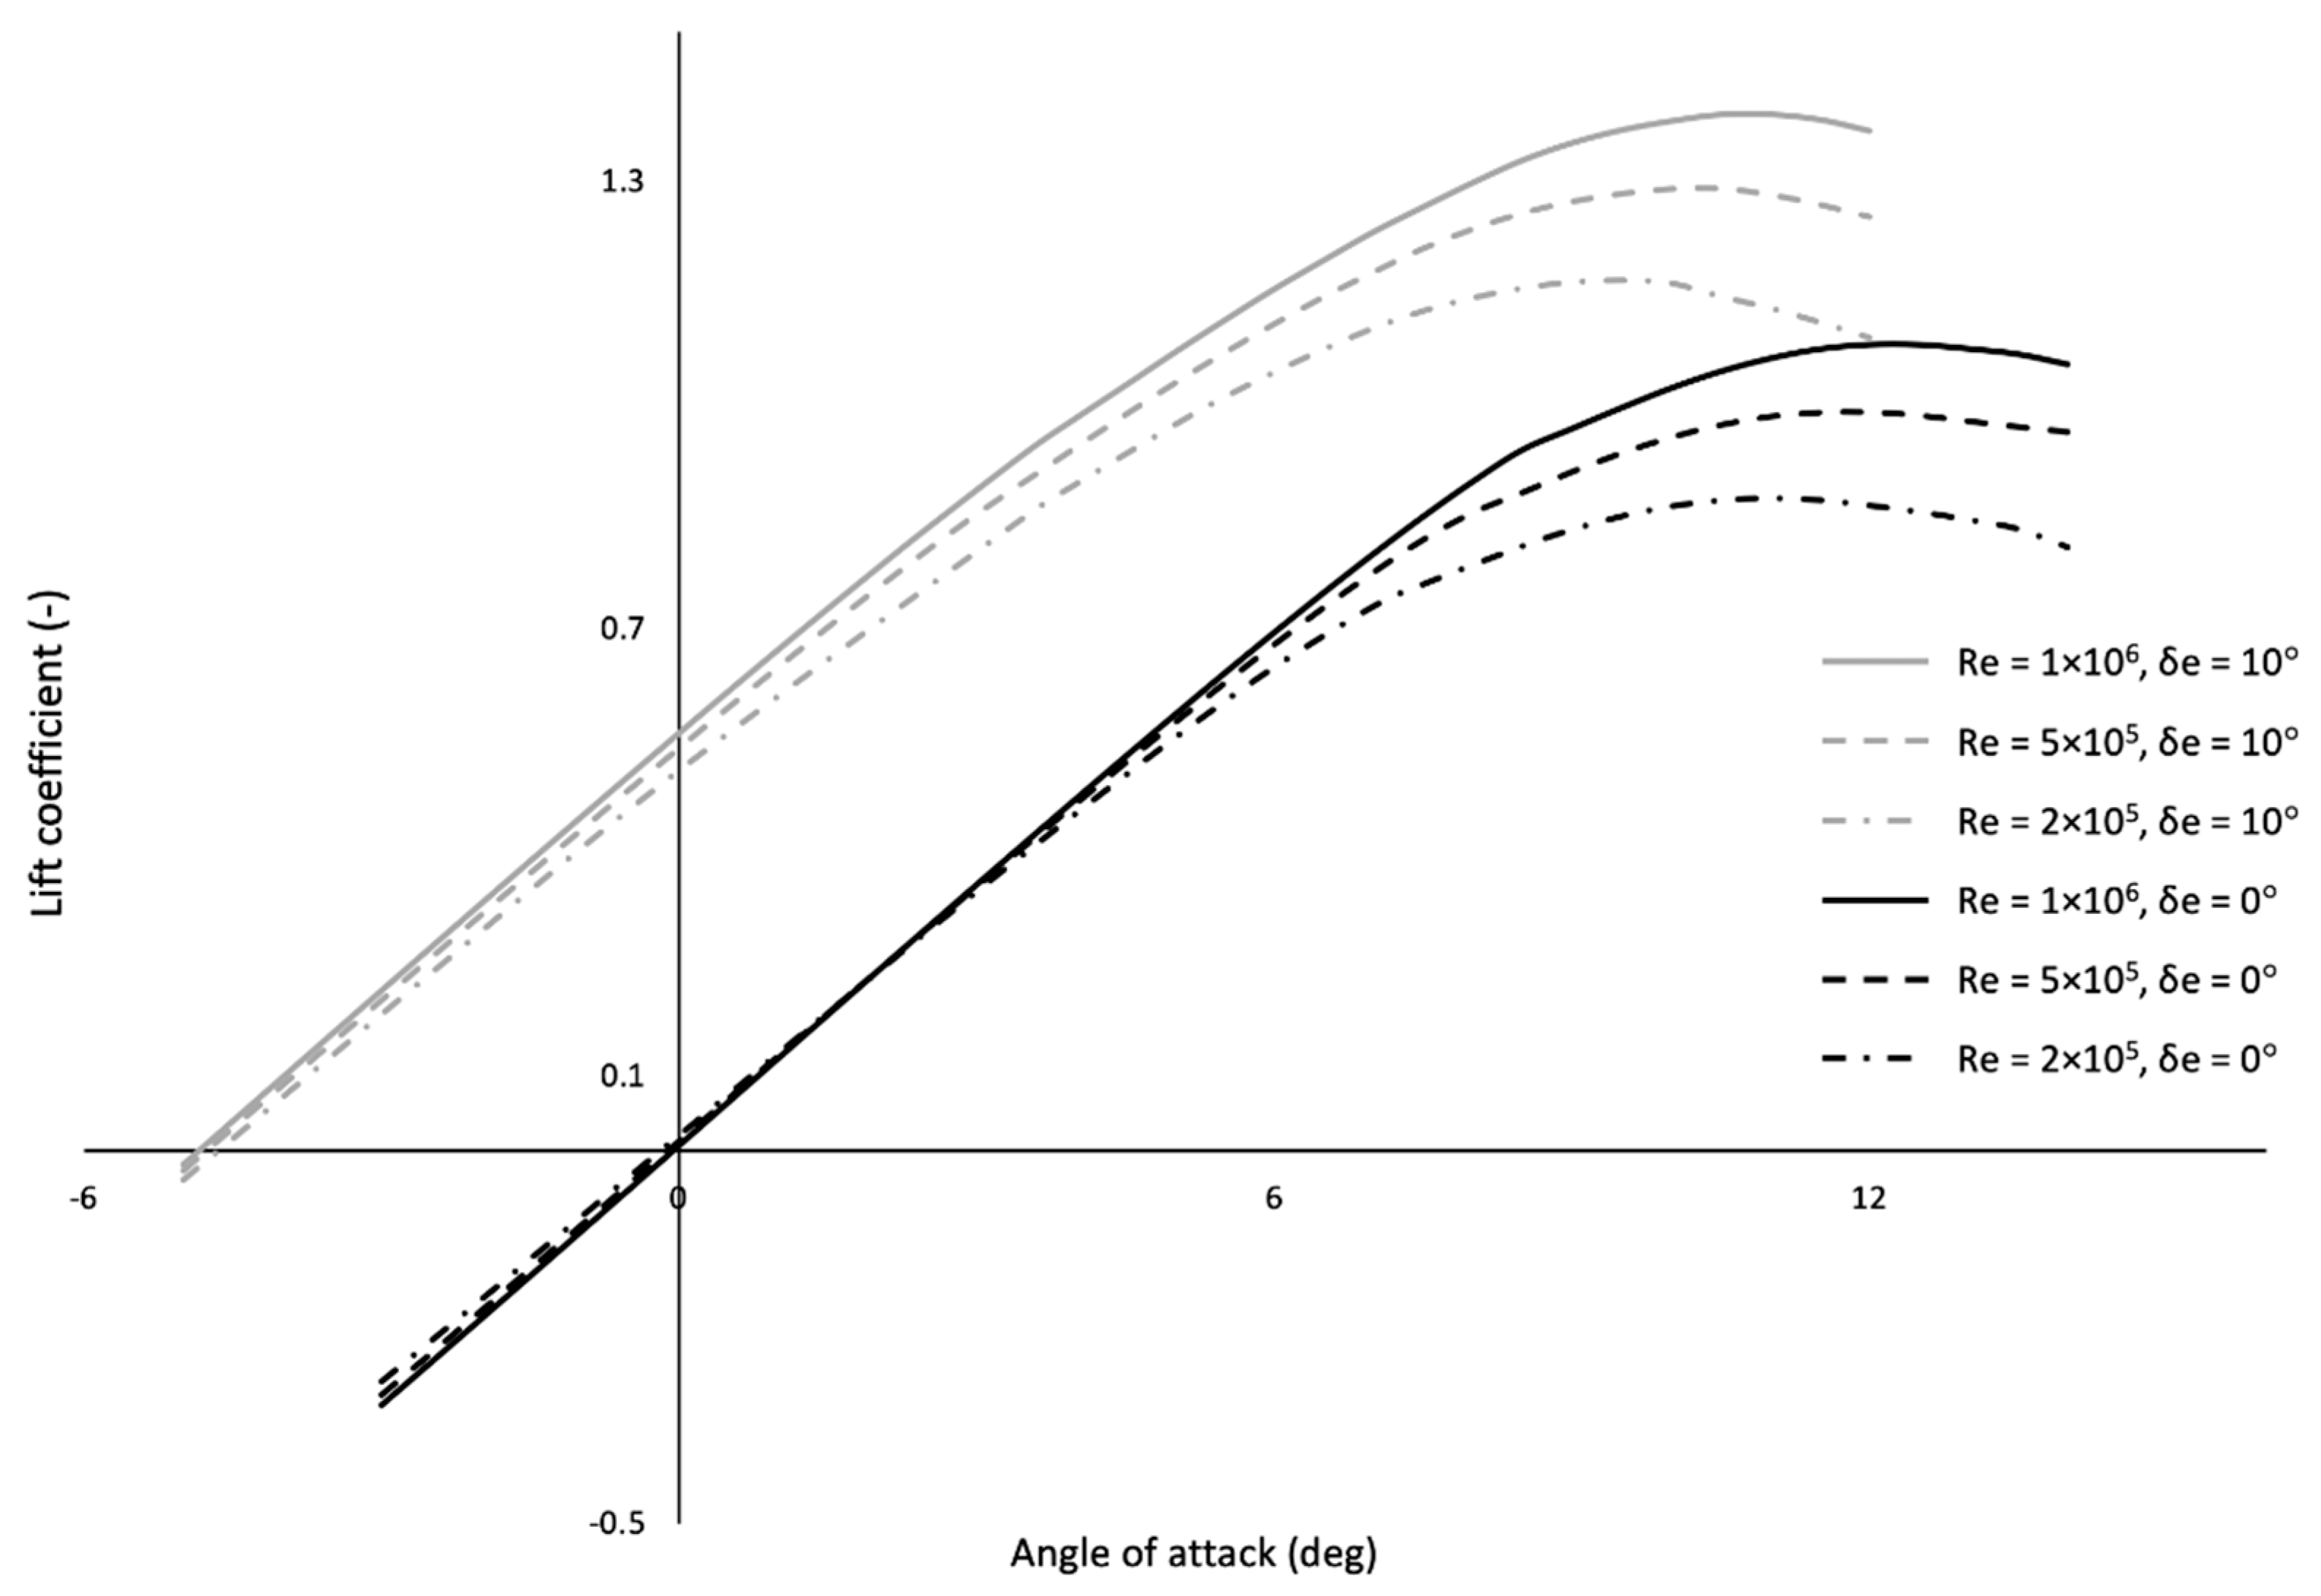
The most significant parameters of the analysis are the Reynolds number and the Mach number, which are defined for each airfoil depending on the freestream conditions and local chord length. Then, the airfoil is analyzed to calculate the corresponding aerodynamic coefficients at various angles of attack, that is, lift (Cl), drag (Cd) and pitching moment (Cm) coefficients (Figure 7). Finally, a 6th order polynomial fitting is applied on the results, so that the value of every coefficient can be extracted for any angle of attack. The procedure is repeated for each one of the airfoil sections described in the previous section.
3.3. 3D Aerodynamic Corrections and Integration (Clean Configuration)
In the present study, the term clean is used to describe a configuration that has all of its control surfaces at a deflection angle of 0 degrees [32]. The 3D corrections refer to span corrections (induced flow phenomena) and sweep corrections. As a start, the angle of attack induced from 3D flow phenomena (aind) is calculated using the textbook relations shown in Reference [31] (Equation (2)). The effective angle of attack (aeff) is in turn calculated using Equation (3).
In Equations (2) and (3), Cl and a are the 2D lift coefficient and angle of attack of each section, respectively, whereas AR stands for the aspect ratio. Note that Equation (2) assumes an elliptical spanwise distribution of lift, a condition met by-design for the reference platform [8]. The effective angle of attack is then used to retrieve the corresponding lift and moment coefficients from the polynomial expressions of Section 3.2, for every airfoil section.
Subsequently, Equation (4) is applied to account for sweep (Λ) and, finally, the total lift coefficient is calculated by integrating the corrected values across the wingspan (Equation (5)). Note that b describes the wingspan, c the chord length of each airfoil and S the reference area of the BWB UAV.
As far as pitching moment is concerned, the total moment coefficient in regard to the center of gravity of the UAV is broken down into two distinct components. The first component () is the result of the spanwise integration of all Cm values calculated for the 2D airfoil sections, following the corresponding 3D corrections, in similar manner to the ones applied for the lift coefficient calculations. That is, the integration is performed according to Equation (6).
The second pitching moment component () is “lift-derived.” That is, the lift force produced by every airfoil also generates a moment in regard to the CG, which is proportional to the longitudinal distance between its point of action and the CG. This component is taken into account using Equation (7), where, xNP and xCG are the longitudinal locations of the neutral point and center of gravity respectively and cmean is the mean aerodynamic chord of the BWB UAV.
The total pitching moment coefficient () is calculated by simply summing up the two components (Equation (8)).
3.4. Additional Corrections
3.4.1. The Effect of the Control Surfaces Deflection
The sections that are placed on the corresponding control surface region are analyzed in order to acquire the 2D aerodynamic coefficients for the deflected airfoils. As far as the lift coefficient is concerned, the same steps with the clean configuration are applied (Equations (2)–(5)), only that this time the new aerodynamic data are employed for the control surfaces sections. Regarding moment coefficient, it is now broken down into three distinct components. Equation (6) is applied to integrate the 2D Cm values across the span. Additionally, the value () is added, to take into account the lift-derived pitching moment coefficient. The new term emerges from the difference in lift due to control surface deflection and is calculated using Equation (9). The term is eventually added to and to calculate the total pitching moment coefficient, including the effect of control surfaces deflection.
In Equation (9) is the lift coefficient of the configuration with the control surfaces deflected, CL is the lift coefficient of the clean configuration, as calculated from Equation (5), xAC stands for the longitudinal position of the aerodynamic center of the corresponding control surface (el for elevon and rv for ruddervator) and Sel and Srv is the reference area of the part of the wing that contains the elevon and the ruddervator respectively (Figure 3), as the latter defined in Reference [10]. Additionally, and describe the mean aerodynamic chord of the part of the wing that contains the elevon and the ruddervator respectively and finally η is a correction factor for nonlinear lift behavior of plain flaps and is described in Reference [33].
3.4.2. Ground Effect
The calculation of ground effect on lift and moment coefficients, while not crucial during the overall performance assessment of a BWB UAV, provides useful data for the flight phases of takeoff and landing. The corrections described in this section for calculating the impact of ground effect on the lift and pitching moment coefficients of the BWB UAV are based on the method prescribed in Reference [10]. This method does not directly calculate the increase in lift coefficient, instead predicting the decrease in angle of attack (Δαg) required to produce the same lift coefficient (Equation (10)).
Note that in Equation (10), cr is the root chord of the wing, δf is the flap (elevon or ruddervator) deflection, CL is the lift coefficient away from ground calculated according to Equation (5), is the corresponding lift slope, is the rate of change in CL as a result of flap (elevon or ruddervator) deflection, calculated according to Section 3.4.1 and Ftv, , r are correction factors extracted from empirical/experimental charts found in Reference [10], according to the height of the wing from the ground.
The new lift and moment coefficients can now be calculated. As with the moment coefficient calculations of the quasi-3D Method, the moment coefficient in ground effect consists of a lift-derived component, calculated by Equation (11):
And a control surface-derived component, calculated by Equation (12):
is calculated by Equation (13):
And the horizontal tail downwash change is calculated by Equation (14):
In Equation (14) is the downwash slope of the aircraft, calculated with equations found in Reference [10], and are the heights of the aerodynamic center of the control surface section and the mean chord of the wing from the ground, respectively and is the effective wingspan calculated by Equation (15), where and are taken from empirical/experimental charts found in Reference [10].
4. Alternative Aerodynamic and Stability Analysis Methods
The current section presents the existing, well-established, low- and high-fidelity modeling methods and software that are used to validate the proposed quasi-3D BWB UAV analysis method.
4.1. 3D Low-Fidelity Analysis Methodology
The 3D low-fidelity analysis is conducted on a simplified representation of the wing/body configuration being investigated, using an inviscid approach (Figure 8). That is, the 3D configuration is modeled using a finite number of panels and a vortex or a doublet and source is associated to each panel [31,34]. Depending on the configuration, the analysis may be of the Vortex Lattice Method (VLM) type, that is, performed on the mean camber line or of the 3D-panel type, in the case where the wing is modeled as a thin or a thick surface respectively [30]. More specifically, the classic Lifting Line Theory (LLT), a VLM and a 3D Panel Method and their variants are supported, whereas the boundary conditions may be either of the Neumann or Dirichlet type. A detailed presentation of their characteristics, their advantages and their possible application is made in Reference [30].
Each of these methods has its advantages and limitations, therefore the selection of the appropriate method to solve a problem depends on the geometrical and aerodynamic properties of the problem in discussion. The LLT assumes one horseshoe vortex throughout the wing and its functionality is limited to wings without a sweep or dihedral angle and with a high aspect ratio. VLM [31] divides the wing into panel elements and assumes a horseshoe or ring vortex for each of them. It is applicable to all wing geometries including wings with high sweep, low aspect ratio and high dihedral (winglets) but it does not estimate the behavior at near stall conditions as accurately as the LLT method. The 3D Panel method [34] divides the wing into panel elements where a doublet and a source sheet are superpositioned. This method takes into consideration full 3D characteristics as for example the wing thickness and the fuselage. It is employed mainly when the pressure distribution must be acquired, on both the top and bottom surfaces or when the influence of fuselage has to be taken into consideration.
Taking into account the shape of the BWB configuration, with the aft-swept wings and the absence of fuselage the VLM method is eventually employed. The analysis is facilitated using the XFLRv5 routine, which employs the 2D XFOIL analyses as a base [13] and yields the lift, drag and pitching moment coefficients.
4.2. High-Fidelity Analysis Methodology
The high-fidelity analysis essentially corresponds to CFD modeling. The Reynolds-Averaged-Navier-Stokes (RANS) equations are solved and the Spalart-Allmaras [35] model is adopted for the modeling of turbulence. It is a robust and well-established, 1-equation turbulence model that can accurately predict the development of external flows around airfoils and wings and the corresponding boundary layer phenomena due to adverse pressure gradients. The CFD analysis is conducted using the BETA CAE ANSA (meshing) and ANSYS CFX (solver, post-processing) software [36,37]. A second order upwind scheme is used for both the discretized momentum transport and turbulence modeling equations. Note that Spalart-Allmaras is a low-Reynolds turbulence model, therefore the values of y+ at the wall are kept below 5, so that the boundary layer phenomena in the wall region can be accurately modelled. As a general comment, it should also be noted at this point that many researchers tend to use the k-omega SST turbulence model [38] for the modeling of flows around fixed-wing UAVs. However, in a recent study published by Lili Chen et al. [39], where CFD modeling results are validated against experimental data, the Spalart-Allmaras turbulence model is suggested for similar applications, as a combination of highly reliable and robust turbulence model.
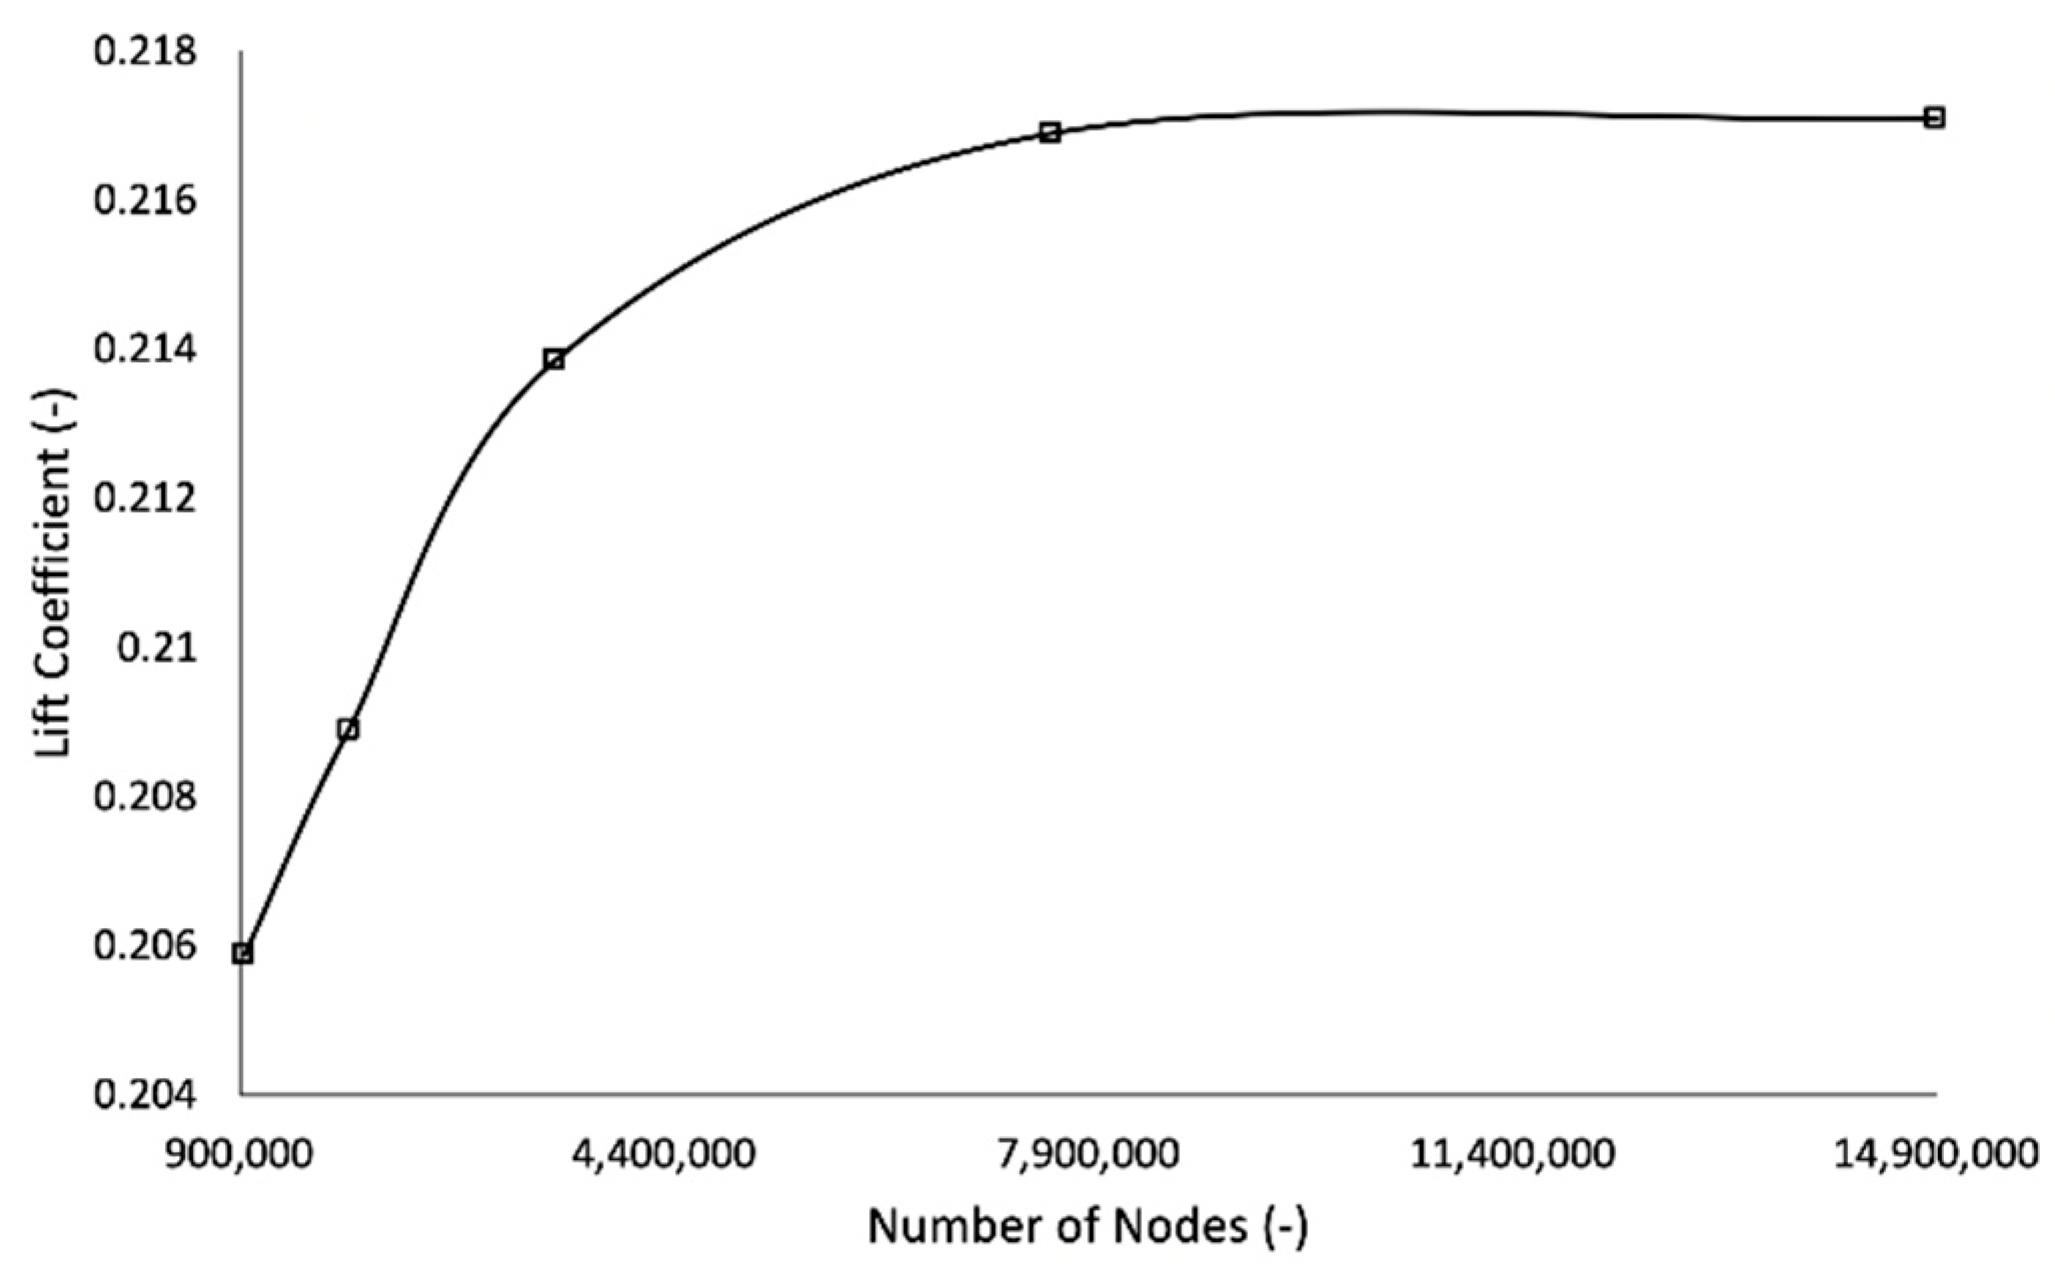
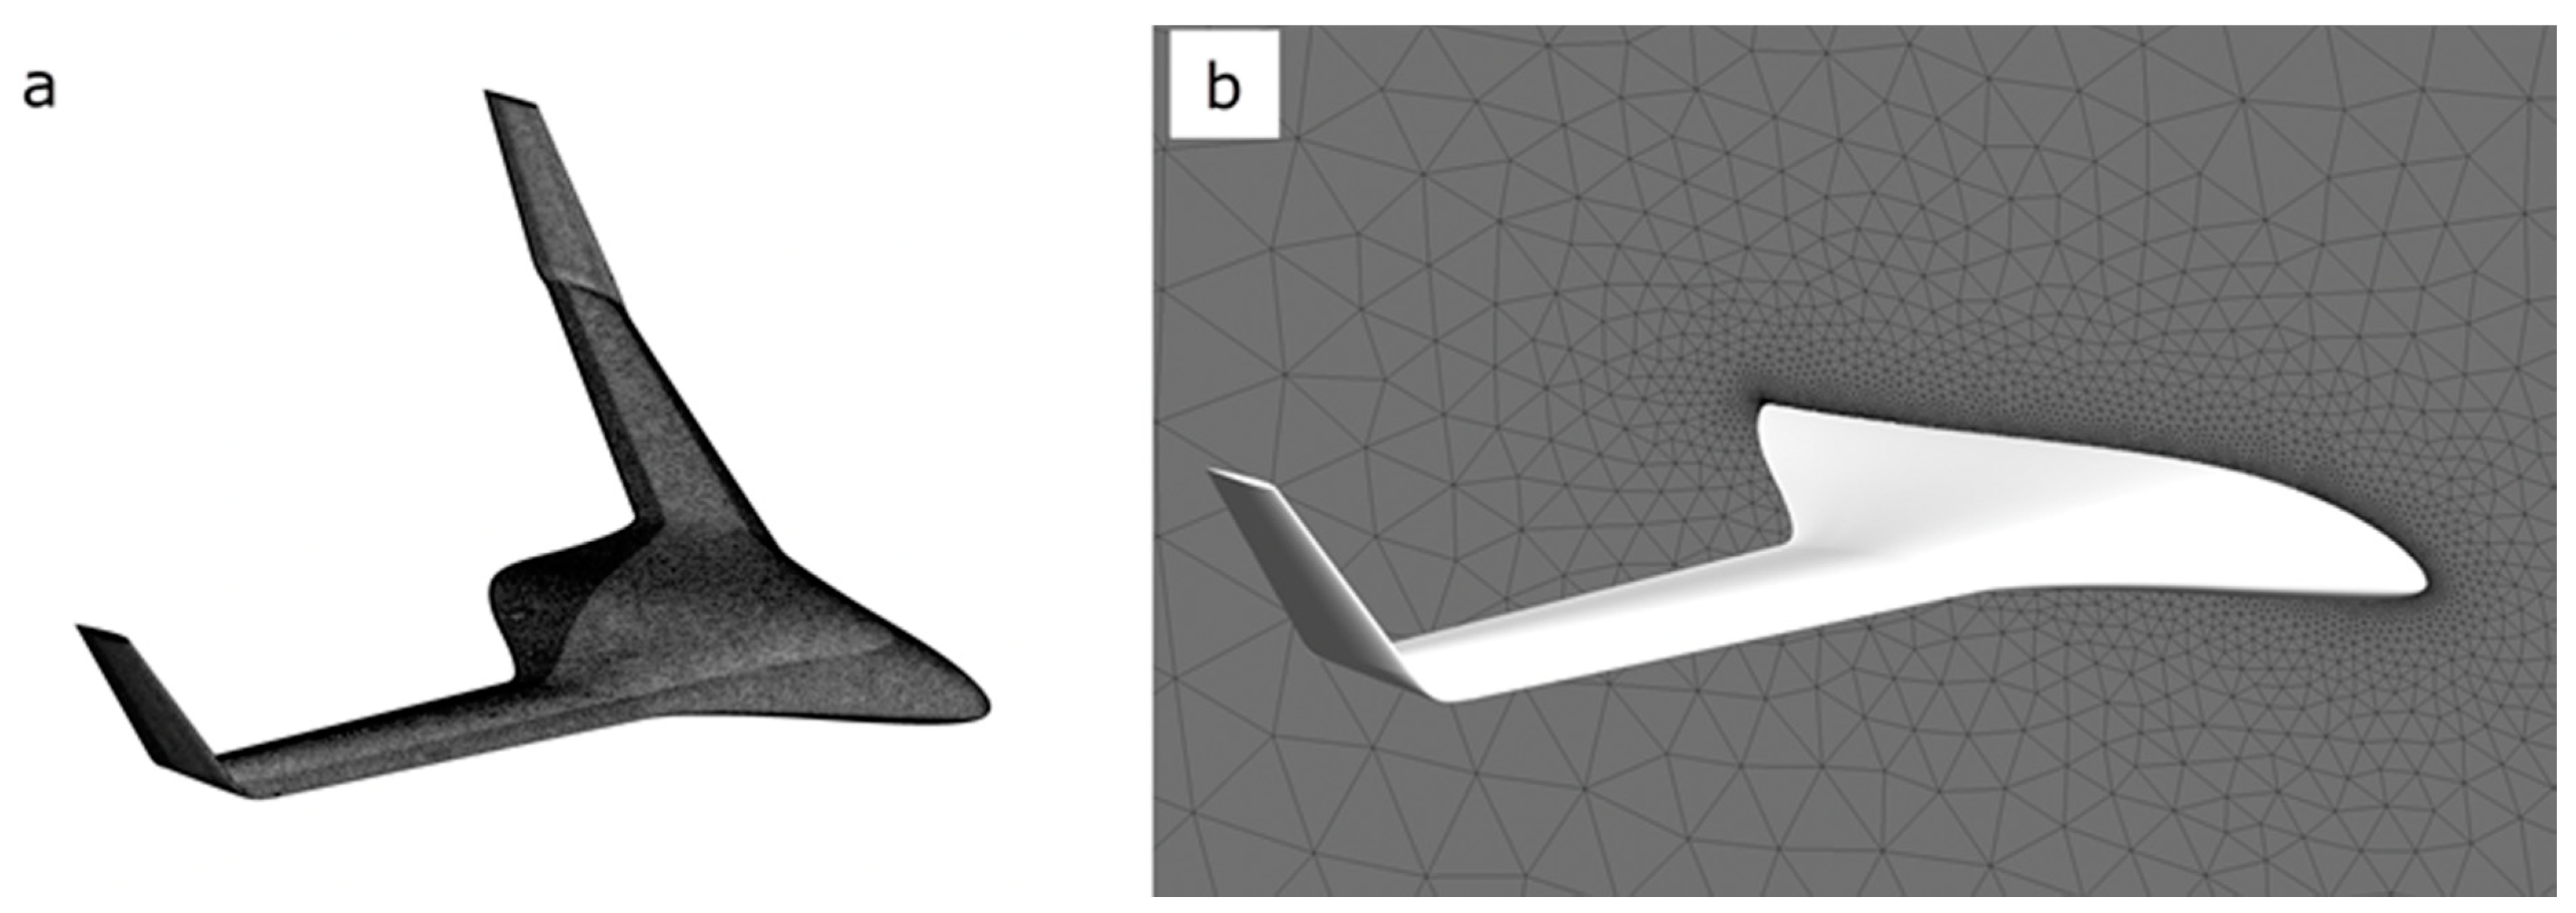
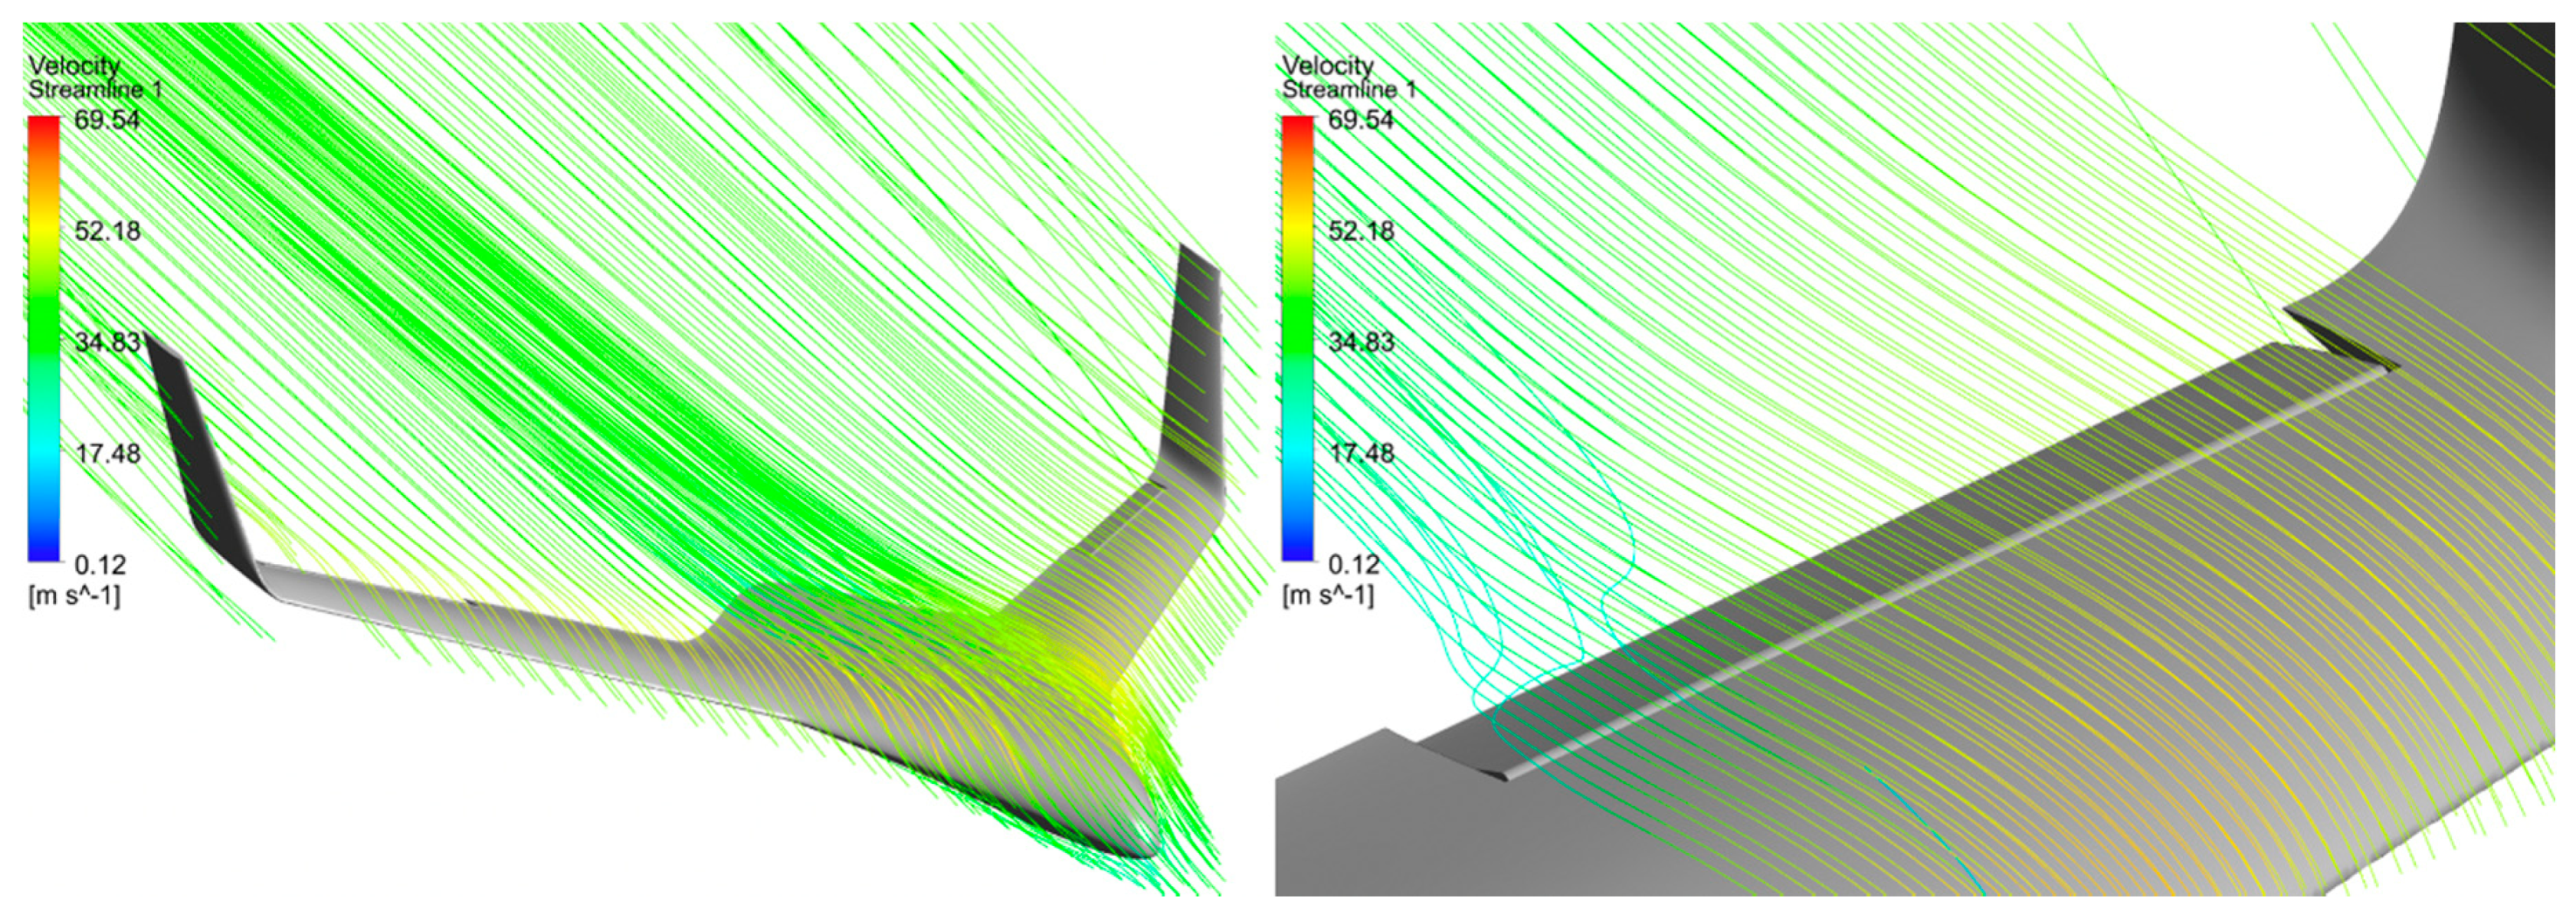
Following a grid dependency study, a mesh of approximately 8 million nodes is generated, to make sure that the lift and moment coefficients are accurately predicted (Figure 9). In Figure 10 the surface and volume mesh around the BWB UAV reference configuration are shown. An unstructured mesh is used to discretize the control volume whereas, for the boundary layer region around the UAV surface a structured mesh is used. More details about the CFD methodology can be found in Reference [8]. Table 2 sums up the various cases that were examined in the framework of the present work, whereas Figure 11 indicatively presents the flow development around the reference configuration, as a result of the CFD modeling.
5. Results and Discussion
5.1. Proposed Method Validation and Parametric Studies
5.1.1. Clean Configuration
The results of the implementation of the method on the clean configuration are presented in this section as a comparison to the results of the 3D XFLR and CFD modeling. Each of the three methods are employed to examine the reference BWB UAV aerodynamic behavior at five different angles of attack (−4°, 0°, 4°, 8°, 12°), as shown in Figure 12 and in Table 3 and Table 4. Note that the velocity equals to 180 Km/h and the flight altitude equals to 2000 m leading to a Reynolds number of 2,932,000, based on the mean aerodynamic chord. At angles of attack from −4 to 8 degrees, the proposed method is in close agreement to CFD results, both in net and in percentage values. Most notably, though, the proposed method is far more accurate than the existing 3D low-fidelity one, both in terms of lift and moment coefficient prediction.
From an angle of attack of 8 degrees onwards, the results of the proposed method deviate from the CFD results when it comes to moment coefficient prediction. The reason behind this behavior is the development of complex 3D flow phenomena that eventually lead to an unstable pitch-break [40,41]. That is, the proposed method cannot predict the pitch-break that occurs at high angles of attack. This phenomenon has been encountered over BWB configurations [26,40] and is likely linked to leading-edge separation over the main body, caused at high angles of attack. The main wings stalls before the main body, causing the BWB to pitch-up. The data available in the literature are rather limited, so that the authors can provide a corresponding correction at this point. However, investigating high angles of attack is beyond the scope of the proposed method, which is developed for conceptual design purposes. Utilizing a high-fidelity method or wind tunnel experiments is advised, in any case, for the prediction of near-stall behavior.
5.1.2. Control Surfaces Deflection and Trim Diagram Calculation
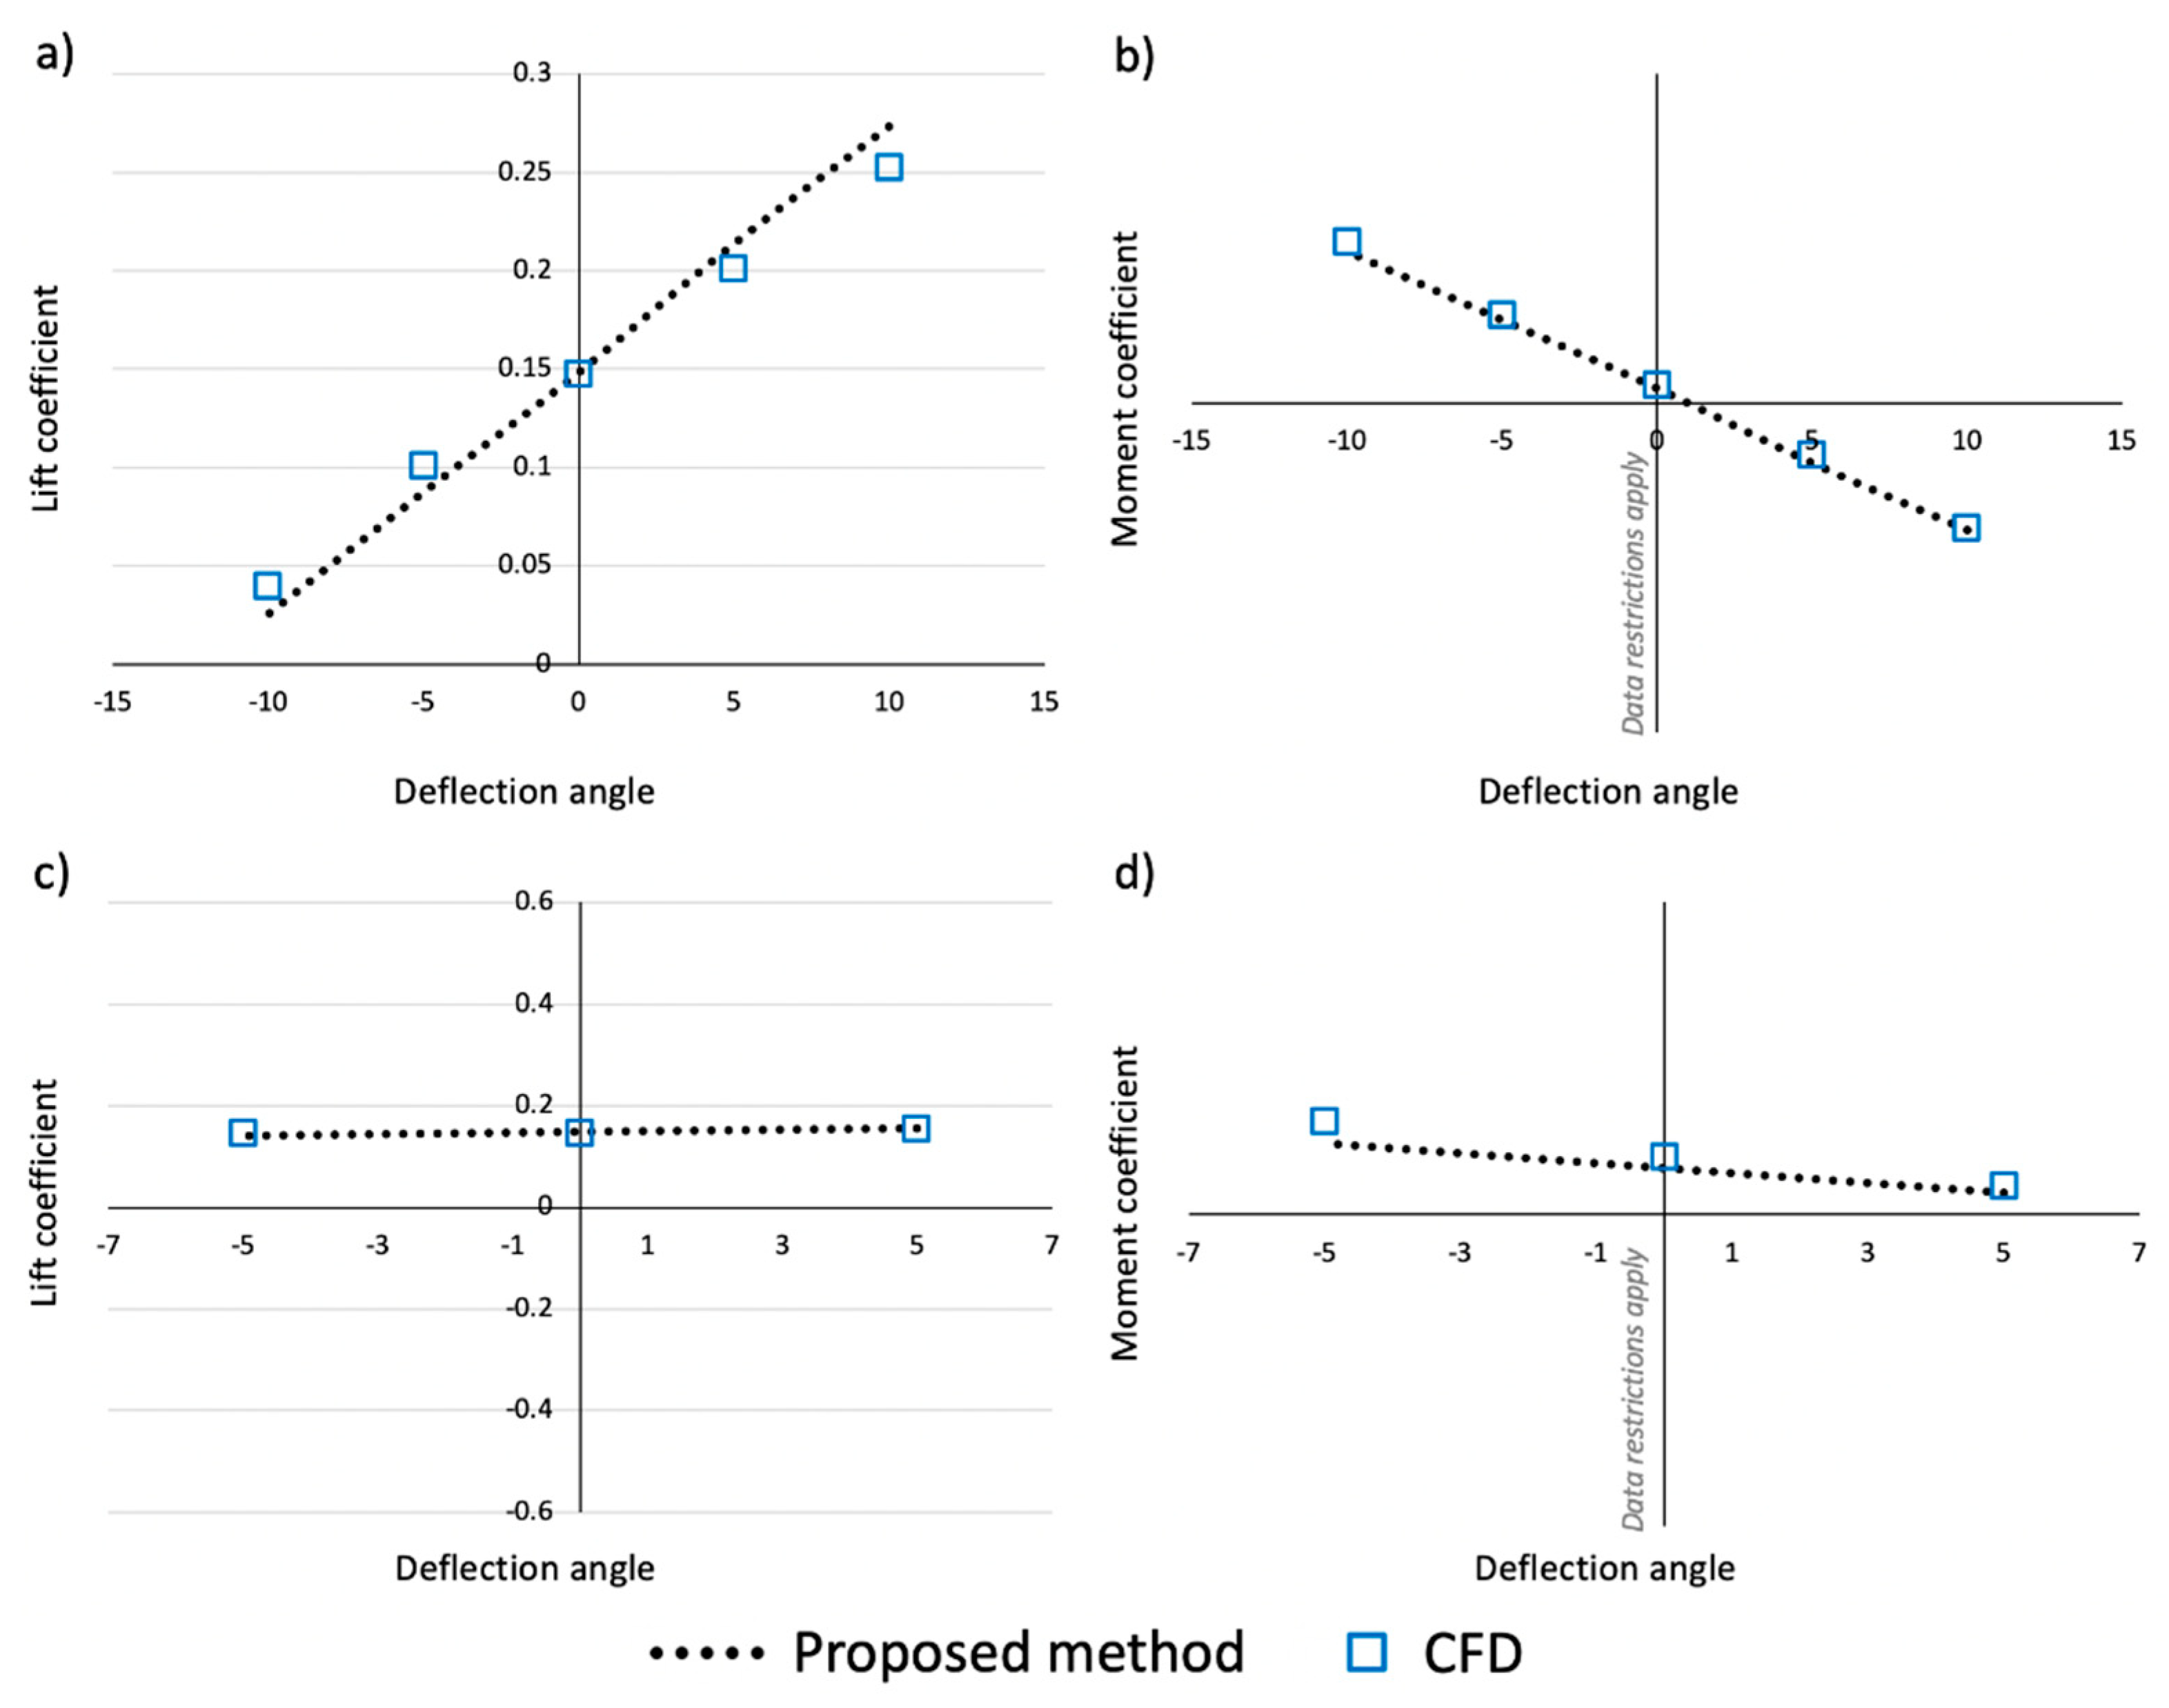
Figure 13 and Figure 14 sum up the investigations conducted at cruise conditions for various deflection angles of the control surfaces of the reference platform. Due to the large deviation between the XFLR and CFD results for the clean configuration, the former method is not included at the present section. Again, the velocity equals to 180 km/h and the flight altitude equals to 2000 m leading to a Reynolds number of 2,932,000, based on the mean aerodynamic chord. More specifically, Figure 13 presents the comparison between the proposed quasi-3D method and CFD modeling at an angle of attack of 0 degrees. A wide range of deflection angles is examined, that is, −10 to 10 degrees for the elevon and −5 to 5 degrees for the ruddervator. The results are in very good agreement in terms of both lift and moment coefficient prediction.
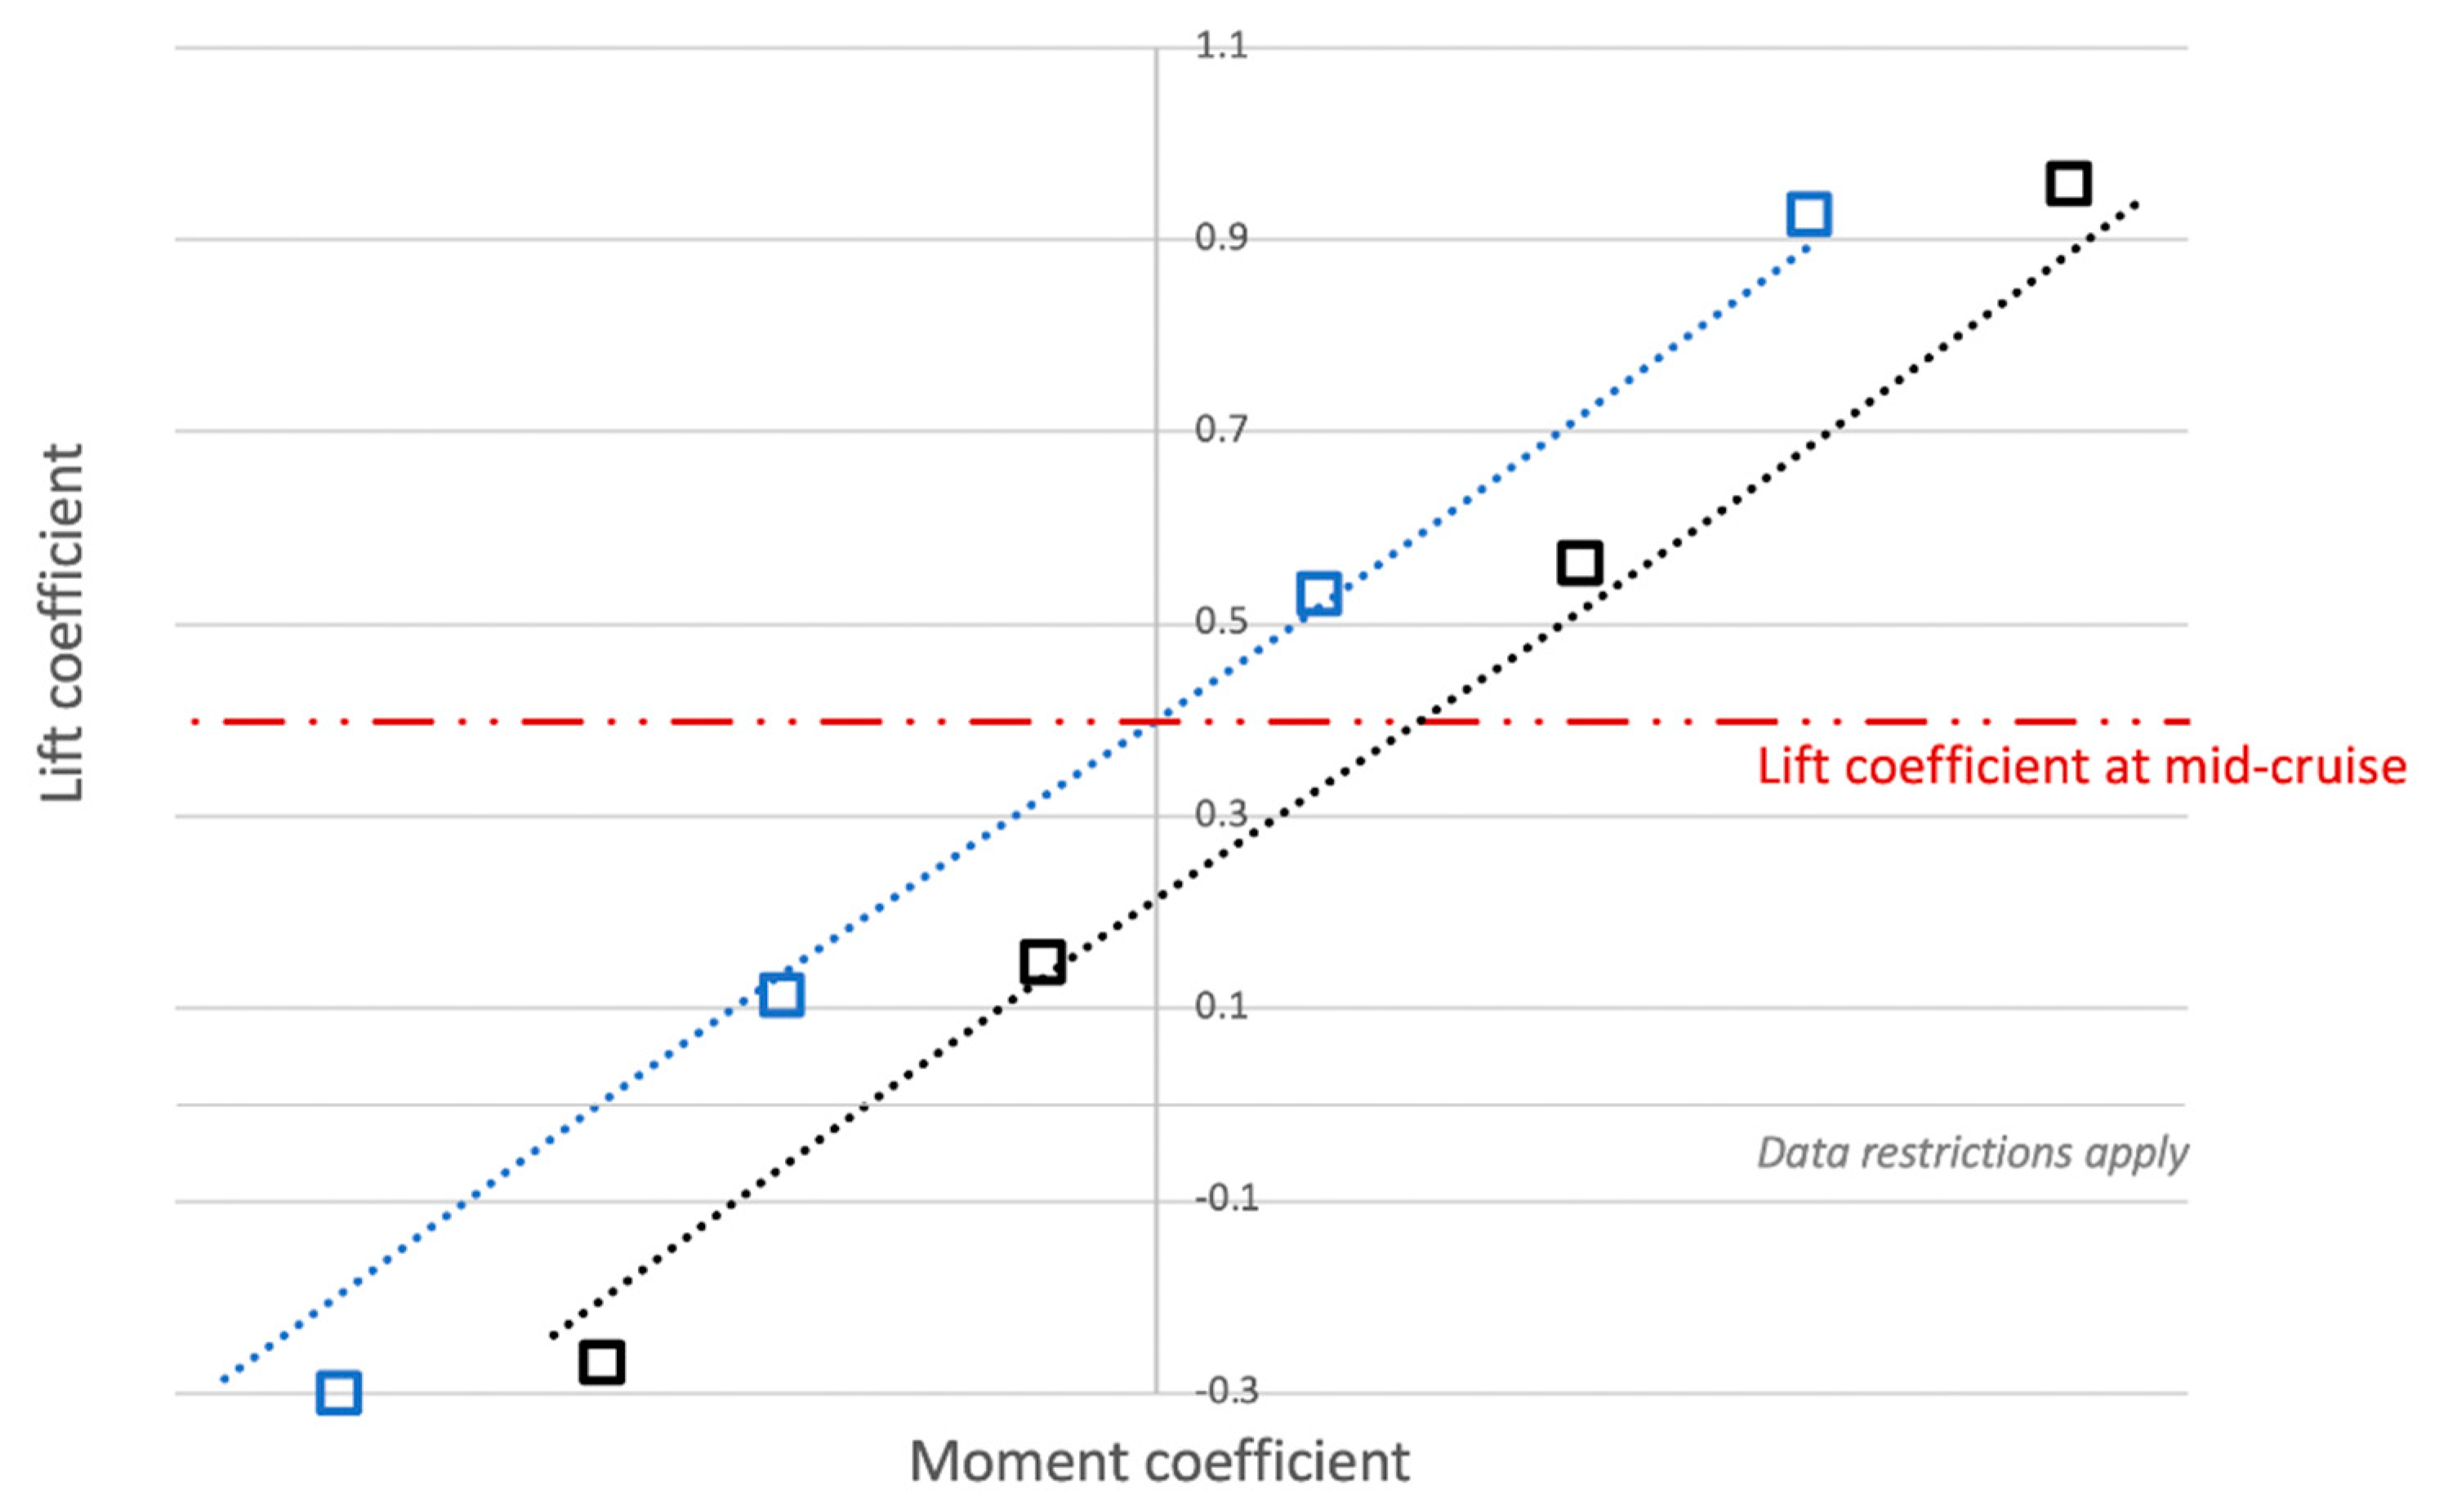
Based on those results, a trimming diagram at cruise conditions is also made (Figure 14). Although a weight analysis is clearly beyond the scope of this paper, a mid-cruise lift coefficient of 0.4 is used for reference purposes. The weight of the UAV in this reference condition is 246 kg, while the longitudinal position of the center of gravity, normalized using the root chord (xcg/croot), is at 63%. The proposed method analysis indicates that 3.5 degrees deflection is required, while the corresponding value for the CFD analysis is 3 degrees. Consequently, this section highlights the ability of the proposed, rapid, low-fidelity method to match the predictions of the high-fidelity CFD predictions, in terms of trimming analysis, without any significant penalties in accuracy. This result is one of the most important points of this work, as it allows for the much-needed conceptual design trade studies to be conducted in a cost-effective (in terms of time and resources) way, which was not possible with the existing low-fidelity methods.
5.1.3. Takeoff Conditions and Ground Effect Impact
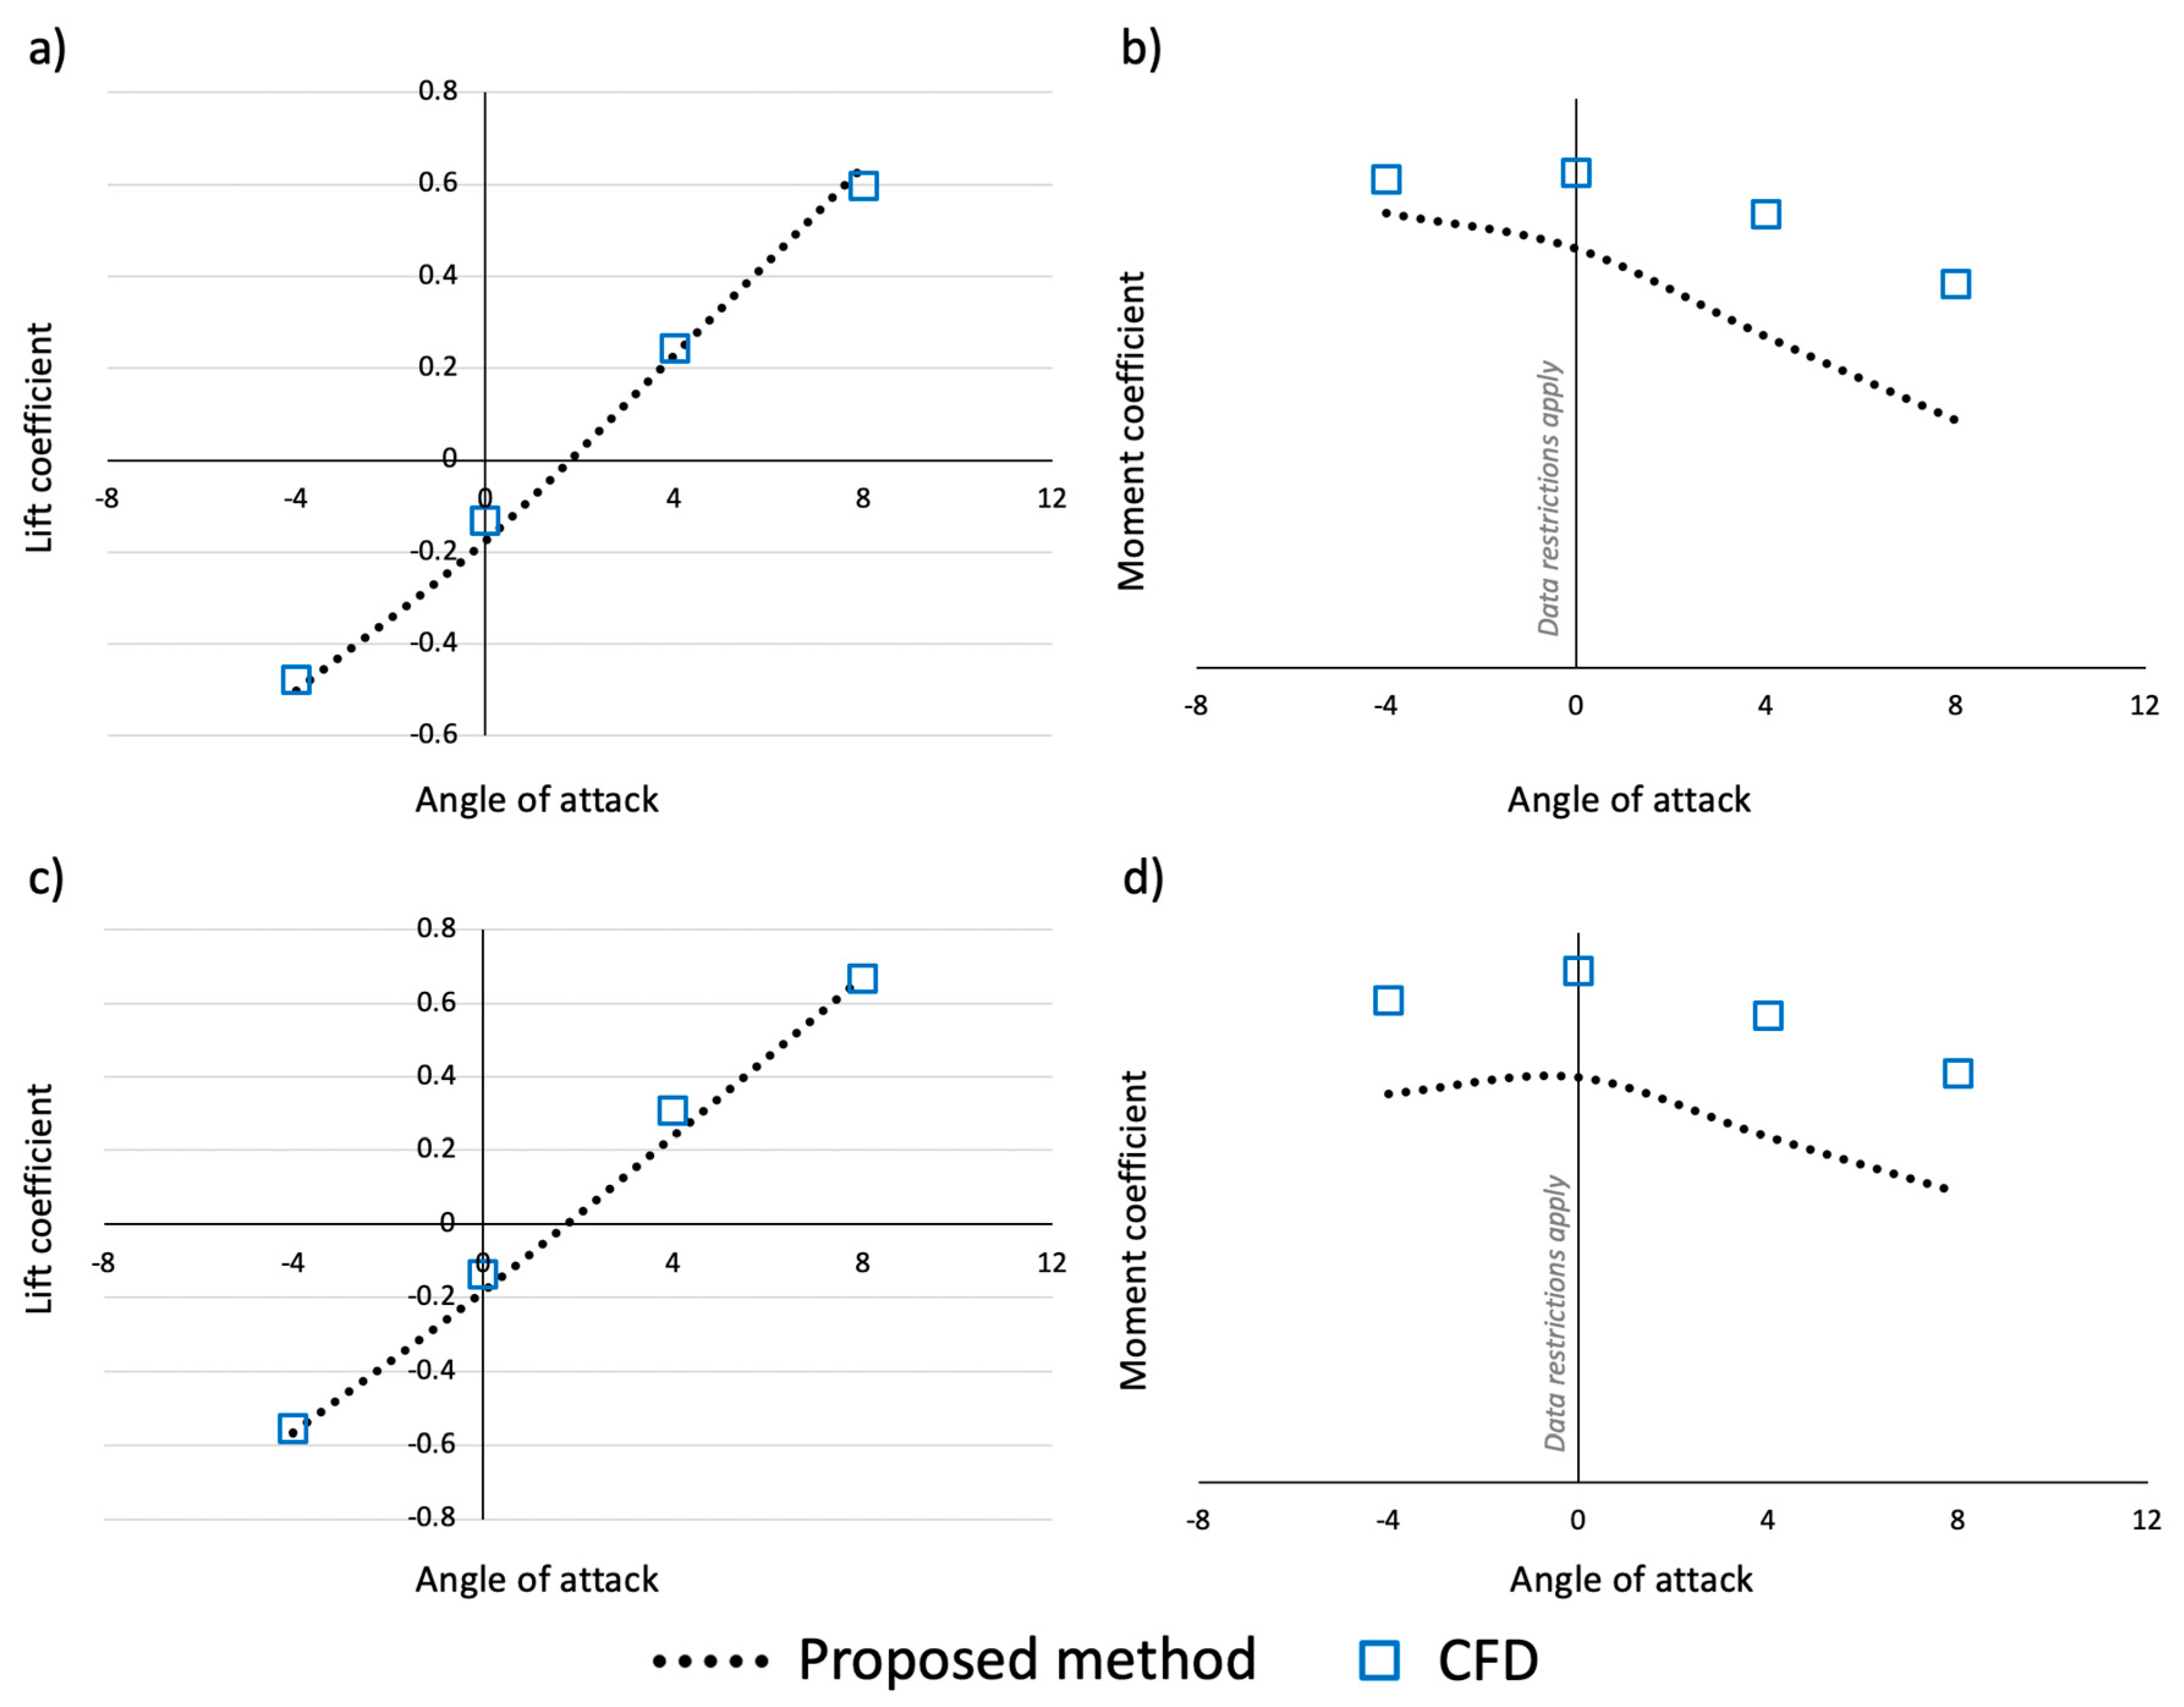
Figure 15 presents the investigations conducted at takeoff conditions. A comparison between CFD and the proposed method is made at a velocity of 108 km/h, corresponding at a Reynolds number of 1,759,000. The elevon and ruddervator control surfaces are deflected at an angle of −35 degrees (negative deflection angle stands for nose-up pitching moment [11]). The ground effect corrections are also employed in this case, assuming that the UAV is located 0.5 m above the takeoff runway, corresponding to a typical landing gear height [23].
In terms of lift coefficient prediction, the results are again in very close agreement between the two methods. On the contrary, when it comes to the moment coefficient prediction, the proposed method deviates significantly from the CFD results, with an indicative percentage deviation of 27% at an angle of attack of 4 degrees. This deviation can be seen both with- and without ground effect corrections. Therefore, the error is mainly attributed to the extreme control surface deflection, possibly indicating that the airfoil profiles cannot be accurately modeled using the 2D XFOIL code.
5.1.4. Aspect Ratio and Sweep Angle Parametric Studies
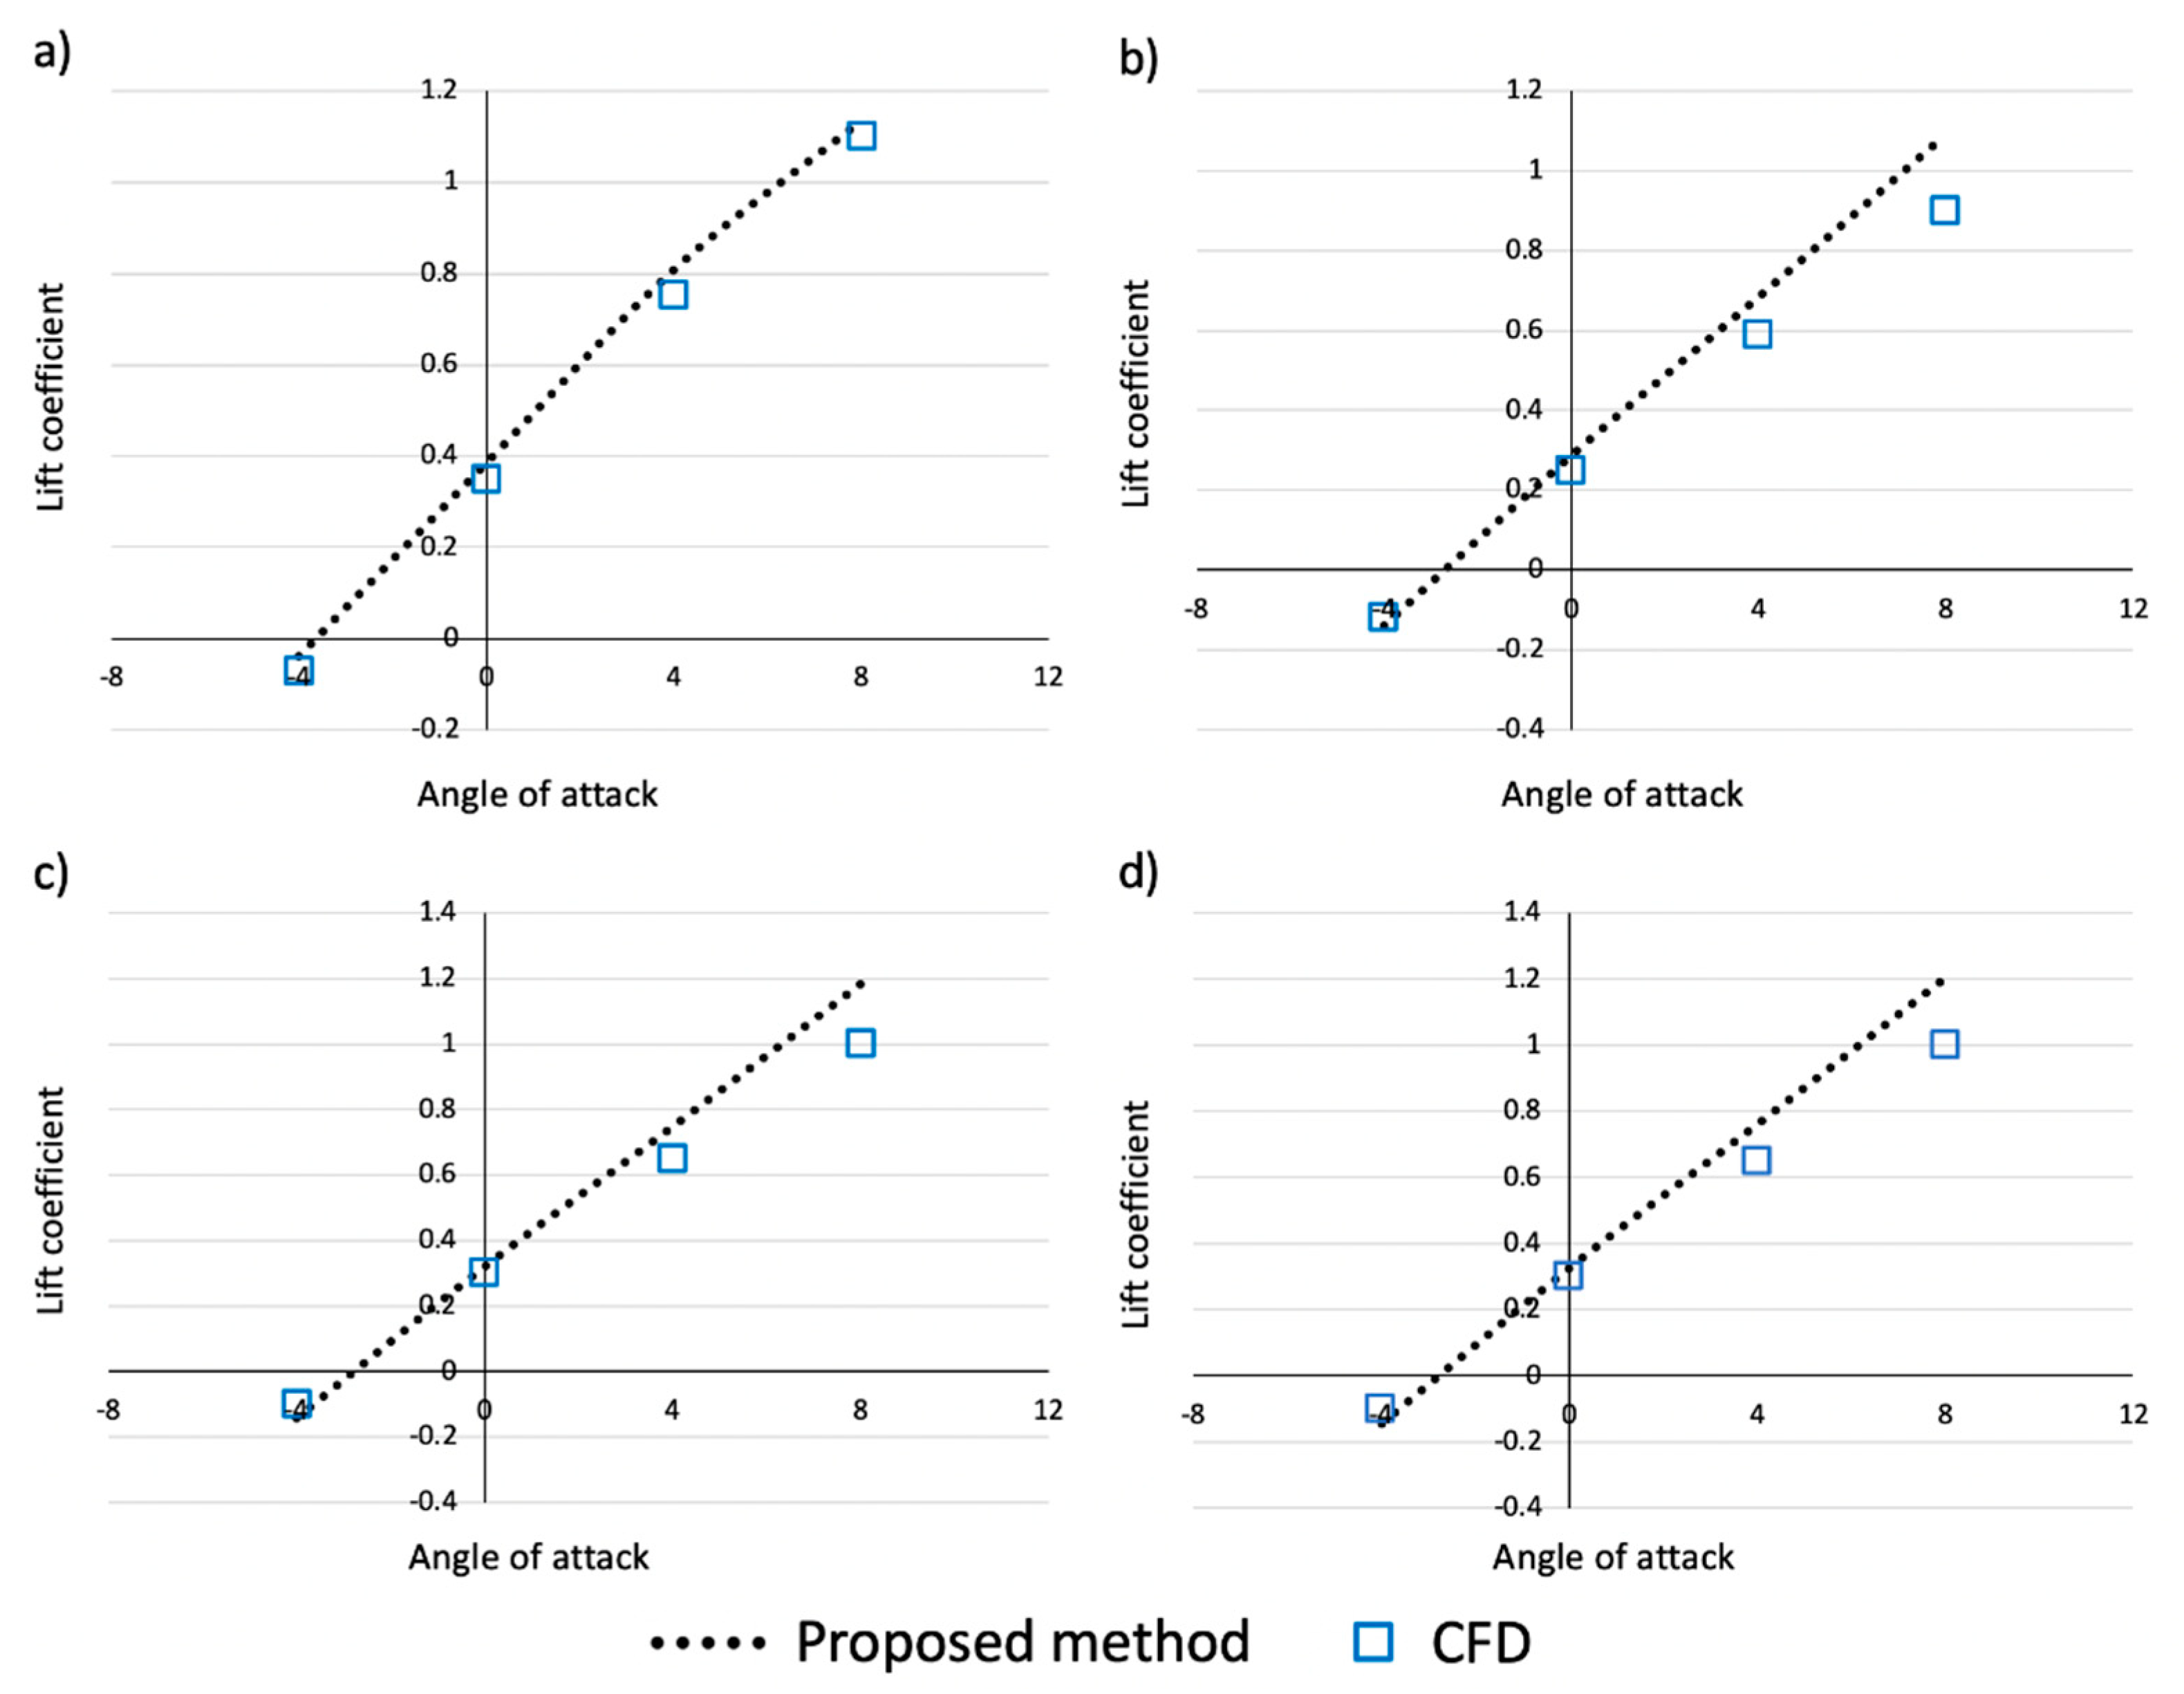
To further examine the reliability of the method and examine its reliability beyond the reference platform, a comparison is made against the CFD modeling data that have been published in Reference [26], concerning the lift coefficient of BWB configurations of various geometric characteristics. More specifically, four configurations are used, each of which features a different combination of sweep and AR (Table 5). More details about the layout of each configuration can be found in Reference [26].
In this section, the velocity equals to 144 Km/h and the flight altitude equals to 2000 m leading to a Reynolds number of 1,970,000, based on the mean aerodynamic chord. The comparison between the two methods in terms of lift coefficient prediction is shown in Figure 16. It is apparent that the proposed quasi-3D method is in good agreement with the CFD results, for a typical operational range of angles of attack.
6. Conclusions
A quasi-3D analysis method is proposed in this work, allowing for a rapid estimation of the key coefficients of a BWB UAV configuration. Existing low-fidelity and quasi-3D methods yield inaccurate predictions, since they employ specific assumptions and methods related to conventional configurations and commercial airliner-related, compressible flow conditions. Moreover, existing methods do not predict pitching moment coefficient, a feature that is of very high importance for the design and analysis of a BWB UAV.
As a start, a reference platform is defined, corresponding to a tactical, fixed-wing BWB UAV configuration. A step-by-step presentation of the proposed methodology is consequently made, including the underlying 2D analysis and the corresponding 3D corrections. The modifications that allow the control surfaces modeling, as well as the ground effect corrections are also shown. The proposed method is in turn validated against well-established, 3D low-fidelity and CFD methods, to investigate its accuracy, its ability to adopt to different layouts and its limitations.
The results of the proposed method are proven to be very accurate when compared to computational modeling predictions. The lift and pitching moment coefficient estimations are in very good agreement with the CFD results for the reference platform, both in terms of net values and in terms of percentage error, whereas the achieved accuracy is much higher than that of the established low-fidelity method. The proposed quasi-3D method can also rapidly predict the effect of control surfaces deflection, thus allowing for trimming diagrams to be drawn, which is a very important step when it comes to conceptual design trade studies. Furthermore, a set of published data for BWB UAV platforms is also used to validate the proposed method and investigate its versatility, beyond the reference configuration.
As a general observation, the proposed method can accurately predict the lift and pitching moment coefficients for a BWB UAV and helps to drastically reduce analysis costs, both resources- and time-wise. The ability to rapidly perform trimming analyses is of outmost importance for a BWB configuration, since the absence of a conventional horizontal stabilizer means that any changes made at the layout are a multidisciplinary problem, where both aerodynamics and longitudinal stability must be evaluated.
Given the fact that a low-fidelity approach is used, though, the proposed method also has some limitations, related to the inability to predict the complex 3D flow phenomena at high angles of attack, as well as to the fact that it cannot support the extremely high deflection angles. Those limitations are the authors’ the primary concerns when it comes to future work. Furthermore, the method can potentially incorporate textbook relations that allow for drag coefficient prediction and compressibility corrections.
Author Contributions
Conceptualization, P.P.; methodology, P.P., S.D., T.D. and K.Y.; validation, T.D. and S.D.; investigation, T.D., S.D. and P.P.; writing—original draft preparation, T.D., S.D. and P.P.; writing—review and editing, P.P. and K.Y.; visualization, P.P., S.D. and T.D.; supervision, P.P. and K.Y. All authors have read and agreed to the published version of the manuscript.
Funding
This research was funded by the Hellenic Foundation for Research and Innovation (H.F.R.I.), grant number 7121/29.11.2018.
Institutional Review Board Statement
Not applicable.
Informed Consent Statement
Not applicable.
Data Availability Statement
Data sharing not applicable.
Acknowledgments
The research project was supported by the Hellenic Foundation for Research and Innovation (H.F.R.I.) under the “2nd Call for H.F.R.I. Research Projects to support Post-Doctoral Researchers” (Project Number: 00745).
Conflicts of Interest
The authors declare that they have no known competing financial interests or personal relationships that could have appeared to influence the work reported in this paper.
References
- Heinemann, P.; Panagiotou, P.; Vratny, P.; Kaiser, S.; Hornung, M.; Yakinthos, K. Advanced Tube and Wing Aircraft for Year 2050 Timeframe. In Proceedings of the 55th AIAA Aerospace Sciences Meeting, Grapevine, TX, USA, 9–13 January 2017; p. 1390. [Google Scholar] [CrossRef]
- Jenkinson, L.R.; Simpkin, P.; Rhodes, D. Civil Jet Aircraft Design, 1st ed.; Elsevier: London, UK, 1999; ISBN 9780340741528. [Google Scholar]
- Raymer, D.P. Aircraft Design: A Conceptual Approach, 5th ed.; American Institute of Aeronautics and Astronautics: Reston, VA, USA, 2012; ISBN 978-1-60086-911-2. [Google Scholar]
- Advisory Council for Aviation Research and Innovation in Europe. Realising Europe’s Vision for Aviation, Strategic Research & Innovation Agenda. Volume 1. 2017. Available online: https://www.acare4europe.org/sites/acare4europe.org/files/document/ACARE-Strategic-Research-Innovation-Volume-1.pdf (accessed on 11 December 2020).
- Global Unmanned Aerial Vehicle (UAV) Market 2017–2021|Market Research Reports -Industry Analysis Size & Trends—Technavio. (n.d.). Available online: https://www.technavio.com/report/globalaerospace-components-global-uav-market-2017 (accessed on 11 December 2020).
- Panagiotou, P.; Yakinthos, K. Aerodynamic efficiency and performance enhancement of fixed-wing UAVs. Aerosp. Sci. Technol. 2020, 99, 105575–105587. [Google Scholar] [CrossRef]
- Liebeck, R.H. Design of the Blended Wing Body Subsonic Transport. J. Aircraft 2004, 41, 10–25. [Google Scholar] [CrossRef] [Green Version]
- Panagiotou, P.; Mitridis, D.; Dimopoulos, T.; Kapsalis, S.; Dimitriou, S.; Yakinthos, K. Aerodynamic design of a tactical Blended-Wing-Body UAV for the aerial delivery of cargo and lifesaving supplies. In Proceedings of the AIAA Scitech 2020 Forum, Orlando, FL, USA, 6–10 January 2020. [Google Scholar] [CrossRef]
- Jansen, R.H.; Bowman, C.; Jankovsky, A.; Dyson, R.; Felder, J.L. Overview of NASA Electrified Aircraft Propulsion Research for Large Subsonic Transports. In Proceedings of the 53rd AIAA/SAE/ASEE Joint Propulsion Conference, Atlanta, GA, USA, 10–12 July 2017. [Google Scholar] [CrossRef]
- Roskam, J. Airplane Design, Part VI: Preliminary Calculation of Aerodynamic, Thrust and Power Characteristics, 7th ed.; DAR Corporation: Lawrence, KS, USA, 2018; ISBN 978-1-884885-52-5. [Google Scholar]
- Nelson, R.C. Flight Stability and Automatic Control, 1st ed.; McGraw-Hill: New York, NY, USA, 1989; ISBN 978-0-07-046218-2. [Google Scholar]
- Panagiotou, P.; Kaparos, P.; Salpingidou, C.; Yakinthos, K. Aerodynamic design of a MALE UAV. Aerosp. Sci. Technol. 2016, 50, 127–138. [Google Scholar] [CrossRef]
- Drela, M. XFOIL: An Analysis and Design System for Low Reynolds Number Airfoils. In Low Reynolds Number Aerodynamics; Mueller, T.J., Ed.; Springer: Berlin, Germany, 1989. [Google Scholar] [CrossRef]
- Qin, N.; Vavalle, A.; Le Moigne, A.; Laban, M.; Hackett, K.; Weinerfelt, P. Aerodynamic Studies for Blended Wing Body Aircraft. In Proceedings of the 9th AIAA/ISSMO Symposium on Multidisciplinary Analysis and Organization, Atlanta, GA, USA, 4–6 September 2002. [Google Scholar] [CrossRef] [Green Version]
- Nasir, R.E.M.; Kuntjoro, W.; Wisnoe, W.; Ali, Z.; Reduan, N.F.; Mohamad, F.; Suboh, S. Preliminary Design of “Baseline-II” Blended Wing-Body (BWB) Unmanned Aerial Vehicle (UAV): Achieving Higher Aerodynamic Efficiency through Planform Redesign and Low Fidelity Inverse Twist Method. In Proceedings of the EnCon 2010-3rd Engineering Conference on Advancement in Mechanical and Manufacturing for Sustainable Environment, Kuching, Sarawak, Malaysia, 14–16 April 2010. [Google Scholar]
- Morris, A.; Arendse, P.; LaRocca, G.; Laban, M.; Voss, R.; Hönlinger, H. MOB-A European Project on Multidisciplinary Design Optimisation. In Proceedings of the 24th International Congress of the Aeronautical Sciences-ICAS 2004, Yokohama, Japan, 29 August–3 September 2004. [Google Scholar]
- Voskuijl, M.; La Rocca, G.; Dircken, F. Controllability of Blended Wing Body aircraft. In Proceedings of the 26th ICAS Congress, Anchorage, AK, USA, 14–19 September 2008. [Google Scholar]
- Li, P.; Zhang, B.; Chen, Y.; Yuan, C.; Lin, Y. Aerodynamic Design Methodology for Blended Wing Body Transport. Chin. J. Aeronaut. 2012, 25, 508–516. [Google Scholar] [CrossRef] [Green Version]
- Hileman, J.I.; Spakovszky, Z.S.; Drela, M.; Sargeant, M.A. Aerodynamic and aeroacoustic three-dimensional design for a “silent” aircraft. In Proceedings of the 44th AIAA Aerospace Sciences Meeting and Exhibit, Reno, NV, USA, 9–12 January 2006. [Google Scholar] [CrossRef] [Green Version]
- Hileman, J.I.; Spakovszky, Z.S.; Drela, M.; Sargeant, M.A. Airframe design for “silent” aircraft. In Proceedings of the 45th AIAA Aerospace Sciences Meeting and Exhibit, Reno, NV, USA, 8–11 January 2007. [Google Scholar] [CrossRef] [Green Version]
- Hileman, J.I.; Spakovszky, Z.S.; Drela, M.; Sargeant, M.A.; Jones, A. Airframe design for silent fuel-efficient aircraft. J. Aircraft 2010, 47, 956–969. [Google Scholar] [CrossRef] [Green Version]
- Kontogiannis, S.G.; Ekaterinaris, J.A. Design, Performance Evaluation and Optimization of a UAV. Aerosp. Sci. Technol. 2013, 29, 339–350. [Google Scholar] [CrossRef]
- Götten, F.; Havermann, M.; Braun, C.; Marino, M.; Bil, C. Wind-tunnel and CFD investigations of UAV landing gears and turrets—Improvements in empirical drag estimation. Aerosp. Sci. Technol. 2020, 107, 106306. [Google Scholar] [CrossRef]
- Hoerner, S.F. Fluid-Dynamic Drag: Practical Information on Aerodynamic Drag and Hydrodynamic Resistance; Hoerner Fluid Dynamics: Brick Town, NJ, USA, 1965; ISBN 978-9991194448. [Google Scholar]
- Panagiotou, P.; Fotiadis-Karras, S.; Yakinthos, K. Conceptual Design of a Blended Wing Body MALE UAV. Aerosp. Sci. Technol. 2018, 73, 32–47. [Google Scholar] [CrossRef]
- Panagiotou, P.; Yakinthos, K. Parametric aerodynamic study of Blended-Wing-Body platforms at low subsonic speeds for UAV applications. In Proceedings of the 35th AIAA Applied Aerodynamics Conference, Denver, CO, USA, 5–9 June 2017. [Google Scholar] [CrossRef]
- ATP–3.3.7—NATO STANAG 4670 (Edition 3) Guidance for the Training of Unmanned Aircraft Systems (UAS) Operators. NATO Standardization Agency. 2014. Available online: https://nso.nato.int/nso/nsdd/listpromulg.html (accessed on 11 December 2020).
- Gómez-Rodríguez, Á.; Sanchez-Carmona, A.; García-Hernández, L.; Cuerno-Rejado, C. Preliminary Correlations for Remotely Piloted Aircraft Systems Sizing. Aerospace 2018, 5, 5. [Google Scholar] [CrossRef] [Green Version]
- Verstraete, D.; Palmer, J.L.; Hornung, M. Preliminary Sizing Correlations for Fixed-Wing Unmanned Aerial Vehicle Characteristics. J. Aircraft 2018, 55, 715–726. [Google Scholar] [CrossRef]
- Deperrois, A. XFLR5: Analysis of Foils and Wings Operating at Low Reynolds Number. Available online: https://engineering.purdue.edu/~aerodyn/AAE333/FALL10/HOMEWORKS/HW13/XFLR5_v6.01_Beta_Win32%282%29/Release/Guidelines.pdf (accessed on 11 December 2020).
- Anderson, J.D. Fundamentals of Aerodynamics, 5th ed.; McGraw-Hill: New York, NY, USA, 2011; ISBN 978-0-07-339810-5. [Google Scholar]
- Asselin, M. An Introduction to Aircraft Performance, 1st ed.; AIAA Education Series; AIAA Education: Reston, VA, USA, 1997; ISBN 9781563472213. [Google Scholar]
- Roskam, J. Airplane Design, Part IV: Layout Design of Landing Gear & Systems, 7th ed.; DAR Corporation: Lawrence, KS, USA, 2017; ISBN 9781884885532. [Google Scholar]
- Maskew, B. Program VSAERO Theory Document: A Computer Program for Calculating Nonlinear Aerodynamic Characteristics of Arbitrary Configurations. NASA Contractor Report 4023. 1987. Available online: https://ntrs.nasa.gov/citations/19900004884 (accessed on 11 December 2020).
- Spalart, P.R.; Allmaras, S.R. A one-equation turbulence model for aerodynamic flows. In Proceedings of the 30th Aerospace Sciences Meeting and Exhibit, Reno, NV, USA, 6–9 January 1992; pp. 5–21. [Google Scholar] [CrossRef]
- ANSYS, Inc. ANSYS CFX 2020 R2 Documentation. Available online: https://ansyshelp.ansys.com/account/secured?returnurl=/Views/Secured/prod_page.html?pn=CFX&pid=CFX&lang=en (accessed on 11 December 2020).
- ANSA. BETA CAE Systems, ANSA 21.0.1, ANSA Software Manual; ANSA: Rome, Italy, 2020. [Google Scholar]
- Menter, F.R. Two-equation eddy-viscosity turbulence models for engineering applications. AIAA J. 1994, 32, 1598–1605. [Google Scholar] [CrossRef] [Green Version]
- Chen, L.; Guo, Z.; Deng, X.; Hou, Z. Aerodynamic Performance and Transition Prediction of Low-Speed Fixed-Wing Unmanned Aerial Vehicles in Full Configuration Based on Improved γ—Re Model. Aerosp. Sci. Technol. 2020, 107, 106281:1–106281:15. [Google Scholar] [CrossRef]
- Vicroy, D.D.; Gatlin, G.M.; Jenkins, L.N.; Murphy, P.C.; Carter, M.B. Low-speed Aerodynamic Investigations of a Hybrid Wing Body Configuration. In Proceedings of the 32nd AIAA Applied Aerodynamics Conference, Atlanta, GA, USA, 16–20 June 2014. [Google Scholar] [CrossRef] [Green Version]
- Kitsios, I.; Dimopoulos, T.; Panagiotou, P.; Yakinthos, K. Longitudinal Dynamics Analysis and Autopilot Design for a Fixed-Wing, Tactical Blended-Wing-Body UAV. In Proceedings of the 2020 International Conference on Unmanned Aircraft Systems (ICUAS), Athens, Greece, 1–4 September 2020; pp. 149–157. [Google Scholar] [CrossRef]
Figure 1.
Quasi-3D method roadmap.

Figure 2.
External layout of the tactical Blended-Wing-Body (BWB) Unmanned Aerial Vehicle (UAV), reference platform [8].
Figure 2.
External layout of the tactical Blended-Wing-Body (BWB) Unmanned Aerial Vehicle (UAV), reference platform [8].

Figure 3.
Division of the reference BWB UAV platform in spanwise sections. Sections marked in orange correspond to the predefined ones, sections marked in blue and green to correspond the ones generated by lofting. Green is also used to define control surfaces area and frames.
Figure 3.
Division of the reference BWB UAV platform in spanwise sections. Sections marked in orange correspond to the predefined ones, sections marked in blue and green to correspond the ones generated by lofting. Green is also used to define control surfaces area and frames.

Figure 4.
Parametric studies for the determination of the required number of sections.

Figure 5.
An MH-93 airfoil, as generated by XFOIL from a cloud of points, undeflected (solid line) and with a 20%-chord flap at a 10° deflection (dashed line).
Figure 5.
An MH-93 airfoil, as generated by XFOIL from a cloud of points, undeflected (solid line) and with a 20%-chord flap at a 10° deflection (dashed line).

Figure 6.
Demonstration of the panel method analysis [28].
Figure 6.
Demonstration of the panel method analysis [28].

Figure 7.
Lift coefficient as a function of angle of attack graph, for the MH-93 airfoil for three different Reynolds numbers (Re), with and without elevon deflection (δe).
Figure 7.
Lift coefficient as a function of angle of attack graph, for the MH-93 airfoil for three different Reynolds numbers (Re), with and without elevon deflection (δe).

Figure 8.
The reference BWB UAV aircraft configuration, modelled using XFLR5 3D.

Figure 9.
Grid dependency study.

Figure 10.
Computational mesh on the surface (a) and around (b) the BWB UAV reference configuration [8].
Figure 10.
Computational mesh on the surface (a) and around (b) the BWB UAV reference configuration [8].

Figure 11.
Streamlines around the BWB UAV reference configuration (left) and flow development over the deflected elevon control surface at a deflection angle of 10 degrees (right). The angle of attack is 8 degrees.
Figure 11.
Streamlines around the BWB UAV reference configuration (left) and flow development over the deflected elevon control surface at a deflection angle of 10 degrees (right). The angle of attack is 8 degrees.

Figure 12.
Lift (left) and pitching moment (right) coefficients versus angle of attack comparison between the examined methods (clean configuration).
Figure 12.
Lift (left) and pitching moment (right) coefficients versus angle of attack comparison between the examined methods (clean configuration).

Figure 13.
Lift and moment coefficients versus elevon (a,b) and ruddervator (c,d) deflection angle for 0 degrees of angle of attack.
Figure 13.
Lift and moment coefficients versus elevon (a,b) and ruddervator (c,d) deflection angle for 0 degrees of angle of attack.

Figure 14.
Trim diagram at reference mid-cruise conditions. The CFD and proposed method results are shown in square markers and dashed lines, respectively. Blue color is used to denote the trimmed state.
Figure 14.
Trim diagram at reference mid-cruise conditions. The CFD and proposed method results are shown in square markers and dashed lines, respectively. Blue color is used to denote the trimmed state.

Figure 15.
Lift and moment coefficient prediction for takeoff conditions, with- (c,d) and without (a,b) ground effect corrections.
Figure 15.
Lift and moment coefficient prediction for takeoff conditions, with- (c,d) and without (a,b) ground effect corrections.

Figure 16.
Lift coefficient comparison, for configurations (a–d).


Table 1.
Reference BWB UAV platform specifications.
| MTOW | 200–600 | (kg) |
| Cruise speed | 160 | (km/h) |
| Takeoff speed | 108 | (km/h) |
| Service ceiling | 15,000–20,000 | (ft) |
| Payload capacity | Depends on the scenario | |
| - Scenario 1 | 100 | (kg) |
| - Scenario 2 | 50 | (kg) |
| Endurance | Depends on the scenario | |
| - Scenario 1 | <10 | (h) |
| - Scenario 2 | >10 | (h) |
Table 2.
Computational Fluid Dynamics (CFD) cases modelled for the present study.
| Flight Segment | Angles of Attack (deg) | Freestream Velocities (m/s) | Elevon Deflections (deg) | Ruddervator Deflections (deg) | Altitude (m) |
|---|---|---|---|---|---|
| Cruise | −4, 0, 4, 8, 12 | 50 | 0 | 0 | 2000 |
| Cruise | 0 | 50 | −10, −5, 5, 10 | 0 | 2000 |
| Cruise | 0 | 50 | 0 | −5, 5 | 2000 |
| Takeoff | −4, 0, 4, 8 | 30 | −35 | −35 | 0 |
Table 3.
Lift coefficient prediction comparison between the three methods.
| AOA | CFD | XFLR5 3D | Proposed Method | XFLR5 3D vs. CFD | Proposed Method vs. CFD |
|---|---|---|---|---|---|
| −4 | −0.2669 | −0.1659 | −0.2392 | 37.8% | 10.4% |
| 0 | 0.1476 | 0.0920 | 0.1483 | 37.7% | 0.5% |
| 4 | 0.5647 | 0.3489 | 0.5462 | 38.2% | 3.3% |
| 8 | 0.9583 | 0.6022 | 0.9376 | 37.2% | 2.2% |
| 12 | 1.2259 | 0.8497 | 1.2425 | 30.7% | 1.4% |
Table 4.
Pitching coefficient prediction comparison between the three methods.
| AOA | CFD | XFLR5 3D | Proposed Method | XFLR5 3D vs. CFD | Proposed Method vs. CFD |
|---|---|---|---|---|---|
| −4 | 65.0% | 8.7% | |||
| 0 | Data restrictions apply | 59.1% | 19.3% | ||
| 4 | 137.7% | 10.6% | |||
| 8 | 114.8% | 7.3% | |||
| 12 | 113.5% | 88.7% | |||
Table 5.
Features of the four examined BWB configurations.
| Configuration | Sweep Angle (Degrees) | AR |
|---|---|---|
| (a) | 0 | 24 |
| (b) | 40 | 8 |
| (c) | 20 | 8 |
| (d) | −10 | 8 |
Publisher’s Note: MDPI stays neutral with regard to jurisdictional claims in published maps and institutional affiliations. |
© 2021 by the authors. Licensee MDPI, Basel, Switzerland. This article is an open access article distributed under the terms and conditions of the Creative Commons Attribution (CC BY) license (http://creativecommons.org/licenses/by/4.0/).
Share and Cite
MDPI and ACS Style
Panagiotou, P.; Dimopoulos, T.; Dimitriou, S.; Yakinthos, K. Quasi-3D Aerodynamic Analysis Method for Blended-Wing-Body UAV Configurations. Aerospace 2021, 8, 13. https://0-doi-org.brum.beds.ac.uk/10.3390/aerospace8010013
AMA Style
Panagiotou P, Dimopoulos T, Dimitriou S, Yakinthos K. Quasi-3D Aerodynamic Analysis Method for Blended-Wing-Body UAV Configurations. Aerospace. 2021; 8(1):13. https://0-doi-org.brum.beds.ac.uk/10.3390/aerospace8010013
Chicago/Turabian StylePanagiotou, Pericles, Thomas Dimopoulos, Stylianos Dimitriou, and Kyros Yakinthos. 2021. "Quasi-3D Aerodynamic Analysis Method for Blended-Wing-Body UAV Configurations" Aerospace 8, no. 1: 13. https://0-doi-org.brum.beds.ac.uk/10.3390/aerospace8010013
Note that from the first issue of 2016, this journal uses article numbers instead of page numbers. See further details here.