Author Contributions
Conceptualization: A.S., F.P., F.T., A.C.P., B.D.C., M.K., X.Z., J.B. and G.W.; Methodology, A.S., A.L.H., F.P., F.T., A.C.P., B.D.C., M.v.S., M.K., X.Z., T.G., J.B. and G.W.; Validation: A.S., A.L.H., F.P., A.C.P., B.D.C., M.v.S., M.K., X.Z., J.B. and G.W.; Formal analysis: A.S., A.L.H., F.P., M.K., X.Z., J.B. and G.W.; Investigation: A.S., F.T., A.C.P., B.D.C., M.v.S., M.K., X.Z., J.B. and G.W.; Data curation: A.S., A.L.H., F.P. and F.T.; Writing—original draft preparation: A.S., A.L.H., F.P., A.C.P., B.D.C., M.v.S., M.K., X.Z. and G.W.; Writing—review and editing: A.S., A.L.H., A.C.P. and J.B.; Supervision: A.S., Z.G. and T.G.; Visualization: A.S., A.L.H., F.P., A.C.P., B.D.C., M.v.S., M.K., X.Z. and G.W.; Project administration, A.S.; Funding acquisition: A.S., Z.G., T.G., J.B., and G.W. All authors have read and agreed to the published version of the manuscript.
Acknowledgments
This paper is based on the work performed by the CENTRELINE project consortium comprising Airbus, Bauhaus Luftfahrt, Chalmers Tekniska Hoegskola, MTU Aero Engines, Politechnika Warszawska, Rolls Royce, Delft University of Technology, University of Cambridge, and ARTTIC. The authors would like express their gratitude to the following individuals for their support during the CENTRELINE project (in alphabetical order): Anders Lundbladh, André Denis Bord, Arvind Gangoli Rao, Bartlomiej Goliszek, Cesare Hall, Daniel Reckzeh, Frank Meller, Jasper van Wensween, Lars Jørgensen, Marc Engelmann, Mark Voskuijl, Markus Nickl, Martin Dietz, Maxime Flandrin, Michael Lüdemann, Michaël Meheut, Michael Shamiyeh, Olaf Brodersen, Olivier Petit, Philipp Maas, Rasmus Merkler, Sebastian Samuelsson, Sophie Rau, and Stefan Biser.
Figure 1.
Artist view of the CENTRELINE turbo-electric propulsive fuselage aircraft design.
Figure 1.
Artist view of the CENTRELINE turbo-electric propulsive fuselage aircraft design.
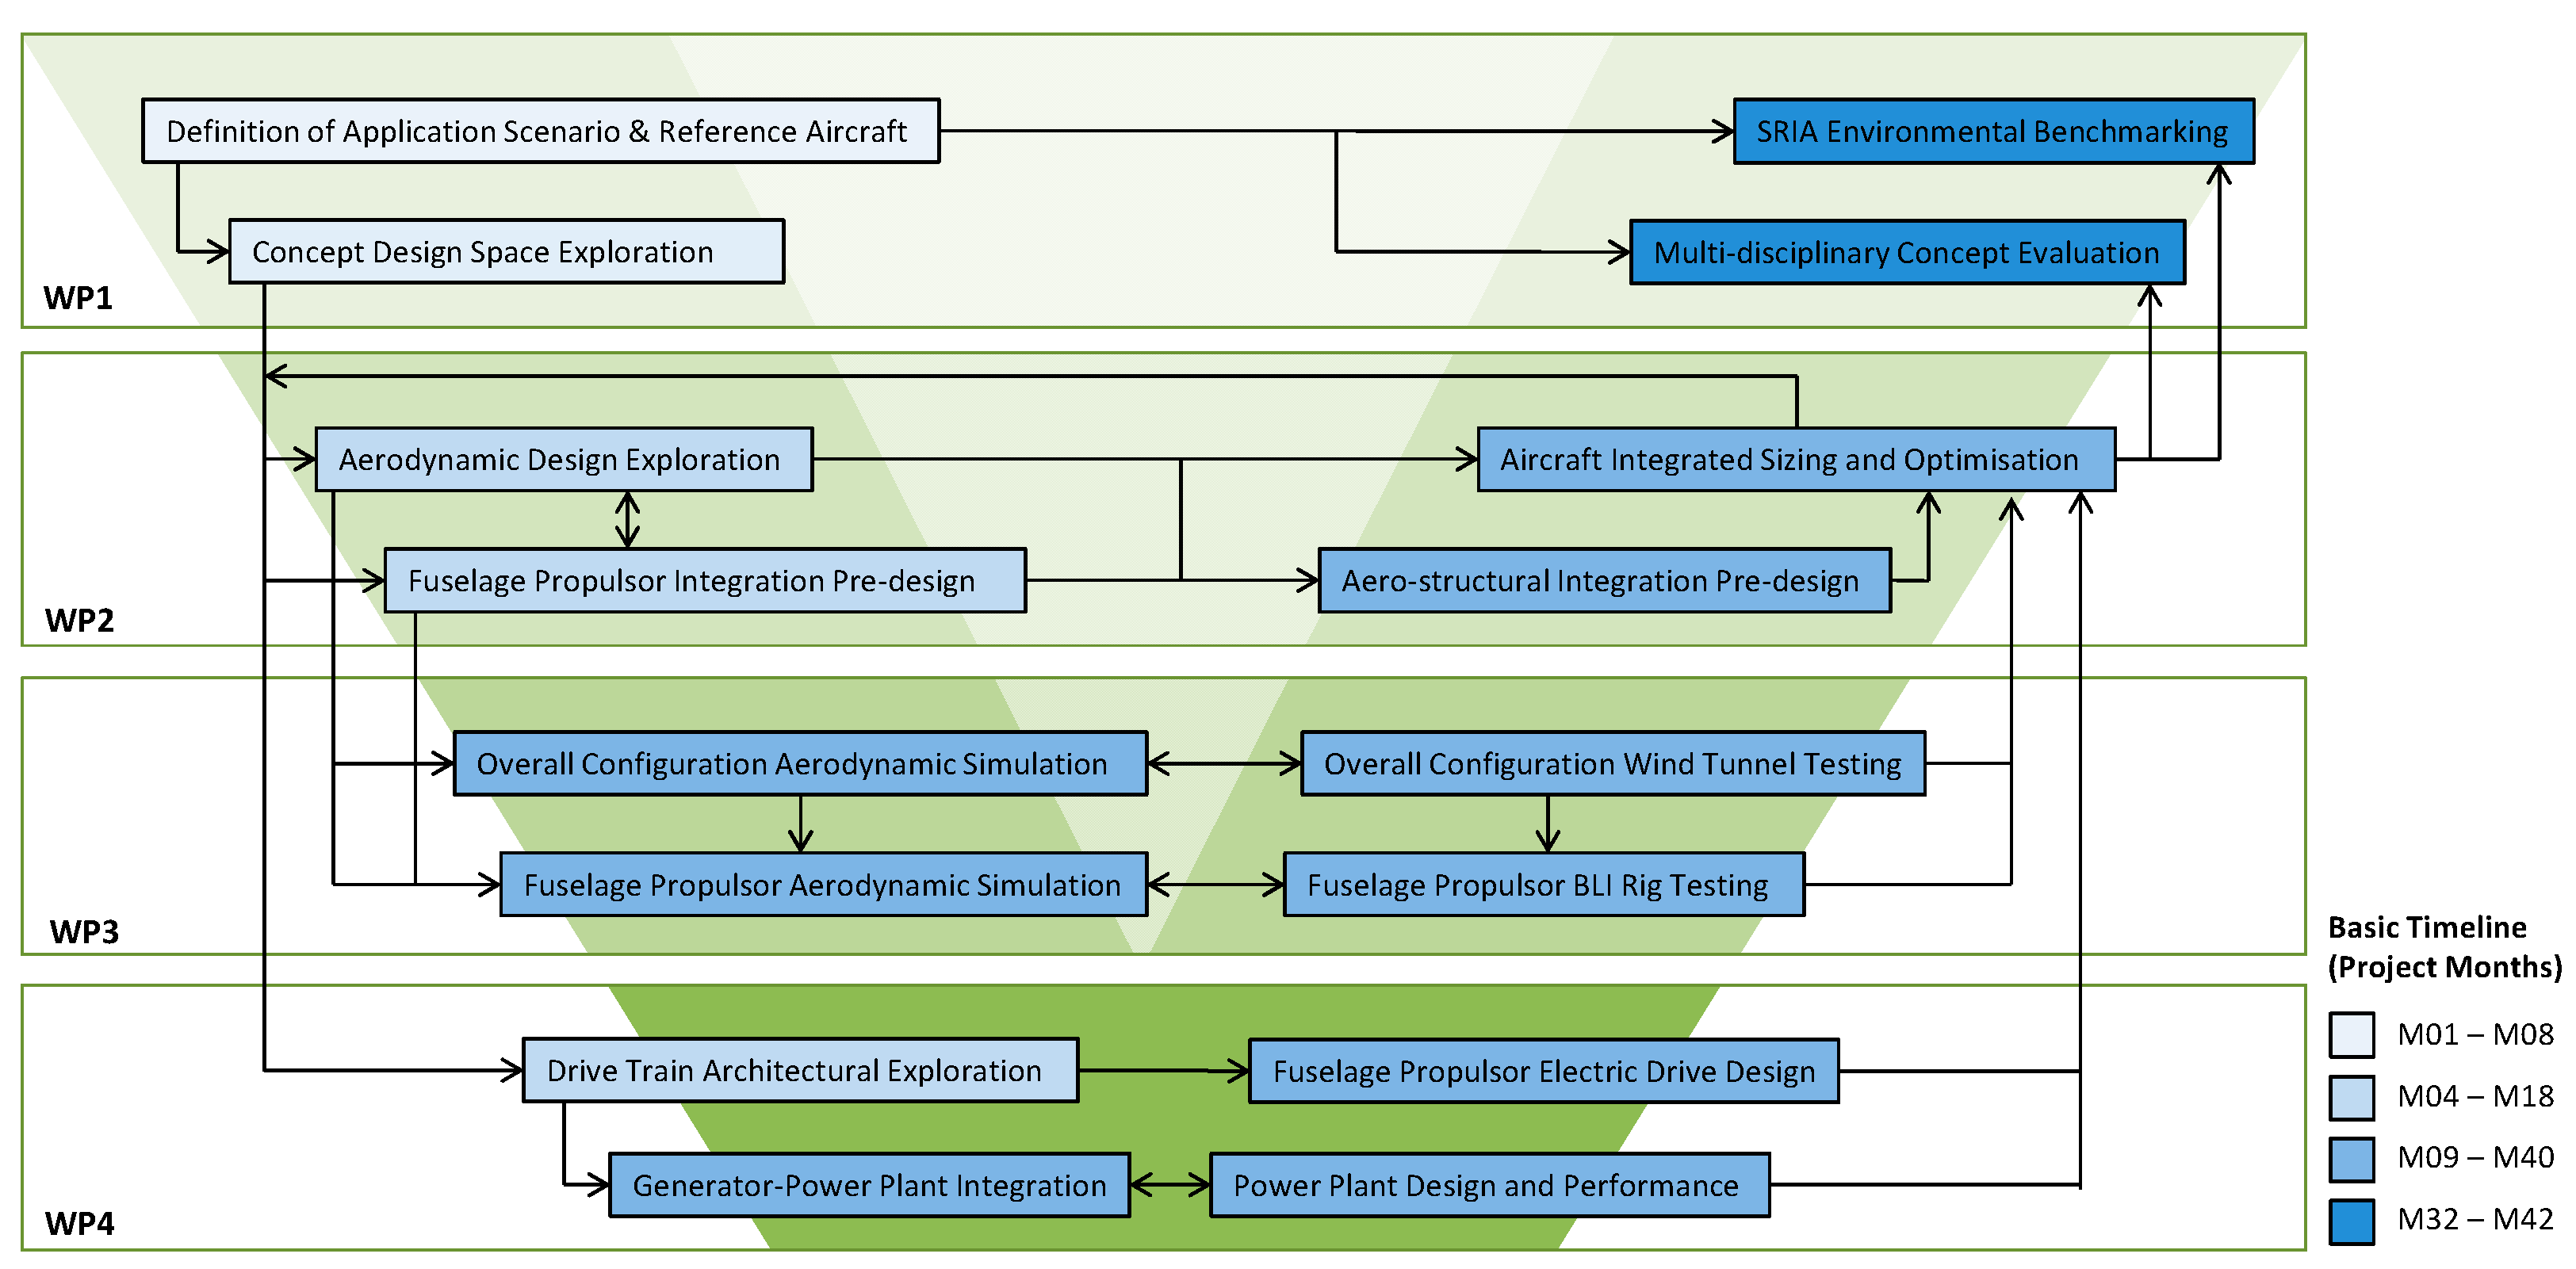
Figure 2.
The basic CENTRELINE work logic.
Figure 2.
The basic CENTRELINE work logic.
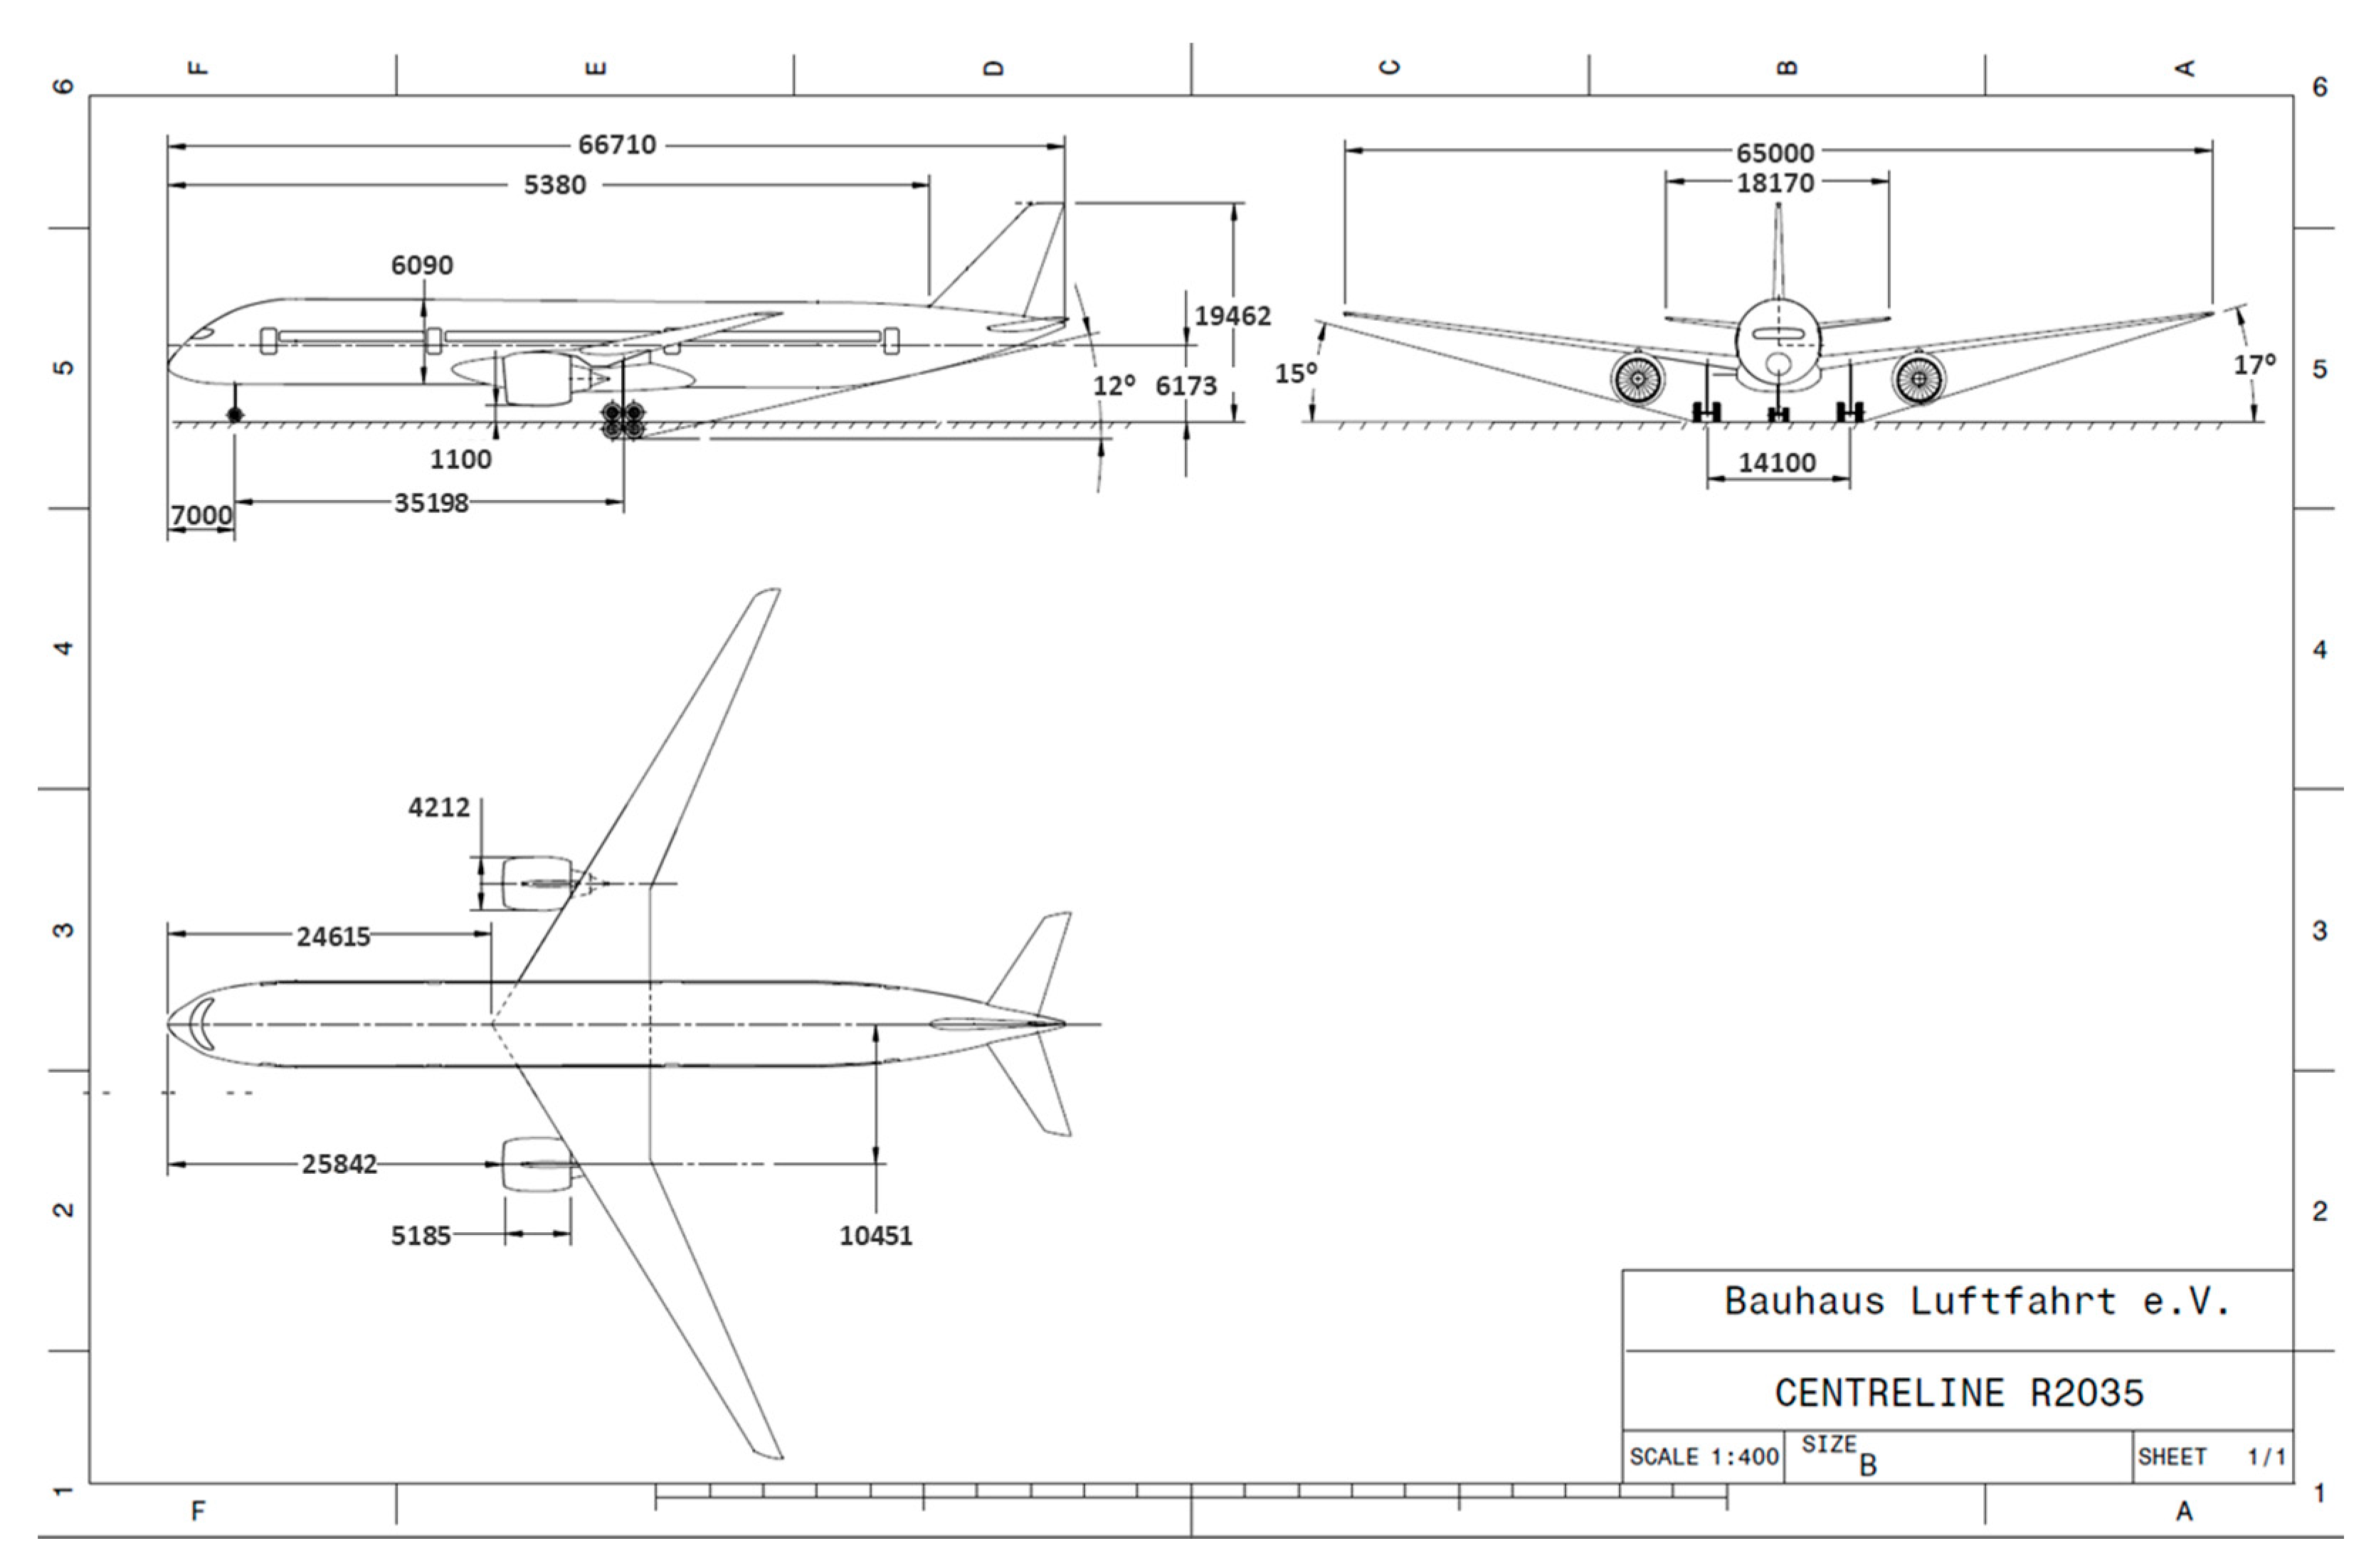
Figure 3.
Schematic three-view of the CENTRELINE R2035 baseline aircraft.
Figure 3.
Schematic three-view of the CENTRELINE R2035 baseline aircraft.
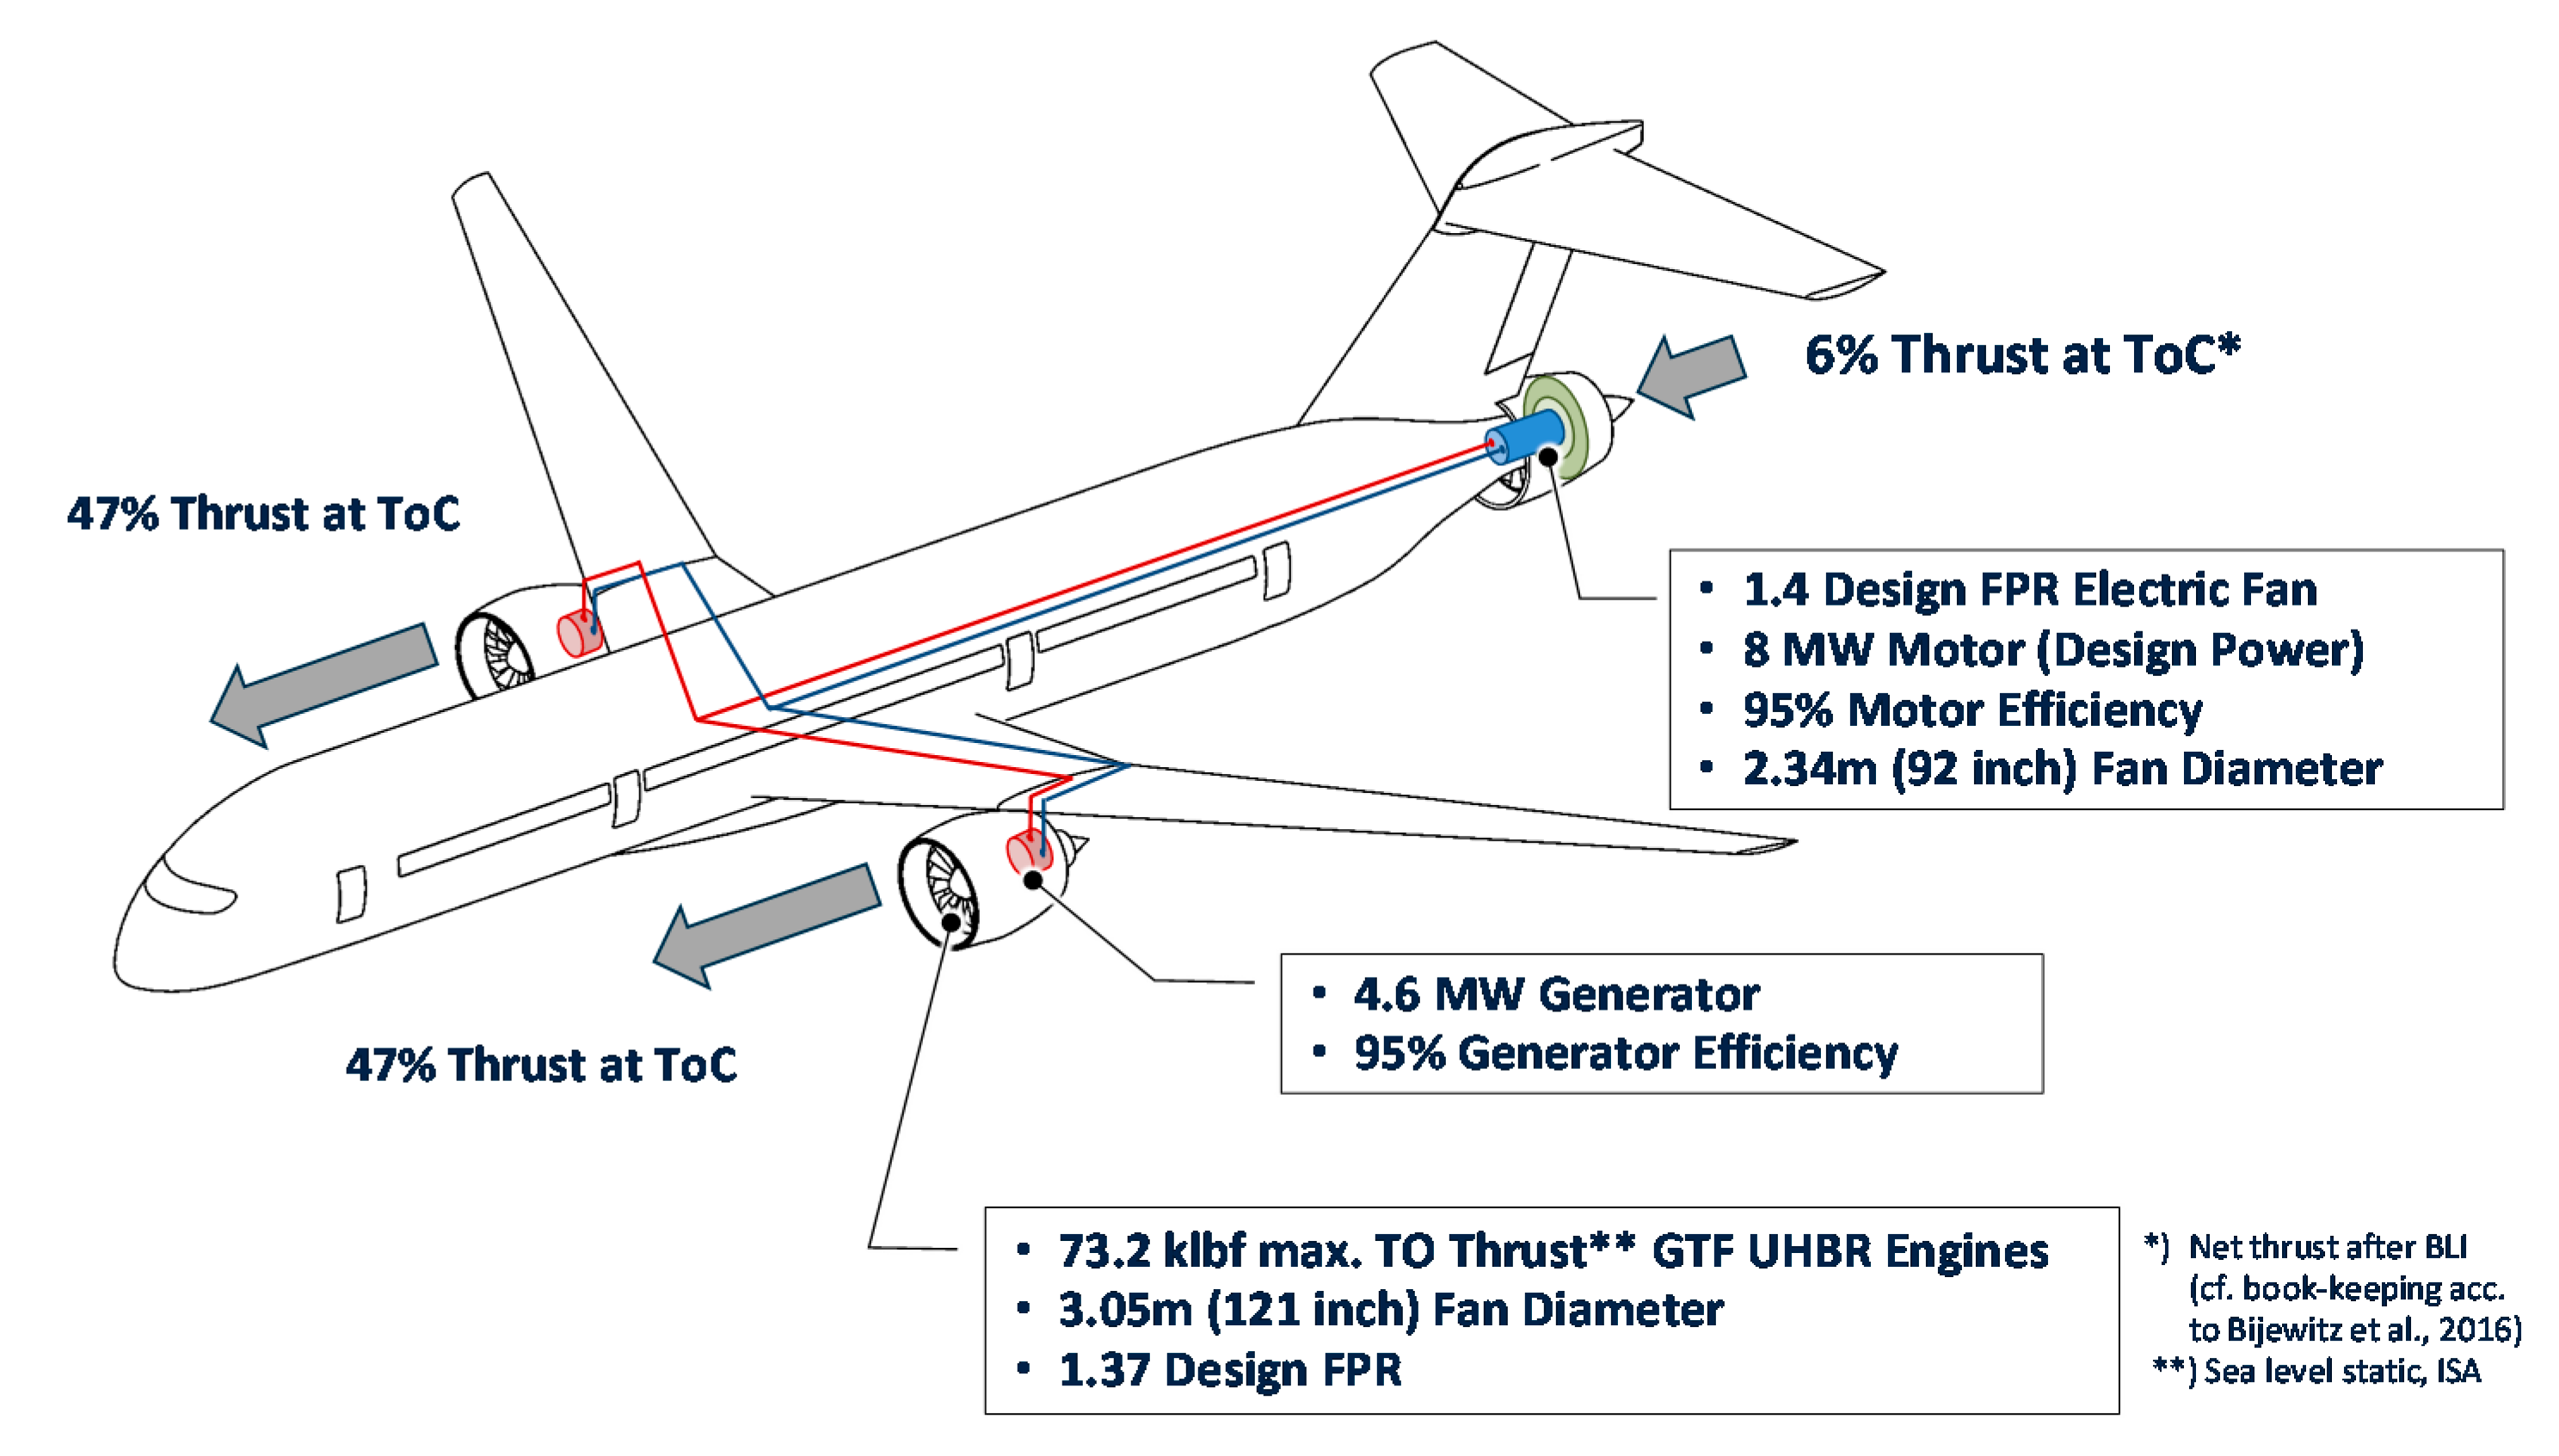
Figure 4.
Main design features of the CENTRELINE initial propulsive fuselage target design (adapted from [
43]).
Figure 4.
Main design features of the CENTRELINE initial propulsive fuselage target design (adapted from [
43]).
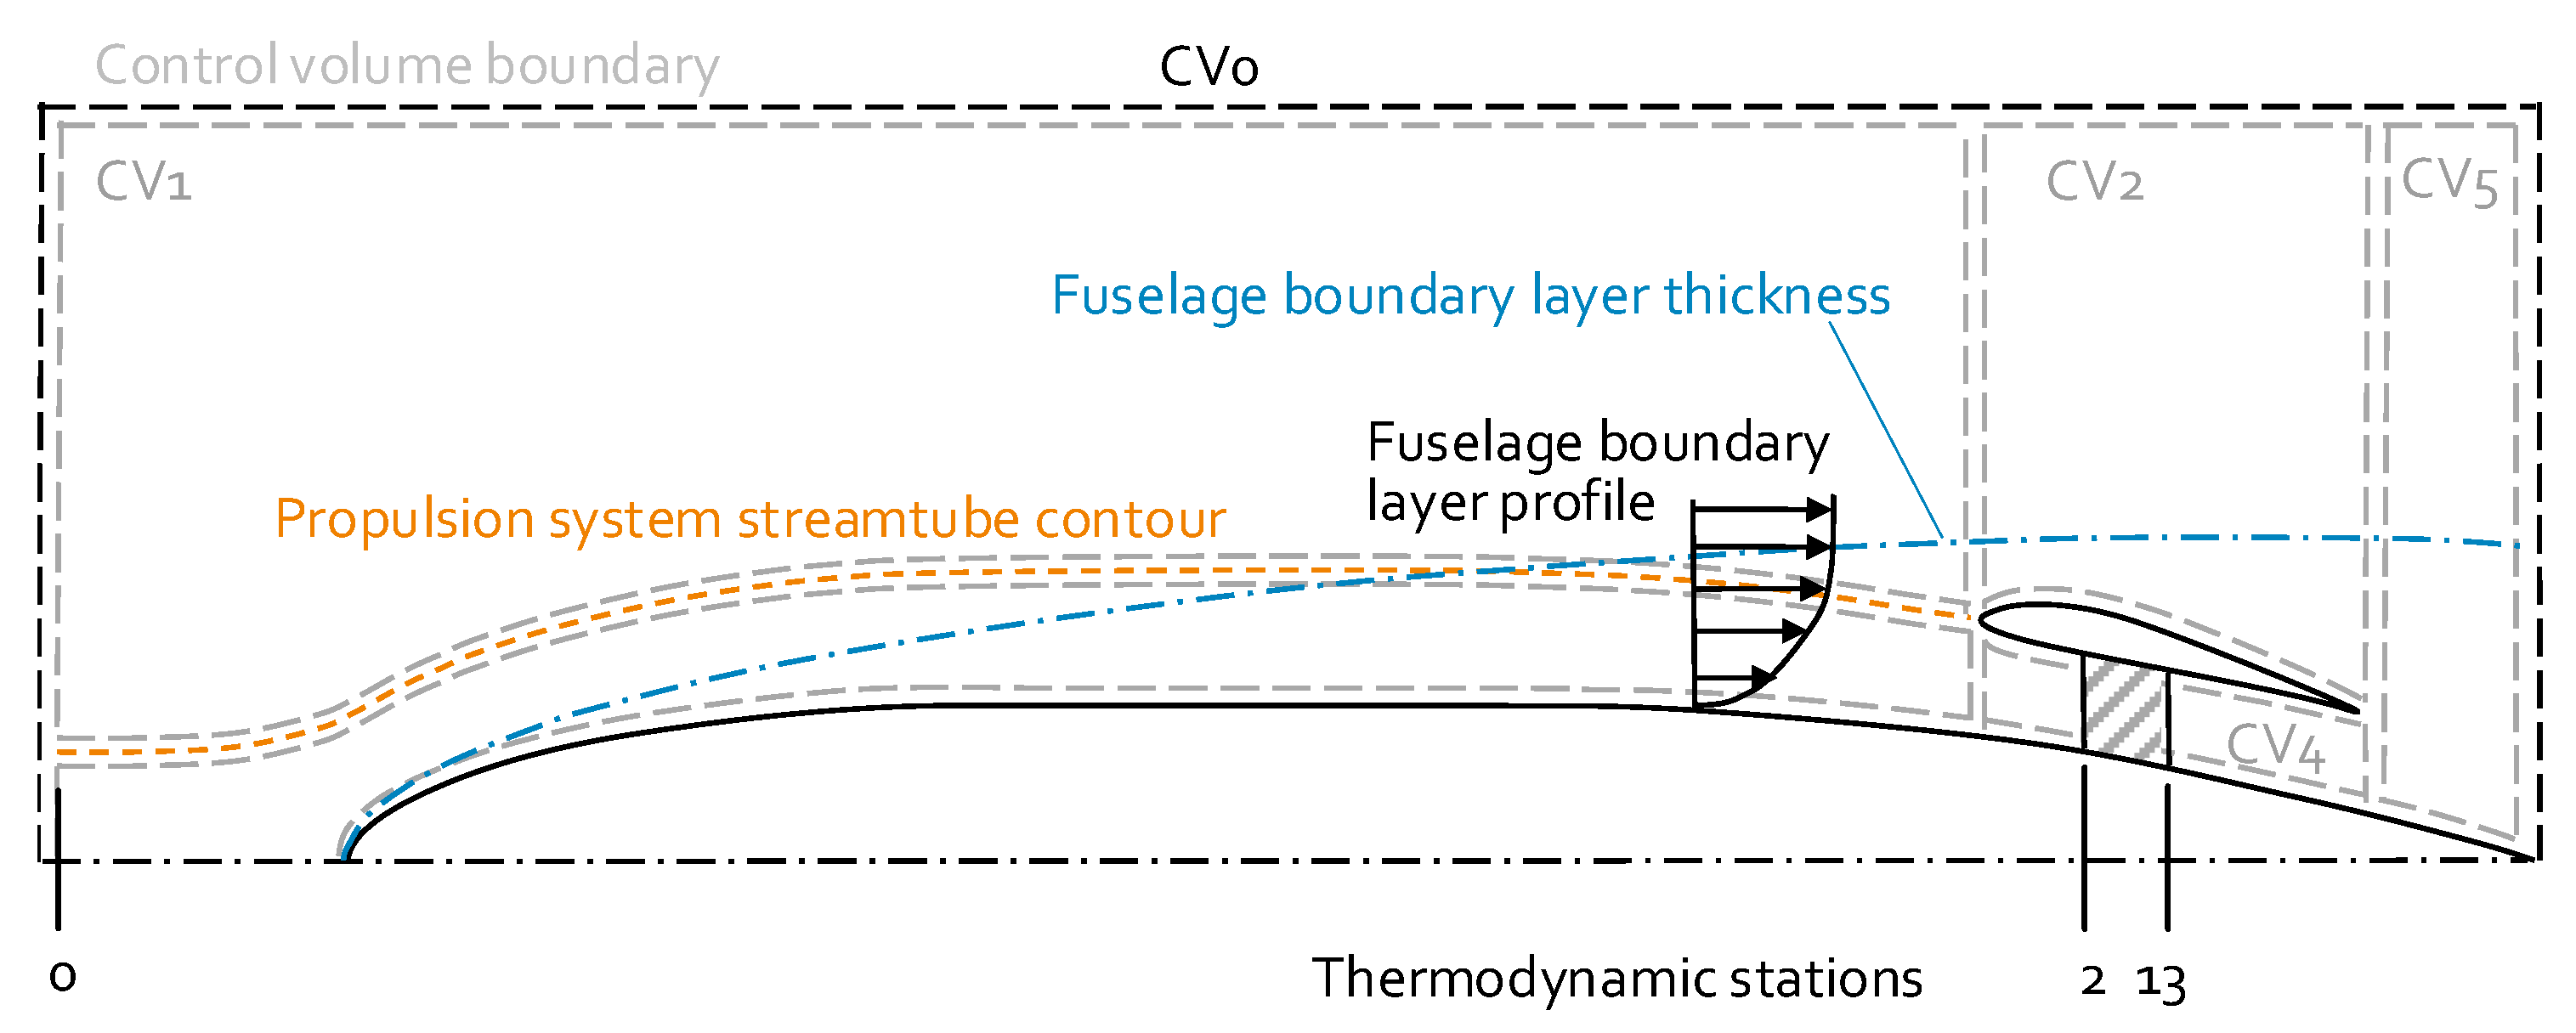
Figure 5.
Control volume scheme for bare PFC bookkeeping (adapted from [
45]).
Figure 5.
Control volume scheme for bare PFC bookkeeping (adapted from [
45]).
Figure 6.
Evolution of the aerodynamic performance of the bare PFC fuselage (adapted from [
50]).
Figure 6.
Evolution of the aerodynamic performance of the bare PFC fuselage (adapted from [
50]).
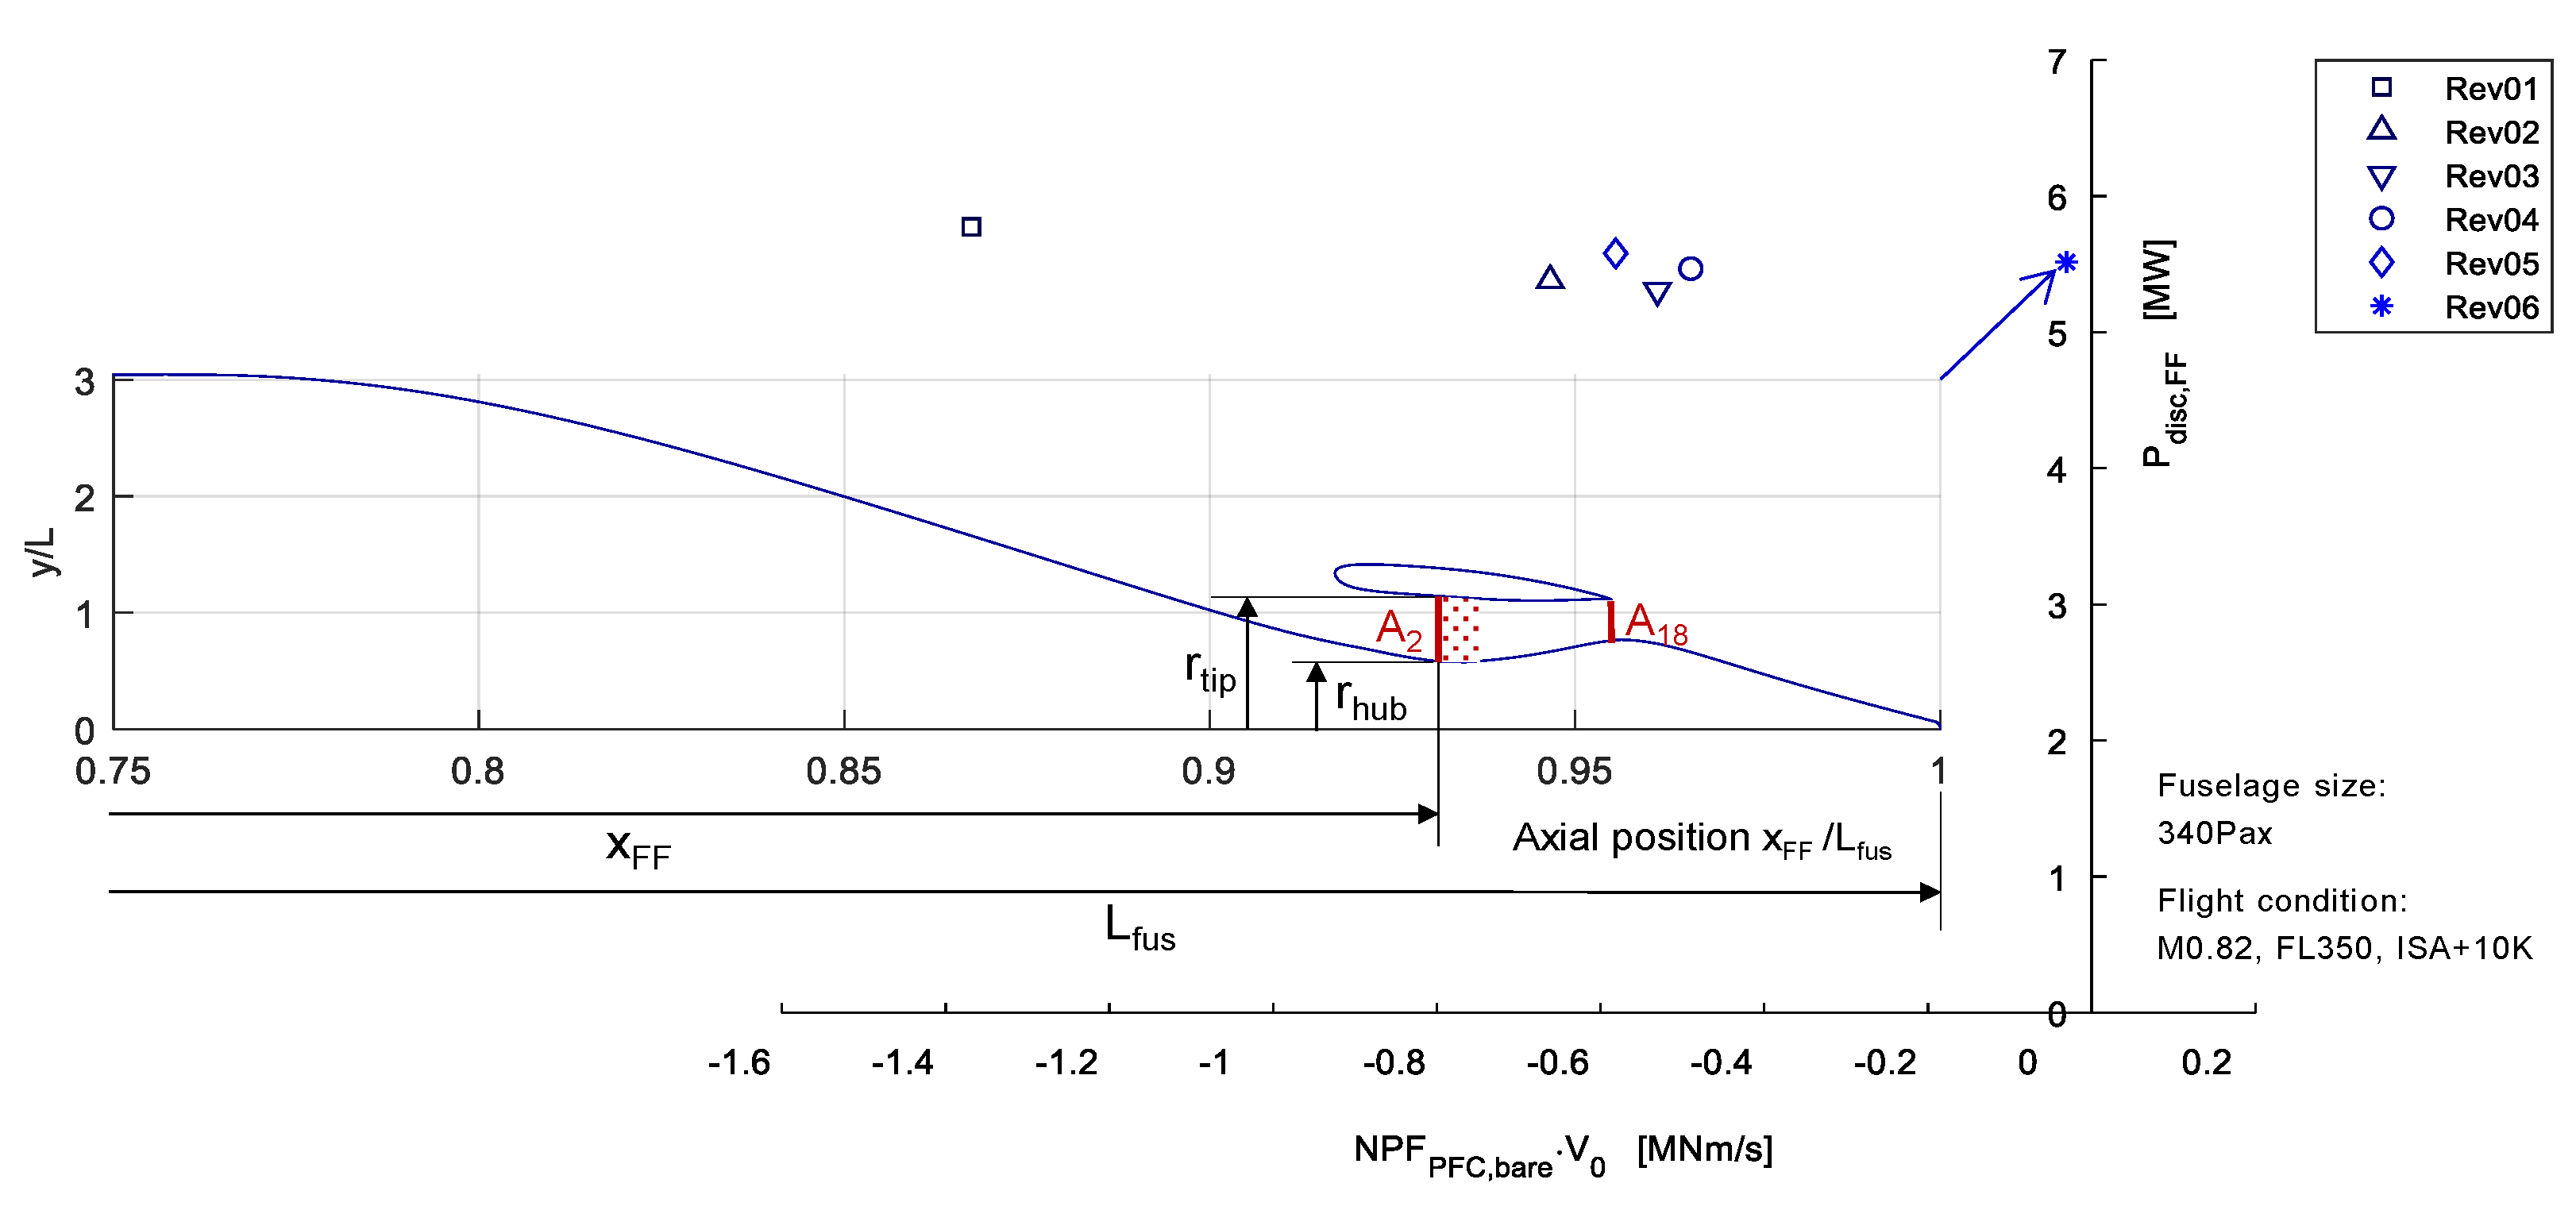
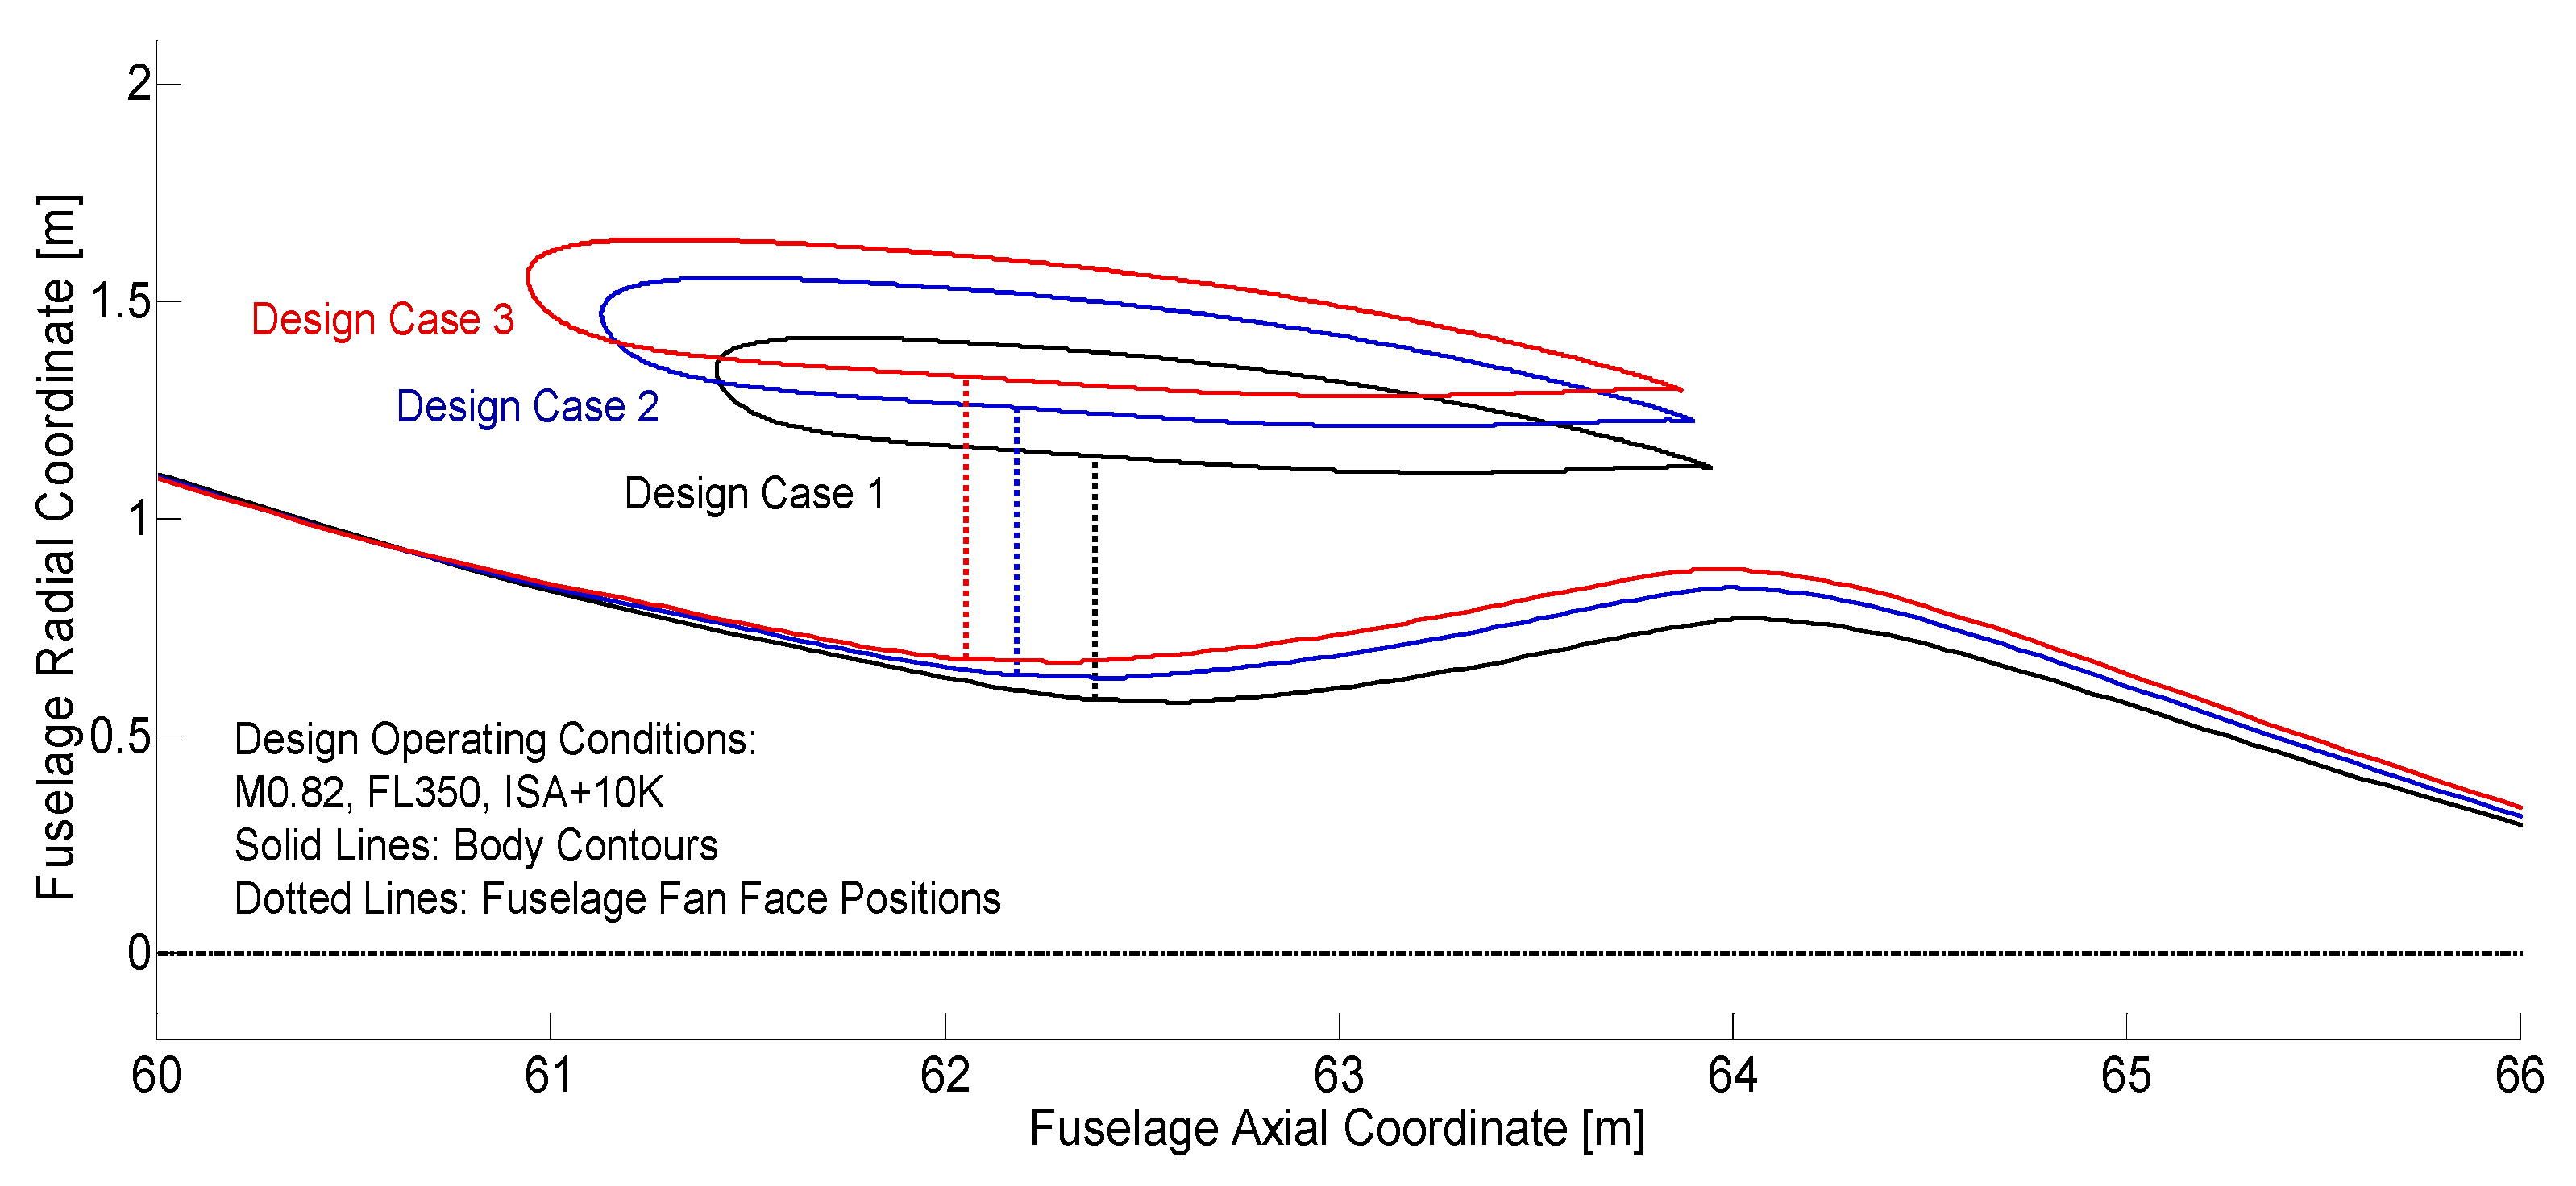
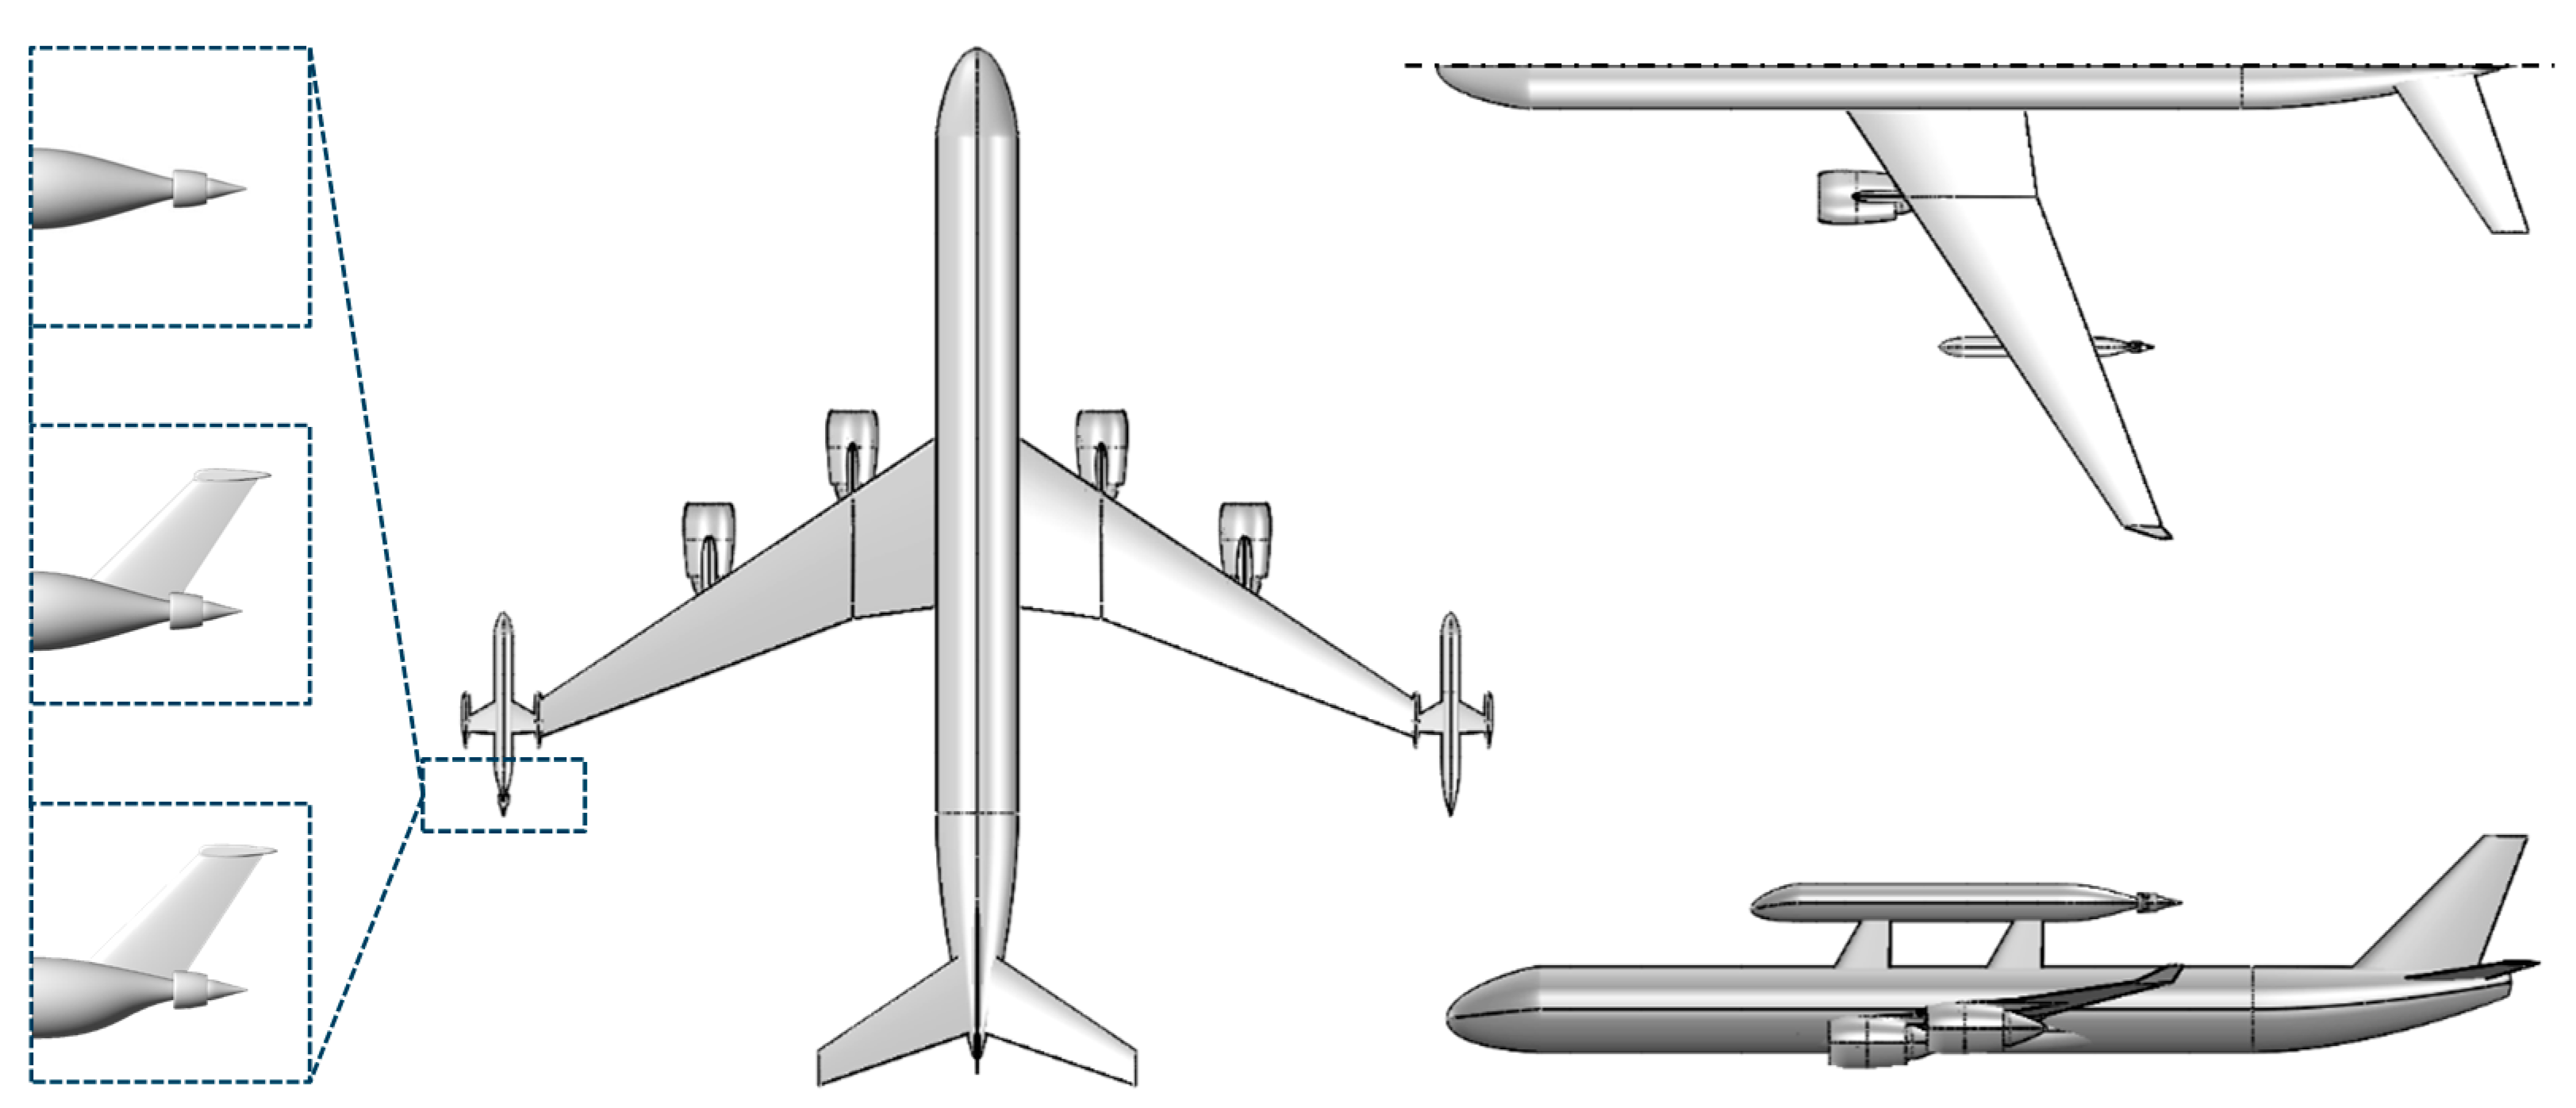
Figure 7.
Changes in FF geometry of the Rev07 PFC design for different target FF shaft power.
Figure 7.
Changes in FF geometry of the Rev07 PFC design for different target FF shaft power.
Figure 8.
Side-view of the aerodynamic model of the PFC, including wing and vertical tail.
Figure 8.
Side-view of the aerodynamic model of the PFC, including wing and vertical tail.
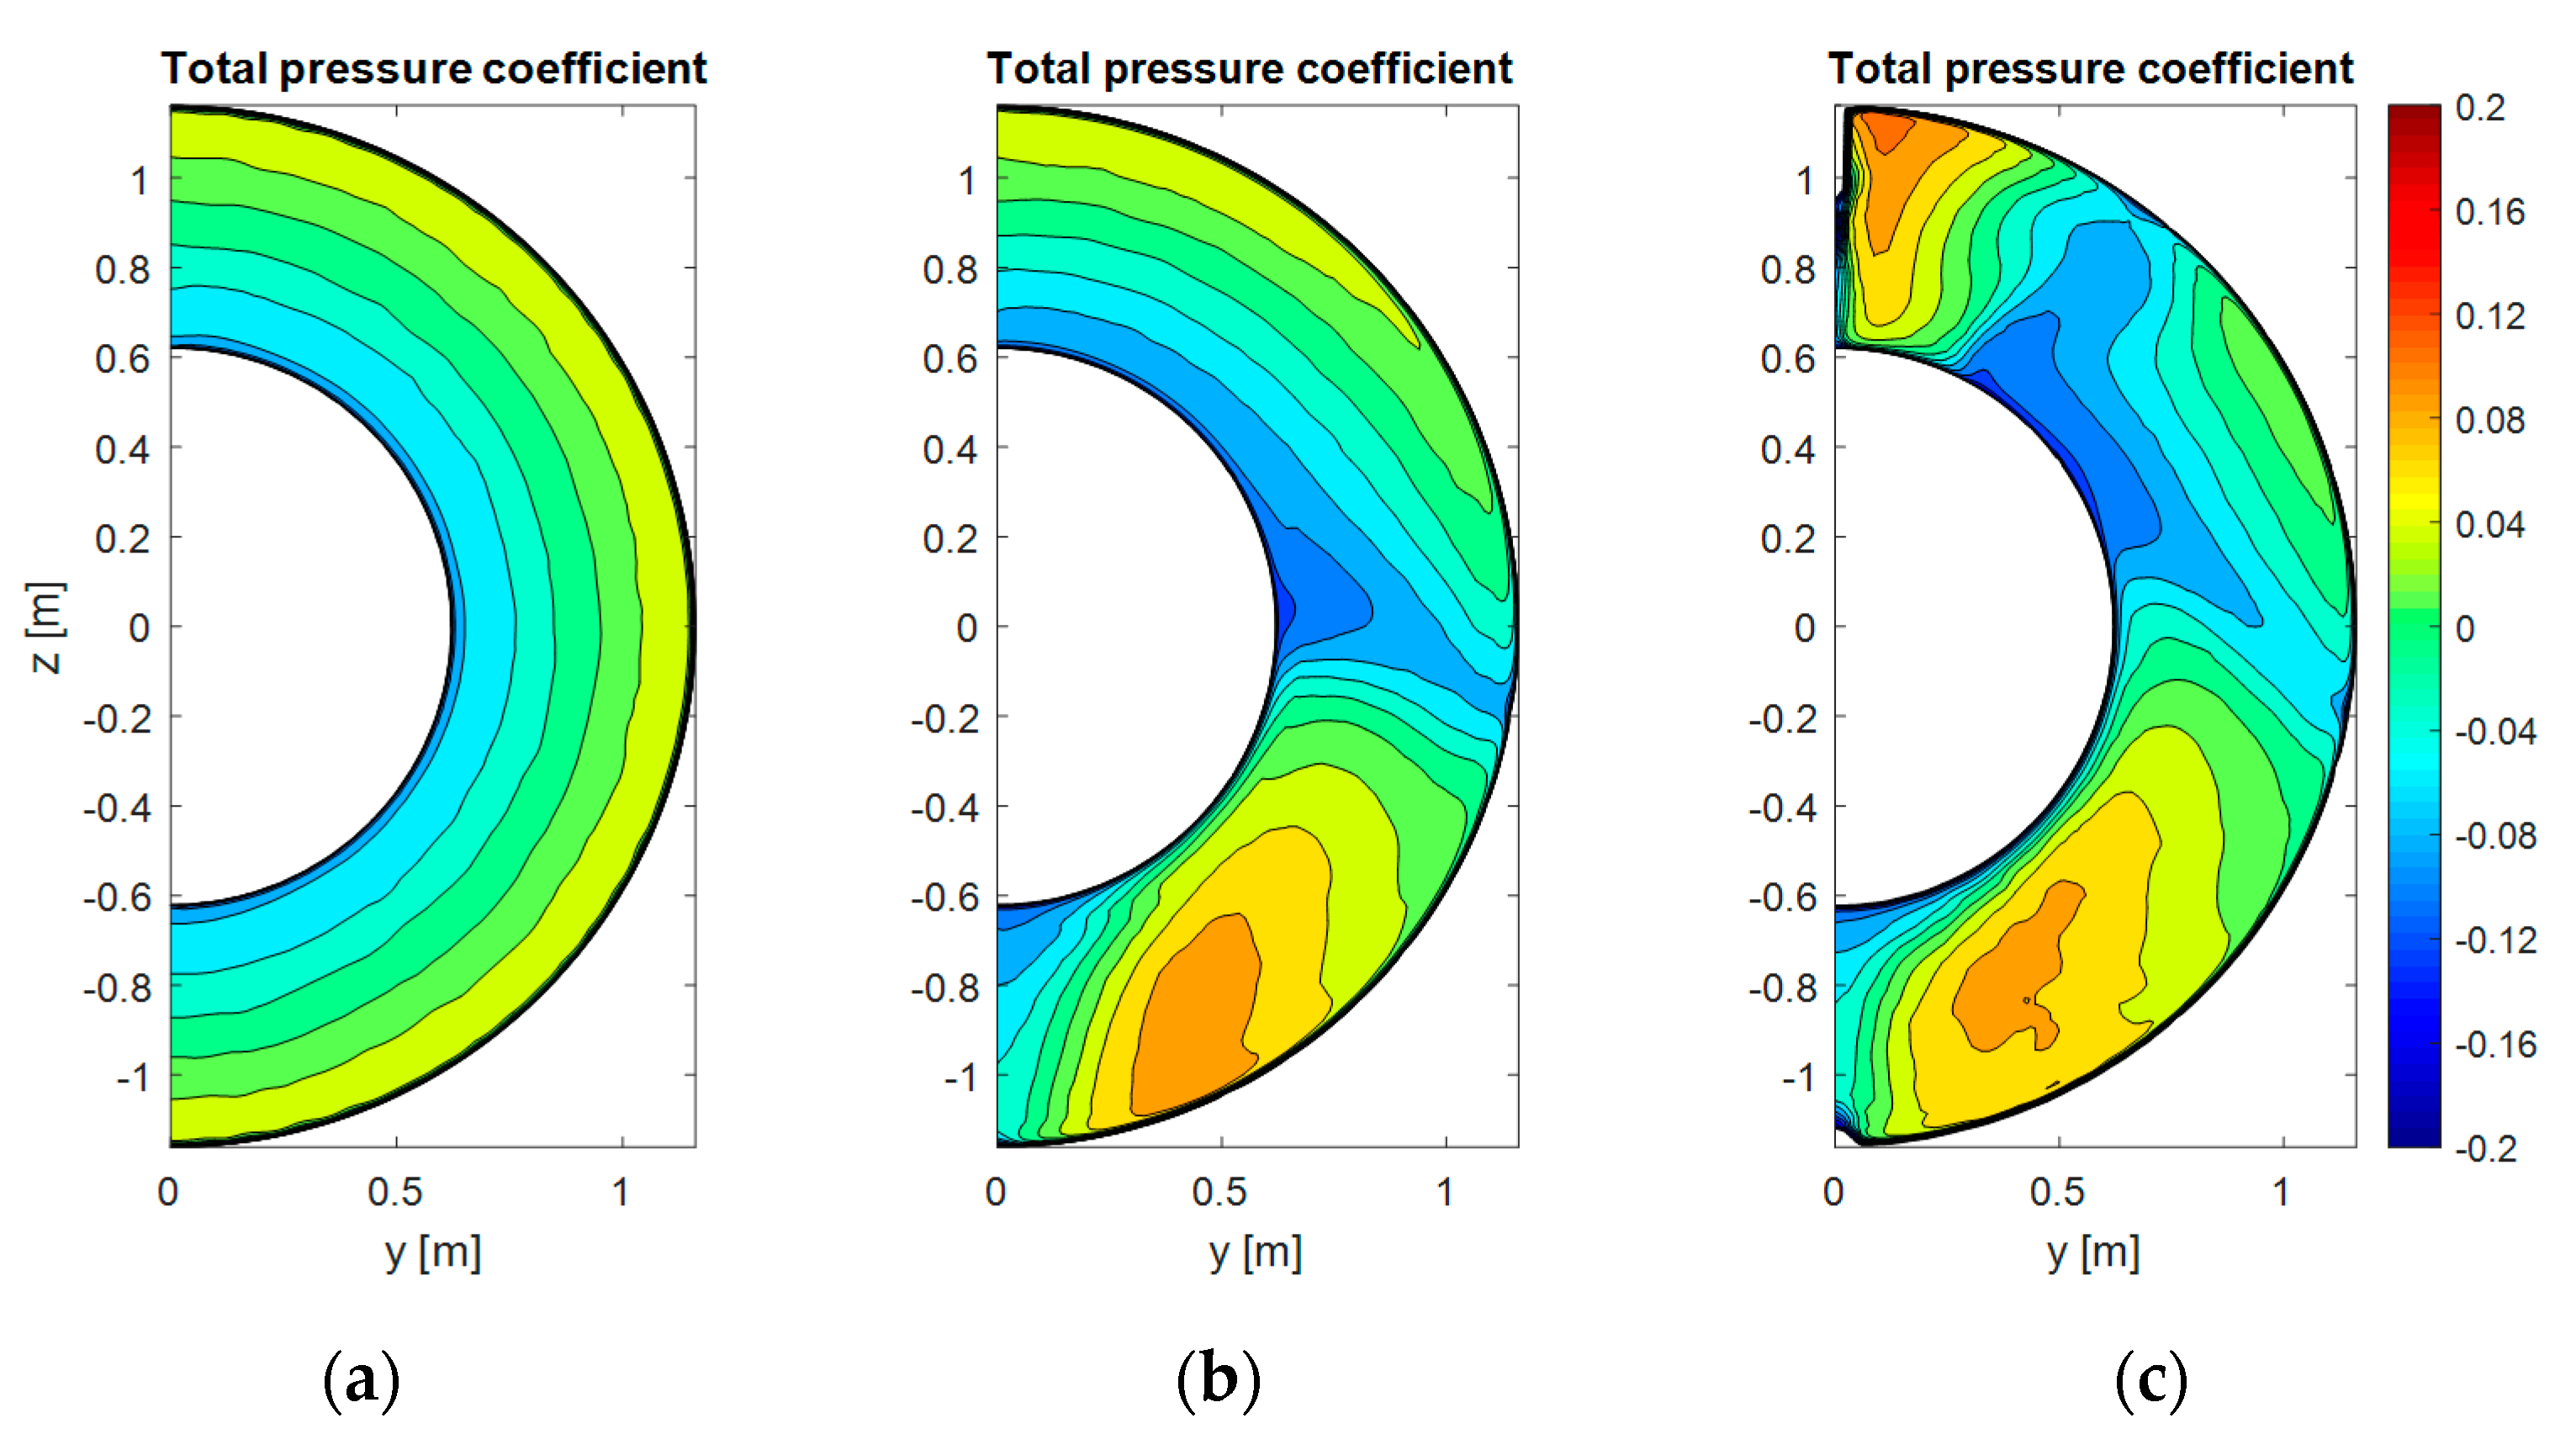
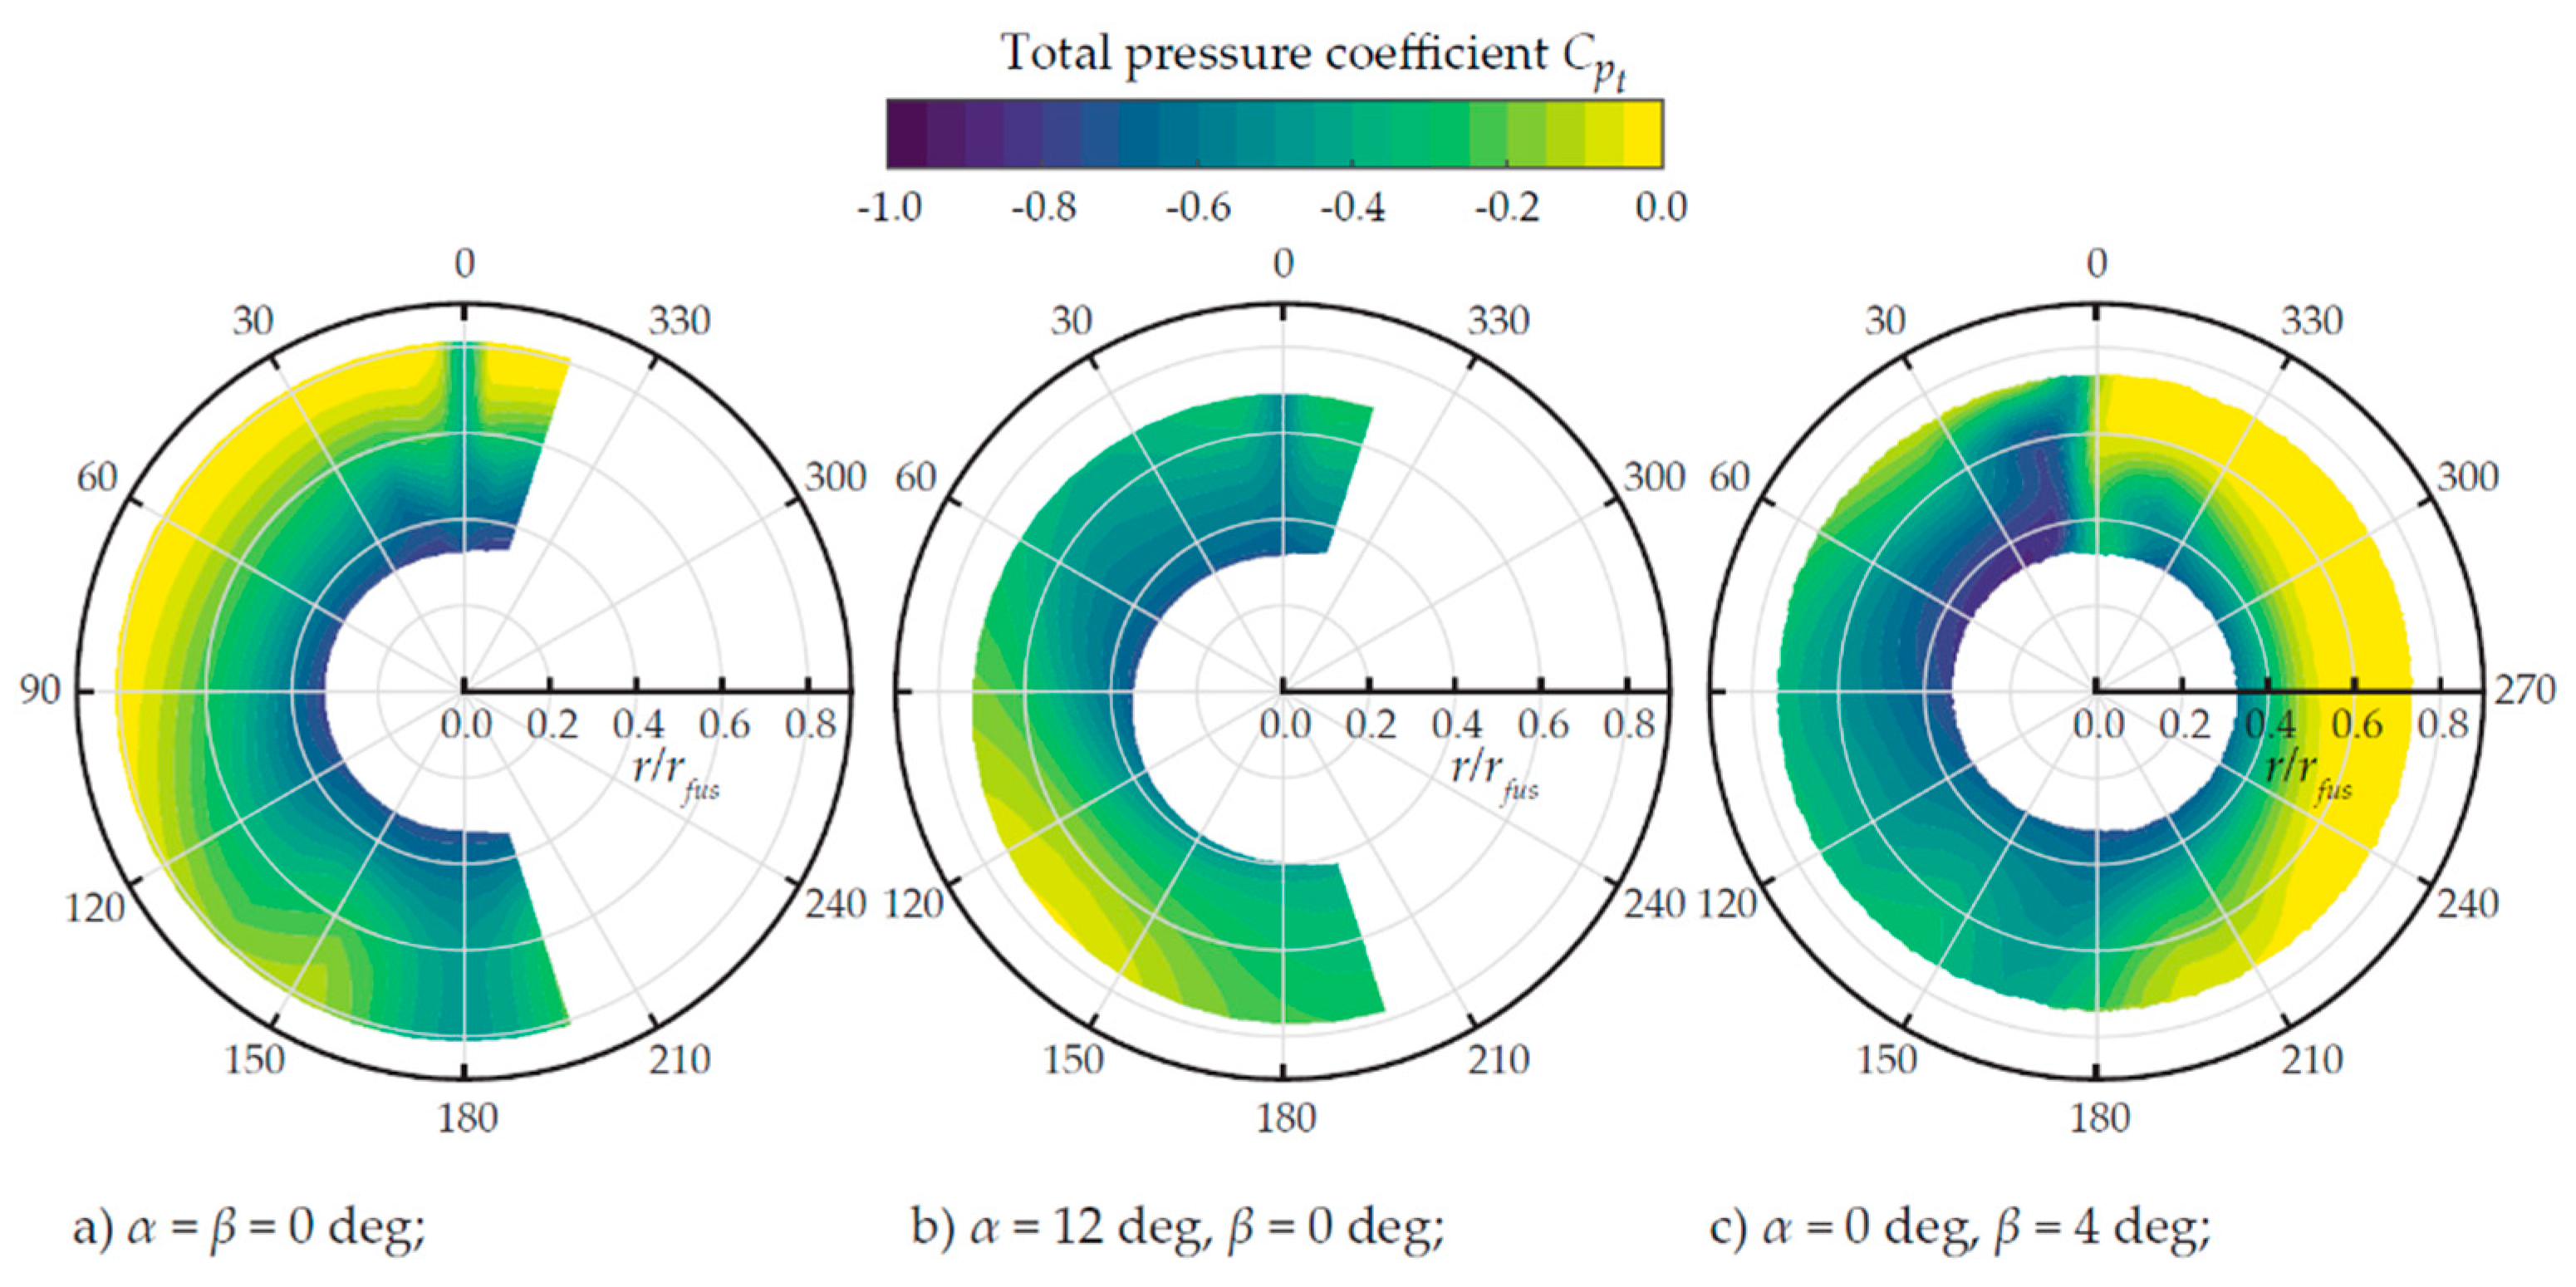
Figure 9.
Contours of total pressure coefficient at the AIP. (
a) bare PFC configuration, (
b) bare PFC configuration + wing and (
c) bare PFC configuration + wing + vertical tail (Source: [
58]).
Figure 9.
Contours of total pressure coefficient at the AIP. (
a) bare PFC configuration, (
b) bare PFC configuration + wing and (
c) bare PFC configuration + wing + vertical tail (Source: [
58]).
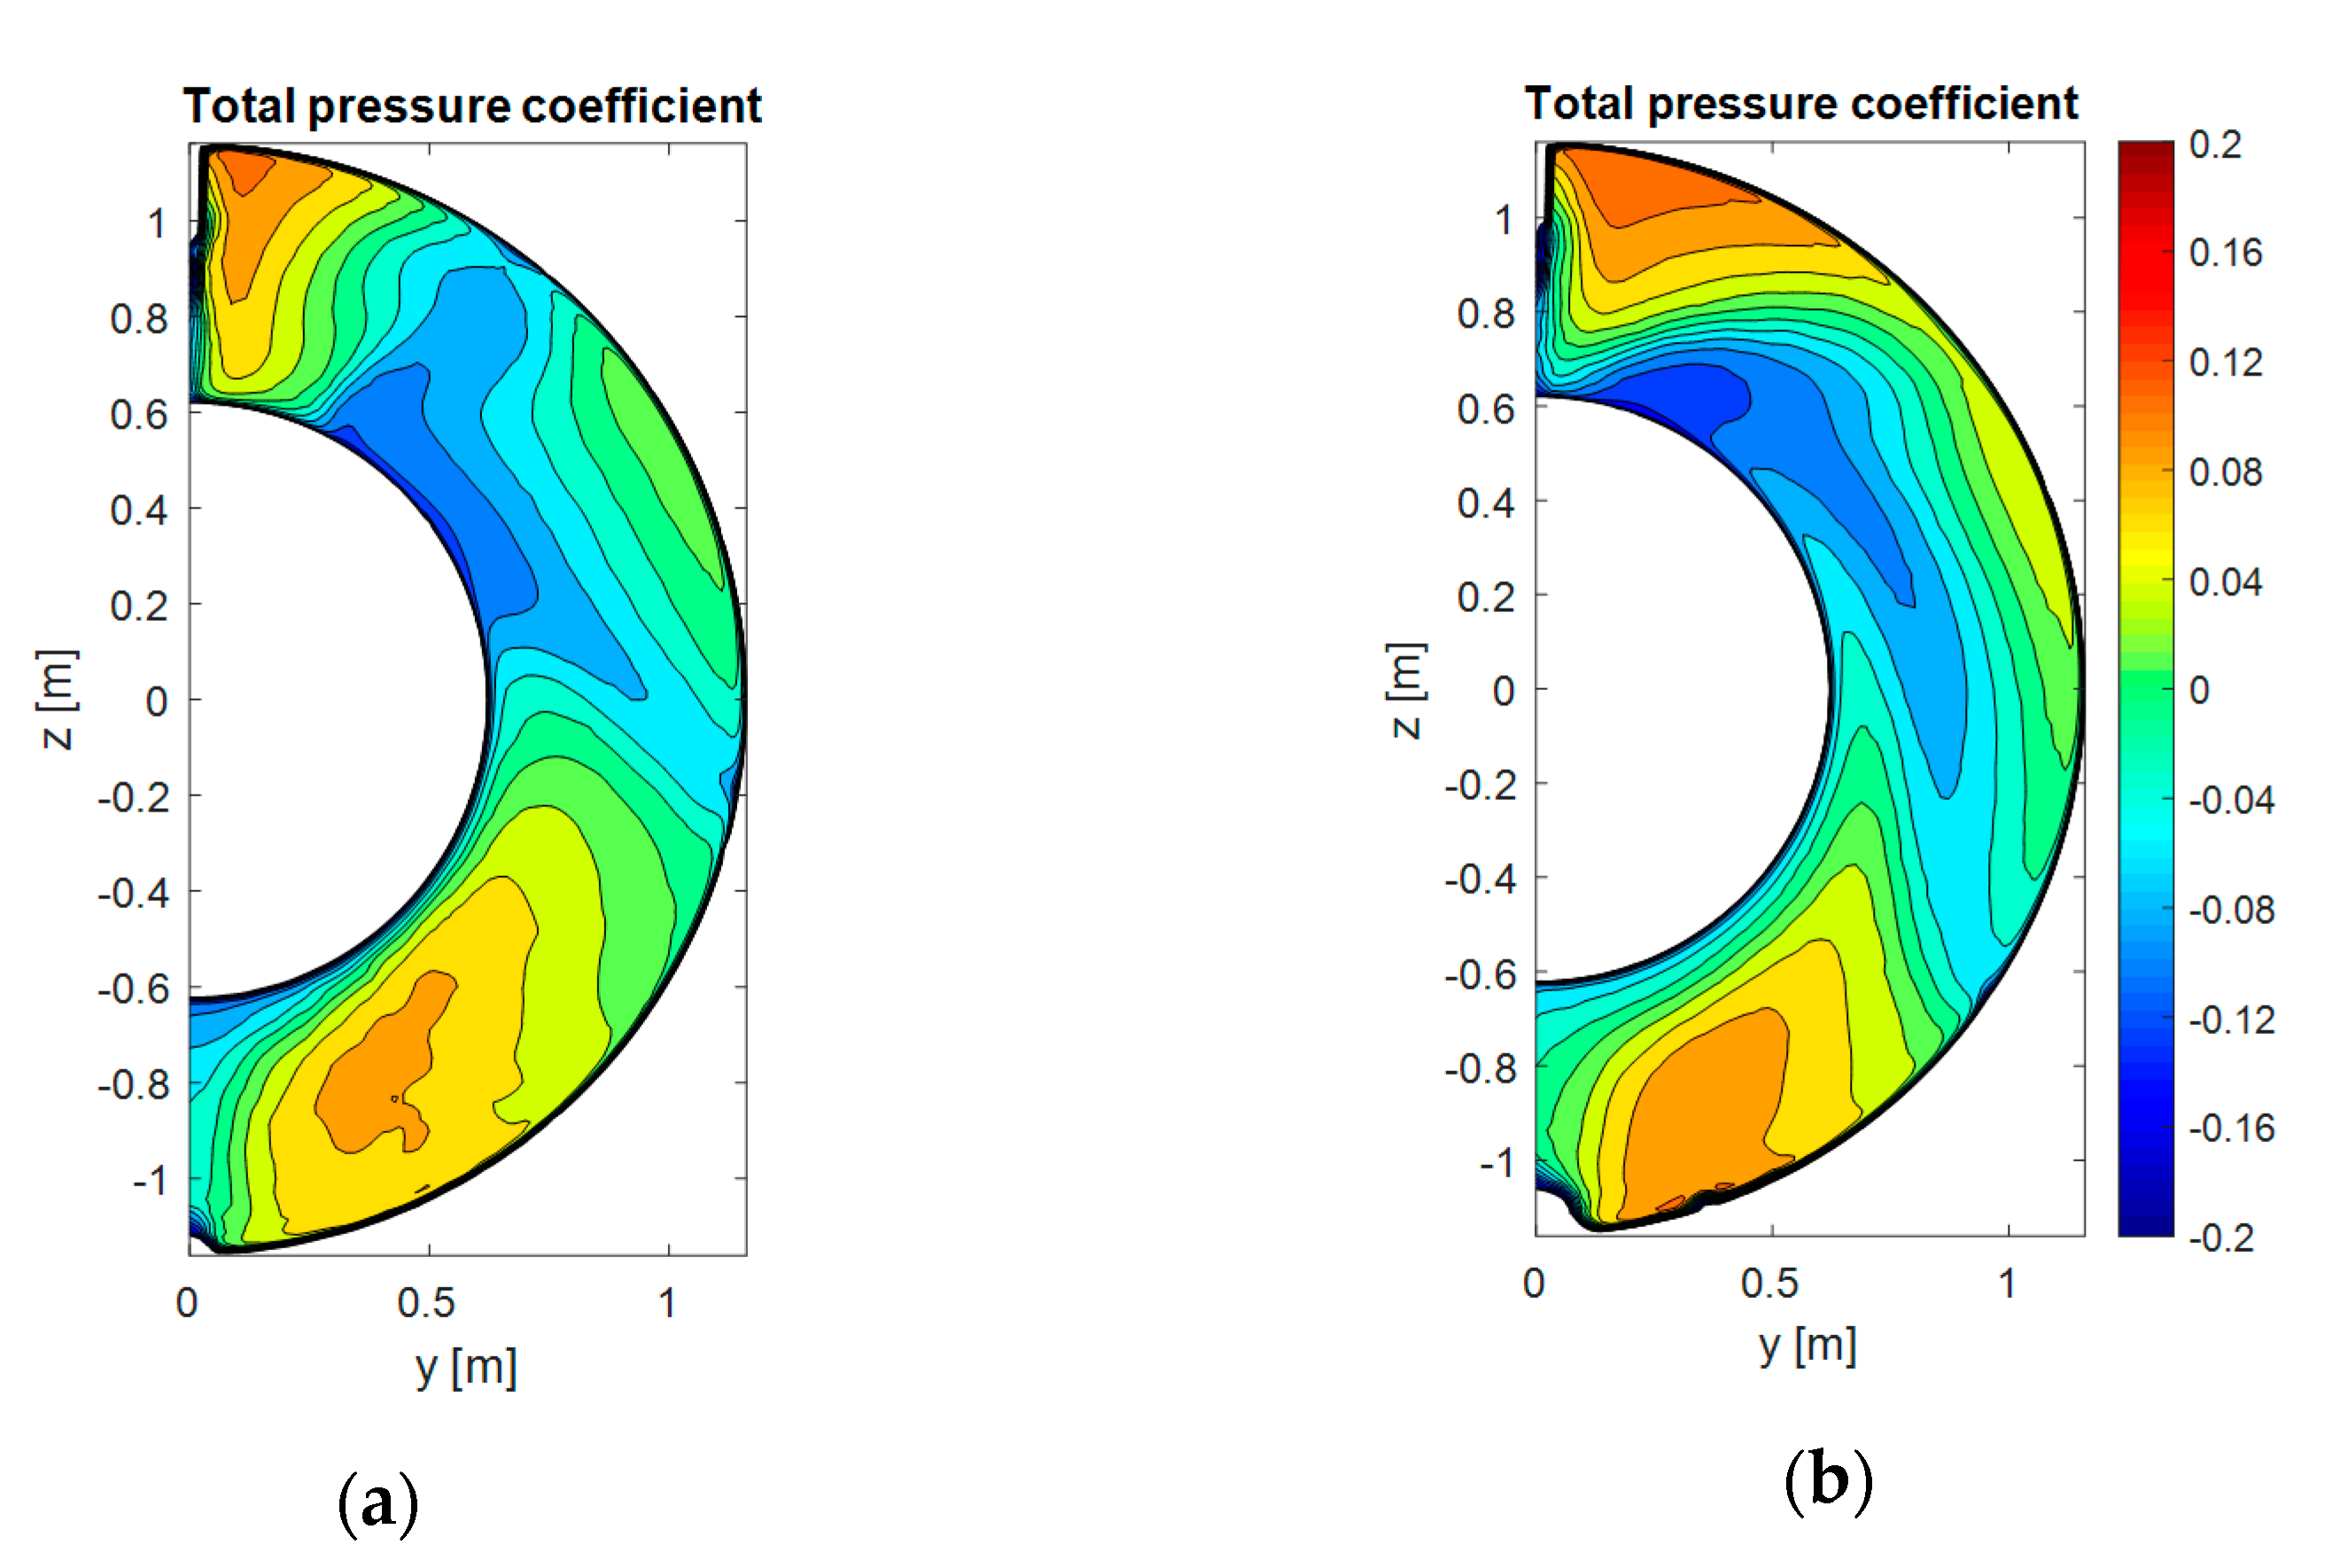
Figure 10.
Contours of total pressure coefficient at the AIP. (
a) PFC with axisymmetric aft fuselage, (
b) PFC with aft-fuselage upsweep (Source: [
58]).
Figure 10.
Contours of total pressure coefficient at the AIP. (
a) PFC with axisymmetric aft fuselage, (
b) PFC with aft-fuselage upsweep (Source: [
58]).
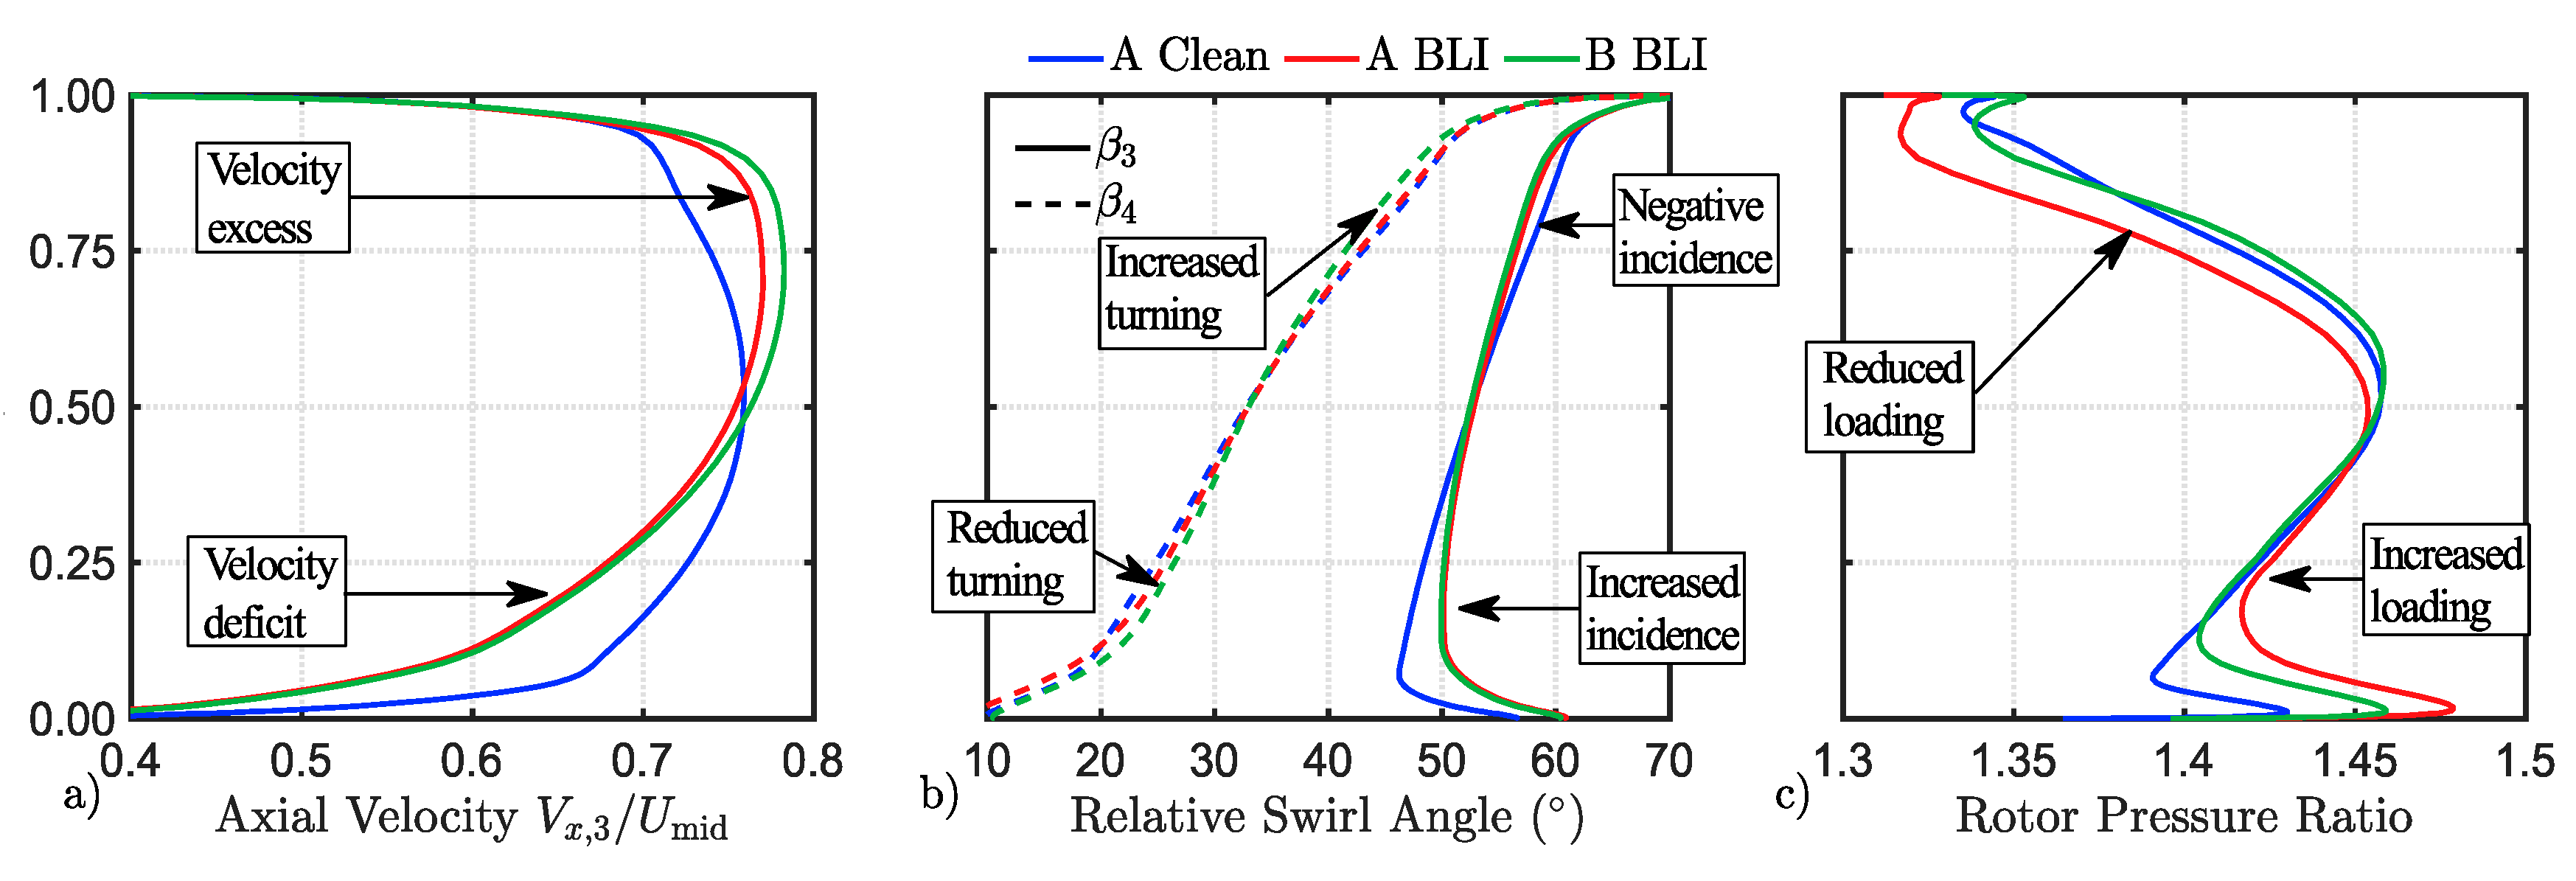
Figure 11.
Spanwise distributions at the ADP of: (a) axial velocity, (b) relative swirl angle, (c) rotor pressure ratio.
Figure 11.
Spanwise distributions at the ADP of: (a) axial velocity, (b) relative swirl angle, (c) rotor pressure ratio.
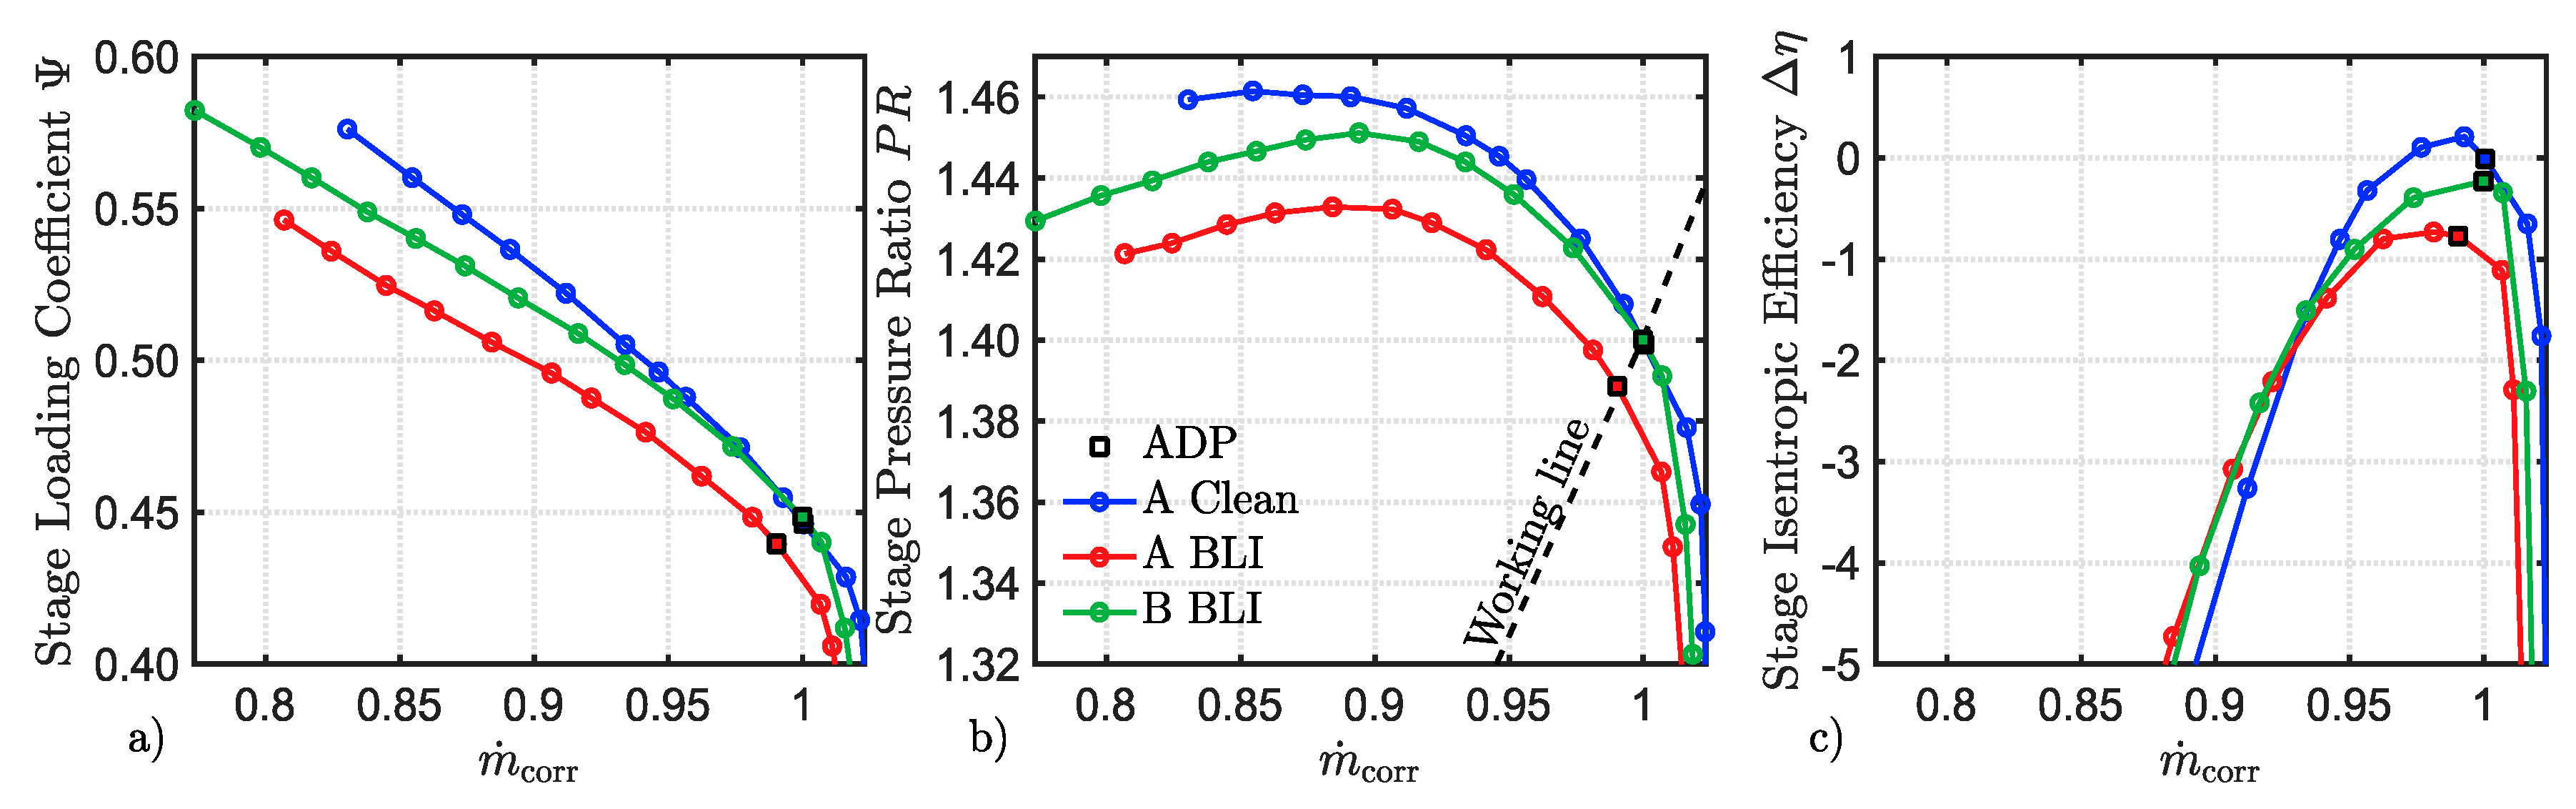
Figure 12.
Effect of fuselage BLI on Fan A and Fan B at 100% corrected speed and cruise conditions: (a) stage loading coefficient, (b) stage pressure ratio, (c) stage isentropic efficiency (%).
Figure 12.
Effect of fuselage BLI on Fan A and Fan B at 100% corrected speed and cruise conditions: (a) stage loading coefficient, (b) stage pressure ratio, (c) stage isentropic efficiency (%).
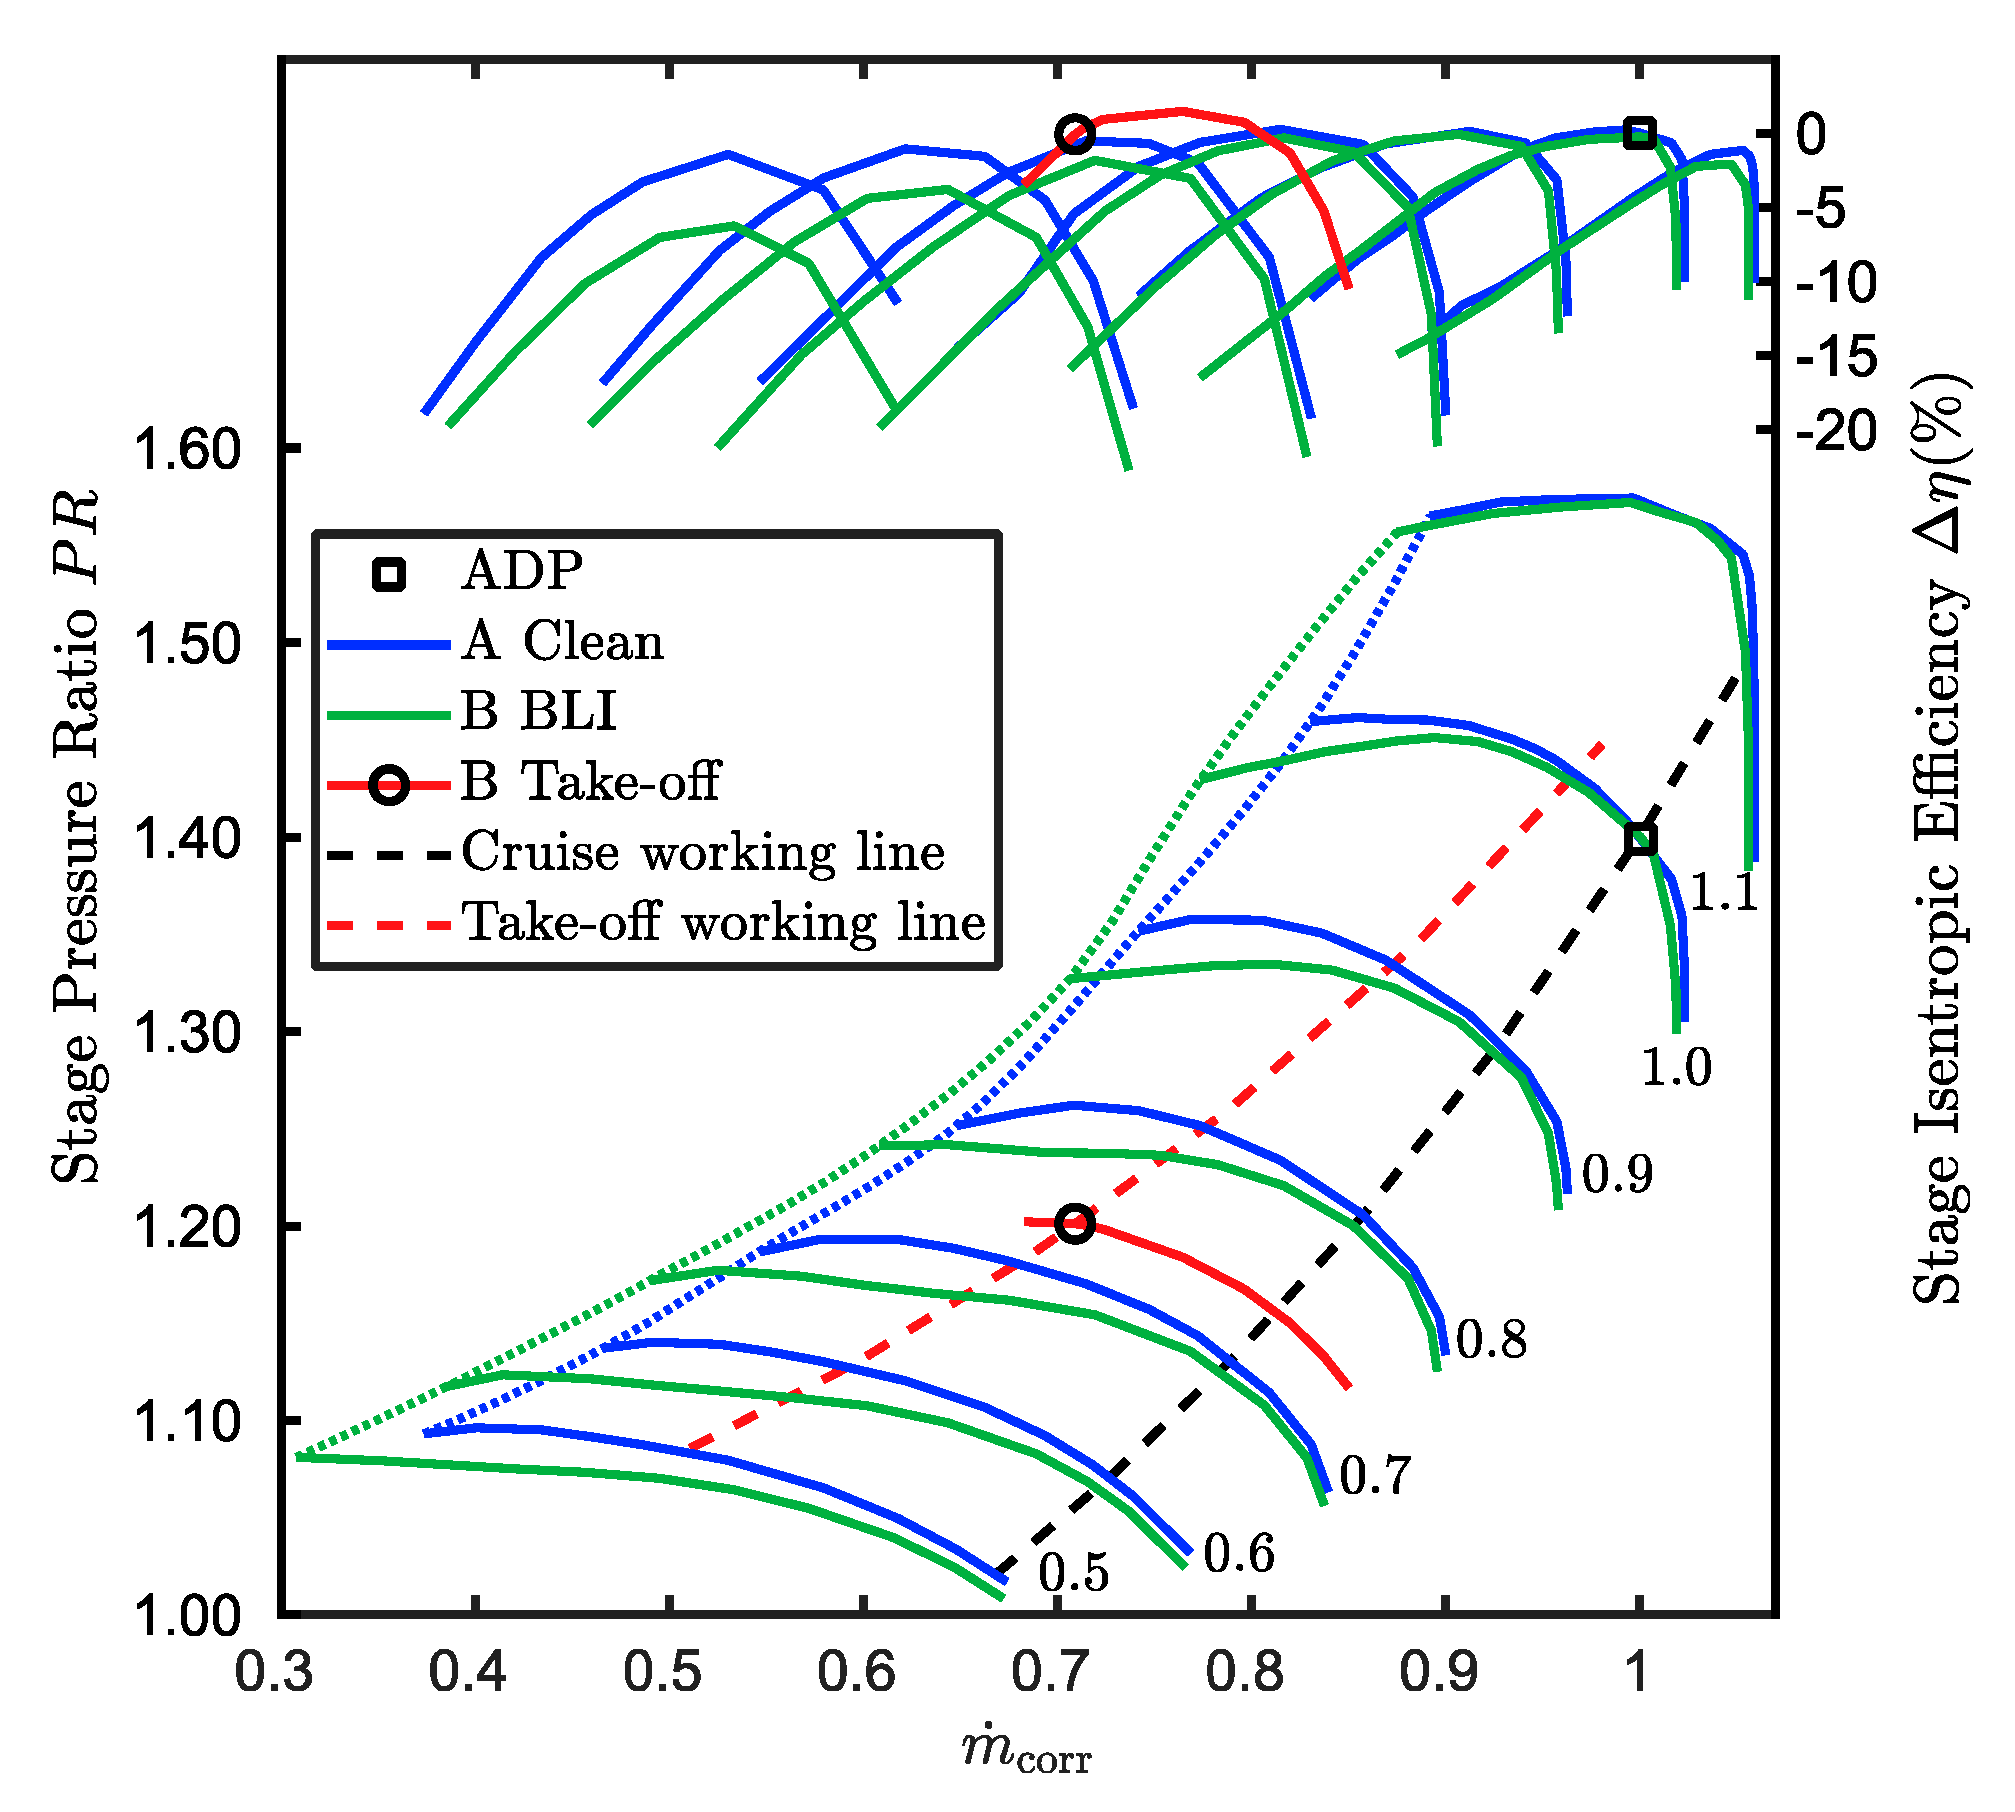
Figure 13.
Comparison of cruise maps for Fan A and Fan B.
Figure 13.
Comparison of cruise maps for Fan A and Fan B.
Figure 14.
Schematics of the wind-tunnel models setup. Dimensions in mm.
Figure 14.
Schematics of the wind-tunnel models setup. Dimensions in mm.
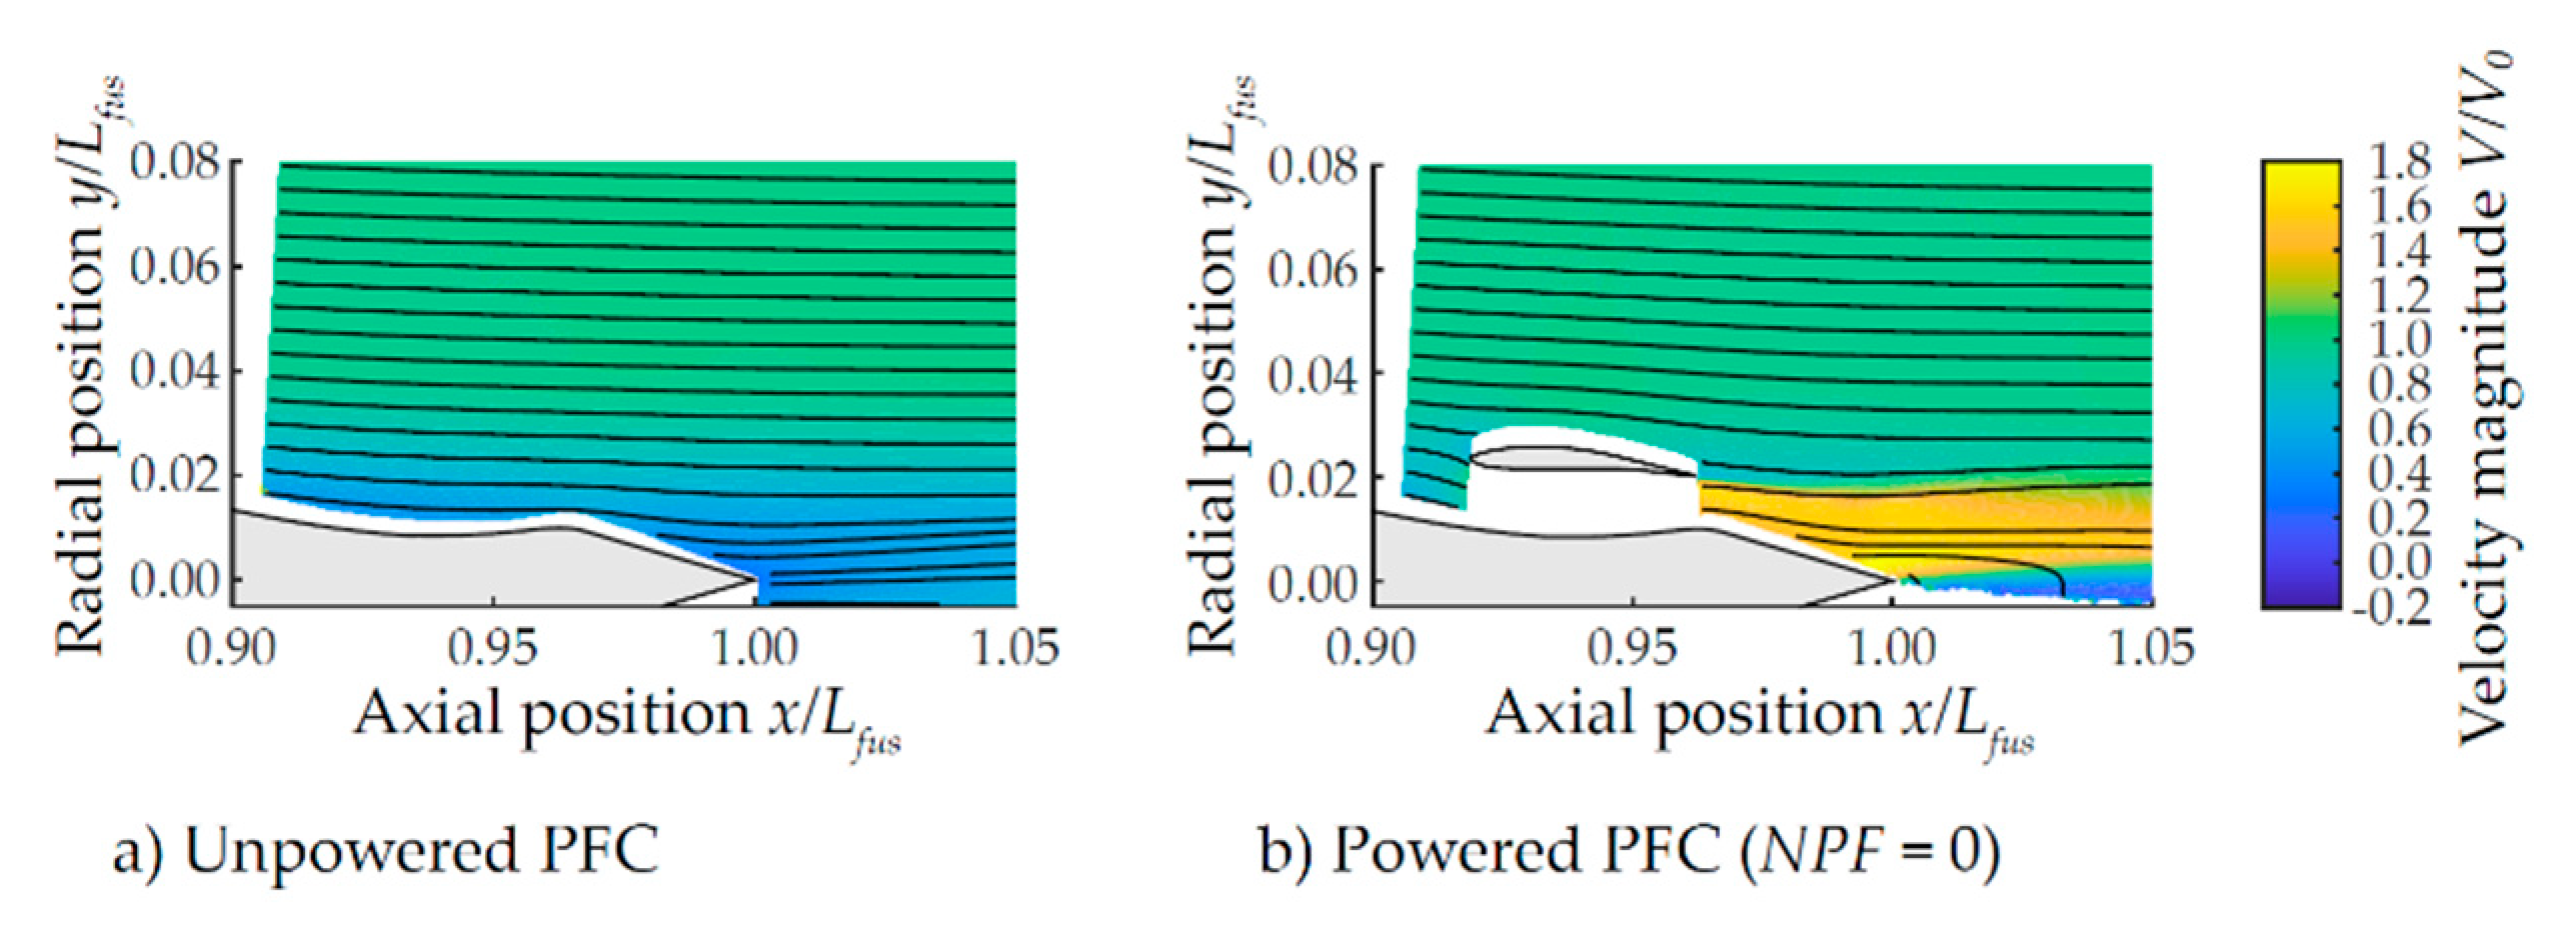
Figure 15.
Time-averaged velocity field around the PFC aft-fuselage section of the 2D-PFC setup. Stereo-PIV measurements taken at V0 = 20 m/s and NPF = 0.
Figure 15.
Time-averaged velocity field around the PFC aft-fuselage section of the 2D-PFC setup. Stereo-PIV measurements taken at V0 = 20 m/s and NPF = 0.
Figure 16.
Total pressure field upstream of the FF air intake (x/Lfus = 0.89) in cruise and off-design conditions. Measurements taken on the 3D PFC setup at V0 = 40 m/s.
Figure 16.
Total pressure field upstream of the FF air intake (x/Lfus = 0.89) in cruise and off-design conditions. Measurements taken on the 3D PFC setup at V0 = 40 m/s.
Figure 17.
Meridional view of the BLI fan rig.
Figure 17.
Meridional view of the BLI fan rig.
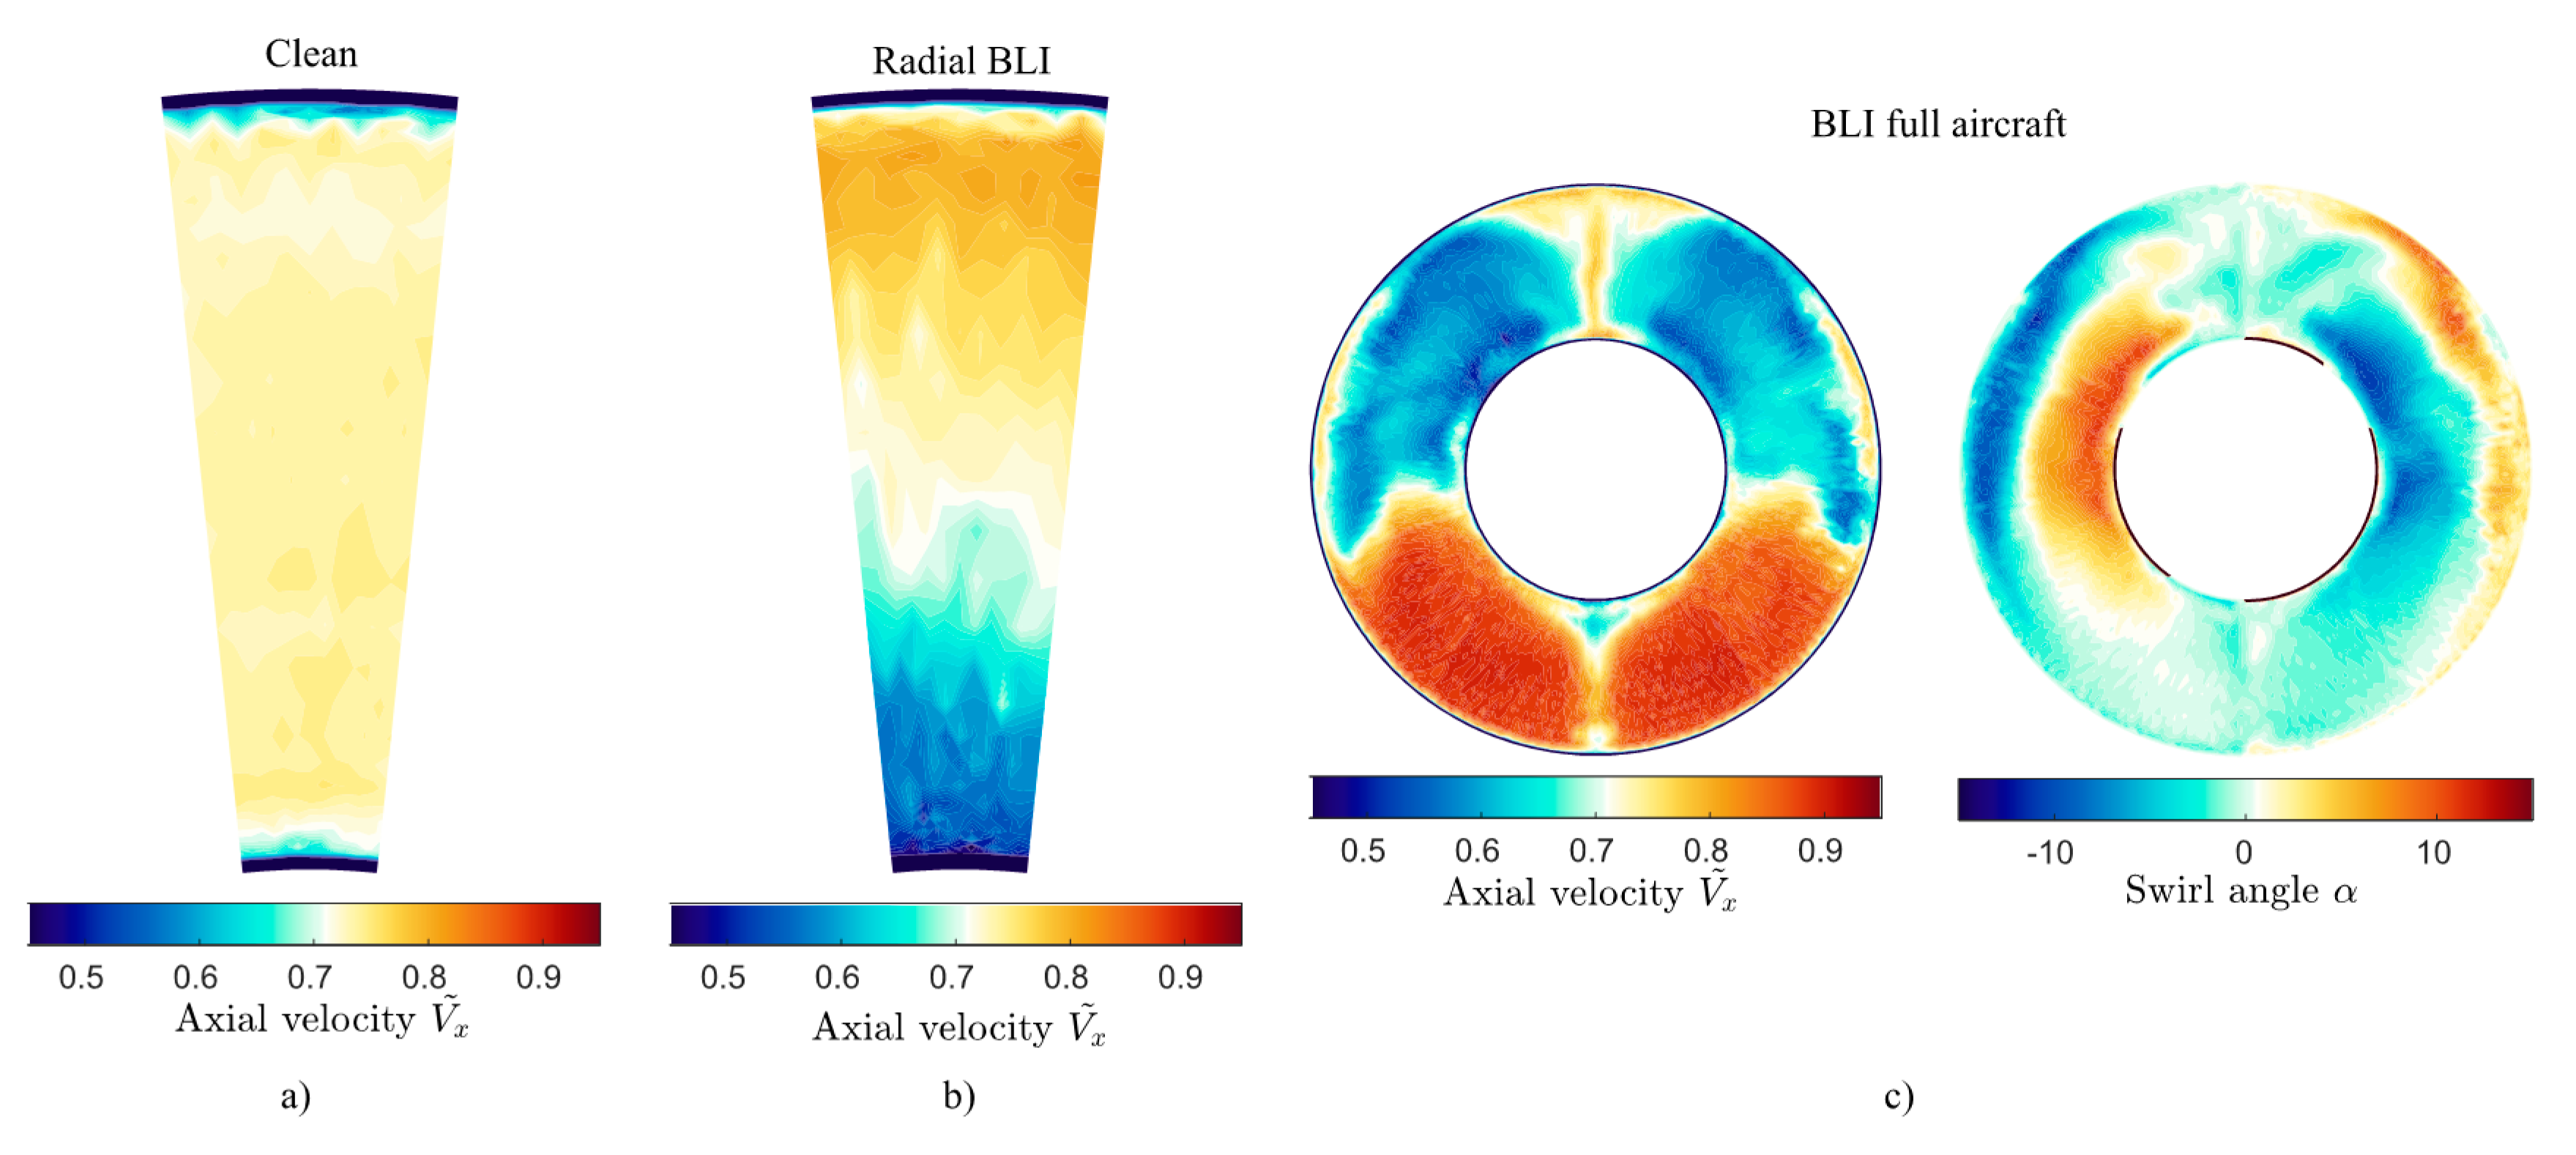
Figure 18.
Measured inlet inflow behind the distortion gauzes: (a) Clean, (b) hub-low distortion, (c) full-aircraft configuration.
Figure 18.
Measured inlet inflow behind the distortion gauzes: (a) Clean, (b) hub-low distortion, (c) full-aircraft configuration.
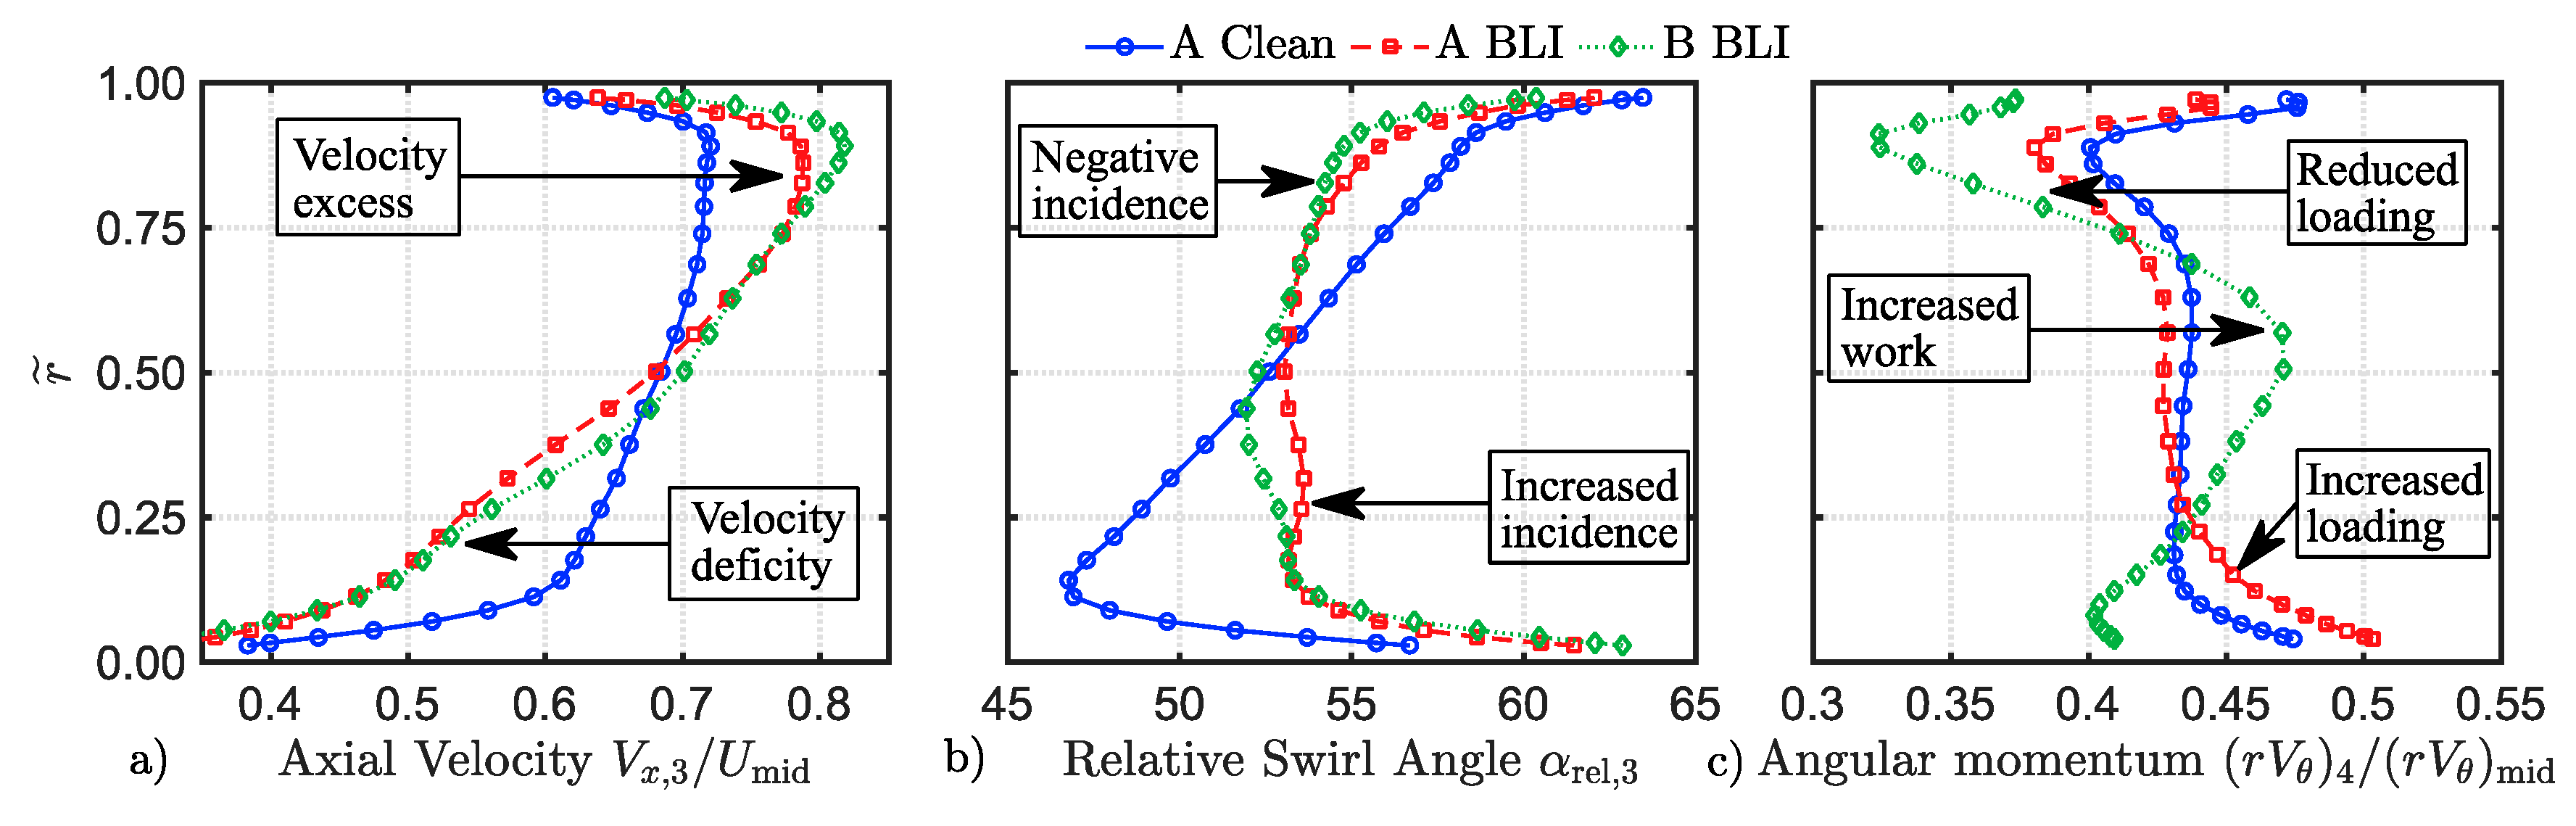
Figure 19.
Measured spanwise distributions at the ADP of: (a) axial velocity, (b) relative swirl angle, (c) angular momentum.
Figure 19.
Measured spanwise distributions at the ADP of: (a) axial velocity, (b) relative swirl angle, (c) angular momentum.
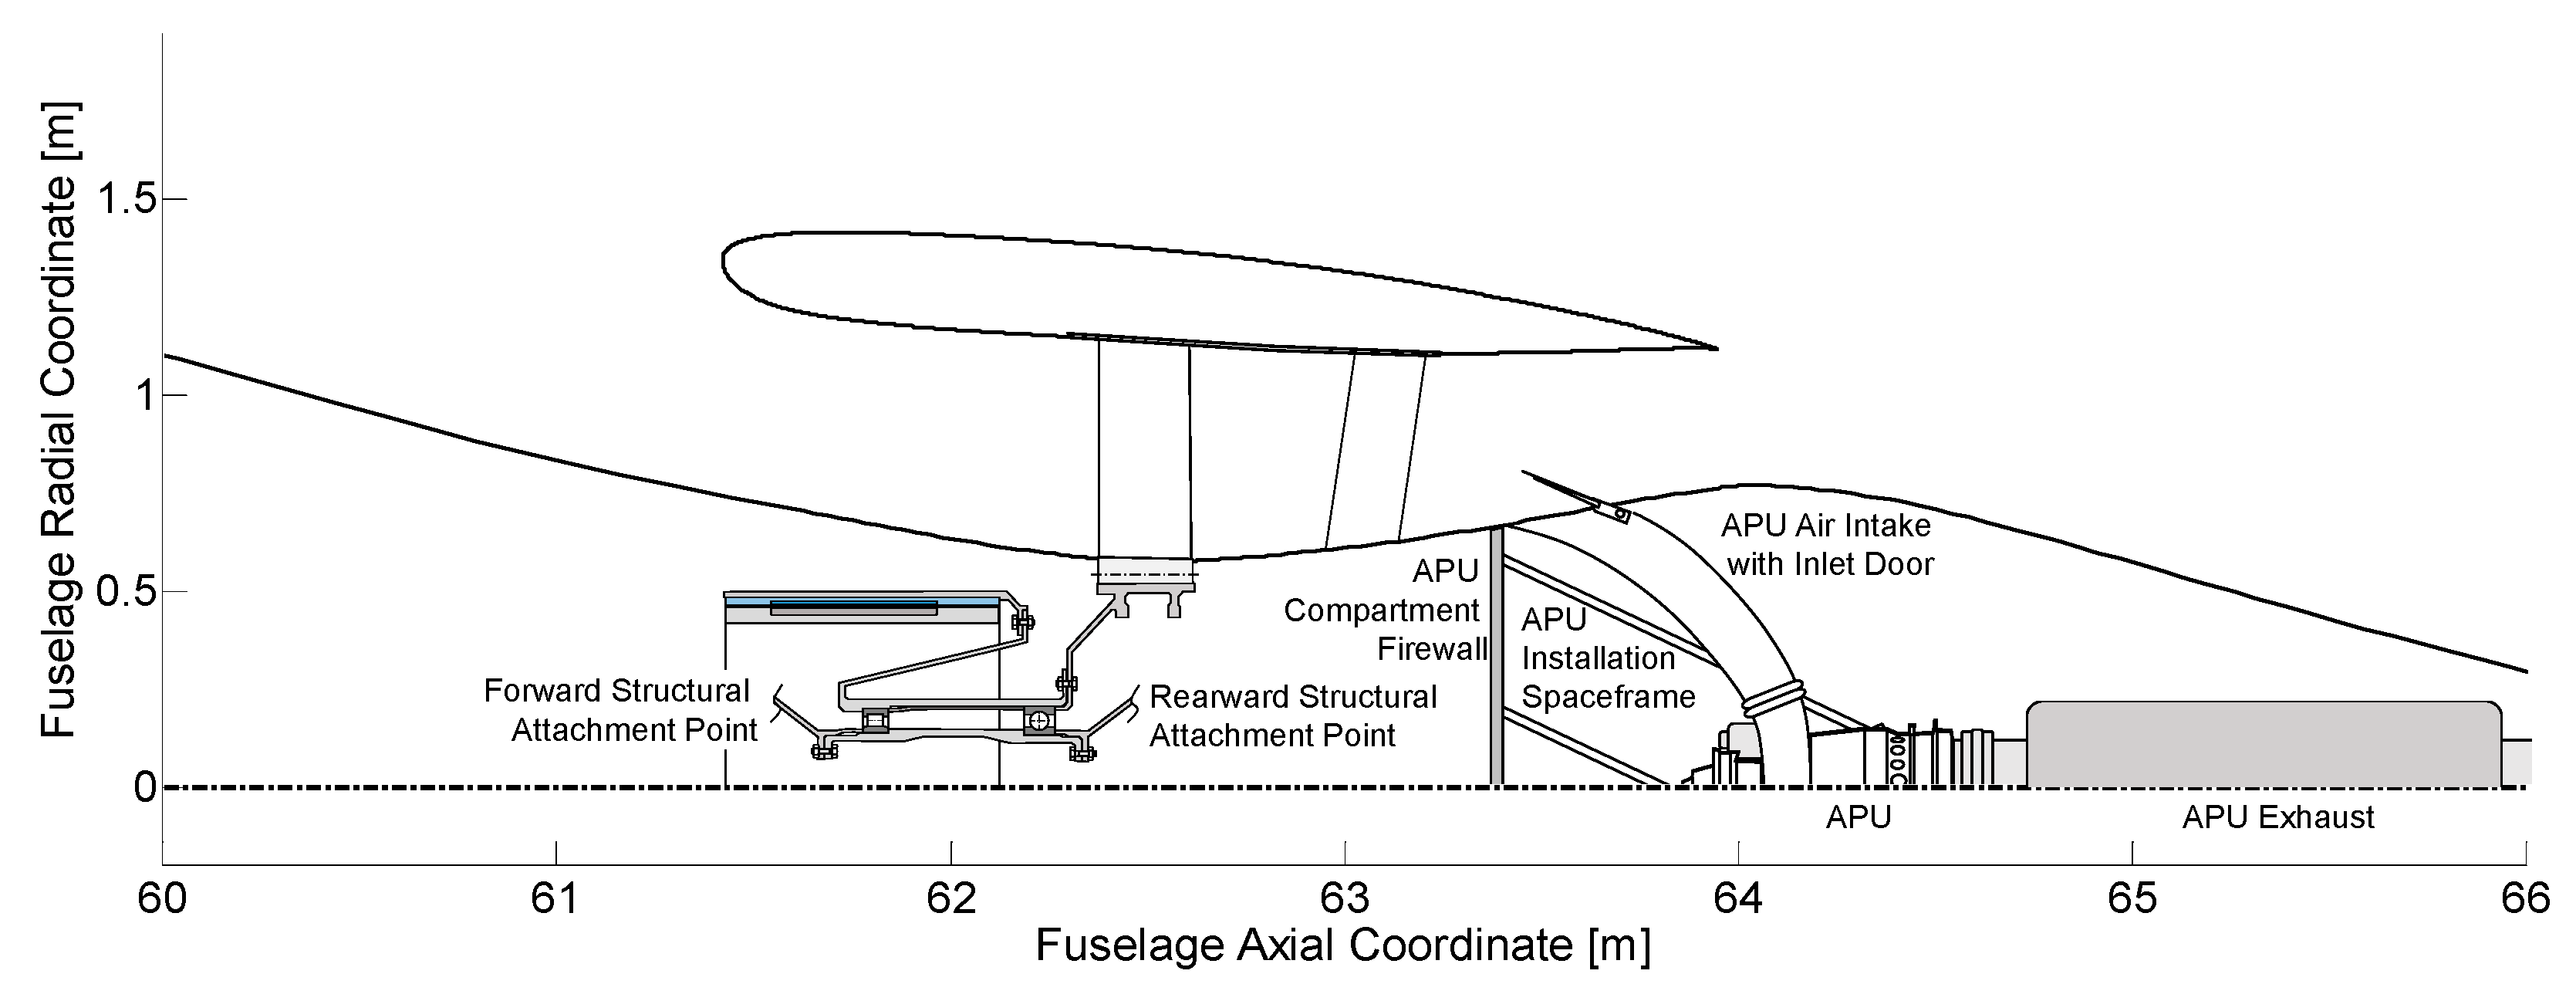
Figure 20.
Concept sketch of the aft-fuselage power plant integration.
Figure 20.
Concept sketch of the aft-fuselage power plant integration.
Figure 21.
Visualization of control volume for FF module mass budget, individual component groups highlighted in color.
Figure 21.
Visualization of control volume for FF module mass budget, individual component groups highlighted in color.
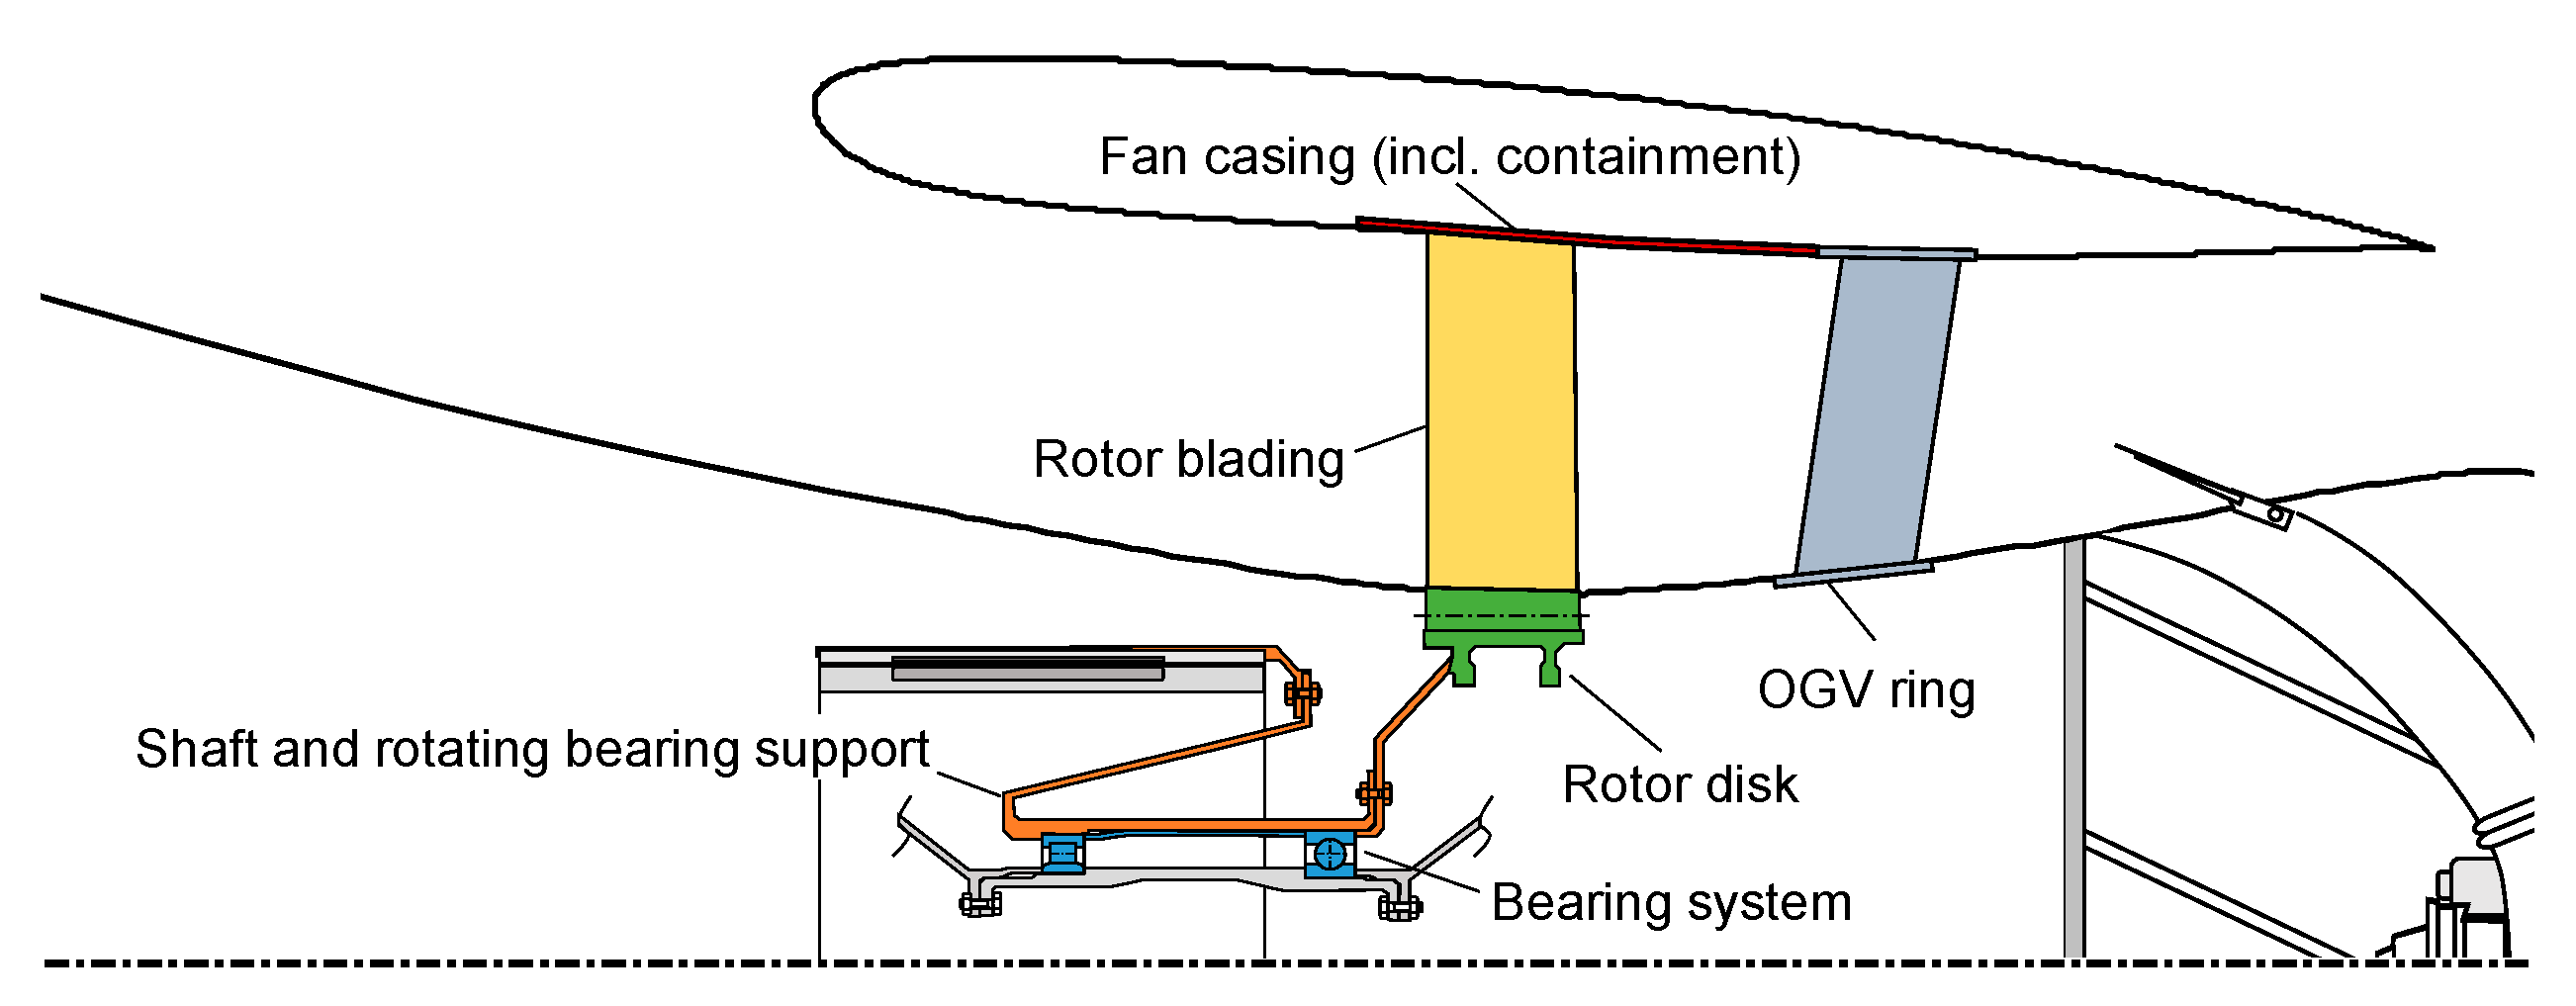
Figure 22.
Basic visualization of CENTRELINE aft-fuselage aero-structural integration concept.
Figure 22.
Basic visualization of CENTRELINE aft-fuselage aero-structural integration concept.
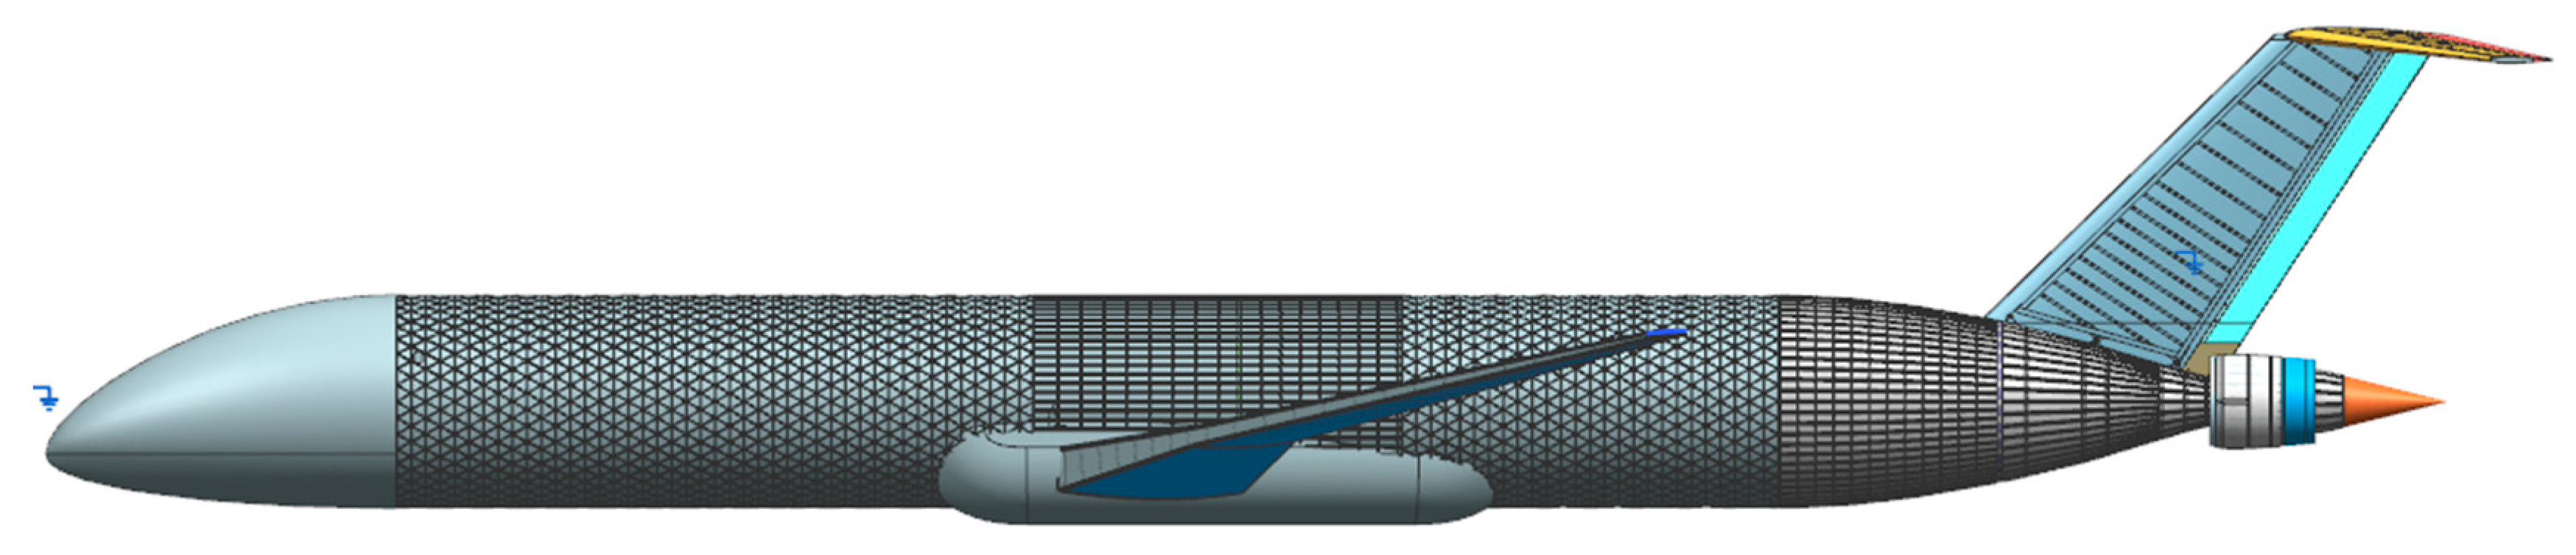
Figure 23.
PFC aircraft side view including basic visualization of the main elements of the fuselage structural design concept.
Figure 23.
PFC aircraft side view including basic visualization of the main elements of the fuselage structural design concept.
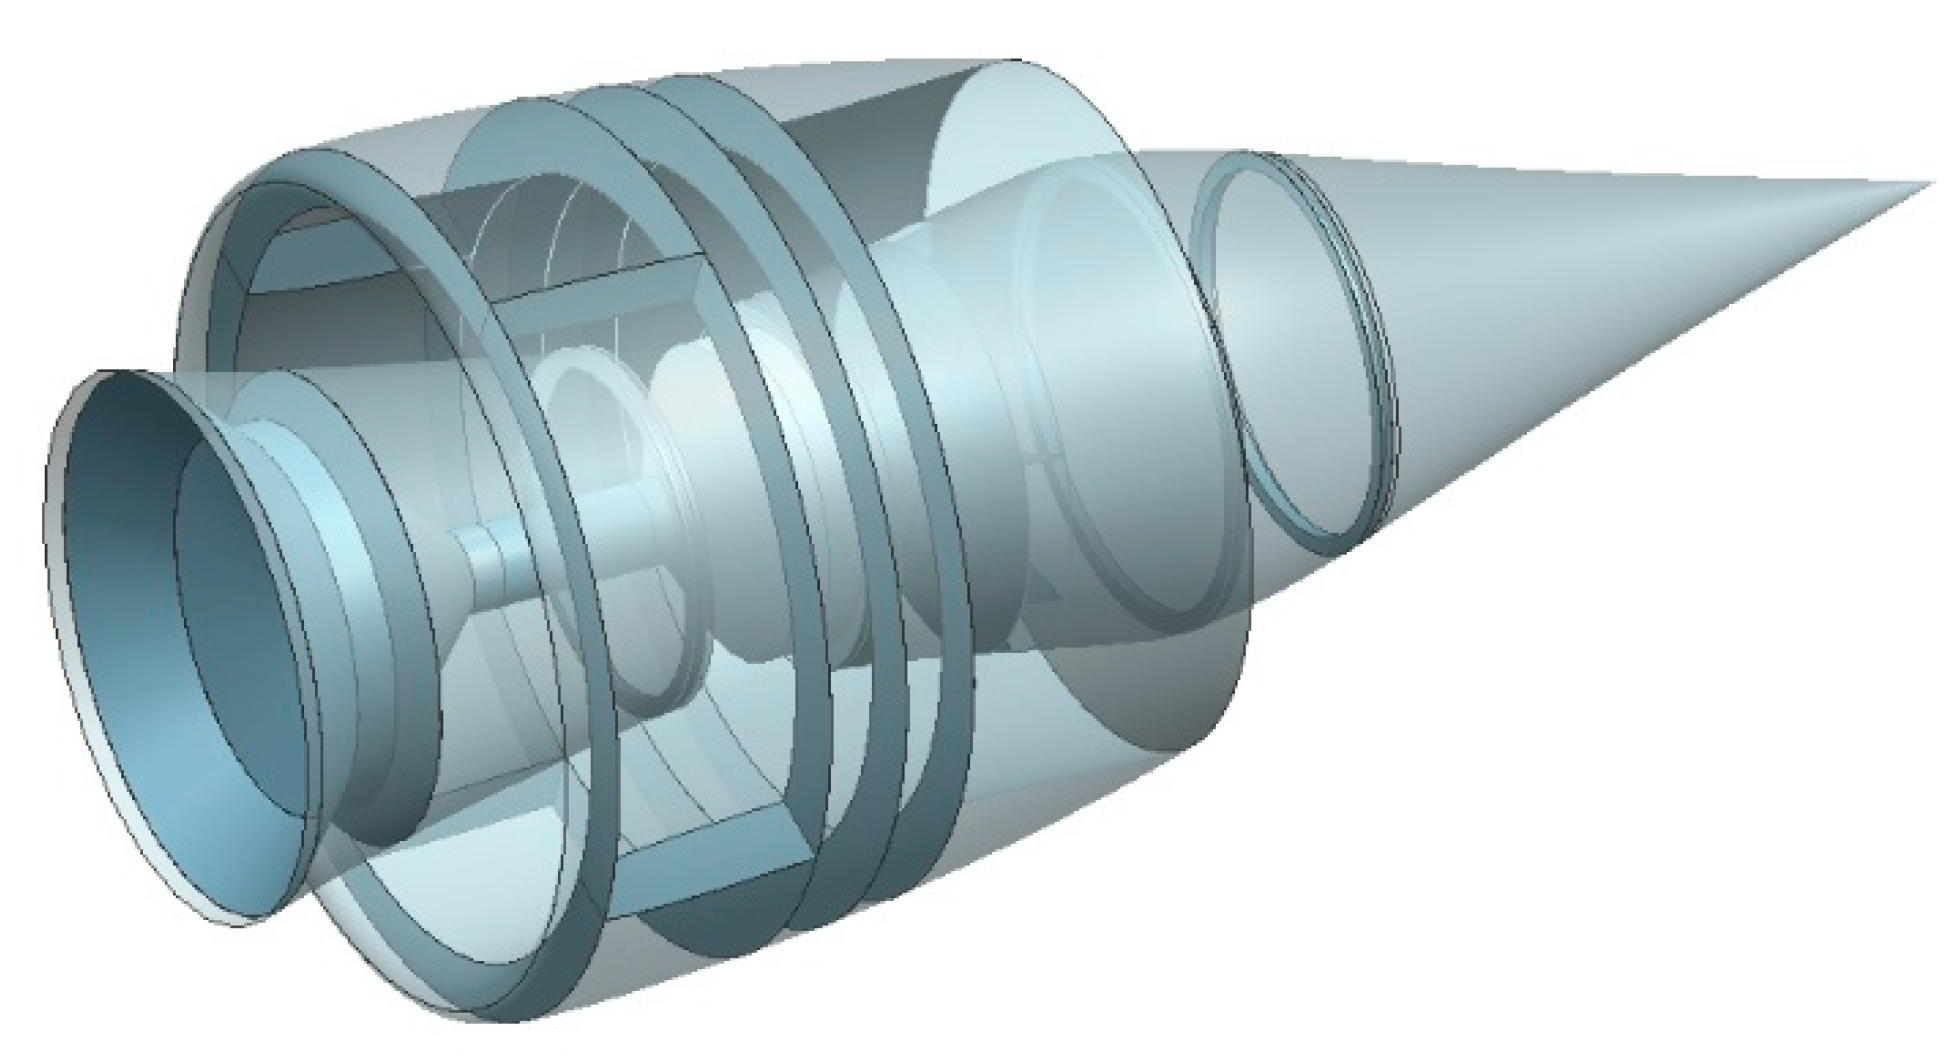
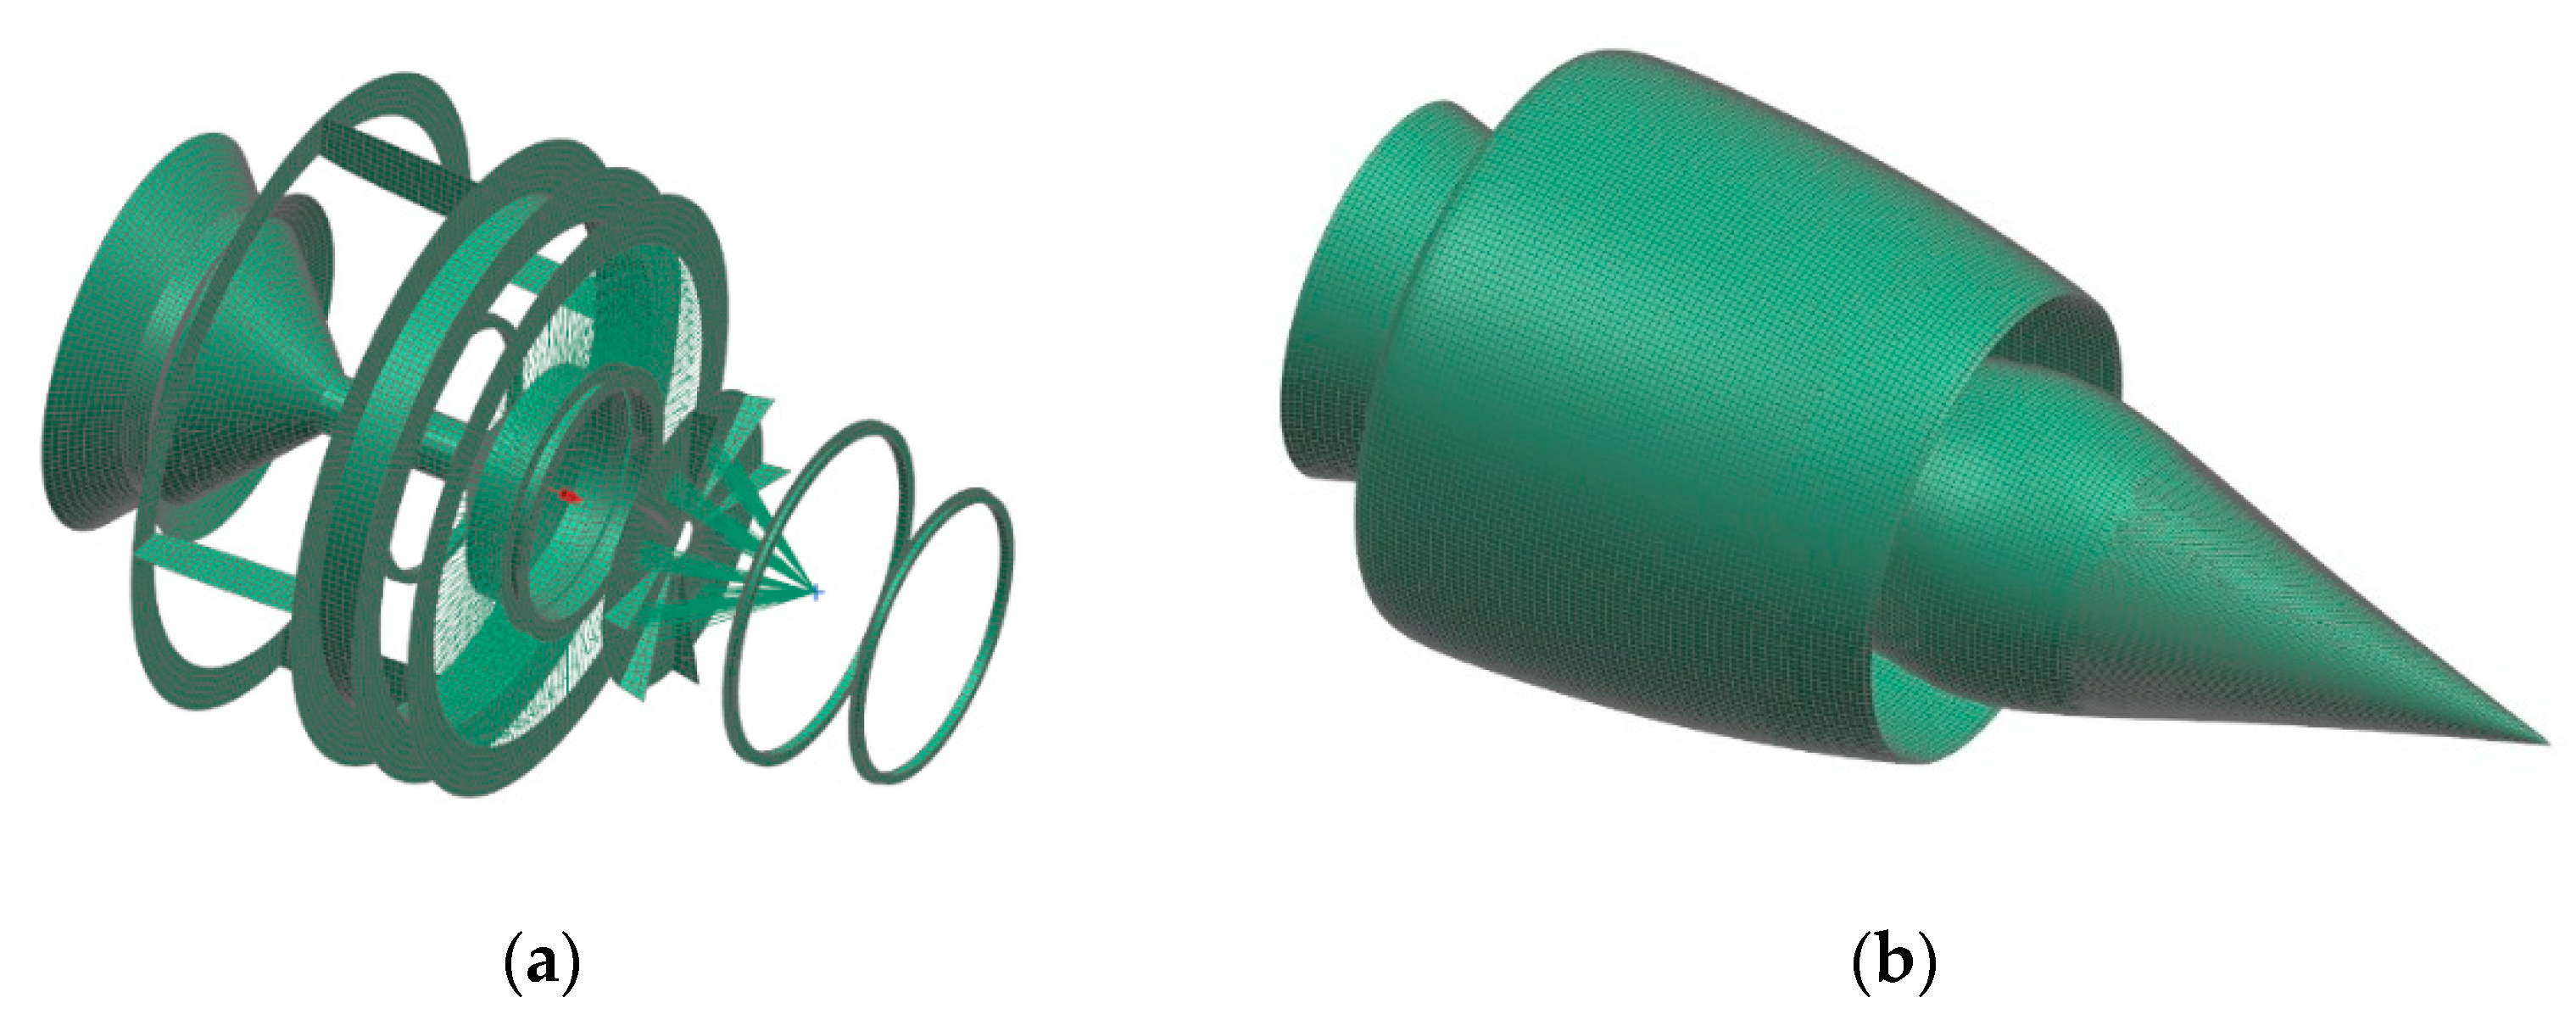
Figure 24.
Finite element mesh for (a) internal structure and (b) skin of the aft-fuselage section.
Figure 24.
Finite element mesh for (a) internal structure and (b) skin of the aft-fuselage section.
Figure 25.
Displacement map for aft-fuselage nacelle and integration structure of PFC Rev07 design case 2 under CS 25.561 loads. Color legend shows vertical displacement in mm.
Figure 25.
Displacement map for aft-fuselage nacelle and integration structure of PFC Rev07 design case 2 under CS 25.561 loads. Color legend shows vertical displacement in mm.
Figure 26.
Overall propulsion system architecture (Source [
81]).
Figure 26.
Overall propulsion system architecture (Source [
81]).
Figure 27.
Basic electric machine design scheme.
Figure 27.
Basic electric machine design scheme.
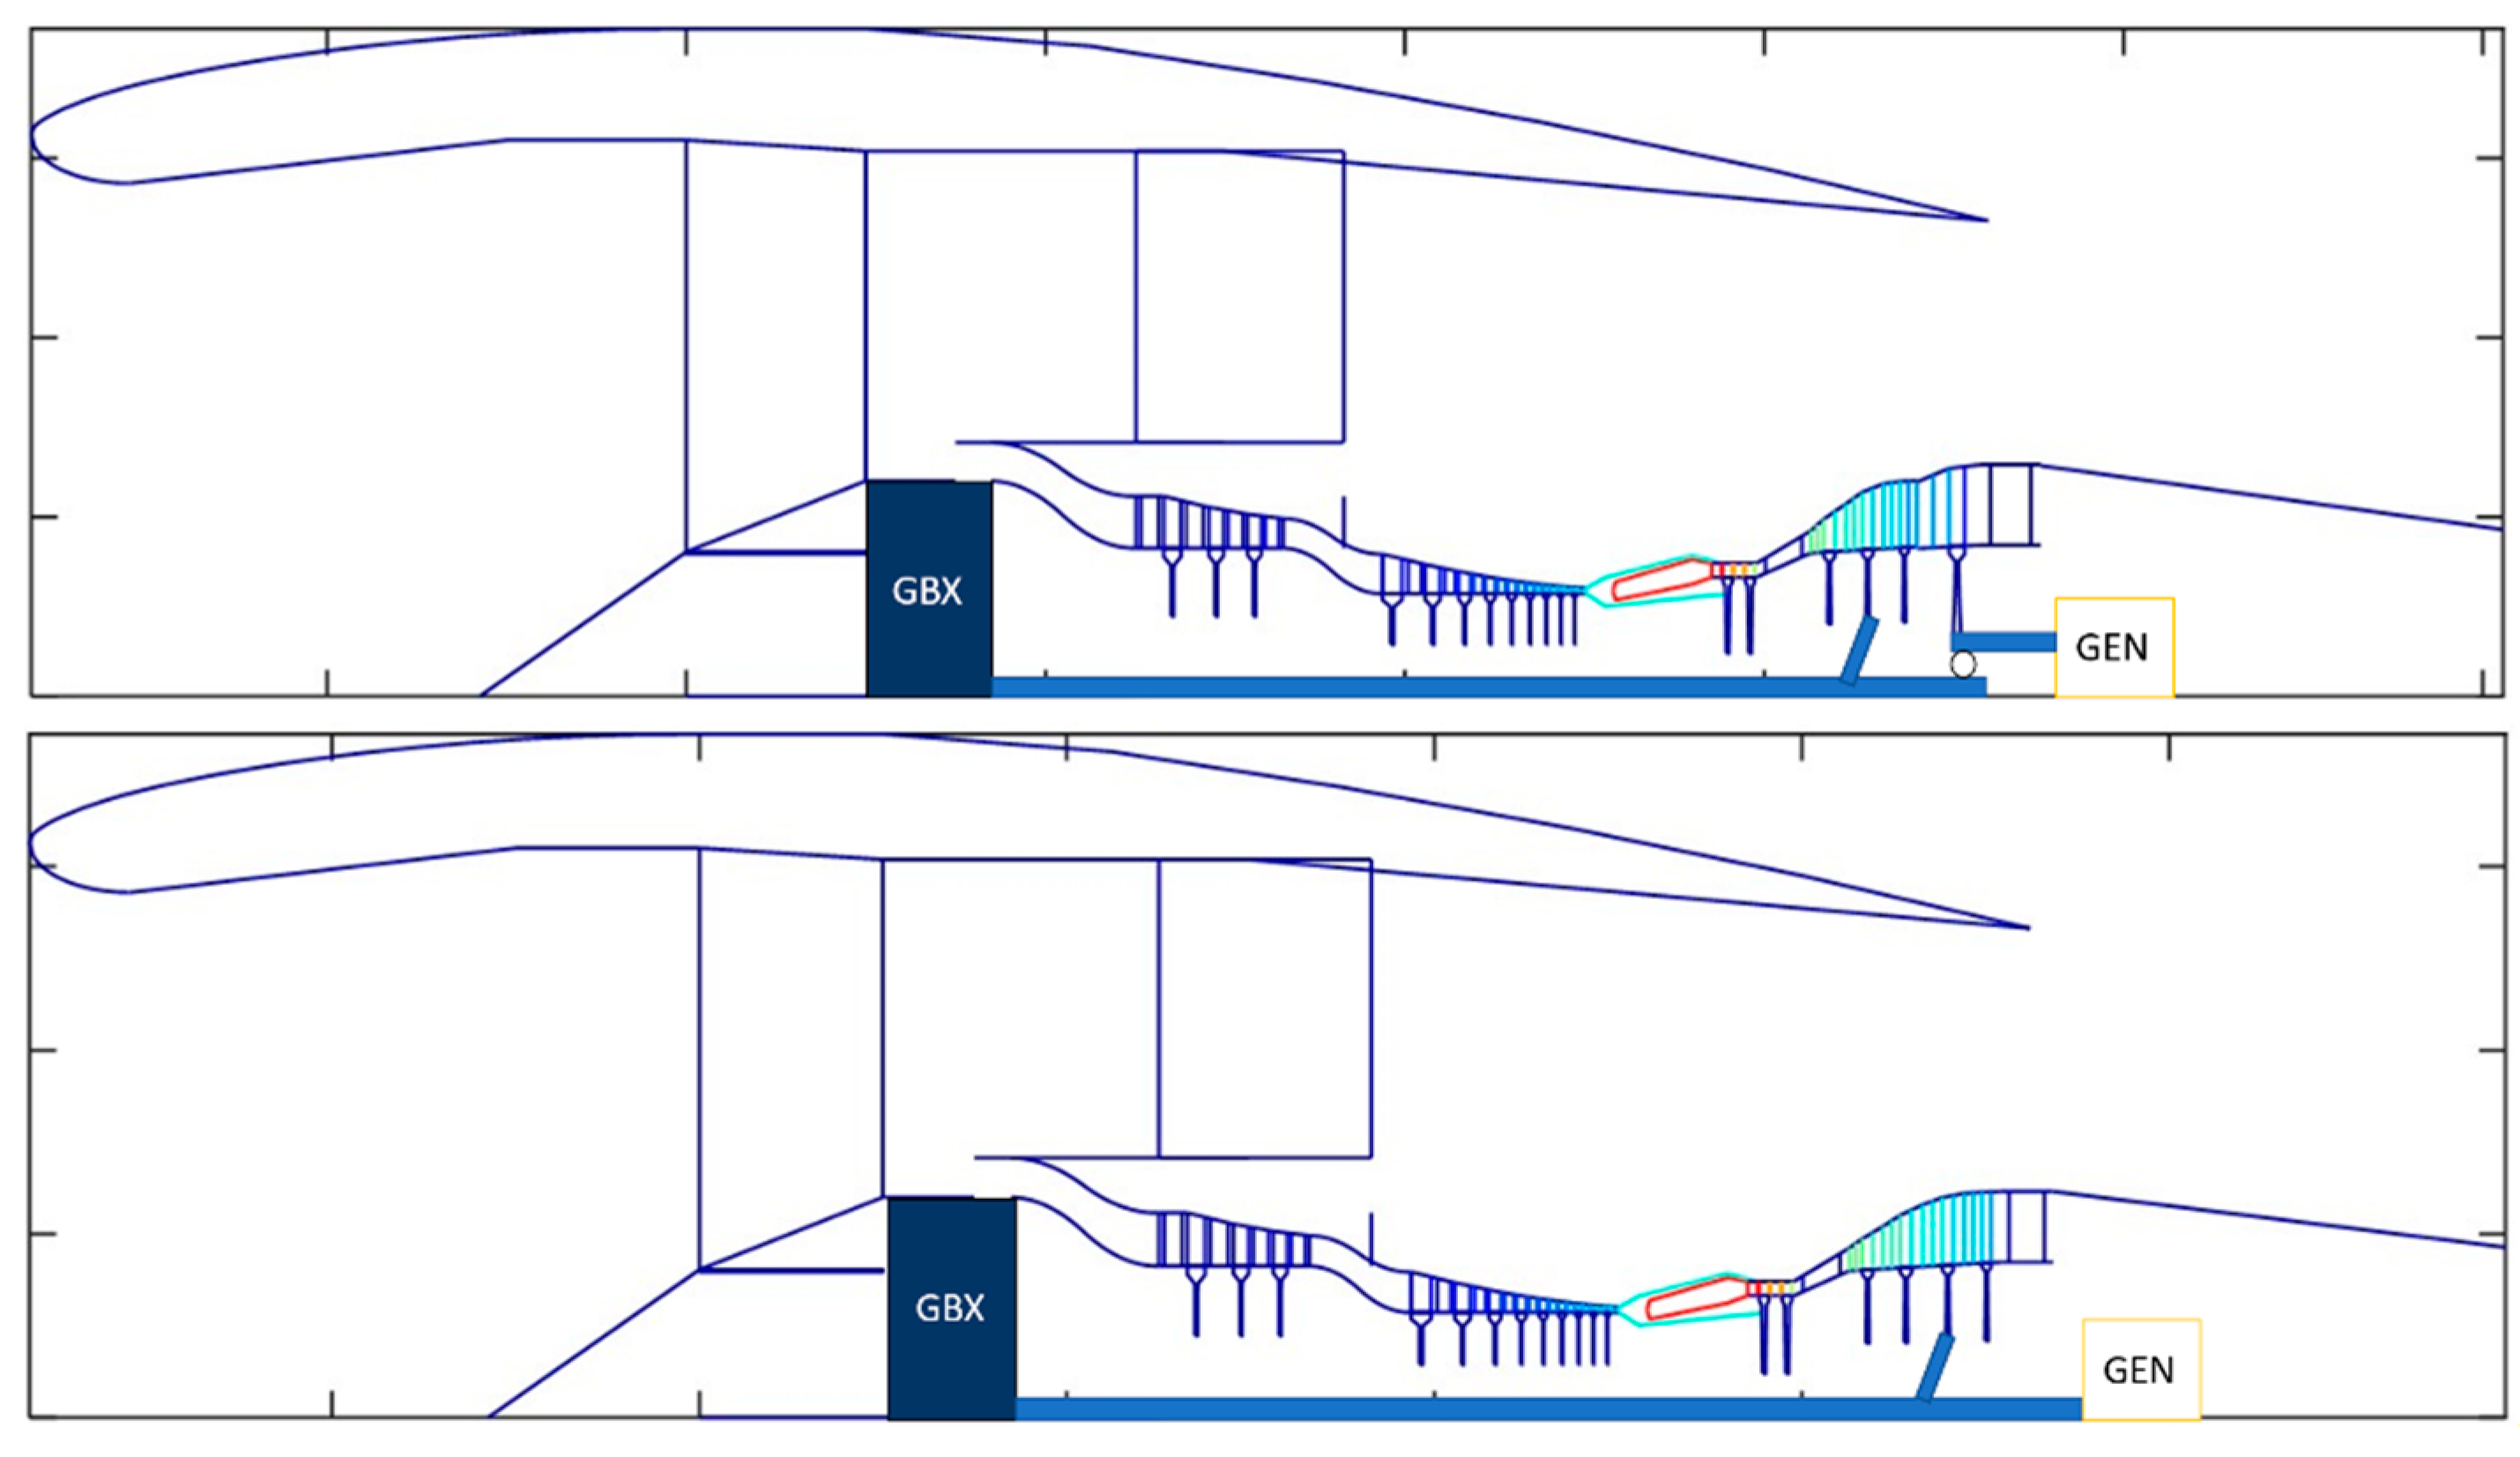
Figure 28.
Flow path layout of the main power plant design options, free power turbine power offtake (top) and low-pressure turbine power offtake (bottom).
Figure 28.
Flow path layout of the main power plant design options, free power turbine power offtake (top) and low-pressure turbine power offtake (bottom).
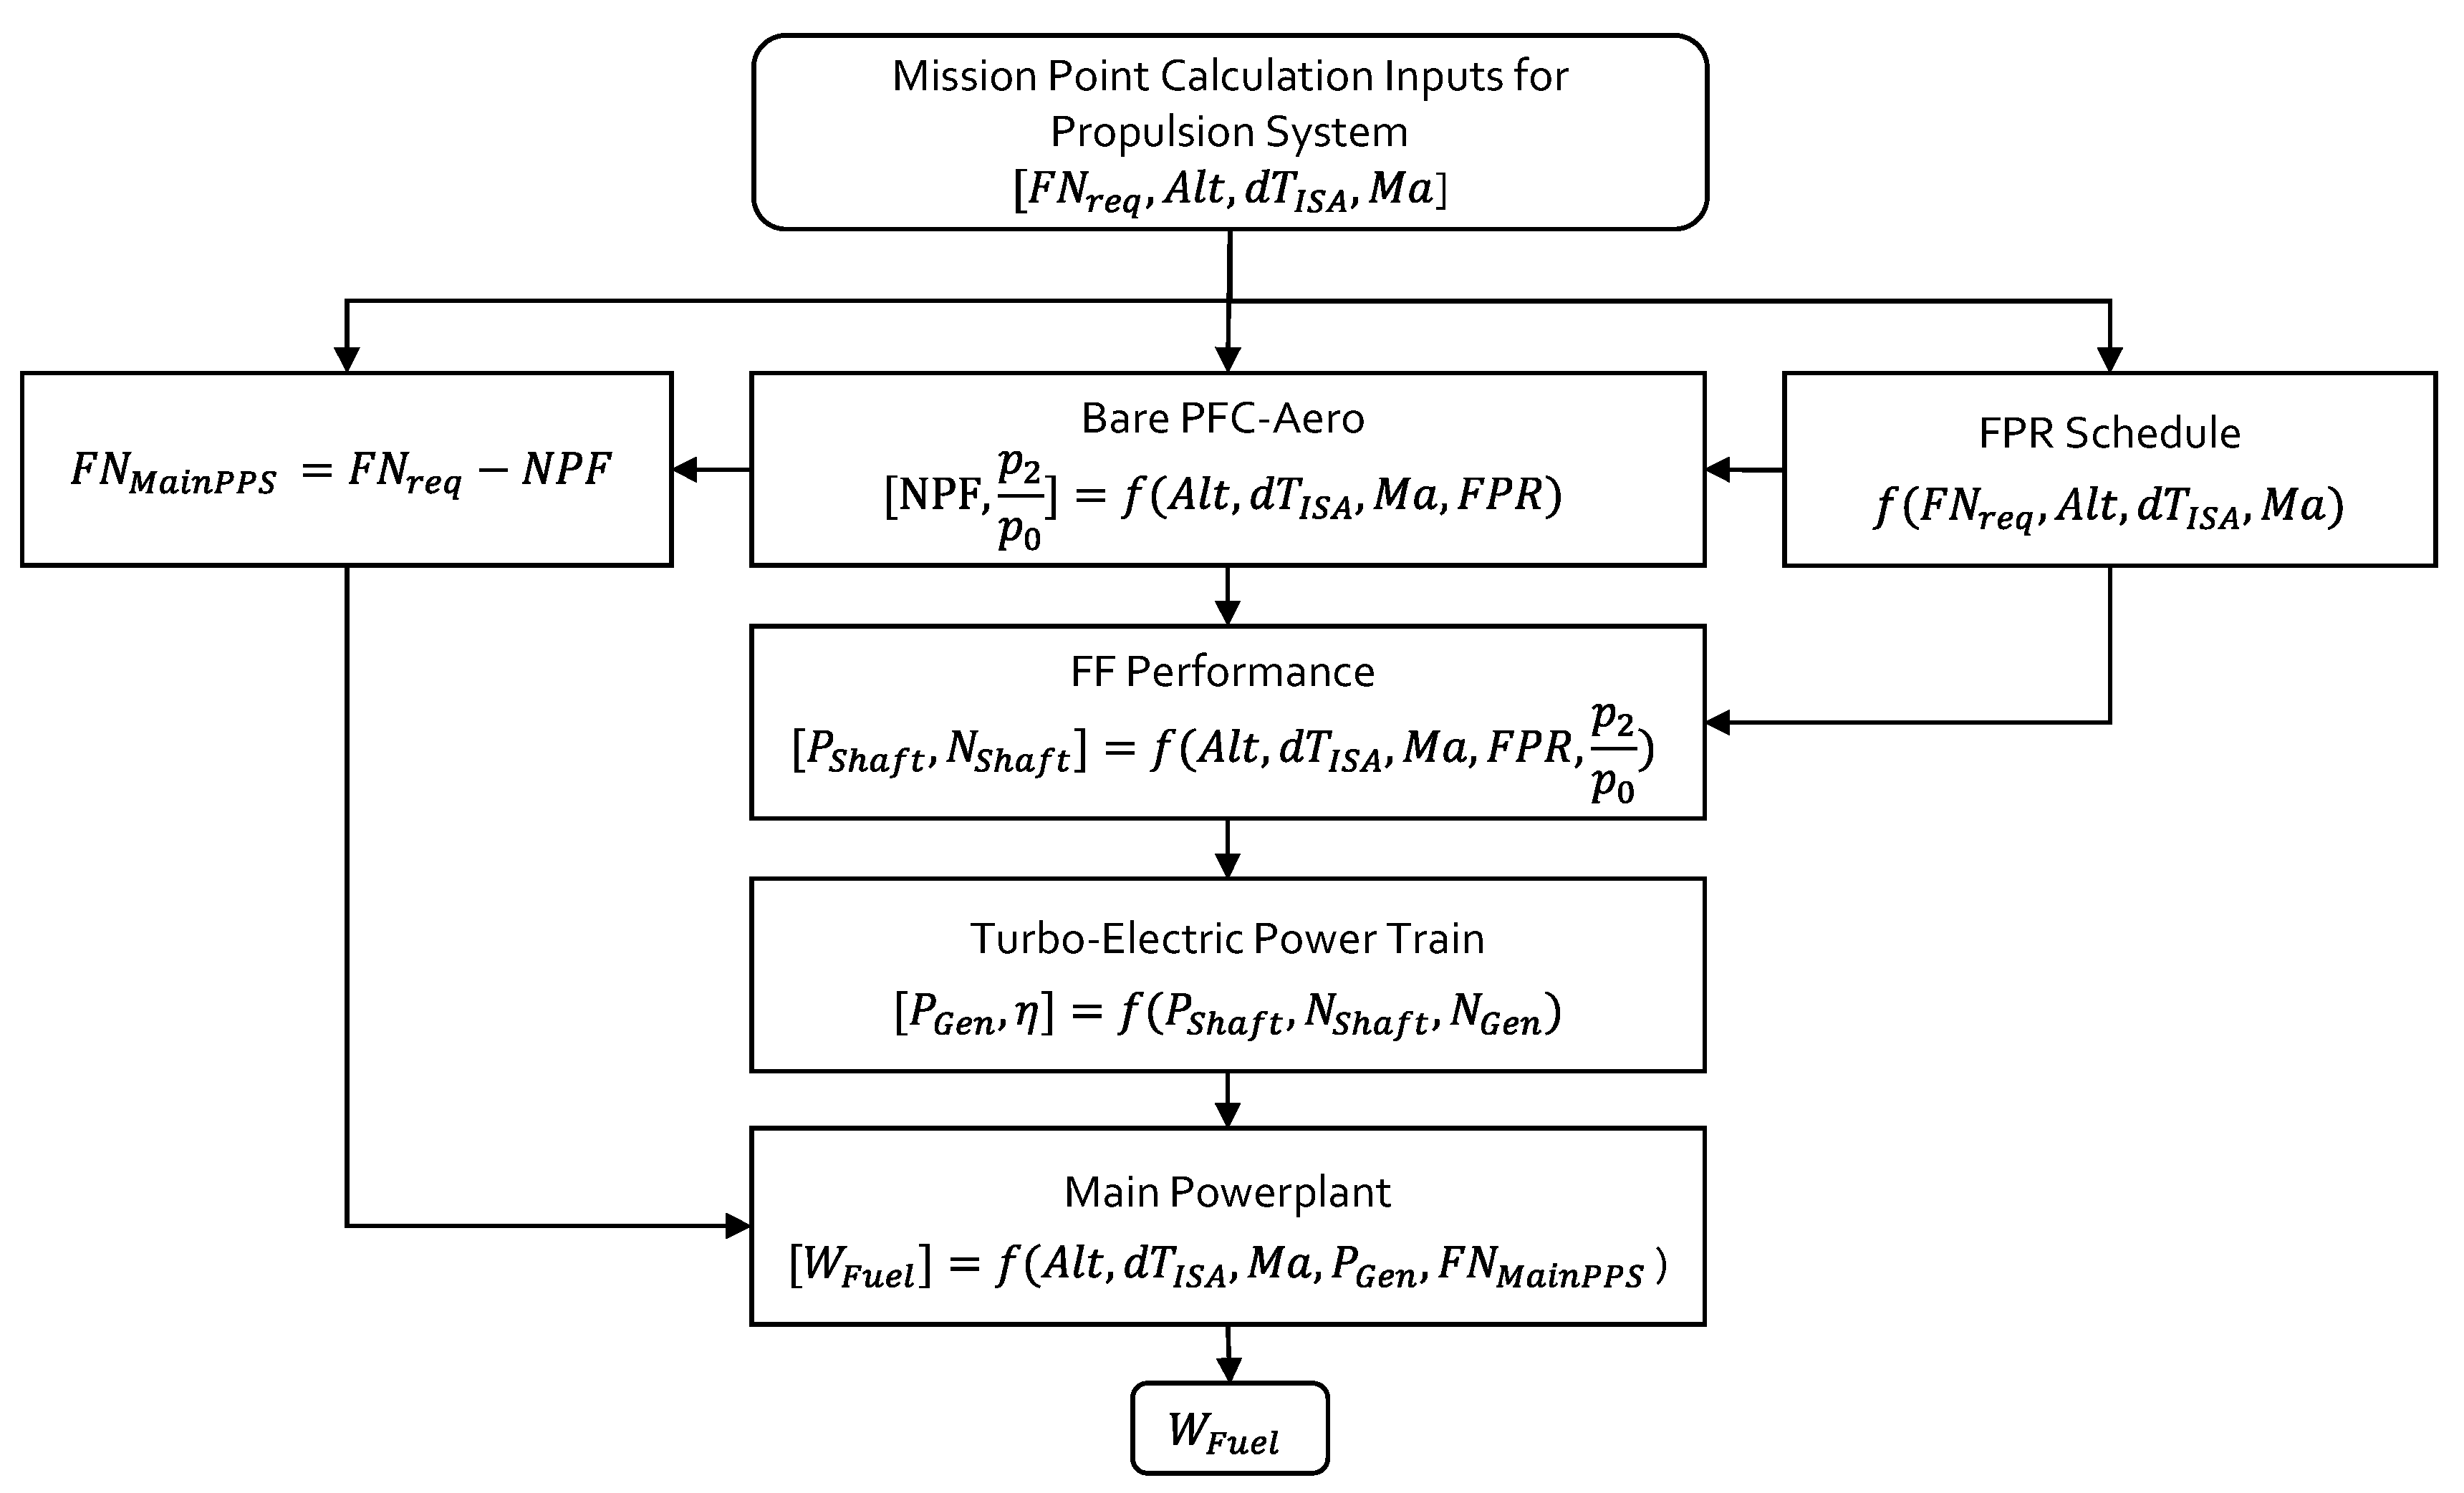
Figure 29.
Logic for PFC point performance evaluation within aircraft sizing framework (adapted from [
97]).
Figure 29.
Logic for PFC point performance evaluation within aircraft sizing framework (adapted from [
97]).
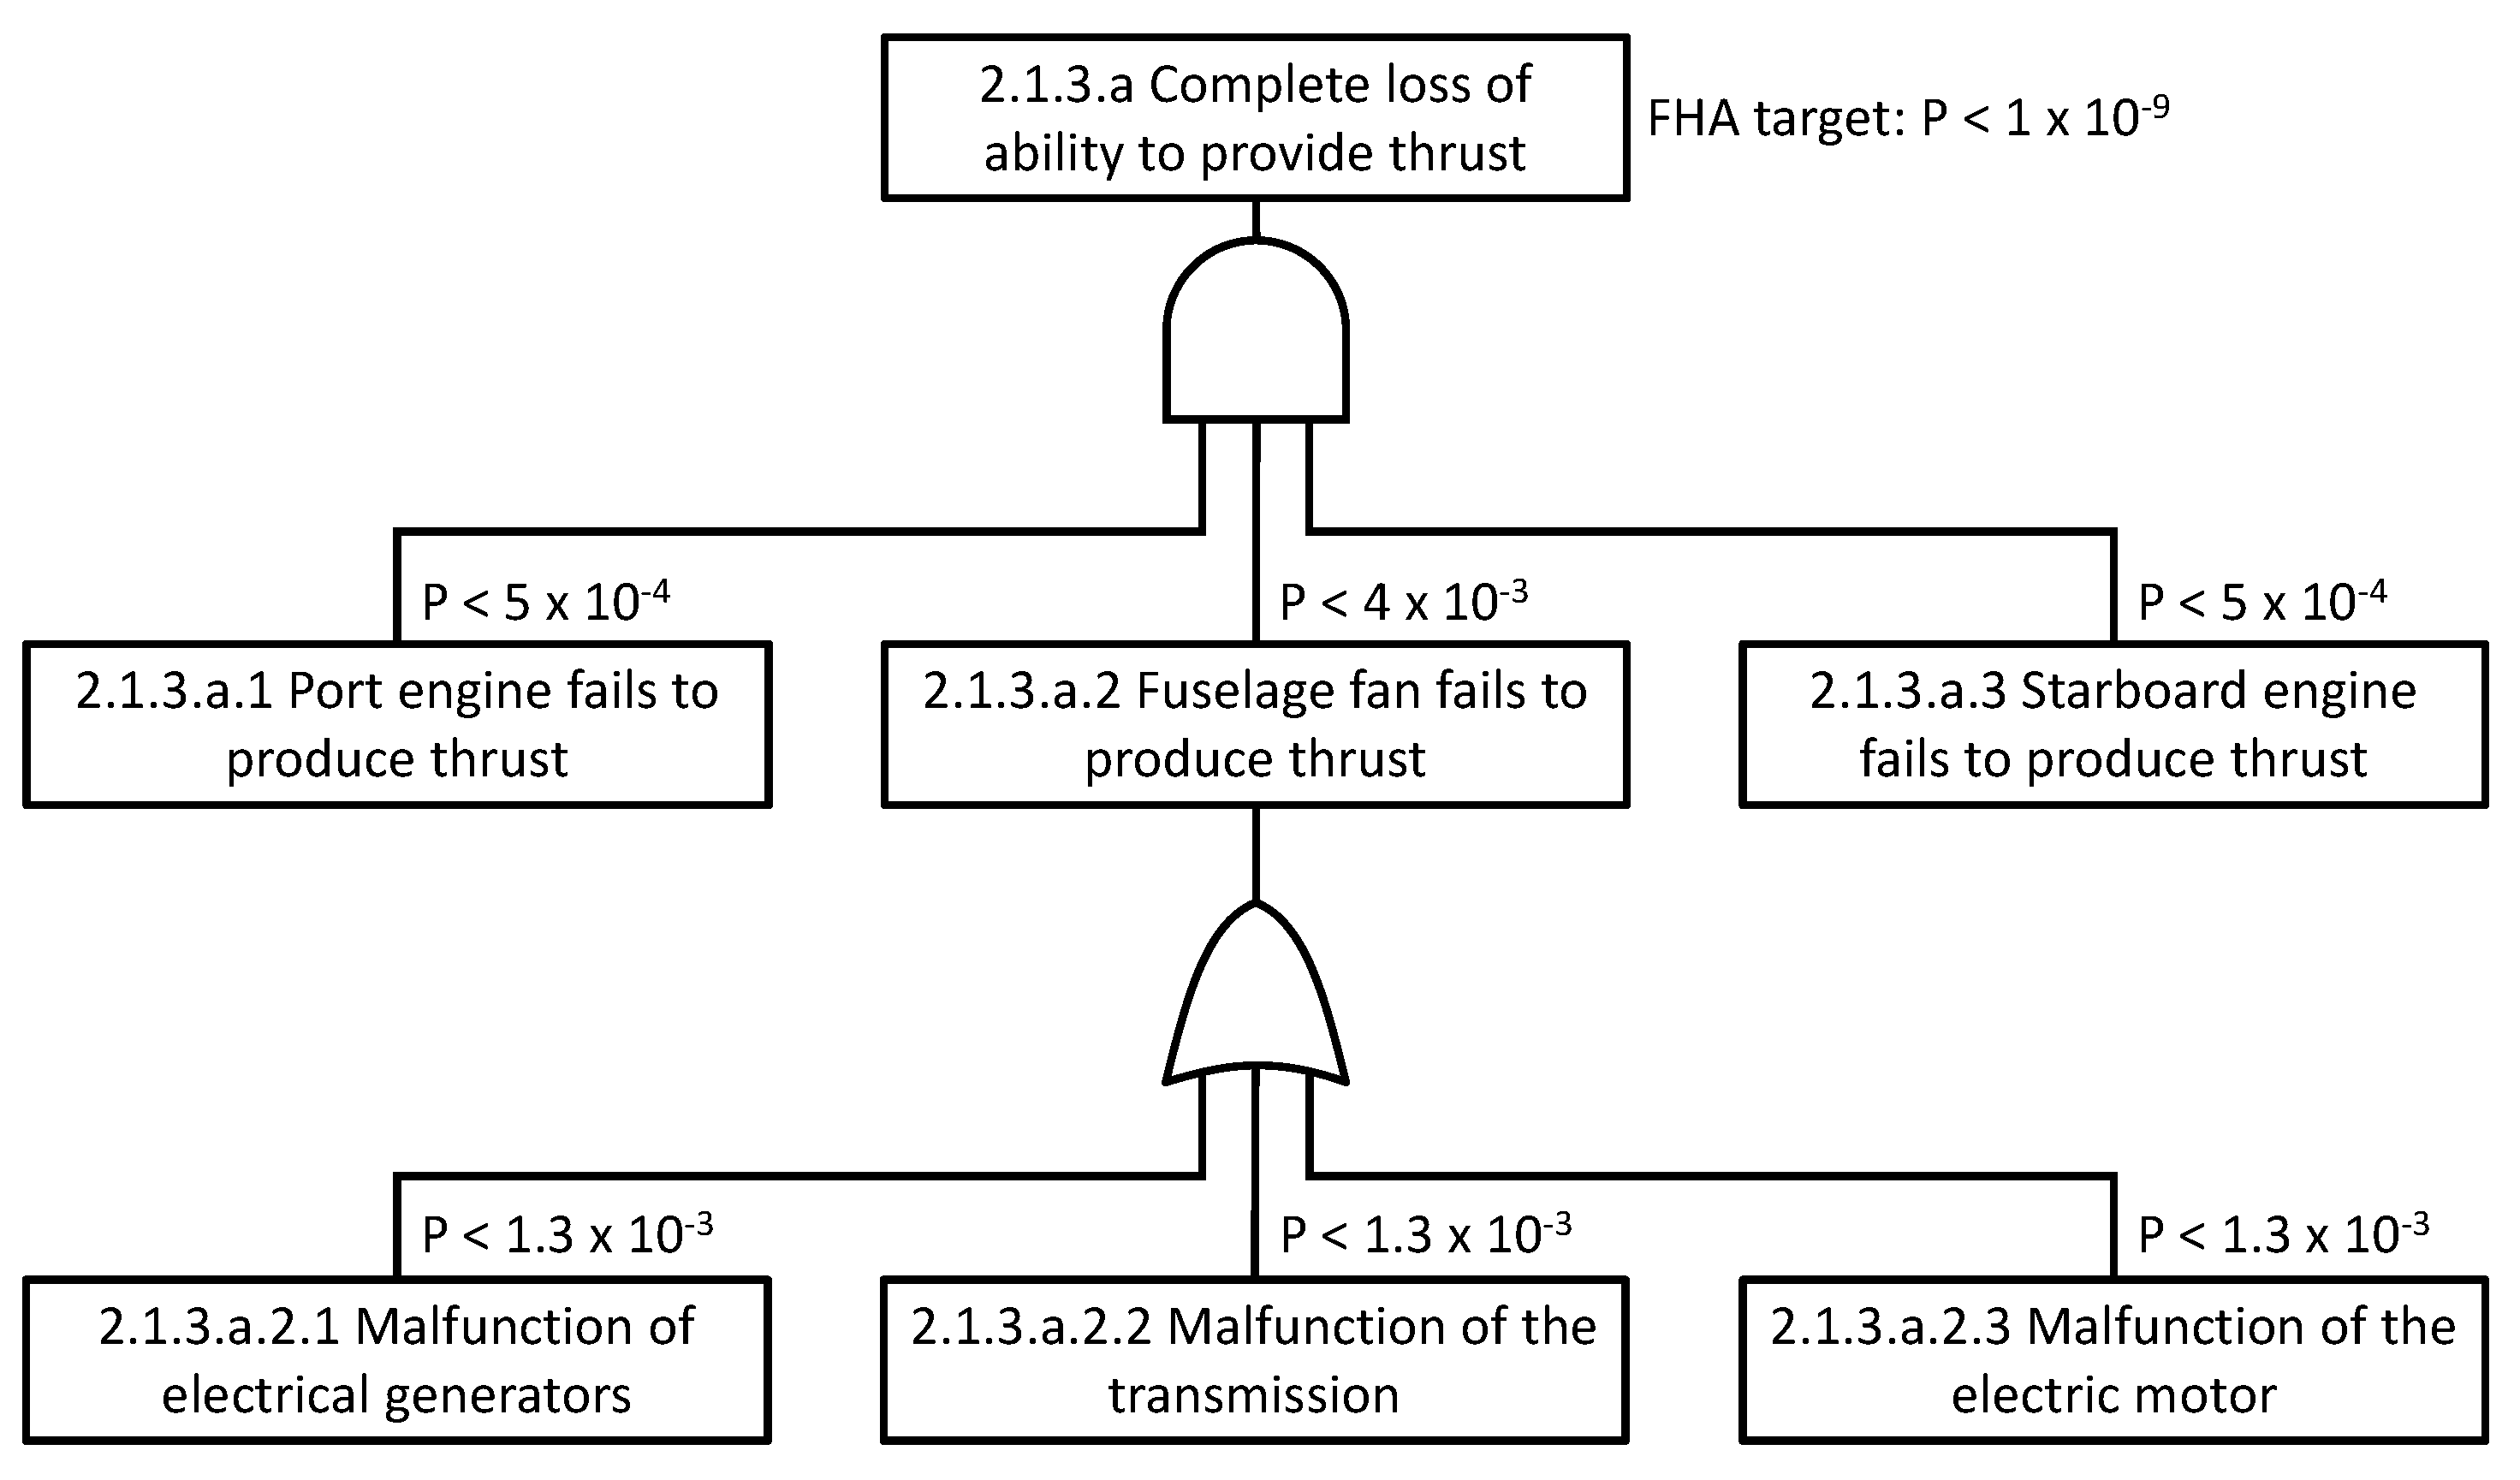
Figure 30.
Example FTA for complete loss of ability to provide thrust for the CENTRELINE PFC aircraft.
Figure 30.
Example FTA for complete loss of ability to provide thrust for the CENTRELINE PFC aircraft.
Figure 31.
Non-dimensional analysis of BLI efficiency factor for CENTRELINE and DisPURSAL aero-shapings (adapted from [
50]).
Figure 31.
Non-dimensional analysis of BLI efficiency factor for CENTRELINE and DisPURSAL aero-shapings (adapted from [
50]).
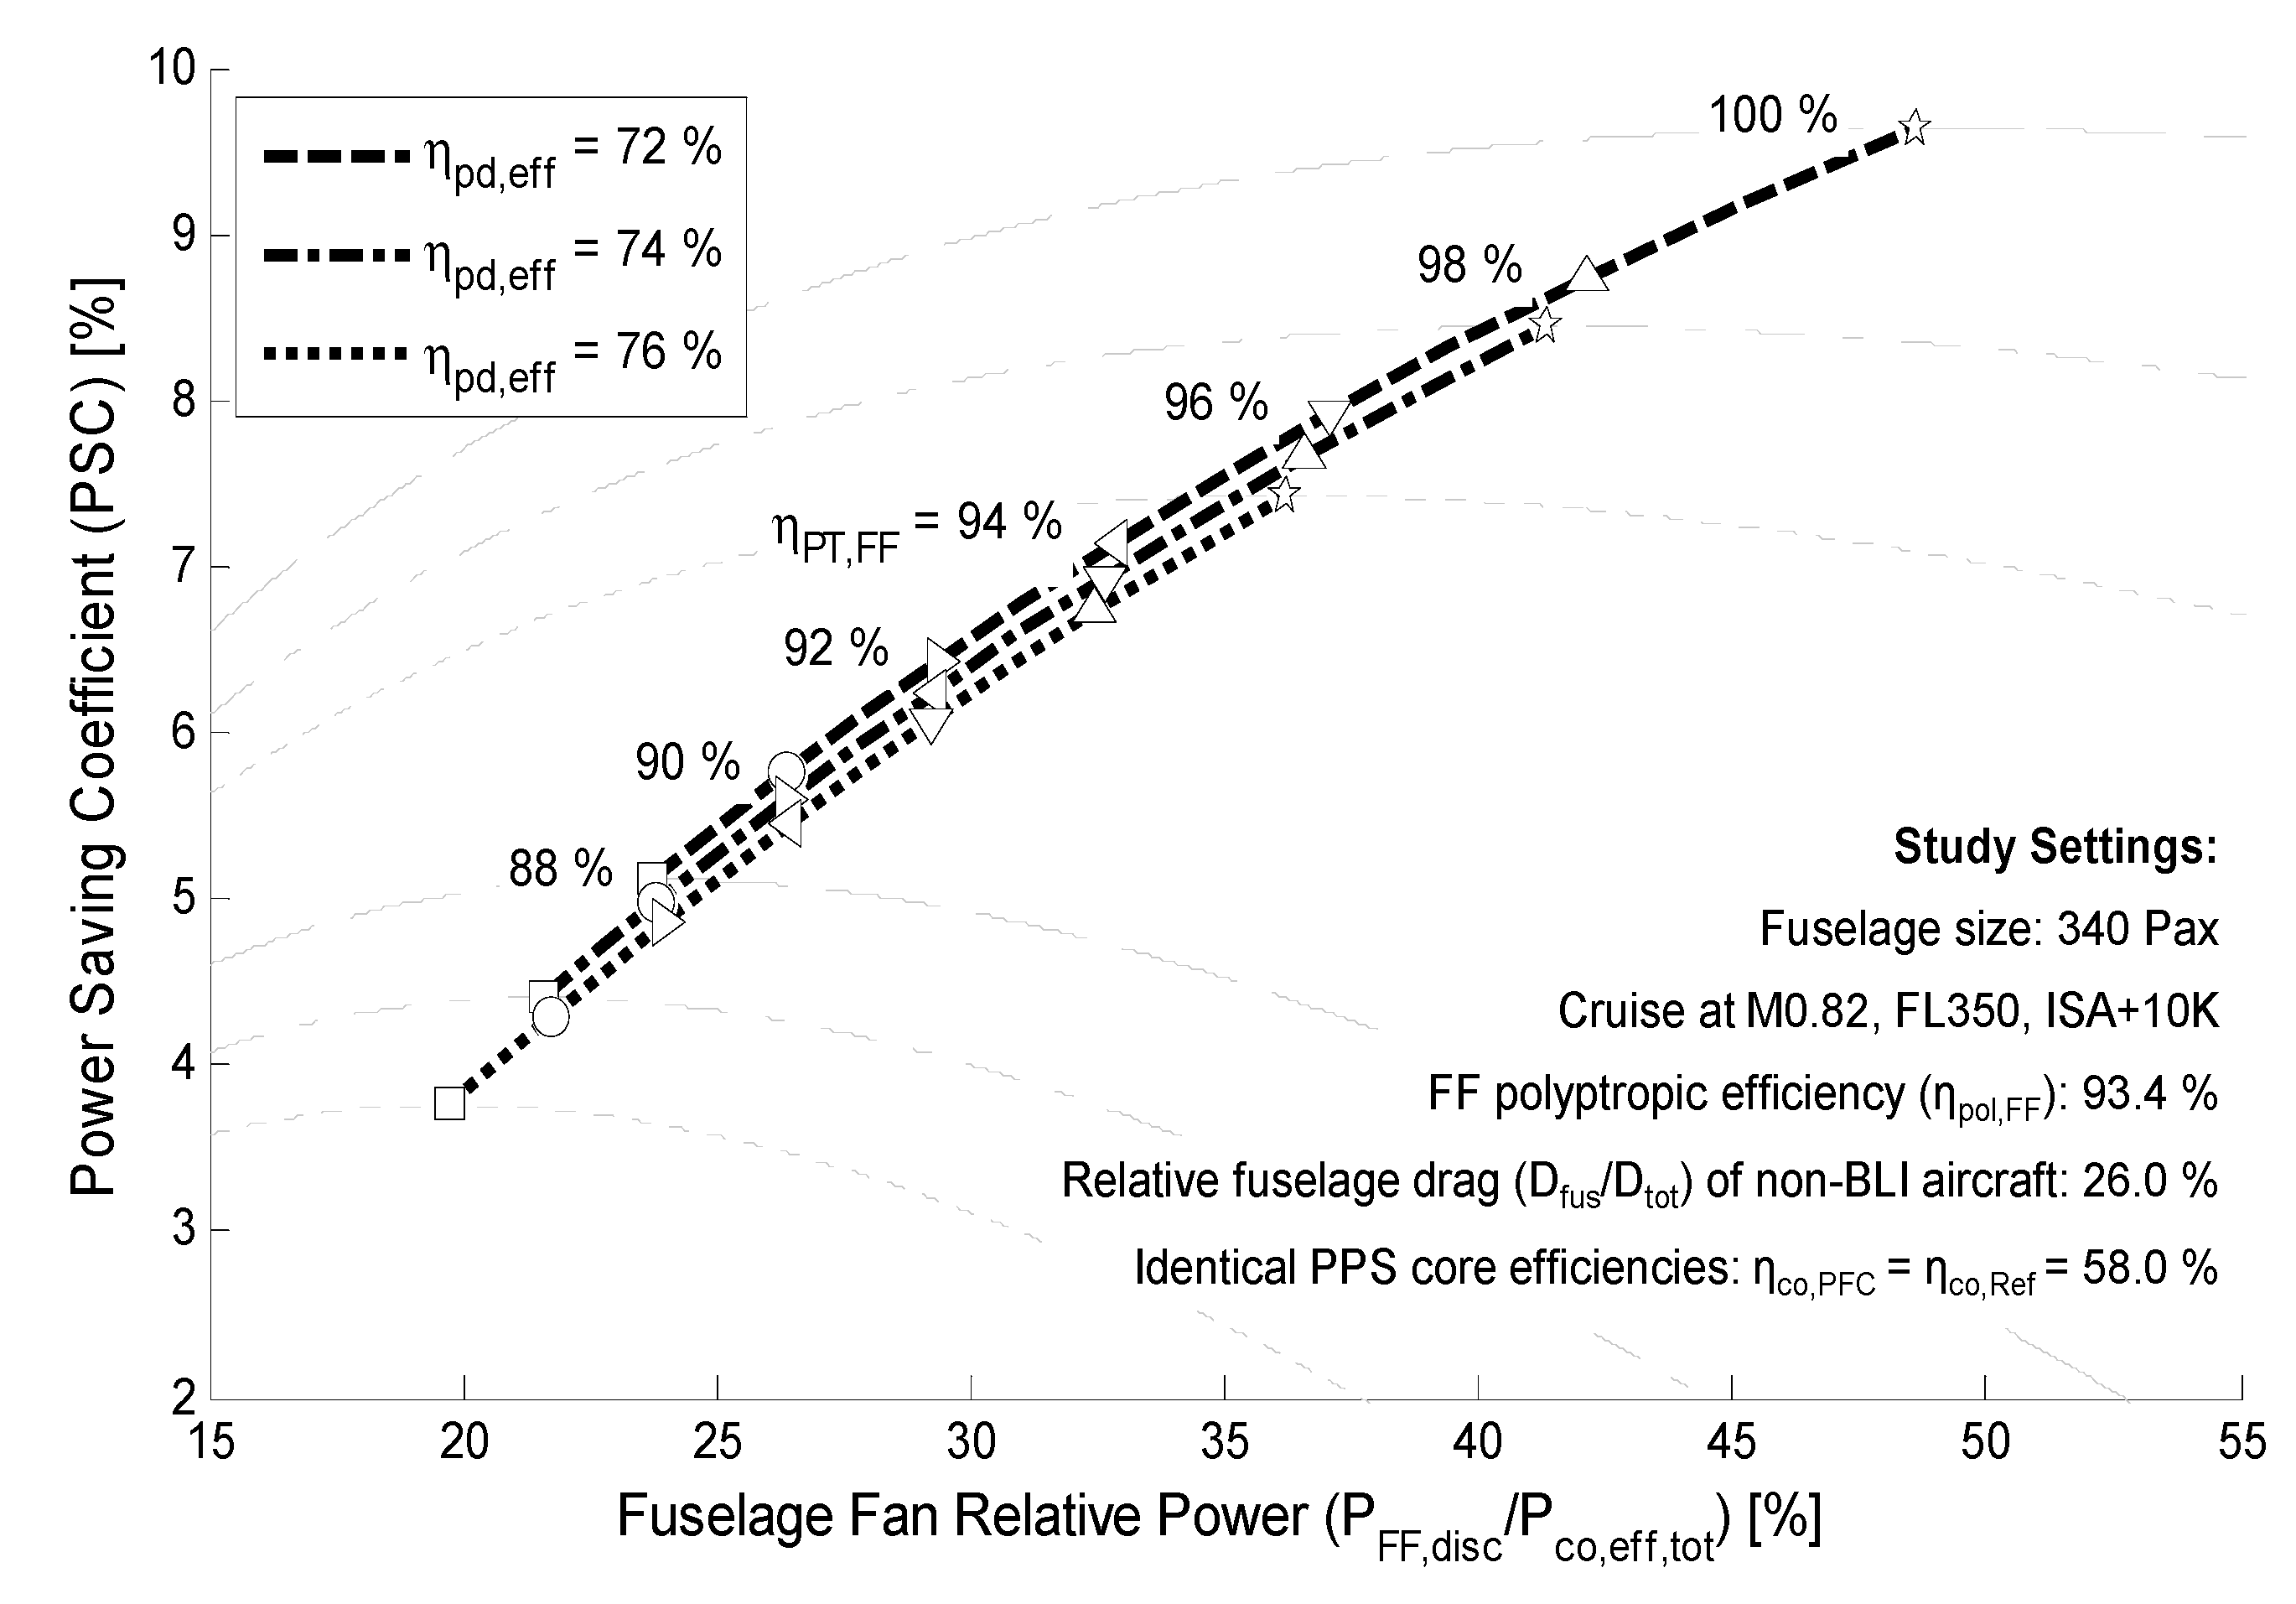
Figure 32.
Identification of optimum power savings and corresponding FF cruise power settings for combinations of power train and non-BLI propulsive device efficiencies.
Figure 32.
Identification of optimum power savings and corresponding FF cruise power settings for combinations of power train and non-BLI propulsive device efficiencies.
Figure 33.
Basic schematic of PFC flying lab similar to the BLADE demonstrator aircraft.
Figure 33.
Basic schematic of PFC flying lab similar to the BLADE demonstrator aircraft.
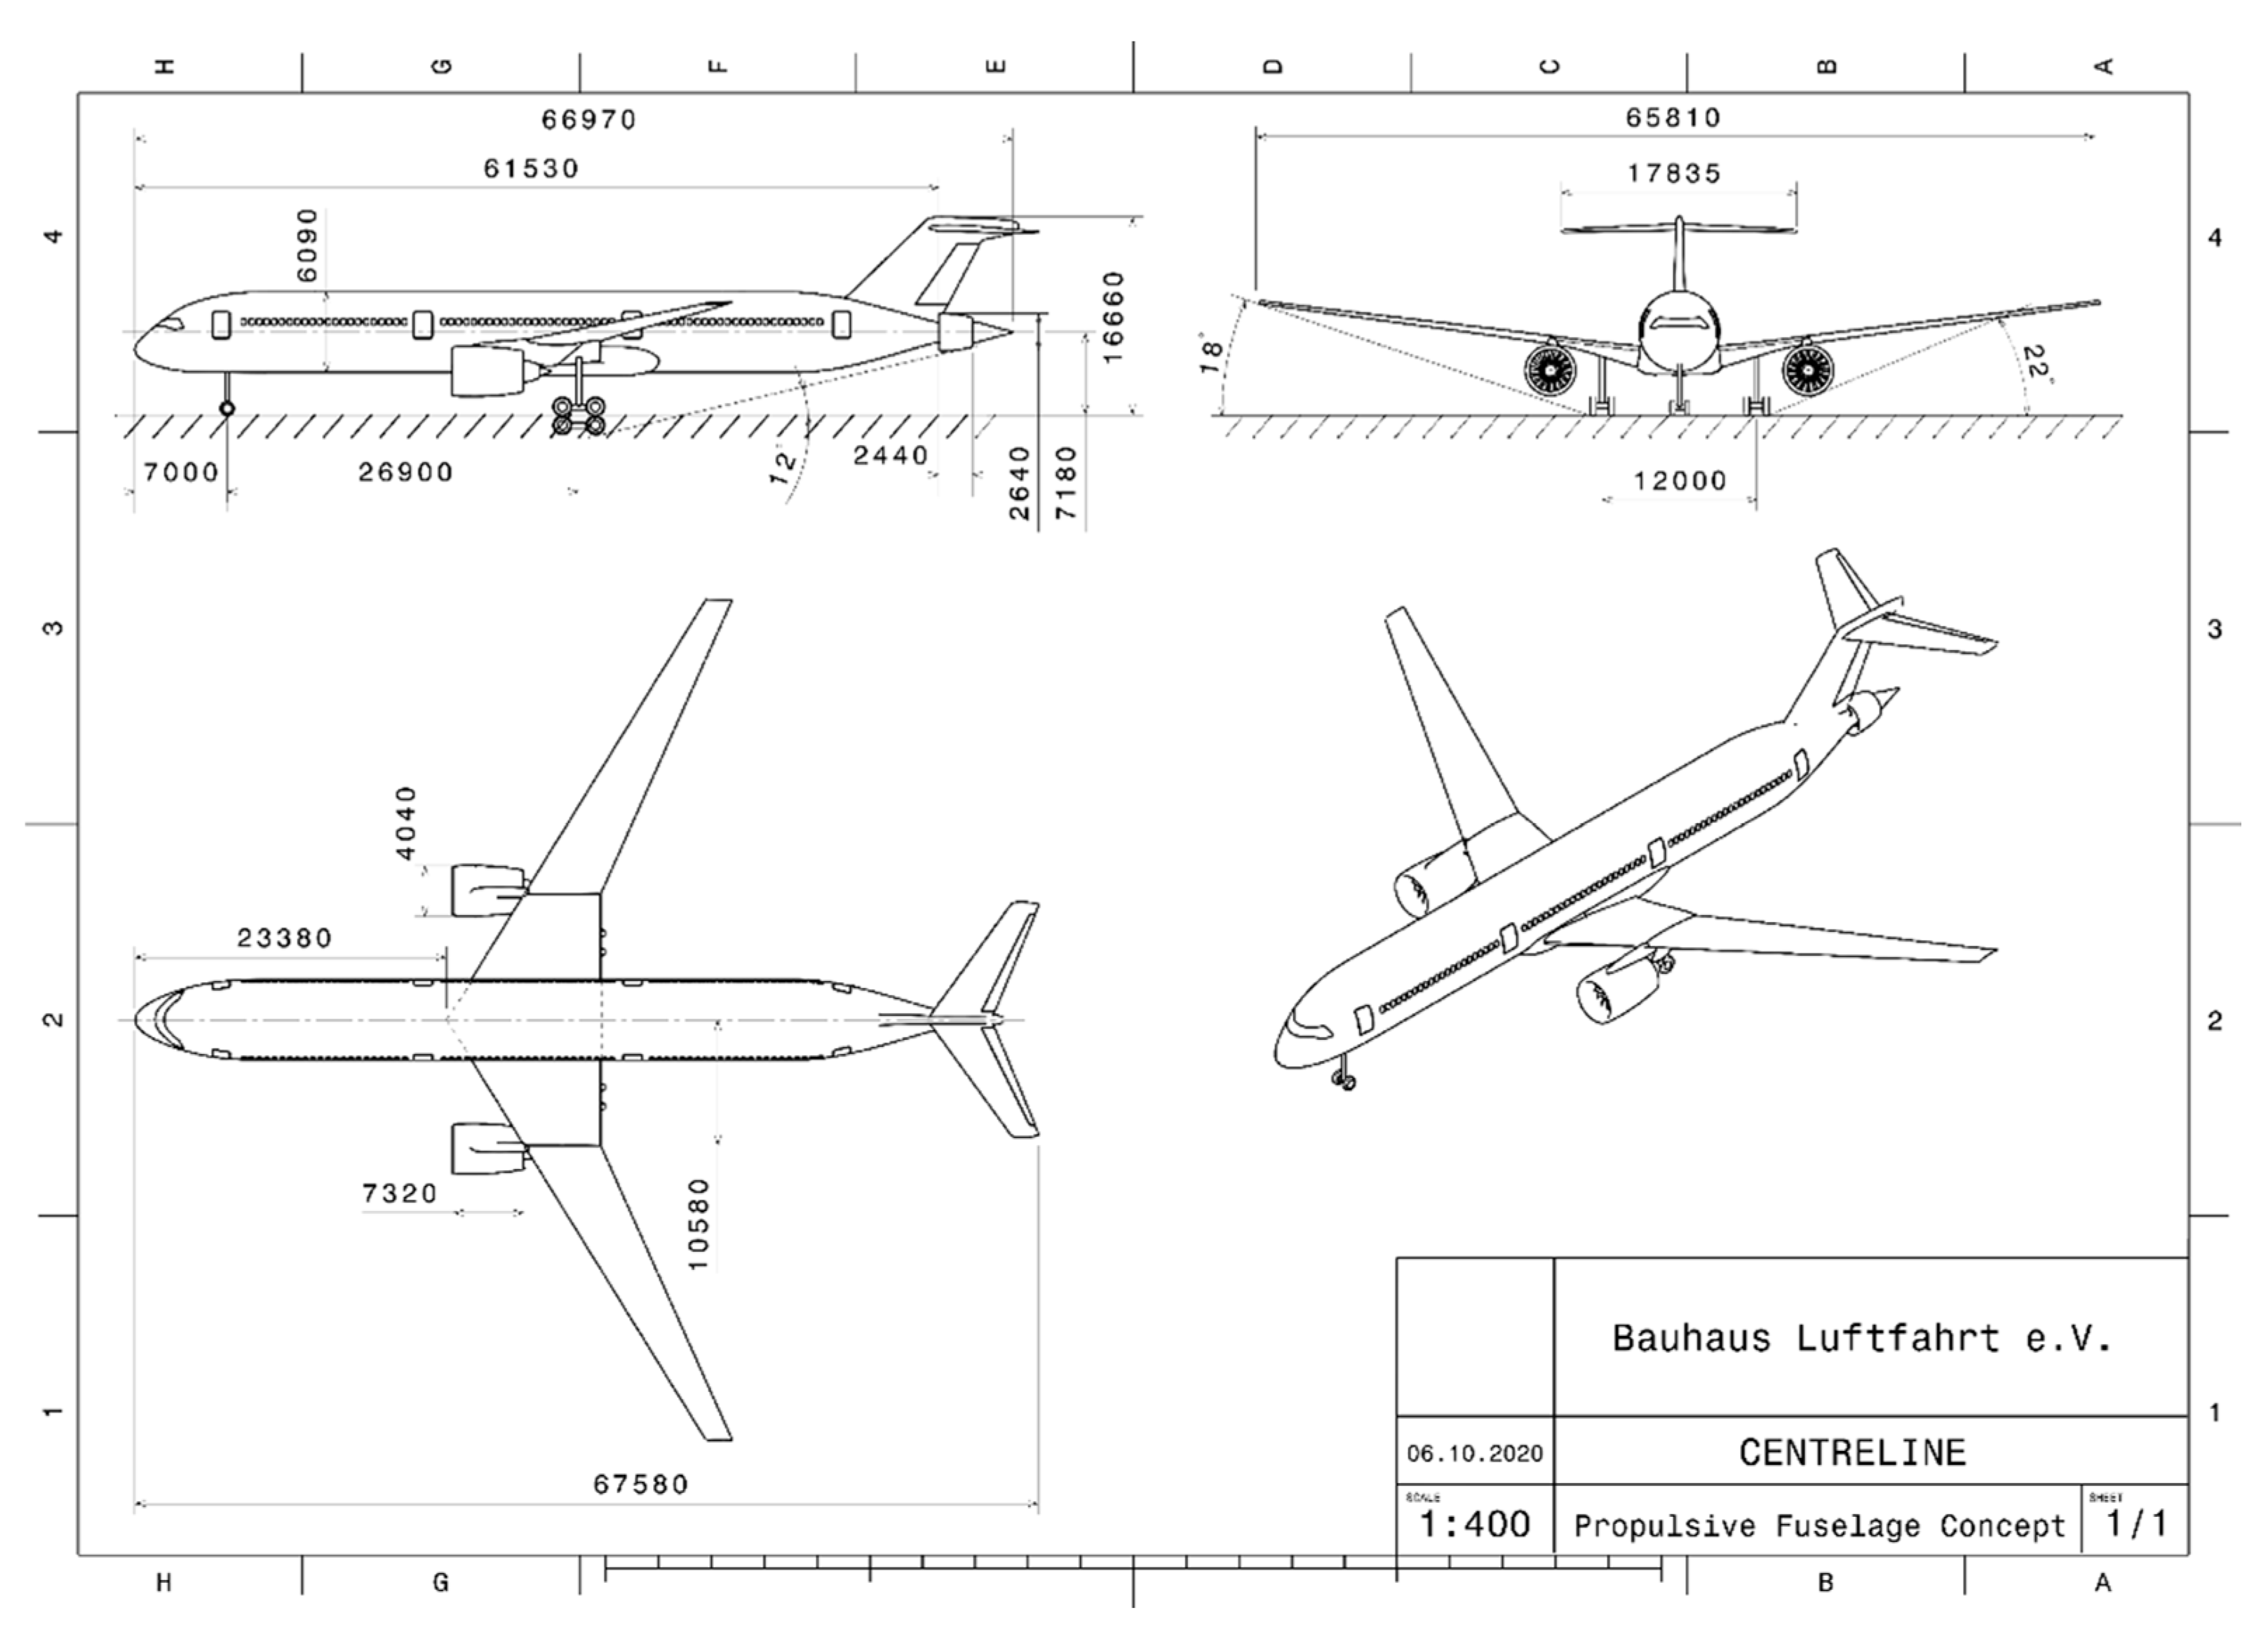
Figure 34.
Three-view of the baseline member of the CENTRELINE PFC aircraft family, dimensions in mm.
Figure 34.
Three-view of the baseline member of the CENTRELINE PFC aircraft family, dimensions in mm.
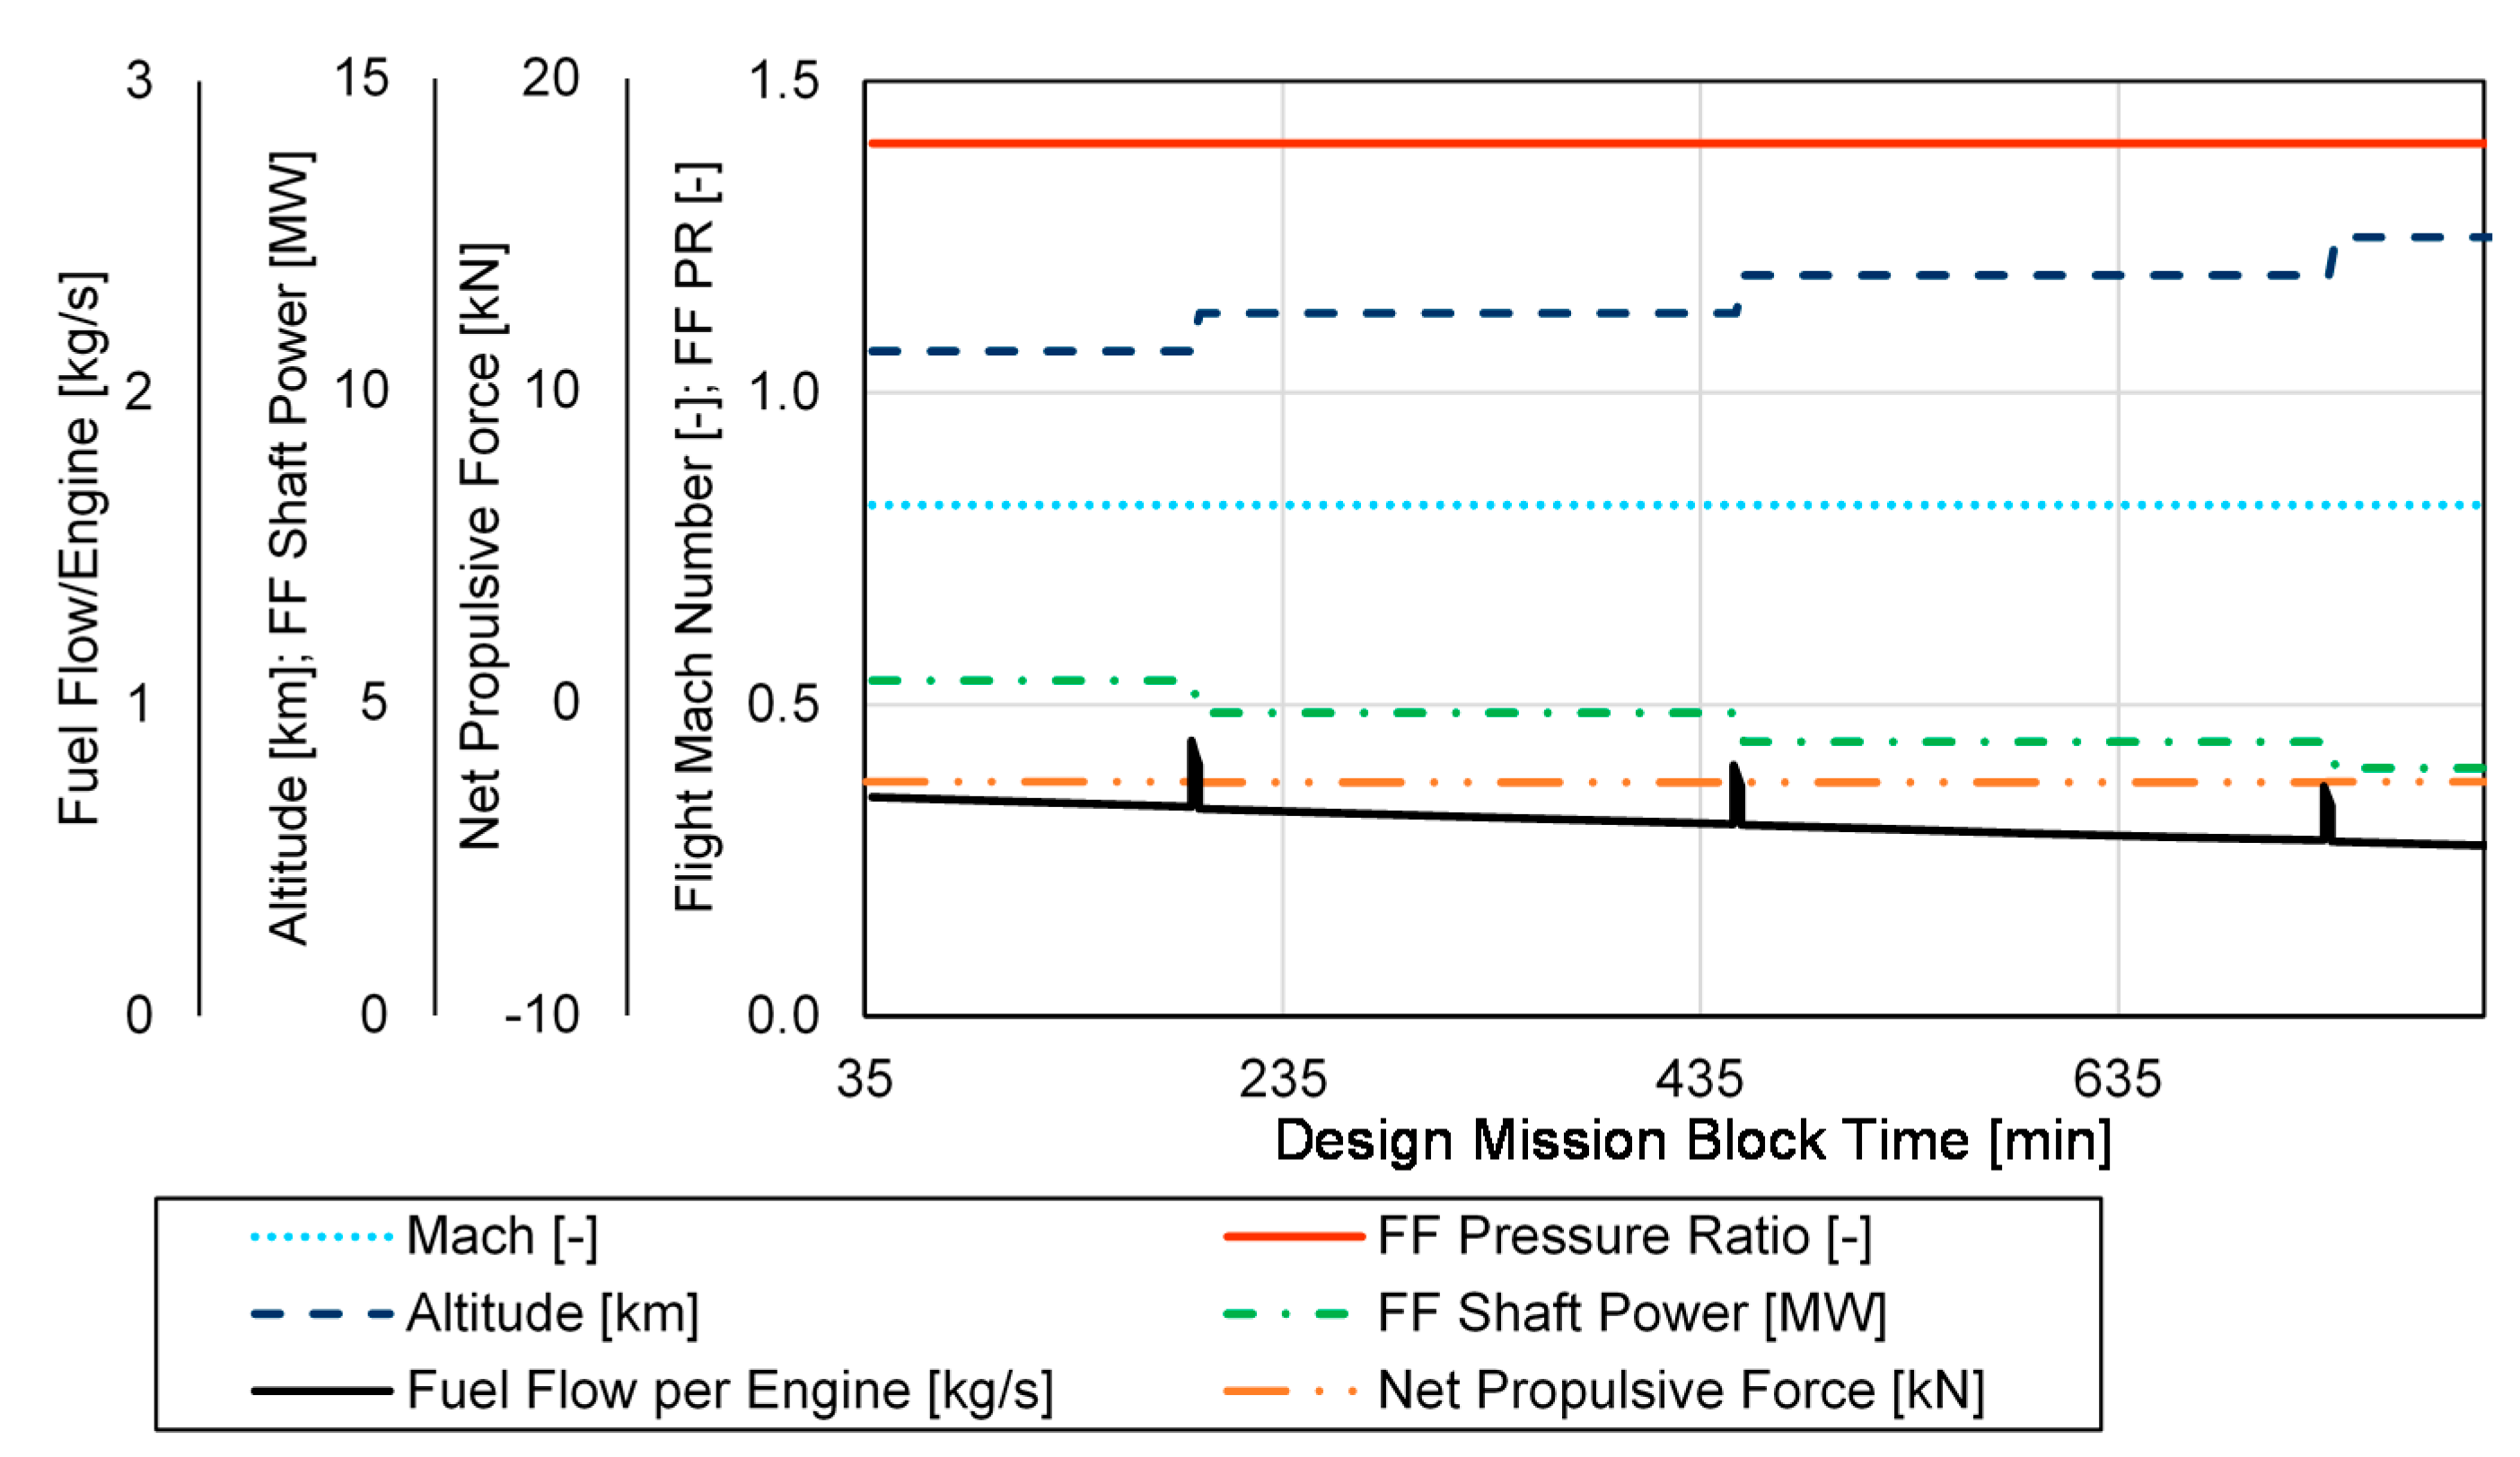
Figure 35.
Simulated PFC aircraft specific performance characteristics recorded for the design mission cruise phase (adapted from [
69]).
Figure 35.
Simulated PFC aircraft specific performance characteristics recorded for the design mission cruise phase (adapted from [
69]).
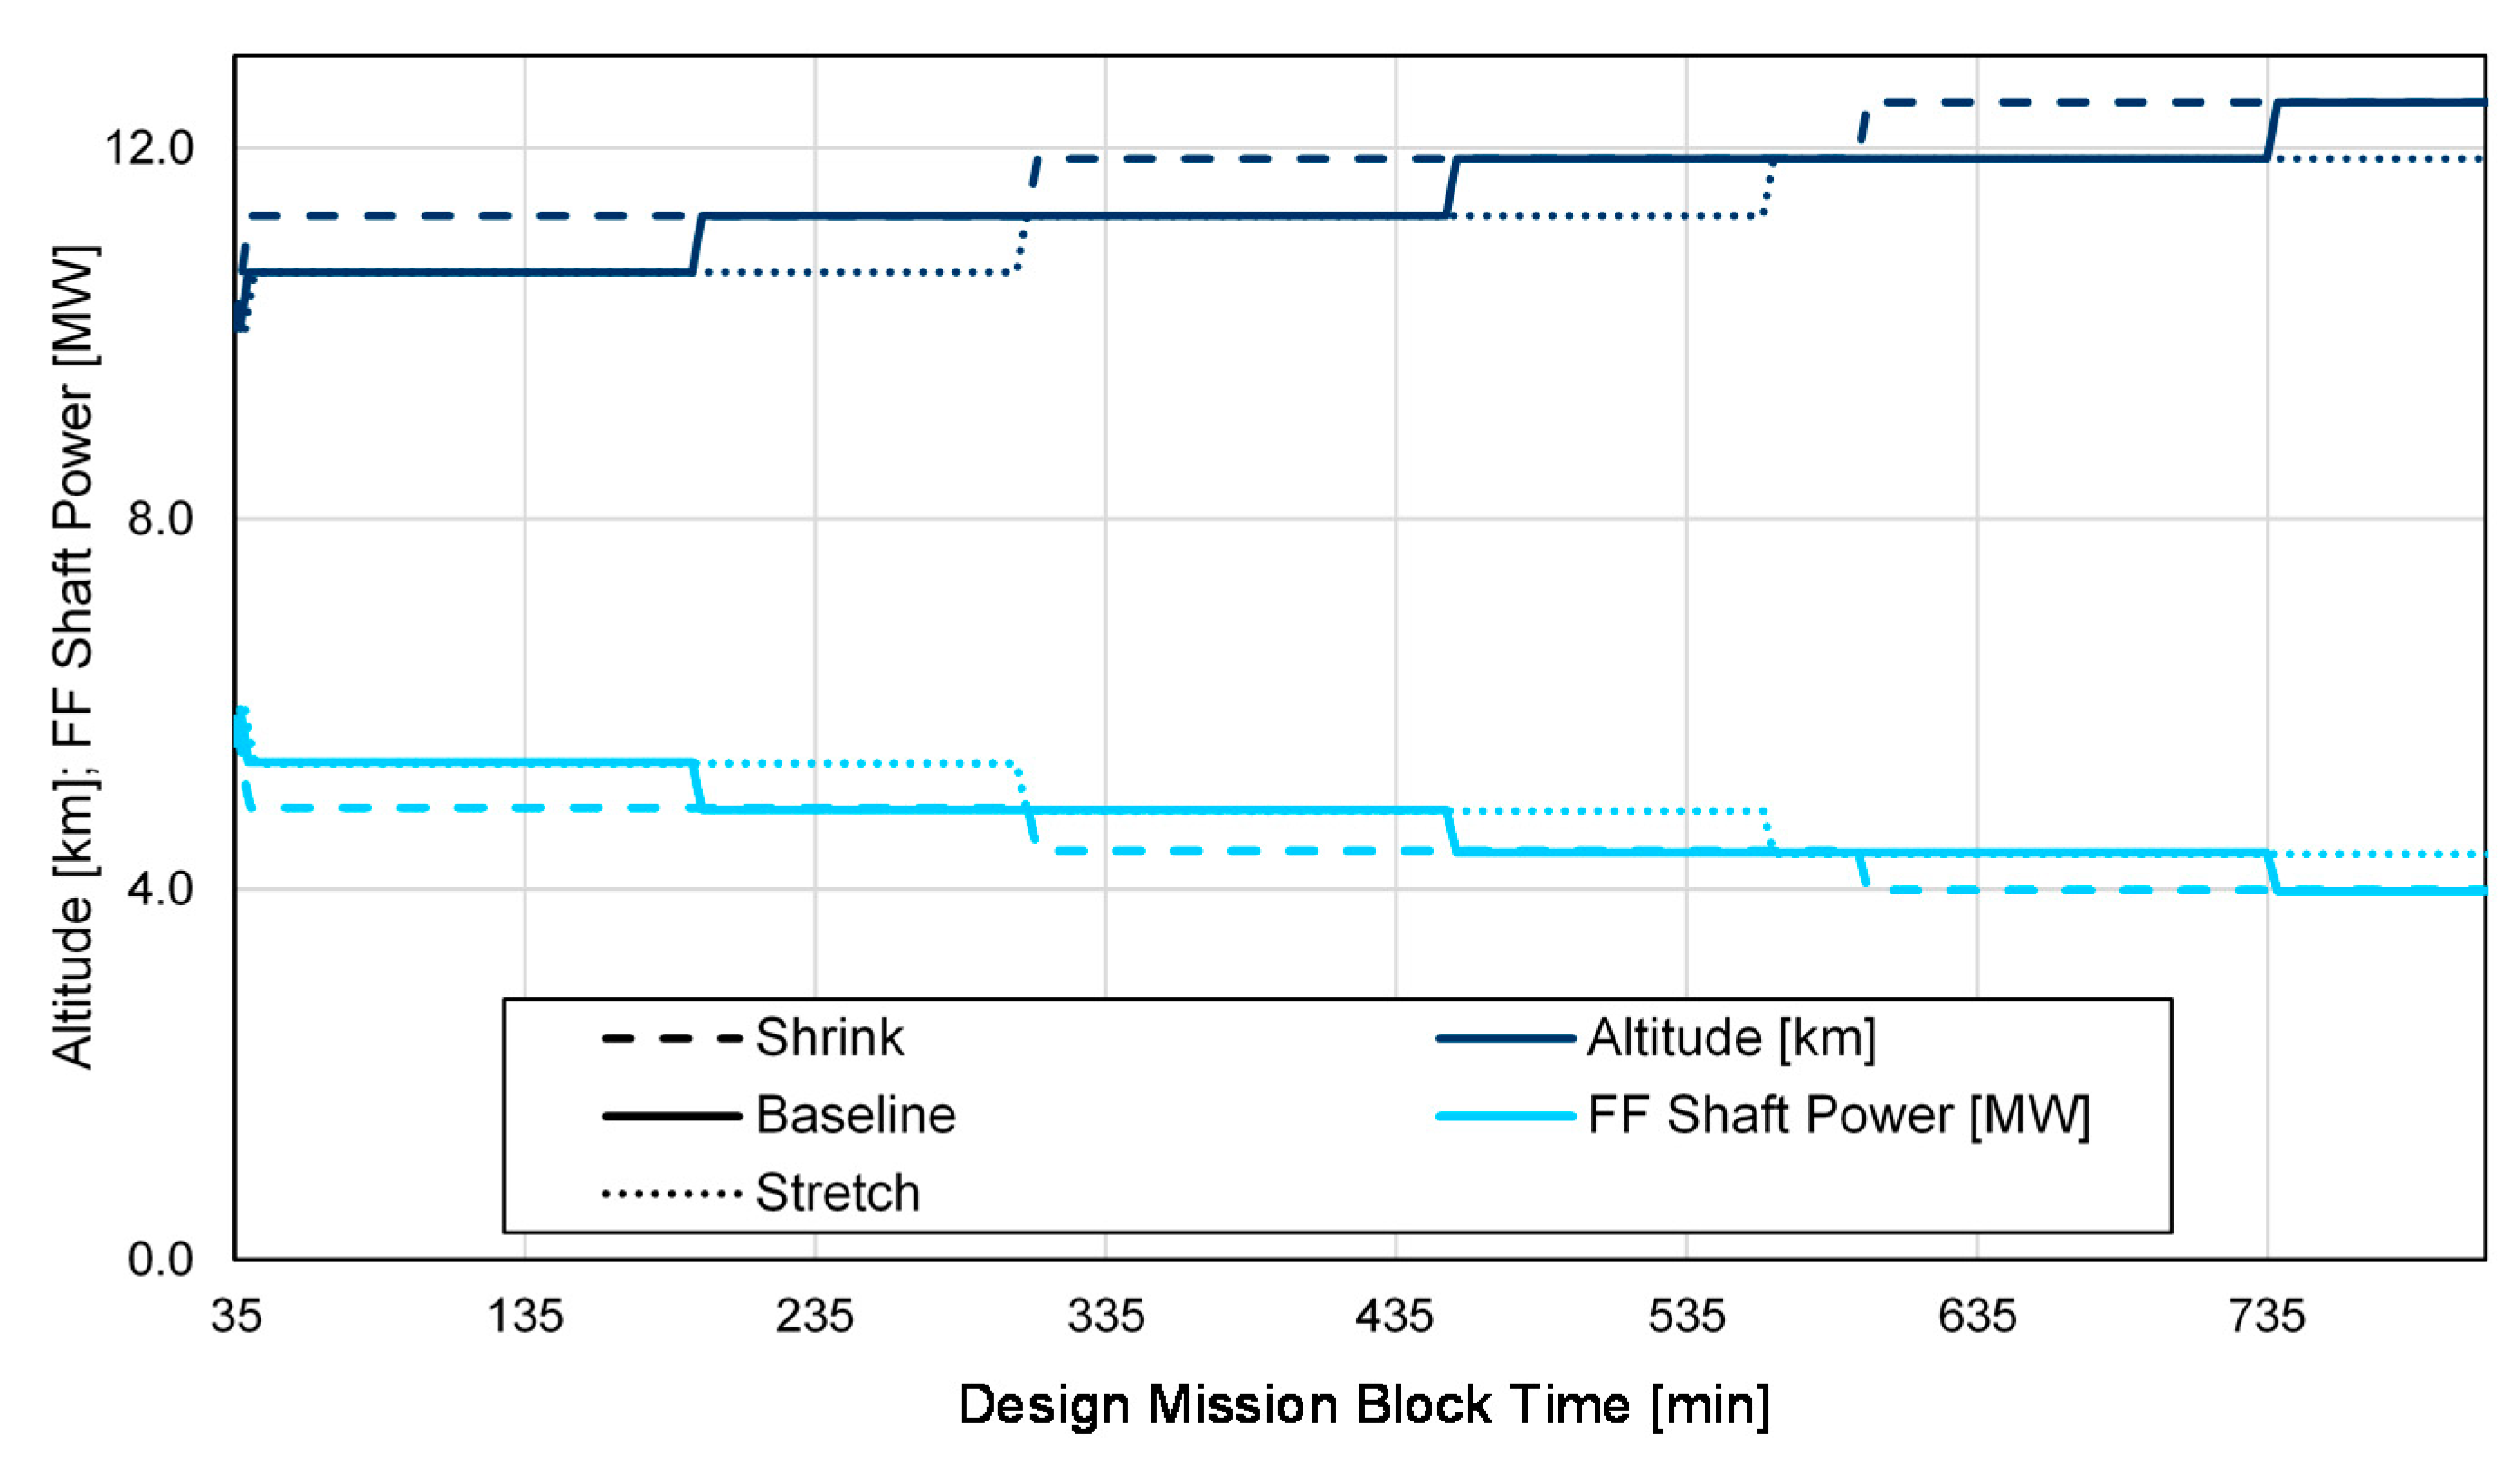
Figure 36.
Cruise altitude and FF ideal shaft power profile for the PFC family members at Ma 0.82, ISA+10 K (adapted from [
69]).
Figure 36.
Cruise altitude and FF ideal shaft power profile for the PFC family members at Ma 0.82, ISA+10 K (adapted from [
69]).
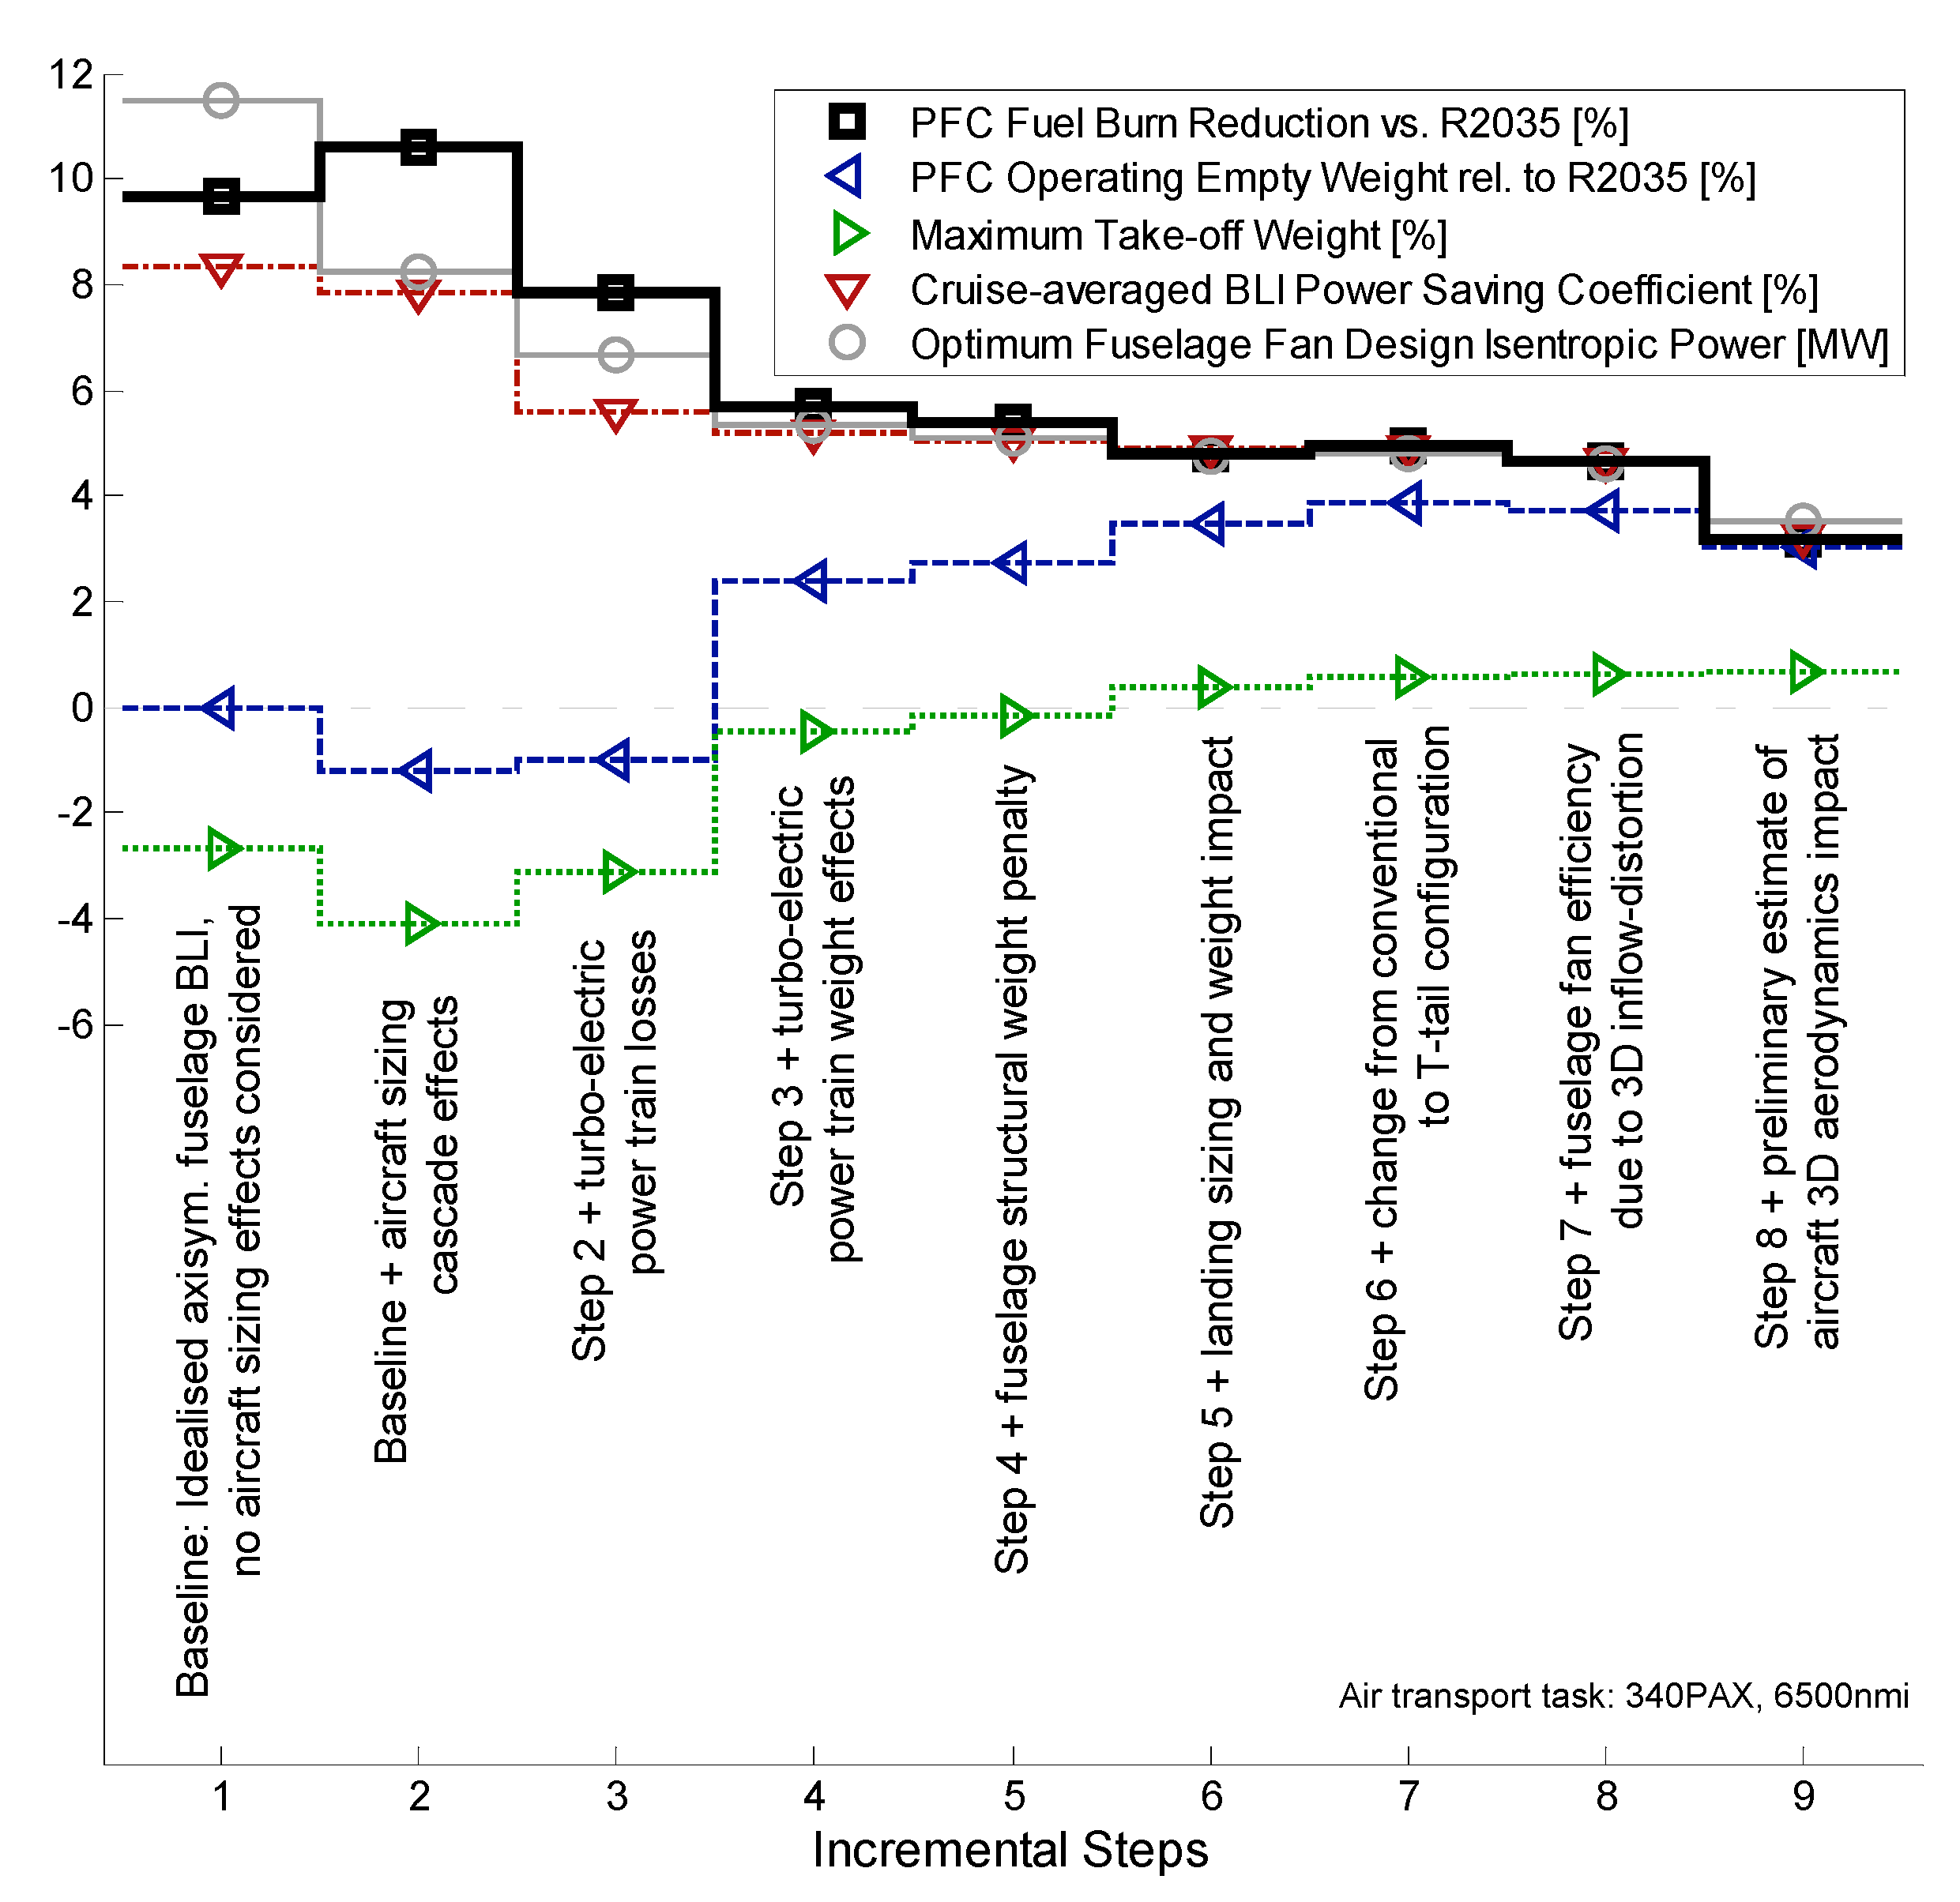
Figure 37.
Stack-up of effects analysis on fuel burn reduction of CENTRELINE turbo-electric PFC against R2035 aircraft.
Figure 37.
Stack-up of effects analysis on fuel burn reduction of CENTRELINE turbo-electric PFC against R2035 aircraft.
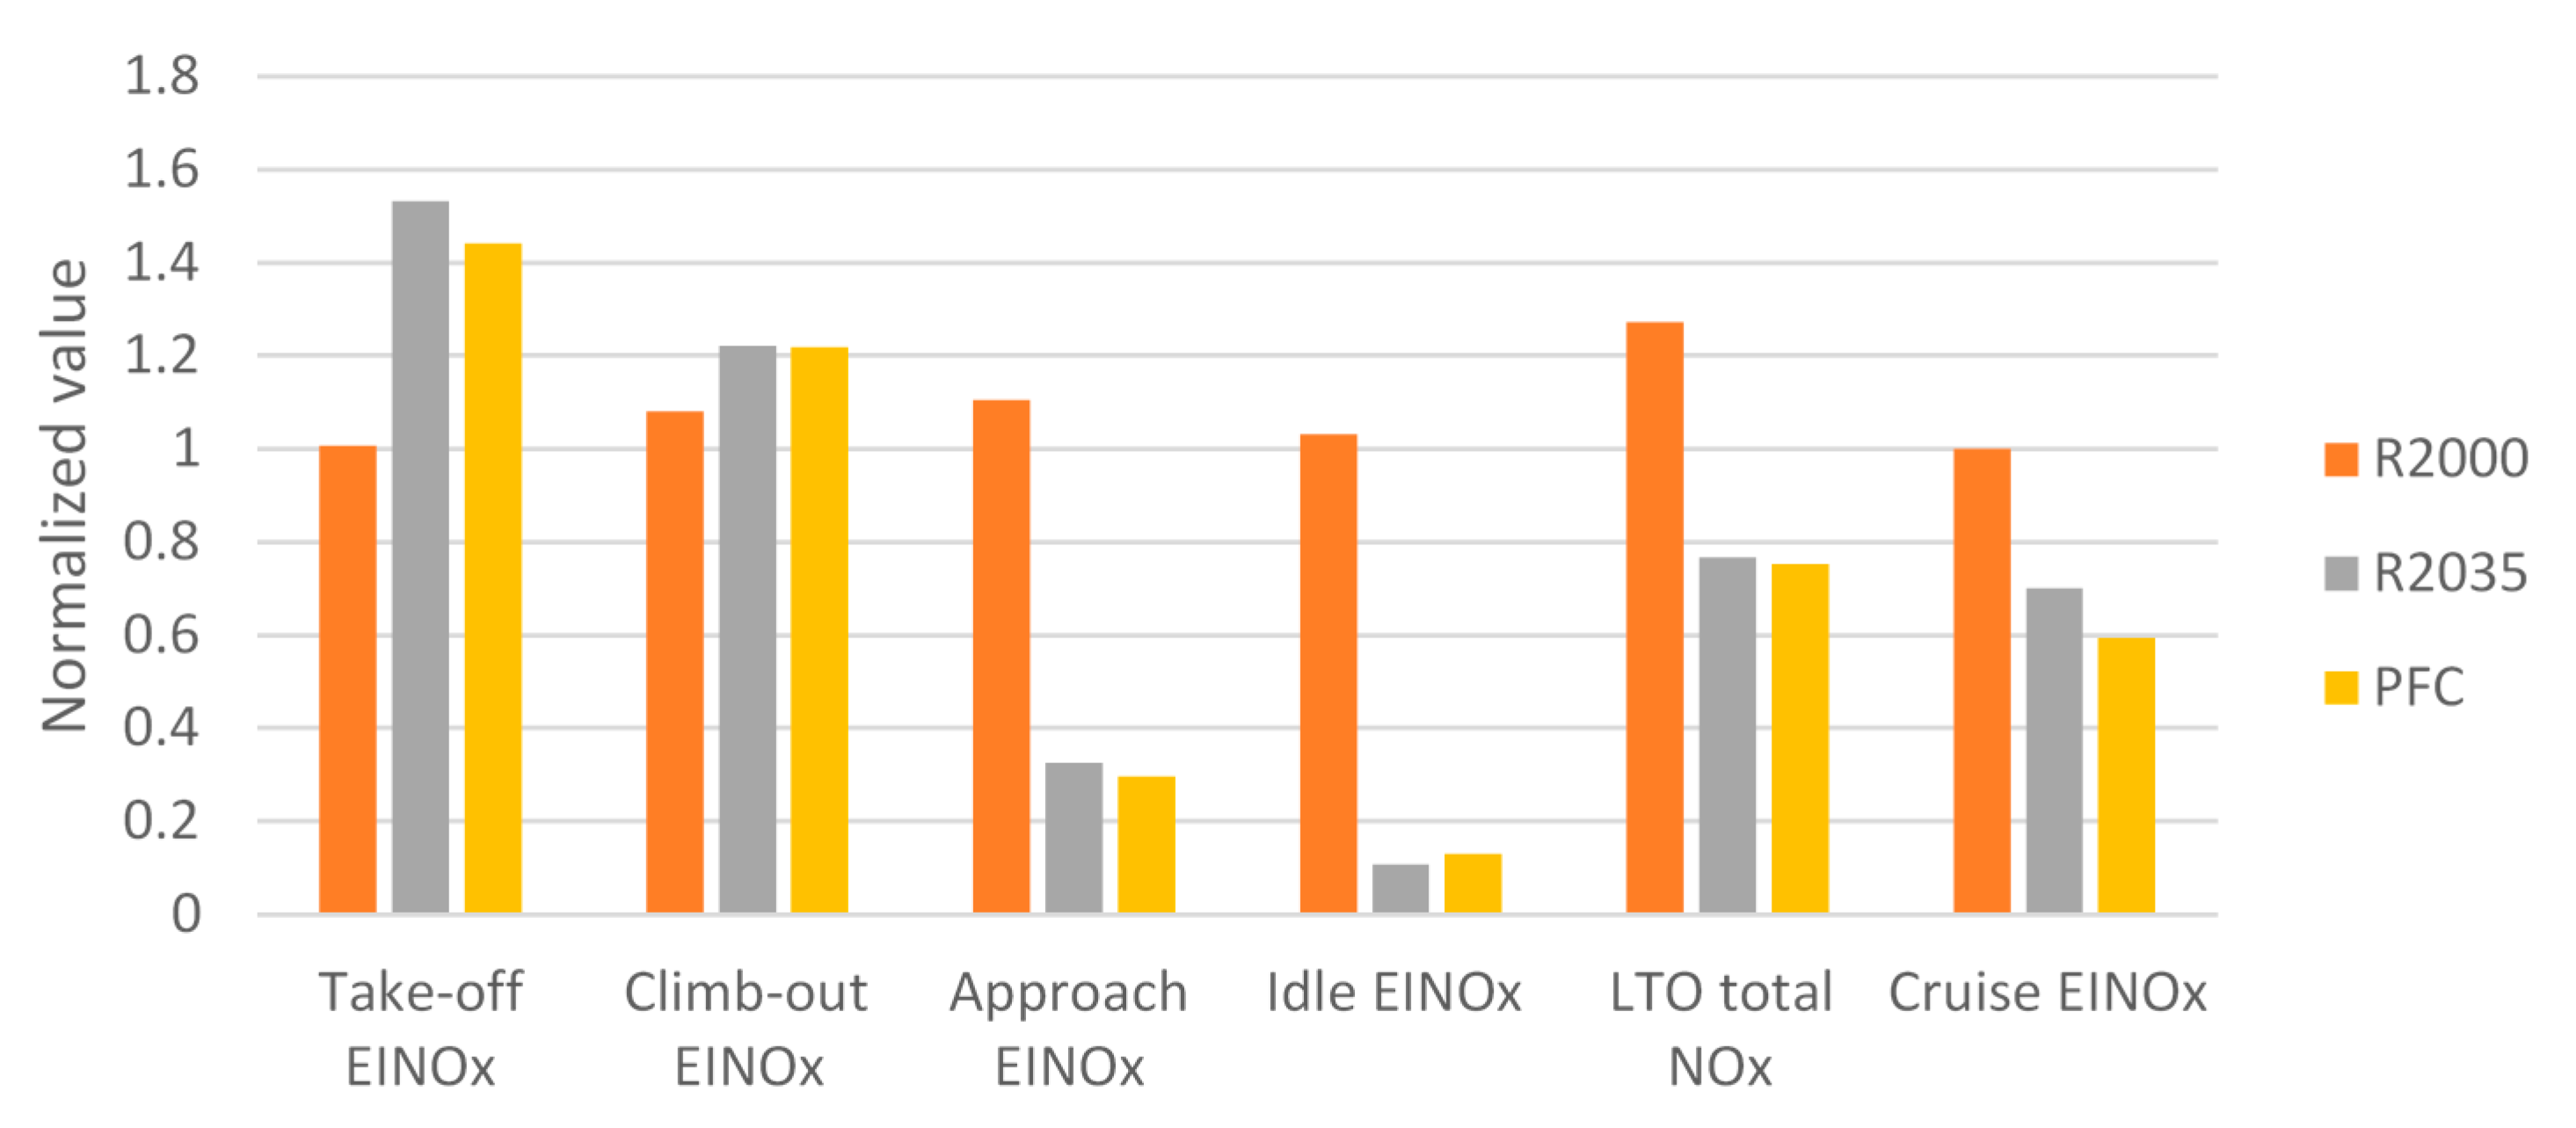
Figure 38.
NOx emissions assessments results for the CENTRELINE R2000, R2035 & PFC aircraft.
Figure 38.
NOx emissions assessments results for the CENTRELINE R2000, R2035 & PFC aircraft.
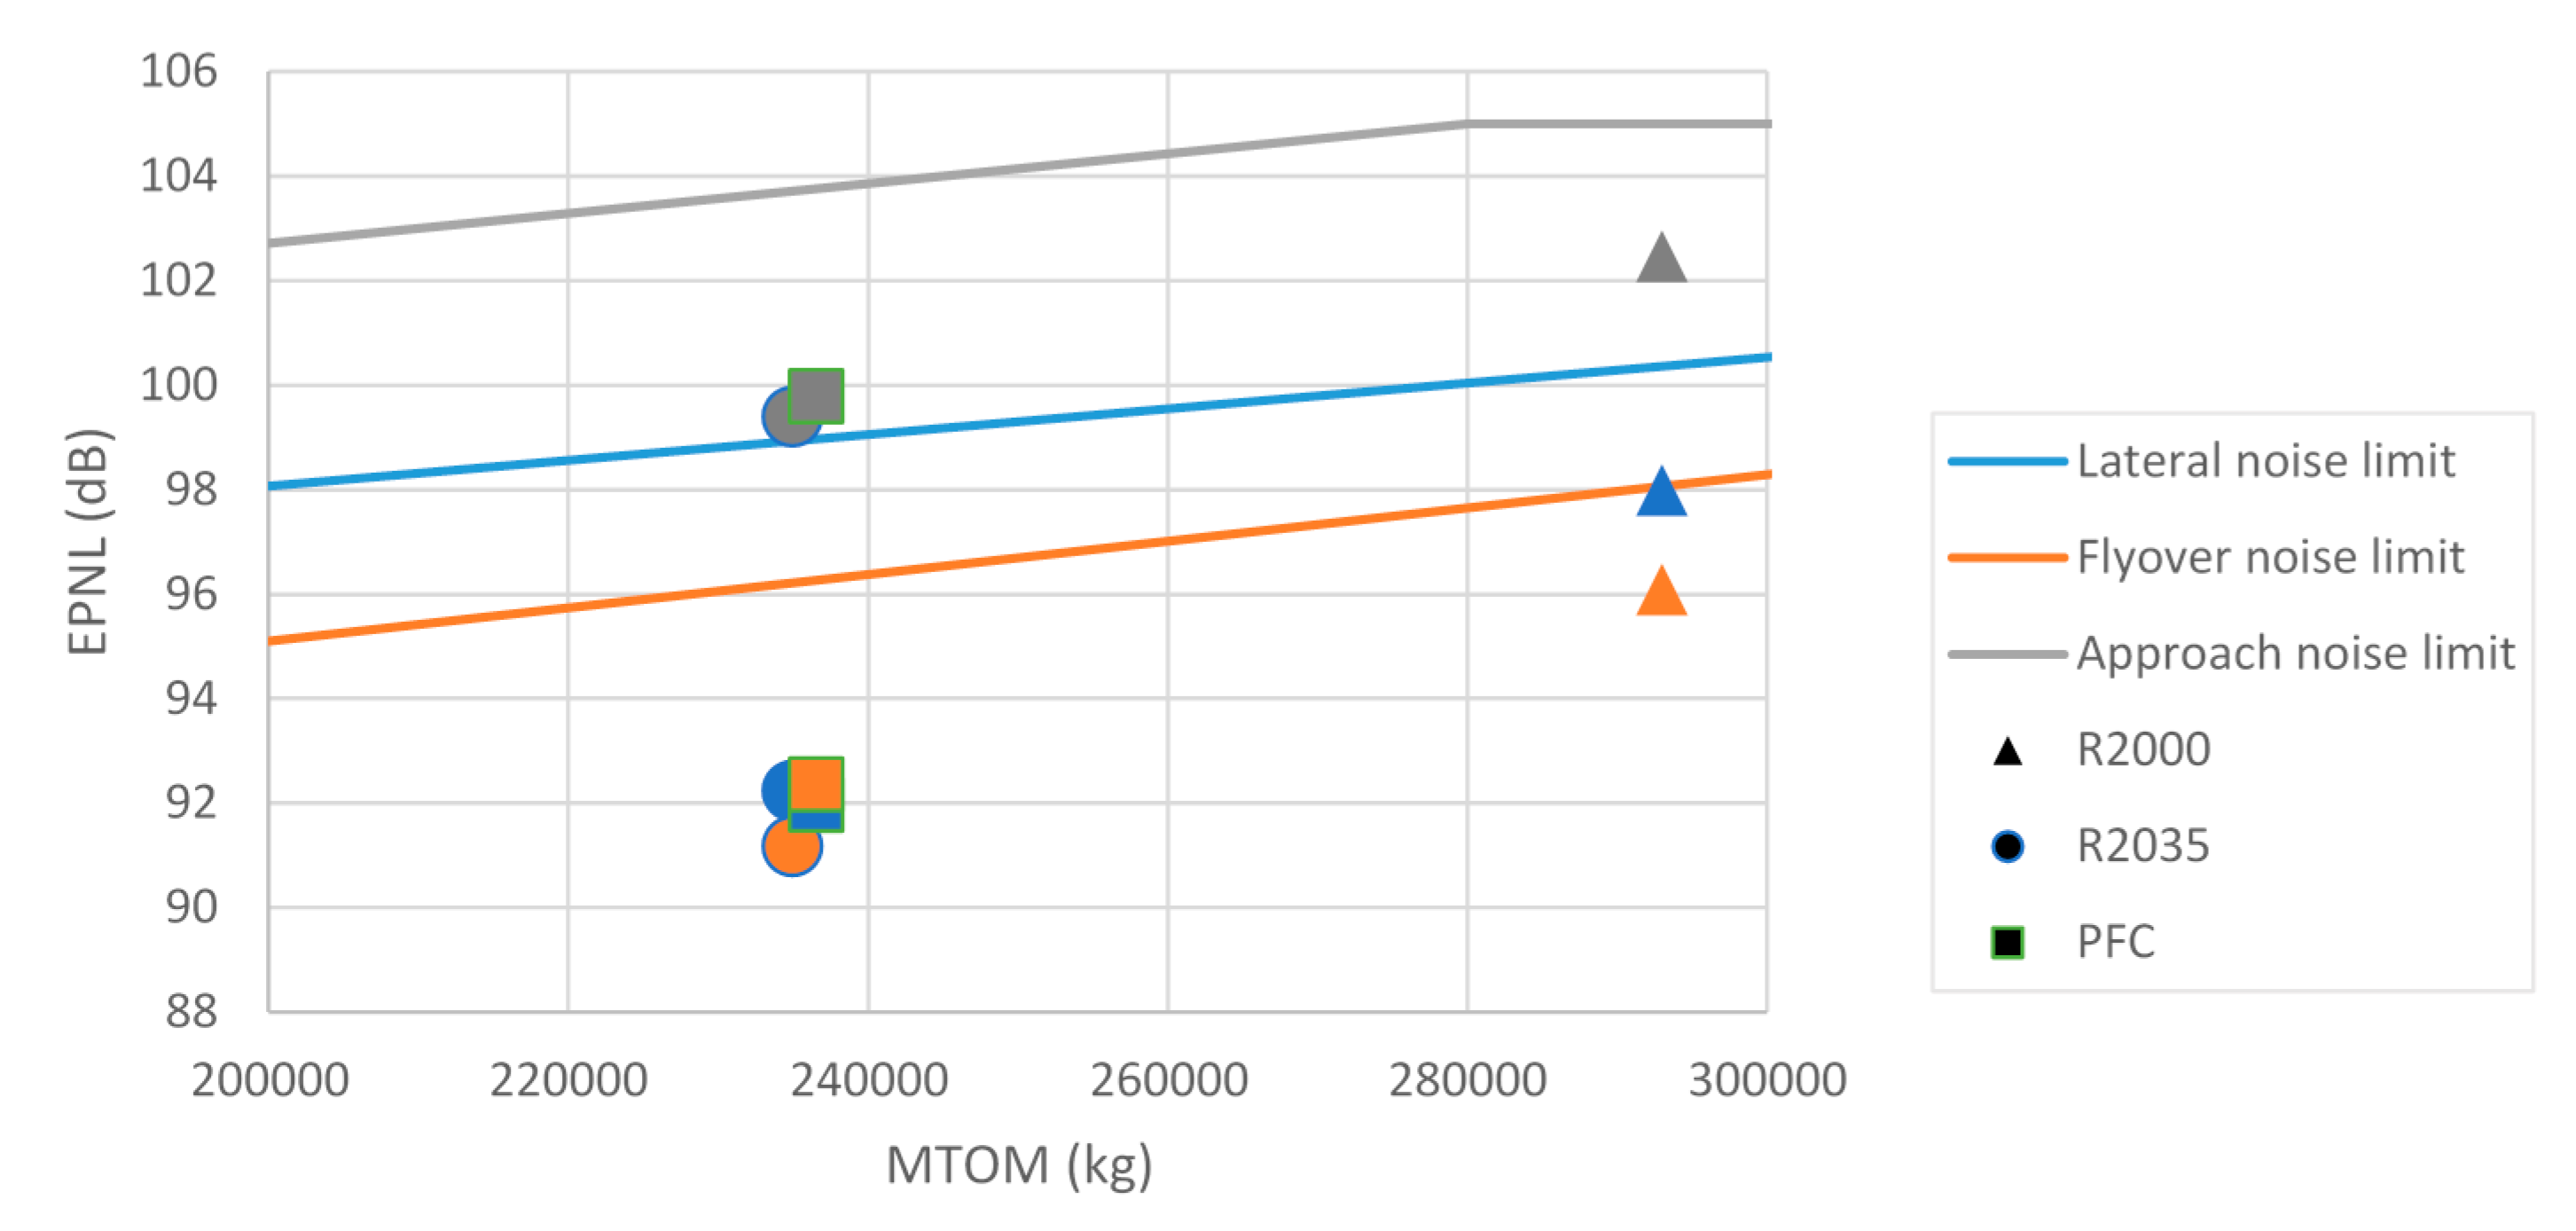
Figure 39.
Noise emissions assessments results for the CENTRELINE R2000, R2035 & PFC aircraft.
Figure 39.
Noise emissions assessments results for the CENTRELINE R2000, R2035 & PFC aircraft.
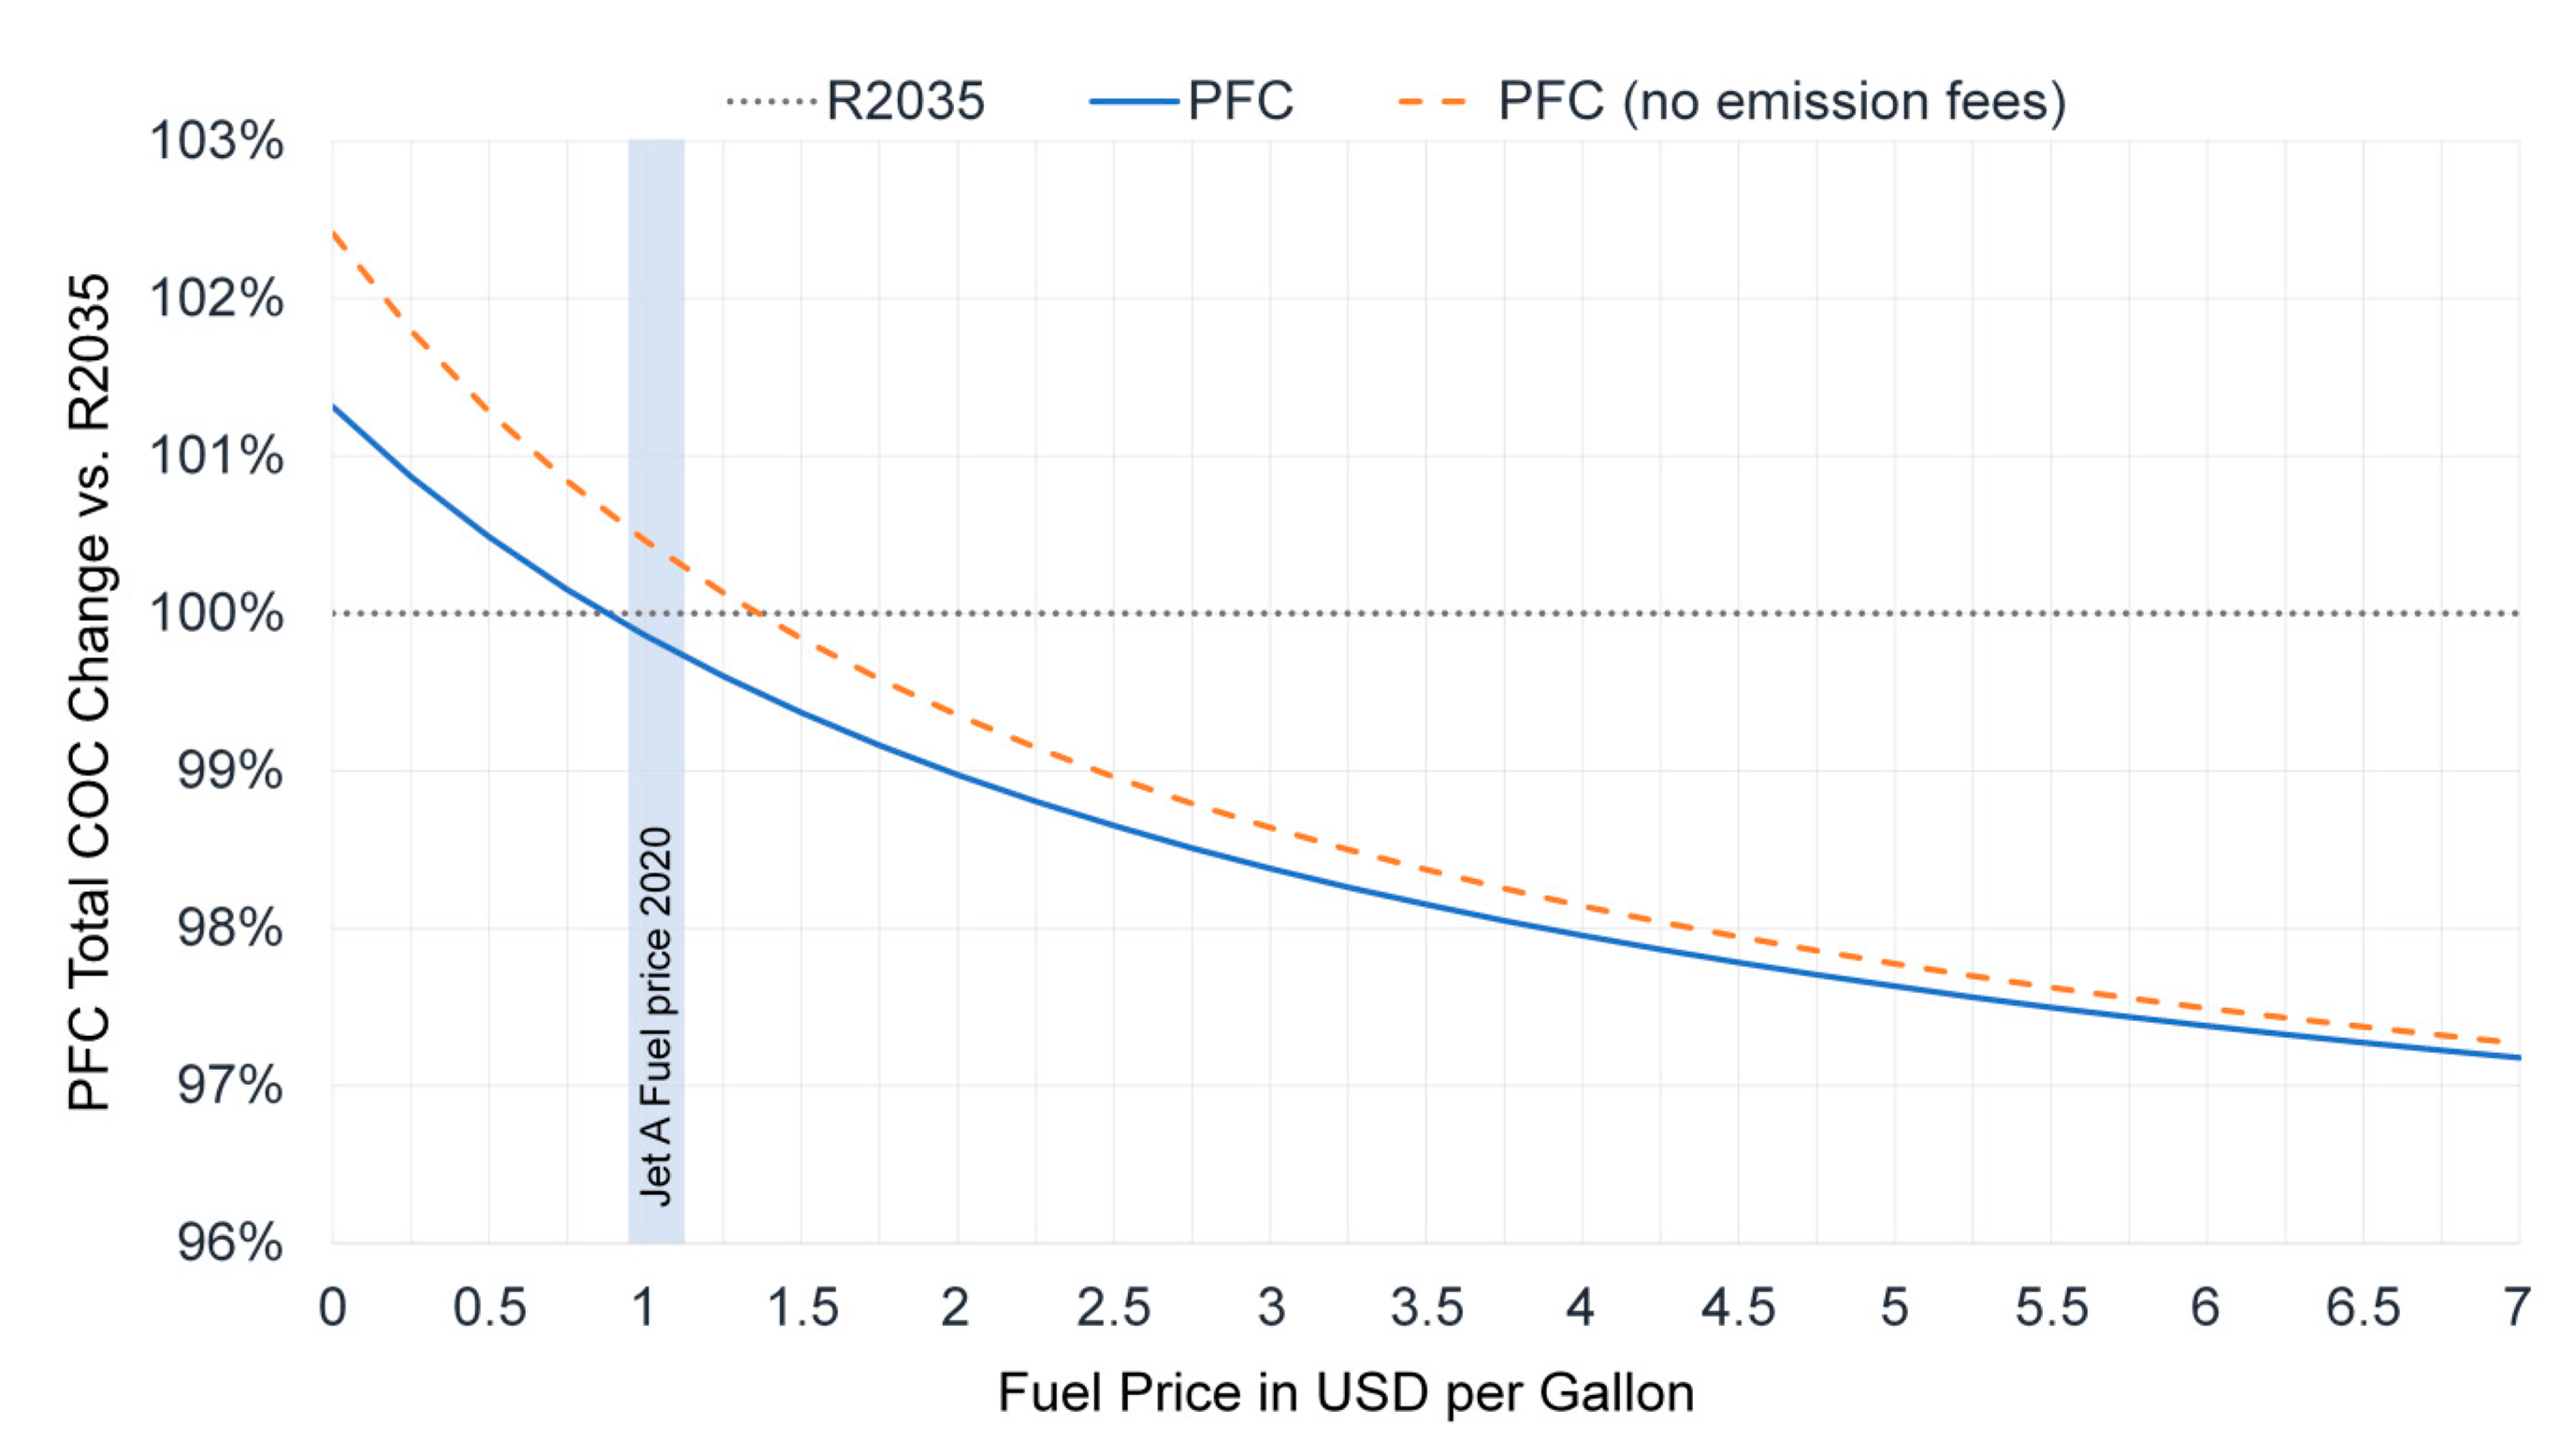
Figure 40.
Fuel price study of CENTRELINE PFC versus R2035 design mission COC (adapted from [
111]).
Figure 40.
Fuel price study of CENTRELINE PFC versus R2035 design mission COC (adapted from [
111]).
Table 1.
CENTRELINE top level aircraft requirements.
Table 1.
CENTRELINE top level aircraft requirements.
| Parameter | Value |
|---|
| Range and PAX | 6500 nmi, 340 * PAX in 2-class |
| TOFL (MTOW, SL, ISA) | ≤2600 m |
| Second climb segment | 340PAX, 100 kg per PAX, DEN, ISA + 20 K |
| Time-to-climb (1500 ft to ICA, ISA + 10 K) | ≤25 min |
| Initial cruise altitude (ISA + 10 K) | ≥FL 330 |
| Design cruise Mach number | 0.82 |
| Maximum cruise altitude | FL410 |
| Approach speed (MLW, SL, ISA) | 140 KCAS |
Table 2.
Overview of the main aerodynamic performance parameters for three different case studies based on the Rev07 axisymmetric bare PFC design.
Table 2.
Overview of the main aerodynamic performance parameters for three different case studies based on the Rev07 axisymmetric bare PFC design.
| Parameter | Unit | Design Case 1 | Design Case 2 | Design Case 3 |
|---|
| kN | 33.17 | 35.52 | 36.84 |
| kN | 32.44 | 39.32 | 44.02 |
| kN | −0.73 | 3.80 | 7.18 |
| MW | 5.53 | 6.80 | 7.76 |
| - | −0.033 | 0.139 | 0.229 |
Table 3.
Aerodynamic design point parameters of CENTRELINE FF.
Table 3.
Aerodynamic design point parameters of CENTRELINE FF.
| Parameter | Unit | Value |
|---|
| Flight altitude | ft | 35,000 |
| Flight Mach number | - | 0.82 |
| Flow coefficient | - | 0.69 |
| Stage loading coefficient | - | 0.45 |
| Stage pressure ratio | - | 1.4 |
| Rotor inlet tip Mach number | - | 1.24 |
| Rotor inlet hub-to-tip-ratio | - | 0.51 |
| Running tip clearance (% span) | % | 0.2 |
| Number of rotor/stator blades | - | 20/43 |
Table 4.
Summary of results for actual FF flow path sizing (M0.82, FL350, ISA + 10K).
Table 4.
Summary of results for actual FF flow path sizing (M0.82, FL350, ISA + 10K).
| Parameter | Unit | Design Case 1 | Design Case 2 | Design Case 3 |
|---|
| Fan isentropic shaft power (PFF,Shaft) | MW | 5.530 | 6.800 | 7.760 |
| Fan pressure ratio (p13/p2) | - | 1.40 | 1.40 | 1.40 |
| Fan mass flow rate (W2) | kg/s | 212.6 | 261.4 | 298.3 |
| Freestream total pressure recovery ratio (p2/p0) | - | 0.831 | 0.841 | 0.848 |
| Nozzle pressure ratio (p18/ps,amb) | - | 1.795 | 1.817 | 1.832 |
| Gross thrust | kN | 62.59 | 77.70 | 89.23 |
| Fan rotor inlet tip diameter (DFF) | m | 2.349 | 2.585 | 2.745 |
| Hub/tip ratio at rotor inlet | - | 0.497 | 0.495 | 0.493 |
| Rotational speed | 1/min | 2730 | 2481 | 2336 |
| Bearing system inner diameter | [mm] | 338 | 367 | 389 |
| Cowling thickness at fan face | m | 0.208 | 0.224 | 0.230 |
| Cowling length | m | 2.531 | 2.776 | 2.935 |
Table 5.
FF component masses predicted for the CENTRELINE Rev 07 design cases.
Table 5.
FF component masses predicted for the CENTRELINE Rev 07 design cases.
| Mass Terms (kg) | Design Case 1 | Design Case 2 | Design Case 3 |
|---|
| Fan rotor blading | 136 | 183 | 221 |
| Rotating mass w/o blading | 306 | 411 | 490 |
| Stationary masses (OGV + fan casing) | 164 | 206 | 235 |
| Fan module total | 606 | 800 | 946 |
Table 6.
Fuselage fan integration structural load cases according to CS-25 (cf. [
76]).
Table 6.
Fuselage fan integration structural load cases according to CS-25 (cf. [
76]).
| Case Number | Case Description | Regulation Chapter |
|---|
| 1 | Emergency landing | CS 25.561 |
| 2 | Side load | CS 25.363 |
| 3 | Engine and APU loads | CS 25.361 |
| 4 | Gyroscopic loads | CS 25.331 |
| 5 | APU acceleration | CS 25.361 |
| 6 | APU gyroscopic loads | CS 25.371 |
Table 7.
Fuselage fan integration structural load cases based on CS-25 (cf. [
76]).
Table 7.
Fuselage fan integration structural load cases based on CS-25 (cf. [
76]).
| Case Number | Description of Loads |
|---|
| 1 | 1 g + cabin pressurization |
| 2 | −1 g manoeuvre + cabin pressurization |
| 3 | 2.5 g manoeuvre + cabin pressurization |
| 4 | 2.5 g manoeuvre |
| 5 | 1.33 times cabin pressurization (over pressurization) |
| 6 | 1 g + elevator deflection downward |
| 7 | 1 g + elevator deflection upward |
| 8 | Lateral gust + cabin pressurization |
| 9 | Lateral gust + cabin pressurization |
Table 8.
Overview of fuselage and FF integration structural weight results.
Table 8.
Overview of fuselage and FF integration structural weight results.
| Component | R2035 | PFC (Rev07 Case 1) | PFC (Rev07 Case 2) | PFC (Rev07 Case 3) |
|---|
| Aft-fuselage integration (kg) | n/a | 490 | 646 | 775 |
| Main fuselage (kg) | 22,286 | 22,742 | 22,889 | 23,027 |
Table 9.
Suitable DC link voltages including de-rating (Source: [
81]).
Table 9.
Suitable DC link voltages including de-rating (Source: [
81]).
| Voltage Rating (V) | Two-Level Converter | Three-Level Converter | Five-Level Converter |
|---|
| 6500 | 3575 | 7150 | 14,300 |
| 3300 | 1815 | 3630 | 7260 |
| 1700 | 935 | 1870 | 3740 |
| 1200 | 660 | 1320 | 2640 |
| 900 | 495 | 990 | 1980 |
Table 10.
Component mass breakdown for the turbo-electric power train (Sources: [
82,
83]).
Table 10.
Component mass breakdown for the turbo-electric power train (Sources: [
82,
83]).
| Component | Unit | Engine Generator | Fuselage Fan Motor |
|---|
| Converter | kg | 152 | 182 |
| Converter cooling system | kg | 71 | 80 |
| AC cables (5 m) | kg | 30 | 100 |
| Electric machine | kg | 434 | 905 |
| Electric machine cooling system | kg | 165 | 280 |
| Total mass | kg | 852 | 1475 |
Table 11.
Component efficiencies of the turbo-electric power train in cruise (Source: [
84]).
Table 11.
Component efficiencies of the turbo-electric power train in cruise (Source: [
84]).
| Component | Unit | Value |
|---|
| Generator | % | 96.5 |
| Rectifier | % | 98.5 |
| Inverter | % | 99.0 |
| Motor | % | 96.5 |
| Total system efficiency | % | 90.8 |
Table 12.
Overview of specific component sizing laws for the R2035 and PFC aircraft families.
Table 12.
Overview of specific component sizing laws for the R2035 and PFC aircraft families.
| Component | Characterization of Key Sizing Conditions |
|---|
| Wing | Wing span: Variable, with fixed aspect ratio AR = 12.0. Wing loading: Scaled to meet required landing field length. High-lift: CL,max scaled to meet approach speed requirements.
|
| Empennage | |
| Fuselage | Sizing: Design payload in 2-class, nine-abreast seating arrangement in economy class (6.09 m diameter). Family design via common barrel sections. Family members share fuselage nose and tail (incl. FF in PFC case).
|
| Landing gear | |
| Main power plants | |
| Fuselage fan * | |
| Turbo-electric power train * | |
Table 13.
Identified hazardous and catastrophic aircraft level failure conditions specific to the CENTRELINE PFC aircraft.
Table 13.
Identified hazardous and catastrophic aircraft level failure conditions specific to the CENTRELINE PFC aircraft.
| ID | Failure Condition | Phase | Severity |
|---|
| 2.1.2.a | Unannounced partial loss of ability to provide thrust | Take-off | Hazardous |
| 2.1.3.a | Complete loss of ability to provide thrust | Take-off | Catastrophic |
| 2.1.4.a | Unforeseen vibration frequencies and/or amplitudes | Take-off | Hazardous |
| 2.1.5.a | Ignition of fire in the electric components of the FF | Take-off | Hazardous |
| 2.1.6.a | Ingestion of foreign object or ice in the FF | Take-off | Hazardous |
| 2.2.1.a | Announced loss of command authority for thrust control | Take-off | Hazardous |
| 2.2.2.a | Unannounced loss of command authority for thrust control | Take-off | Catastrophic |
| 2.2.3.a | Announced erroneous thrust control | Take-off | Hazardous |
| 2.2.4.a | Unannounced erroneous thrust control | Take-off | Catastrophic |
Table 14.
Assessment of the current TRL of the PFC critical technologies.
Table 14.
Assessment of the current TRL of the PFC critical technologies.
| Aspect | TRL | Justification |
|---|
| Overall vehicle aerodynamic design for fuselage BLI & wake-filling | 3–4 | The CENTRELINE PFC aircraft configuration was investigated in a laboratory environment (low-speed wind tunnel) at relevant flow incidence angles [48]. The low-speed scale-model experimental results were extrapolated to full speed and scale based on extensive CFD numerical analyses [58]. |
| FF aerodynamic design and performance | 3–4 | The CENTELINE FF was 3D numerically designed and tested in a laboratory environment (low-speed fan rig) at relevant operating conditions [106]. |
| Aero-structural integration of FF propulsive device | 3 | Numerical simulation of CS-25 load cases were executed, The primary structures were sufficiently conservative designed and analyzed with FEM using the certification relevant load cases [80]. A partial SAP was conducted and a sufficiently conservative design was derived. |
| Turbo-electric power transmission system | 3 | The architectural definition, component design the thermal management specifications for the overall transmission were performed system under consideration of realistic system redundancy requirements and failure modes [81]. |
| FF electric drive | 3 | Advanced numerical methods have been used for the pre-design of the electric machines in the drive train. The electro-magnetic and structural design of the electric machines was conducted in compliance with the geometric, structural and thermal boundary conditions in the aft-fuselage environment. The applied technology has been validated by experiments outside of the CENTRELINE project [83,84]. |
| Electric generators | 3 | The electro-magnetic and structural design of the generator was conducted in compliance with the geometric, structural and thermal boundary conditions in the podded engine environment [82,89]. |
| Underwing-podded power plants | 3 | A sufficiently conservative design based on a comprehensive investigation of the impact of significant power offtakes on cycle and engine operating behavior was conducted [88]. |
| Overall aircraft design | 3 | A sufficiently conservative aircraft sizing with incorporation of detailed numerical aerodynamic and key electrical component data was executed. The baseline aircraft was integrated in an aircraft family designed by common industrial practices [69]. |
Table 15.
Key design characteristics of the PFC and R2035 baseline aircraft.
Table 15.
Key design characteristics of the PFC and R2035 baseline aircraft.
| Category | Parameter | Unit | PFC | R2035 | Delta (%) |
|---|
| General | PAX (2-class) | - | 340 | 340 | 0.00 |
| Design range a | nmi | 6500 | 6500 | 0.00 |
| MTOW/Sref | kg/m2 | 666 | 679 | −1.91 |
| SLST/MTOW | - | 0.32 | 0.33 | −3.03 |
| MLW/MTOW | - | 0.77 | 0.75 | 2.67 |
| OEW/MTOW | - | 0.55 | 0.53 | 3.77 |
| Design block CO2 | t | 196.6 | 206.2 | −4.66 |
| Wing | Reference area | m2 | 355.3 | 346.4 | 2.57 |
| Aspect ratio | - | 12.0 | 12.0 | 0.00 |
| Quarter chord sweep | ° | 29.7 | 29.7 | 0.00 |
| Span | m | 65.8 | 65.0 | 1.23 |
| Fuselage | Total length | m | 67.0 | 66.7 | 0.43 |
| Diameter (centre section) | m | 6.09 | 6.09 | 0.00 |
| Main power plants | Design net thrust b | kN | 54.6 | 59.8 | −8.70 |
| Design specific thrust b | m/s | 86.0 | 86.0 | 0.00 |
| OPR b | - | 61.0 | 61.0 | 0.00 |
| T4 b | K | 1780 | 1780 | 0.00 |
| Relative HPT cooling air | % | 20.0 | 20.0 | 0.00 |
| Fan tip diameter | m | 3.21 | 3.36 | −4.46 |
| Design bypass ratio b | - | 14.5 | 16.4 | −11.6 |
| SLS net thrust | kN | 376.6 | 343.6 | −8.76 |
| Mid-cruise net thrust c | kN | 35.5 | 46.7 | −24.0 |
| Mid-cruise TSFC c | g/kN/s | 17.4 | 14.0 | +24.3 |
| Mid-cruise total fuel flow c | kg/s | 1.24 | 1.31 | −5.52 |
| Main landing gear | Extended length | m | 5.70 | 4.70 | 21.3 |
| Turbo electric power train | Total efficiency (take-off) | - | 0.914 | n/a | n/a |
| Total efficiency (cruise) | - | 0.919 | n/a | n/a |
| Total specific power d | kW/kg | 2.10 | n/a | n/a |
| Electric motor sizing power (output) | MW | 10.0 | n/a | n/a |
Generator sizing power
(output per unit) | MW | 3.67 | n/a | n/a |
| Fuselage fan | Tip diameter | m | 2.26 | n/a | n/a |
| Rotor blade height | m | 0.57 | n/a | n/a |
| Design isentropic disc power b | MW | 5.00 | n/a | n/a |
| Design pressure ratio b | - | 1.40 | n/a | n/a |
| Max. take-off shaft power e | MW | 7.00 | n/a | n/a |
| Max. take-off pressure ratio e | - | 1.20 | n/a | n/a |
Table 16.
Mass breakdowns of the CENTRELINE R2000, R2035 and PFC baseline aircraft.
Table 16.
Mass breakdowns of the CENTRELINE R2000, R2035 and PFC baseline aircraft.
| Mass Term (kg) | R2000 | R2035 | PFC | PFC vs. R2035 (%) | PFC vs. R2000 (%) |
|---|
| Structure Total | 97,388 | 76,280 | 78,364 | 2.73 | −19.5 |
| Wing (incl. surface controls) | 46,770 | 37,075 | 37,484 | 1.10 | −19.9 |
| Fuselage | 27,854 | 22,286 | 22,683 | 1.78 | −18.6 |
| Horizontal stabilizer | 3144 | 1835 | 1757 | −4.25 | −44.1 |
| Vertical fin | 2540 | 1936 | 2402 | 24.1 | −5.43 |
| Undercarriage | 12,482 | 10,304 | 11,450 | 11.1 | −8.27 |
| Pylons | 4598 | 2844 | 2588 | −9.00 | −43.7 |
| Propulsion system | 23,167 | 18,637 | 21,253 | 14.0 | −8.26 |
| Main power plants | 23,167 | 18,637 | 17,509 | −6.05 | −24.4 |
| Bare engines | 16,217 | 12,232 | 11,742 | −4.01 | −27.6 |
| Underwing nacelles | 6950 | 6405 | 5767 | −9.96 | −17.0 |
| Fuselage fan propulsive device | n/a | n/a | 958 | n/a | n/a |
| Fan module | n/a | n/a | 427 | n/a | n/a |
| Nacelle and integration structure | n/a | n/a | 531 | n/a | n/a |
| Turbo-electric power train | n/a | n/a | 2787 | n/a | n/a |
| Main generators | n/a | n/a | 618 | n/a | n/a |
| Fuselage fan drive motor | n/a | n/a | 700 | n/a | n/a |
| Cabling | n/a | n/a | 586 | n/a | n/a |
| Power electronics | n/a | n/a | 434 | n/a | n/a |
| Cooling system | n/a | n/a | 449 | n/a | n/a |
| Aircraft systems | 10,151 | 11,803 | 11,802 | −0.01 | 16.3 |
| Operational items | 13,213 | 10,248 | 8354 | −18.5 | −36.8 |
| Furnishing | 8154 | 8354 | 10,248 | 22.7 | 25.7 |
| Operating empty weight | 152,072 | 125,322 | 130,021 | 3.75 | −14.0 |
| Design payload | 32,300 | 34,000 | 34,000 | 0.00 | 5.26 |
| Design reserves fuel | 10,986 | 10,570 | 10,416 | −1.46 | −5.19 |
| Design landing weight | 195,358 | 169,892 | 174,438 | 2.68 | −10.7 |
| Design trip fuel | 97,829 | 65,192 | 62,158 | −4.65 | −36.5 |
| Maximum take-off weight | 293,187 | 235,084 | 236,596 | 0.64 | −19.3 |
| Design block fuel | 97,951 | 65,453 | 62,403 | −4.66 | −36.3 |
Table 17.
Individual steps for incremental analysis of effects on PFC fuel efficiency.
Table 17.
Individual steps for incremental analysis of effects on PFC fuel efficiency.
| Step | Characterization of Key Sizing Conditions |
|---|
| 1 | Baseline—Idealized PFC design without cascade effects:FF cruise polytropic efficiency identical to underwing podded main fans Idealised efficiency of FF power train (losses identical to LP spool of main engines) Tail configuration identical to reference (conventional tail) FF power train specific power identical to main engines Adoption of pure optimum 2D-Aero heuristic for bare PFC aerodynamics No aircraft design scaling considered
|
| 2 | Baseline + Aircraft scaling switched on (sizing cascade effects enabled) |
| 3 | Step 2 + Turbo-electric power train losses adopted from CENTRELINE turbo-electric PFC aircraft design (cf. Table 14) |
| 4 | Step 3 + Turbo-electric power train specific weight adopted from CENTRELINE turbo-electric PFC aircraft design (cf. Table 14) |
| 5 | Step 4 + PFC-specific component weight implications—inclusion of fuselage structural mass penalty |
| 6 | Step 5 + PFC-specific component weight implications—inclusion of landing gear mass penalty |
| 7 | Step 6 + Update of empennage configuration from conventional to T-tail arrangement |
| 8 | Step 7 + Inclusion of FF efficiency penalty due to PFC-specific 3D inflow distortion (cf. Table 14). |
| 9 | Step 8 + Preliminary estimate of PFC 3D aerodynamic design implications |
Table 18.
PFC assessment results for more advanced power train technology.
Table 18.
PFC assessment results for more advanced power train technology.
| Parameter | Unit | Baseline Turbo-Electric | HTS Turbo-Electric | Mechanical |
|---|
| ηPT,FF | - | 0.919 * | 0.96 | 0.98 |
| SPPT,FF | kW/kg | 2.1 * | 5.0 | 10 |
| Fuel benefit (Step 8) | % | 4.7 | 7.2 | 8.4 |
| Fuel benefit (Step 9 **) | % | 3.2 | 5.2 | 6.2 |

 ,
, 


