1. Introduction
When answering a request for proposal, engine manufacturers use various modeling tools to predict if an engine design will meet the aircraft’s top-level requirements. The design should be fuel-efficient, have stable operation over the entire flight envelope, comply with environmental regulations, have acceptable production and maintenance costs and integrate seamlessly with the aircraft. Fulfilling these objectives requires a multi-objective optimization procedure in which reliable and robust predictive models of many engineering disciplines are coupled in an iterative calculation. This entails the existence of the relevant models and the corresponding integration framework with appropriate simulation functionalities.
Tools with such modeling and simulation capabilities are available in the industry; for example, MTU’s MOPEDS (MOdular Performance and Engine Design System) [
1] and Pratt & Whitney’s PMDO (Preliminary Multi-Disciplinary Design Optimization) [
2]. Tools have also been developed by the research community for the multi-disciplinary preliminary design assessment of future propulsion systems. These include TERA (Techno-Economic Environmental Risk Analysis) [
3], GTlab (Gas Turbine Laboratory) [
4] and EDS (Environmental Design Space) [
5]. However, these, as well as other [
6,
7,
8,
9] industrial and research tools, are of a proprietary nature. Most of them typically combine models and processes from disparate sources, which may result in physical inconsistencies (e.g., due to differences in working fluid properties, or thermodynamic routines), may affect numerical robustness (variety of programming languages, numerical solvers and tolerance depth in nested iterations), while integration is less transparent (models available in executable or dll format) and requires an expert user to setup the calculation. Furthermore, some of them may lack important aspects of the preliminary design process at the engine component (encompassing any new technologies), system or discipline level, without having the required flexibility and modularity for proper implementation and integration. Finally, some tools are too complex for this phase of engine design at the modeling (higher fidelity codes) and/or calculation (nested iterations between disciplines) level, which hinders speed of execution without necessarily improving calculation accuracy.
In contrast to the aforementioned tools, a framework is proposed in this paper that ensures code maintainability, consistent physical modeling and transparent integration of modules by using the same software environment for both the development and simulation tasks. The framework is fully configurable and extendable at both the modeling and calculation levels, allowing the development of varying fidelity, multi-disciplinary, multi-system models and their integration in any user-defined simulation flow. Novel aspects of the framework include the single-step cycle performance and aerodynamic multi-point design module, which, compared to other tools, avoids iterations and data exchange between the two disciplines and reduces computational speed. Furthermore, the integration of control-system design and engine transient performance assessment as part of a multi-disciplinary preliminary design calculation has not been reported before in the public literature. Recent studies on novel propulsion systems have demonstrated the importance of considering transient performance as early as possible in the preliminary engine design phase in order to assess response and operability, but did not evaluate it as part of an overall cycle optimization at the aircraft-mission level [
10] and with consideration of the design of the associated control system [
11].
The Propulsion Object Oriented Simulation Software (PROOSIS) [
12] was used as the development and integration platform in our study. PROOSIS was initially developed within the integrated EU project VIVACE [
13] by a consortium of corporate companies, research institutes and universities. The aim was to build a standard software tool fulfilling industrial requirements in the area of gas-turbine performance. Further capabilities requested by the tool’s industrial and academic users are gradually incorporated by the developers, making PROOSIS a state-of-the-art platform for multi-disciplinary, multi-fidelity and multi-system modeling and simulation of gas turbines [
14,
15,
16,
17].
The implementation of the framework was demonstrated through the case of an ultra-high bypass ratio geared turbofan engine (UBGF) with a variable-area fan nozzle (VAN), for a single-aisle aircraft application with entry-into-service (EIS) in 2030. The fuel burn of an optimized engine design was assessed against contemporary (EIS-2016) and previous-generation engines (EIS-2000) that currently power the majority of aircraft worldwide. The importance of integrating transient analysis in preliminary design to assess performance and operability is highlighted through control and dynamics system studies. The application example offers new insights into the block-fuel optimization of geared turbofans for different EIS compared to previous studies (e.g., [
18,
19,
20]), none of which contain all the elements of the analysis of the present paper. Such elements are the simultaneous engine design at the most important flight envelope operating points (top-of-climb, hot day rolling take-off and cruise), the use of turbomachinery component design efficiencies based on the integrated thermodynamic cycle and aerodynamic design calculations, the introduction and scheduling of a variable-area nozzle and the relevant controller, the sensitivity of the engine design optimization on mission range and, of course, the subsequent transient assessment.
Section 2 below gives an overview of the framework, references the details of all modules and briefly describes some of them.
Section 3 presents the setup of the application example and the results obtained from the mission-level optimization and transient-performance assessments, demonstrating the key capabilities introduced.
2. Methodology
2.1. Overall Approach
In the context of this work, a computational framework is proposed, encompassing modules that enable engine design studies at the aircraft-mission level and simultaneous assessment of transient engine performance and operability. All the development is carried out in PROOSIS. The tool uses the non-standard, non-causal object-oriented EL language (C++ like) for both modeling and simulations tasks. At the modeling level, EL describes, through differential-algebraic equations, the physics of any real-world component. A standard gas turbine engine component library TURBO [
21] has been extended to combine performance calculations with turbomachinery-component aerodynamic design, flowpath generation and weight-estimation functionalities [
22,
23]. Nonconventional components are also created to enable advanced propulsion-concept modeling such as the variable-area convergent nozzle, the variable-pitch fan [
22], the boundary-layer-ingesting propulsor [
24], the open-rotor propeller [
25], contra-rotating turbomachinery components [
26], etc. These components can then be combined graphically through their respective icons to build a schematic diagram of an engine concept (geared turbofan, open rotor, turboelectric, etc.). Engine and aircraft subsystems can also be integrated around the engine model, e.g., the fuel and oil system, control system, electrical power system, environmental control system, heat recovery systems, thermal management system, active control system [
27], etc., creating a multi-system model.
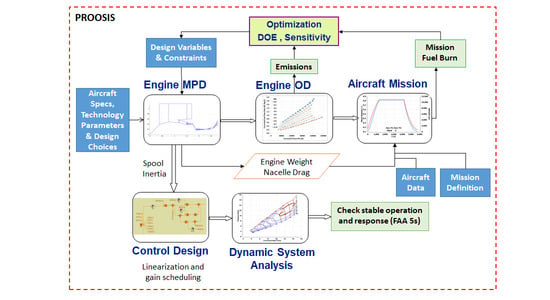
Figure 1 shows the schematic diagram for the case of a geared turbofan with a variable-area bypass nozzle connected to a basic control system through sensors and actuators. This will be discussed in more detail in the Application Example section.
At the simulation level, EL is used to define and execute different calculations for the corresponding engine mathematical model. These calculations can range from single steady-state simulations to multi-point design (MPD) ones in which multi-disciplinary requirements and constraints must be met simultaneously at different operating points in the flight envelope [
22]. The proposed framework leverages the PROOSIS Functional Mock-Up Interface (FMI) for co-simulation capability, to combine models and processes in a single simulation in order to enable complex calculations of novel engine concepts involving different disciplines and types of analyses in multi-parametric and multi-objective studies. FMI [
28] is a C standard to instantiate and simulate one or more models. In this context, a model includes both the mathematical model created by connecting different components together (i.e., conventional engine performance mathematical model) and any simulation defined on this model (i.e., engine multi-point design).
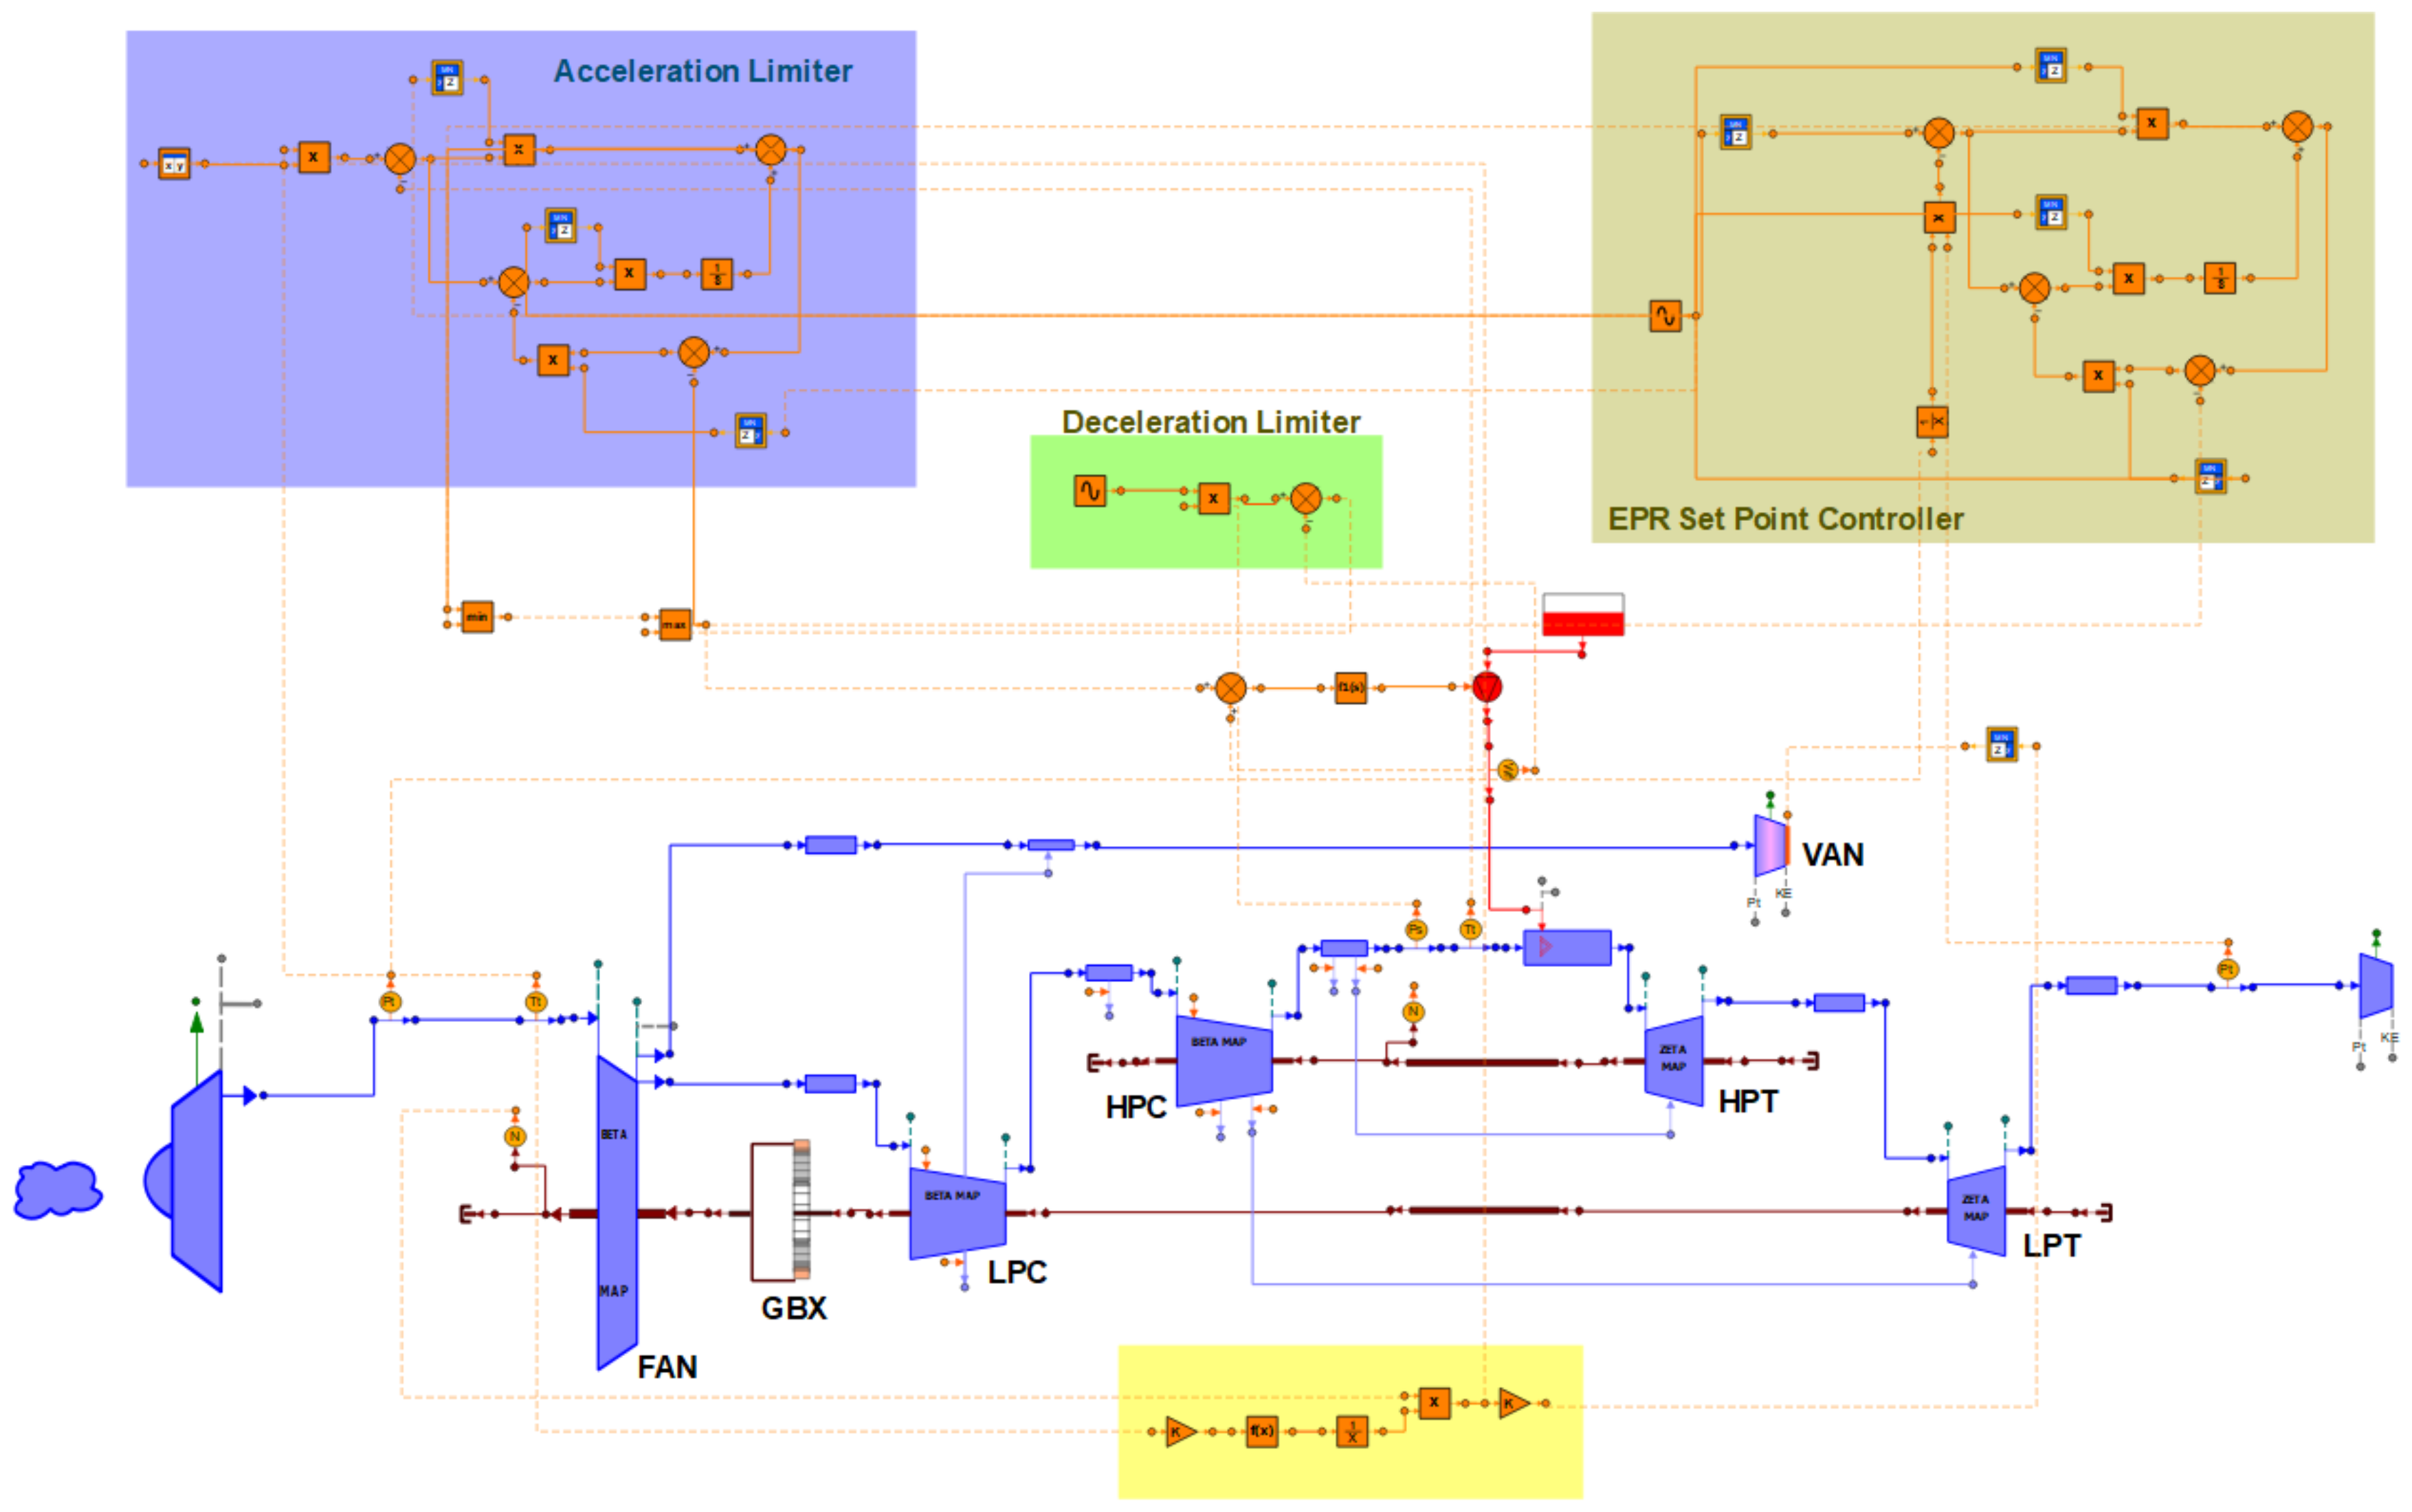
PROOSIS can both generate and import functional mock-up units (FMUs). In this way, a master simulation can be assembled by combining modules (thermodynamic, aerodynamic and mechanical design; aircraft design and performance; engine sub-system design; dynamic analysis; noise; lifing; economics, etc.) for a specific engine configuration as required. The modules are arranged according to the simulation scope. Each module is self-contained, including the solution of its own mathematical model, and communication between modules is accomplished through pre-defined input/output files (XML or ASCII). An explicit scheme is implemented with no iterations between individual modules. Each module produces a flag to provide information on errors during execution. The error flag is based on international standards and contains its unique code number, severity, category, source and text message. The error severity determines how the simulation will proceed. Different types of analyses can be defined on such a simulation workflow such as sensitivity, design of experiment (DoE), Monte Carlo and optimization. An example of a simulation workflow is depicted in
Figure 2. This consists of some of the modules currently available in the framework, and is the workflow used in the Application Example section. The type of analysis (e.g., optimization, DoE) is specified at the top of the simulation. It controls the design variables and any relevant constraints, which can be of a thermodynamic, aerodynamic or structural nature. Fan pressure ratio (FPR), bypass ratio (BPR) and overall pressure ratio (OPR) at top-of-climb (ToC) are examples of design variables, while compressor discharge temperature (CDT) and turbine entry temperature (TET) at rolling take-off (RTO) conditions, compressor last-stage blade height (LSBH), compressor tip relative Mach number and blade tip or hub speeds are examples of constraint variables. This information feeds the engine-design module that starts the simulation.
2.2. Engine Design and Off-Design Modules
The design variables are input to the engine design FMU (Engine MPD in
Figure 2), which performs a multi-disciplinary, multi-point design calculation [
22]. The user can specify, at different operating conditions (e.g., ToC, RTO), the top-level aircraft requirements (e.g., thrust, bleed and power extraction), reference values of design and technology parameters (e.g., turbine blade metal temperatures, AN
2 structural parameter), component attributes (e.g., design pressure drop in ducts and burner, mechanical efficiency of shafts), aerodynamic design options of turbomachinery components (e.g., flowpath shape and stage-loading options), design Mach number (MN) values at the inlet and outlet of components, etc., through an external file. The mathematical model consists of a global Newton–Raphson solver controlling the vector of independent variables (global design variables and local algebraic variables for each operating point) that will satisfy closure equations (residues vector), which is obtained from solving the algebraic problem at each operating point for the corresponding extended mathematical formulation (model internal plus local closure equations for each point). The local closure equations can be equalities or groups of inequalities. Inequalities deal with the constraints of the problem. The engine-design calculation executes in less than 2 s using a contemporary desktop PC and produces cycle performance, aerodynamic and mechanical design results at the specified operating points, as well as component and engine weights [
22] and the nacelle profile drag coefficient [
29]. All the engine model design variables (e.g., map scaling factors, component areas, duct and burner design pressure drop and corrected mass flows) are used to setup the corresponding off-design model that generates a surrogate engine performance model. The same off-design model is also used for control design and transient analysis. If the design calculation fails to converge, then the other tasks of the simulation chain are not executed, and the calculation proceeds with a new set of design variables.
The Engine OD FMU (
Figure 2) uses the engine-design information and runs an off-design steady-state analysis for operating points that cover the entire flight envelope. The mathematical formulation for a turbofan engine configuration (including the geared one) requires only one handle variable, e.g., thrust, and the initialization of the algebraic (turbomachinery component auxiliary map parameters, BPR and inlet flow rate) and dynamic (fan and high-spool-speed rotational speeds) variables of the model. At the simulation level, the throttle ratio parameter (TR = TET/TET
SLS) is used as a control variable. The variation of engine thrust FN with flight conditions (altitude ALT and MN) is determined using the algebraic equations presented in [
30] that express thrust lapse α (= FN/FN
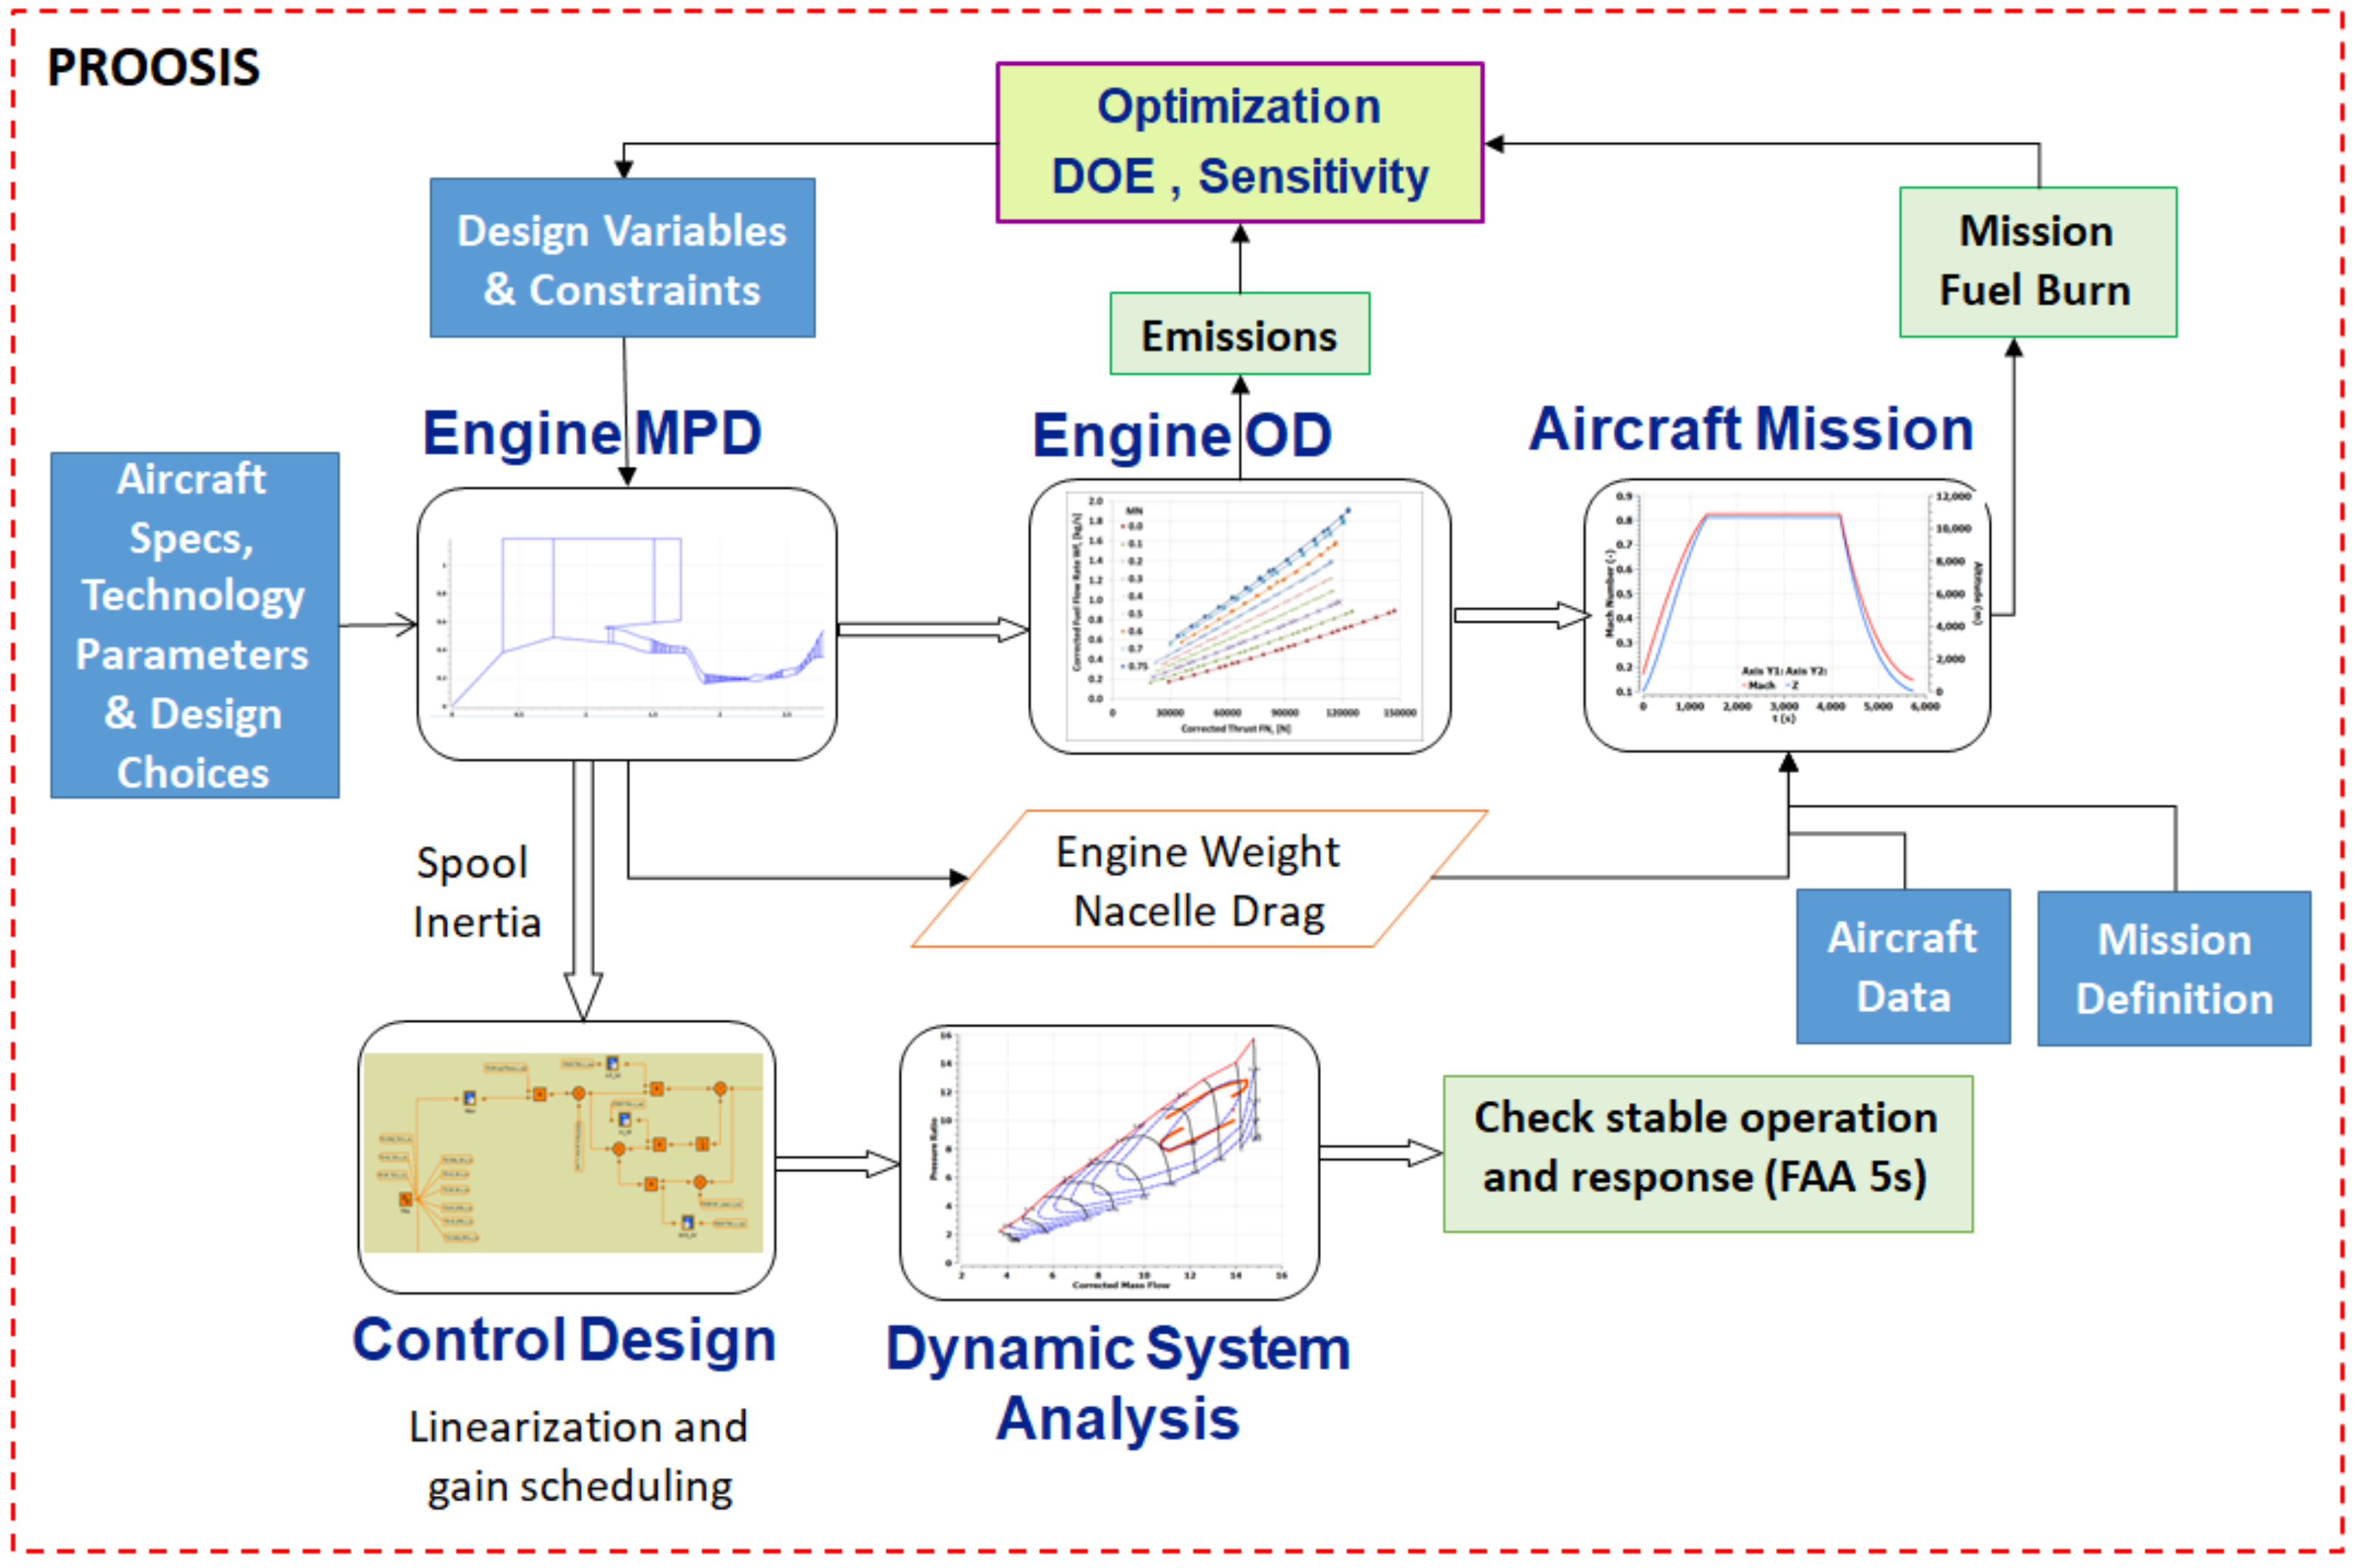
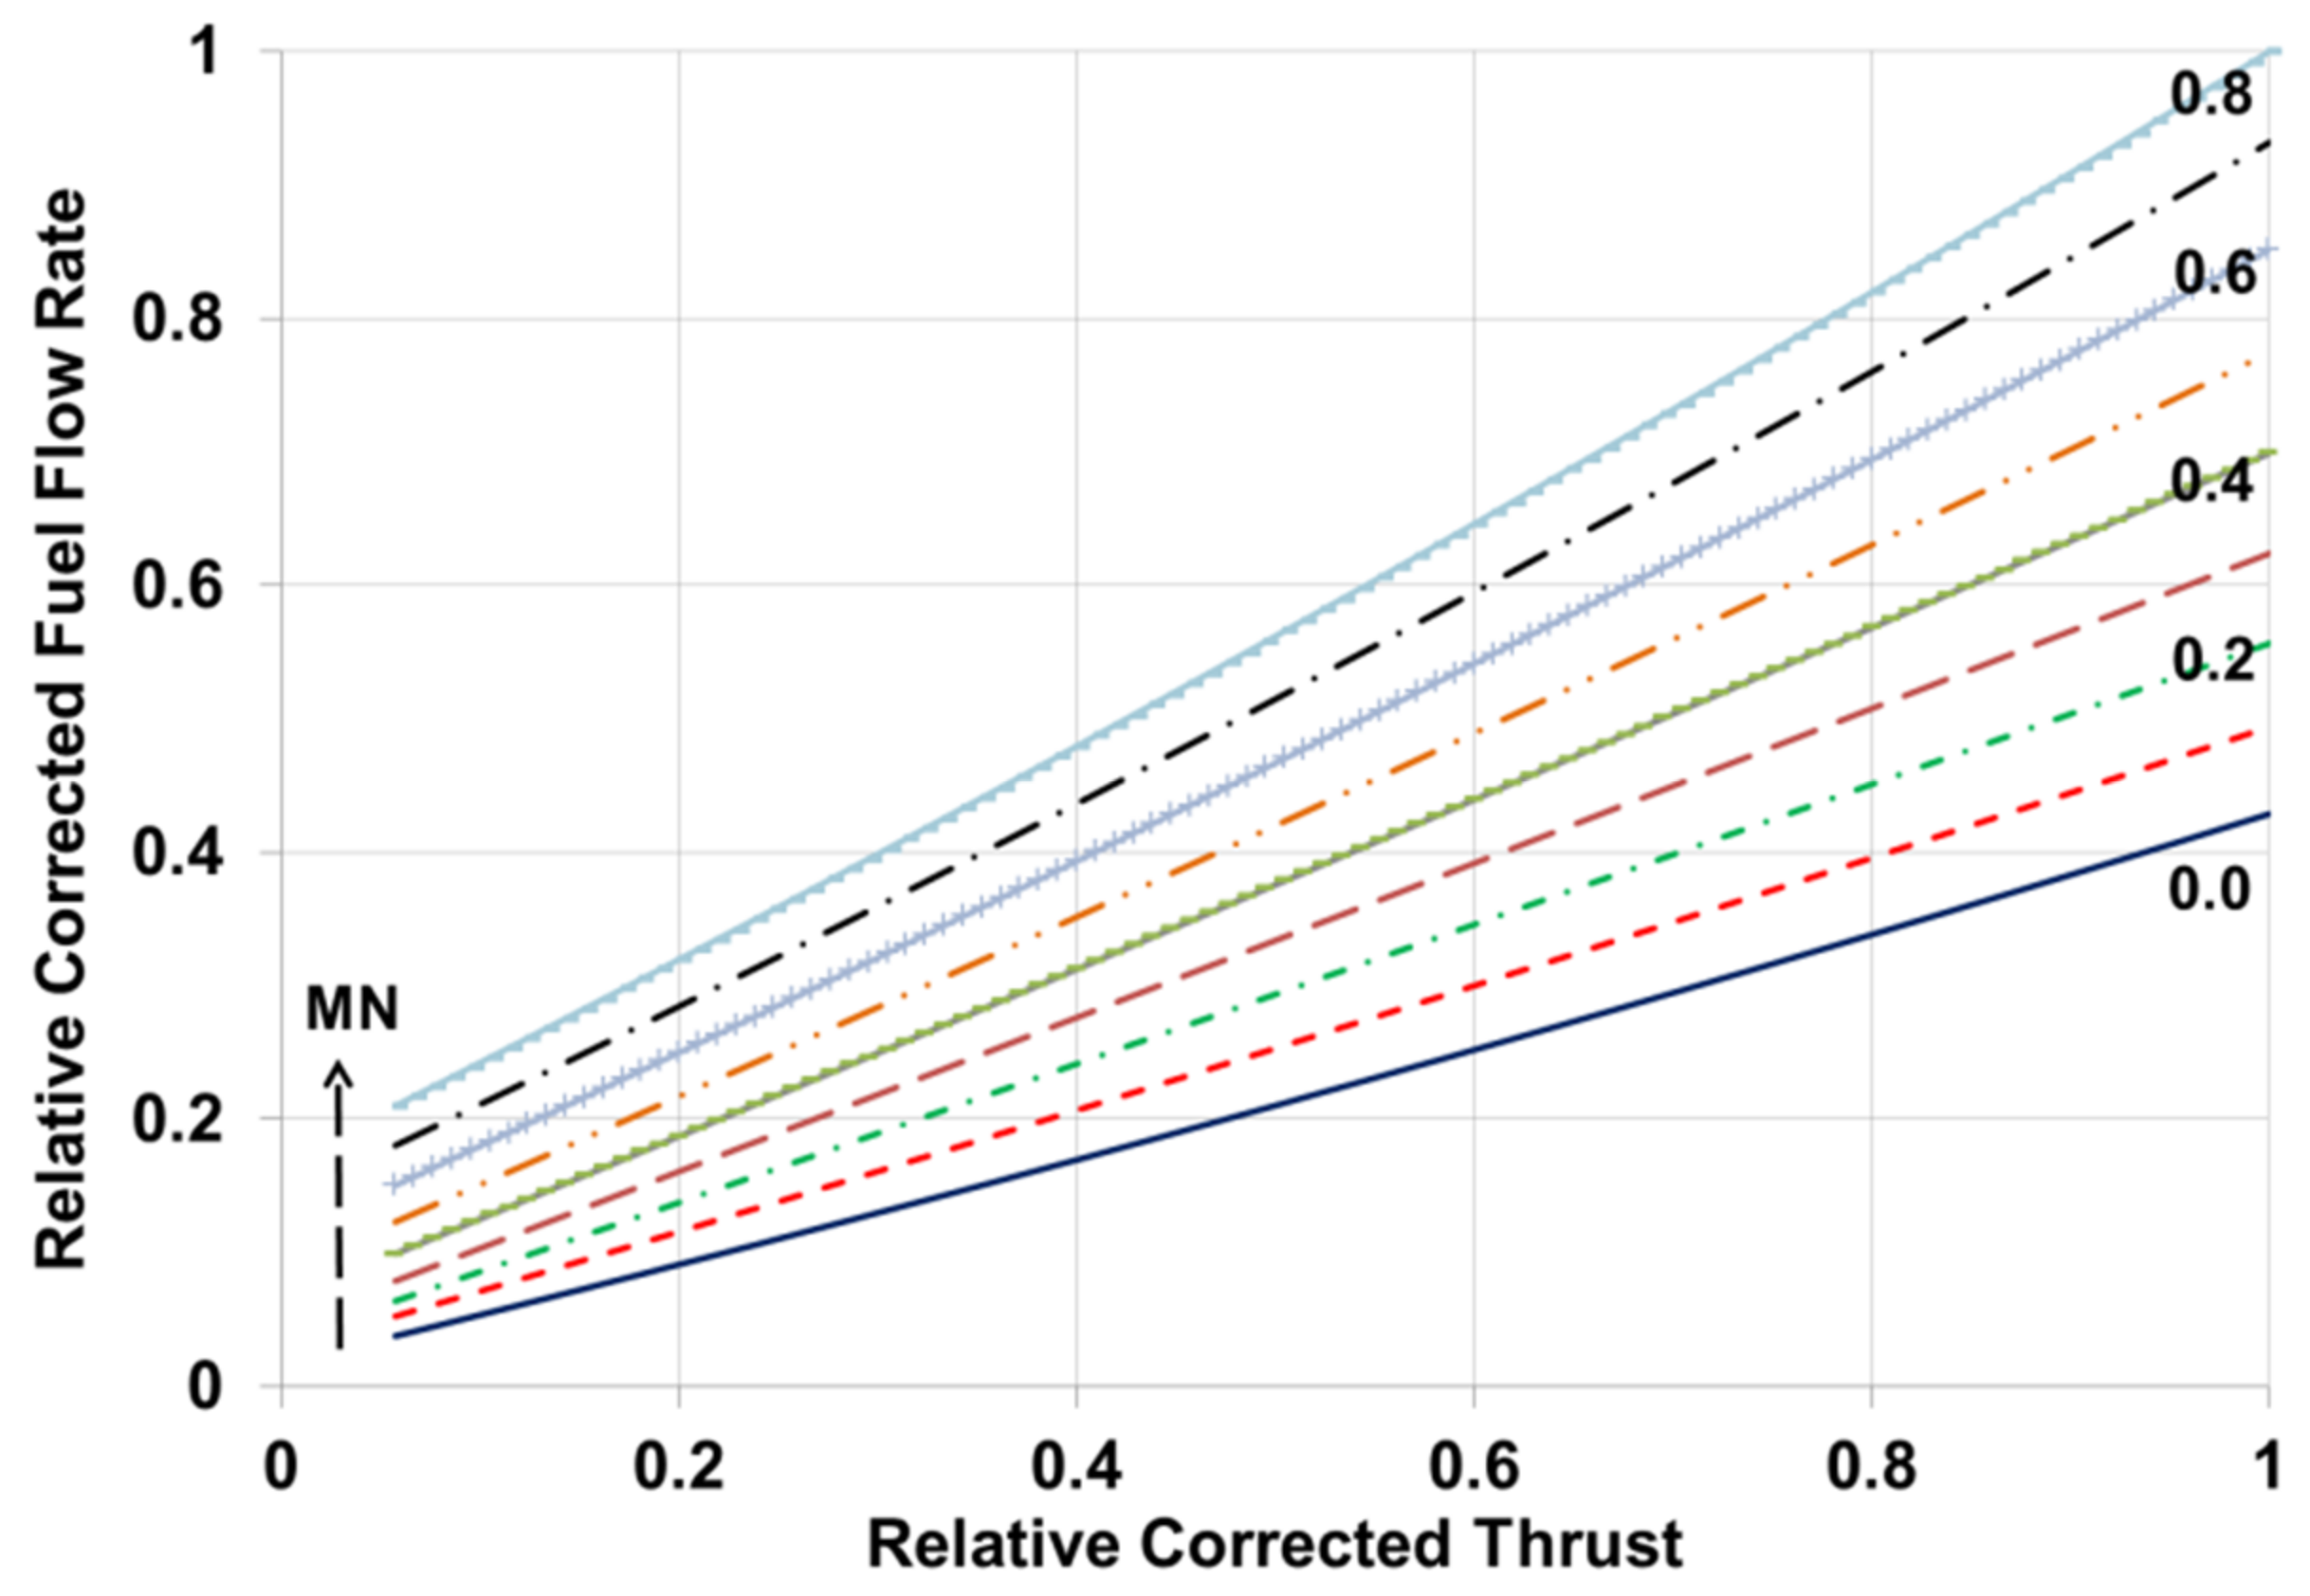
SLS) in terms of non-dimensional temperature θ (= Tt/288.15), non-dimensional pressure δ (= Pt/101325) and TR. A nested-loop approach from TR to ALT to MN is followed, always starting from the converged high-power setting of TR = 1 at sea-level static (SLS) conditions (ALT = 0, MN = 0). The results (engine performance table) are presented in the form of a corrected fuel flow rate Wf
c (= Wf/√ϑ/δ) against the corrected net thrust FN
c (= FN/δ) and MN. The use of parameters corrected to standard day conditions eliminates the effects of altitude (ALT) and ambient conditions. The influence of MN cannot be eliminated. A graphical example of such a performance matrix in relativized form is presented in
Figure 3, for the case of a current technology engine (similar to Pratt & Whitney’s PW1100G). The time required to generate this performance matrix depends on the range and discretization of TR, ALT and MN, with an average time for a single-point run being less than 0.03 s.
During the engine off-design simulation, landing and take-off (LTO) NOx emissions are also estimated as described by [
31] using a correlation from NASA’s Ultra-Efficient Engine Technology Project program:
The correlation’s constant A0 is estimated from the cycle data (CDT, compressor discharge pressure (CDP) and fuel-to-air ratio (FAR)) and the EI
NOx values at ToC, Cruise, RTO and SLS conditions presented in [
32], for an advanced technology geared turbofan engine with an EIS in the 2030 to 2040 timeframe. Assuming that 20% of combustor inlet air is used for liner cooling (= f), an average value of A0 ≈ 150 is obtained.
2.3. Aircraft Mission Analysis Module
The aircraft mission analysis FMU is based on the Commercial Aircraft Mission Analysis Computational Model (CAMACM). The tool was originally developed by a group of authors in 2006 [
33], with the latest version [
34] written in PROOSIS EL, in which aircraft performance is a component, and the mission analysis is carried out at the simulation level. Fuel burn is calculated for a specific point of flight from the engine performance table generated by the engine OD FMU module at the corresponding operating condition and thrust. Thrust is evaluated from the aircraft dynamics at each point, determined from its aerodynamic performance and kinematic condition. Aircraft performance data are introduced through an aircraft data file, including performance and operations data provided by EUROCONTROL’s BADA R3.9 [
35]. Kinematic conditions at each point are derived from a user-defined flight envelope detailing the segments and the procedure with which its mission will be realized. Through the mission definition file, the user can also specify aircraft type, engine type, payload, mission range or total fuel load, reserve fuel and other information relevant to the mission and the type of analysis. Depending on the combination of aircraft and engine types selected, and in view of the requirement for assessing the impact of new engine designs at the aircraft-mission level, both aircraft mass and drag can be adjusted if an engine different from the default one is used. This is accomplished by replacing the default engine mass with that of the selected engine and correcting the zero-lift drag coefficient to account for changes in nacelle drag between the default and new engines. No change in thrust requirements is assumed following these changes, although this is in fact an iterative procedure. The output of this analysis includes, at segment and mission levels, both overall quantities, e.g., time taken, fuel consumed and range covered, as well as the variation with time of all the main mission parameters such as altitude, range, flight speed, angle, drag polars, aircraft weight, thrust and fuel flow. The overall mission fuel burn (FB) is typically the figure of merit in a calculation for engine-design optimization. For a three-segment mission (climb–cruise–descent), calculation time is less than 3 s. This means that depending on the selected quality of the approximate engine performance model, the overall engine design and mission analysis calculation can be performed within 10–15 s.
The iterative nature of the mission-analysis algorithm, combined with DoE and optimization studies, dictates the use of an approximate engine model instead of the full thermodynamic model, in order to ensure reasonable simulation times. The accuracy of the approximate model was investigated with a current technology engine (similar to Pratt & Whitney’s PW1100G-JM) on a single-aisle application (similar to Airbus A320), and was found to depend on mission distance, varying from 1% for short-range missions (<1000 km) to 0.2% for long-range ones (>3000 km). This is attributed to discrepancies between the two models, mainly in the descent parts of the missions, which constitute a larger part of the distance traveled in short-range missions. Although the accuracy of the approximately model can be improved (at the expense of simulation time) by considering more points in the descent part of the mission, this level of accuracy is considered acceptable for the type of preliminary design studies performed in this work, since all engine designs are assessed with the same methodology, thus ensuring a consistent and fair comparison between them.
2.4. Control System Design and Transient Performance Modules
Once an engine design is established, transient performance and operability is assessed within the control design and dynamic system analysis FMU modules (
Figure 2). A basic control system is built around the engine (
Figure 1), comprising the power lever angle (PLA), a proportional–integral (PI) setpoint controller in which either the engine pressure ratio (EPR) or corrected fan speed (Nf
c) can be selected as thrust surrogates, an acceleration PI controller using CDT as controlling variable, a ratio unit (RU = Wf/CDP) limiter to control deceleration, and finally the relevant min/max logic, which guarantees the engine remains within its limits. No steady-state (static) controllers are included in this implementation, since only transient operation is assessed both in terms of operability (e.g., compressor surge margin) as well as response (e.g., acceleration from low to high power within a set time). The control system receives pressure, temperature, rotational speed and fuel-flow-rate signals from components in the engine model that simulate sensors. The control system commands an input to the fuel-flow actuator. Variable geometry actuators are controlled in an open-loop mode. Sensor and actuator dynamics are accounted for through a first-order lag approach, while a delay can also be specified. A detailed description of a turbofan control system in PROOSIS is available in [
21]. It should be noted that in the current implementation, only shaft dynamics are considered, but the PROOSIS TURBO library is also capable of handling the effects of heat soakage, tip clearance and volume dynamics [
21]. Spool inertias are estimated from dimensions and weights calculated by the engine-design model.
A single-step steady-state simulation is performed first at different points in the flight envelope, using a procedure similar to that described for the off-design engine model. The simulation generates the power-management logic to allow EPR and Nf
c to vary with PLA and MN, linearize the engine model and obtain, in terms of PLA and MN, the proportional Kp, integral Ki and integral windup IWG gains of the PI controllers using the Edmunds’ model-matching method [
36]. Inputs to the method are the frequency range, the number of approximation points, the damping ratio, the settling time and the state-space matrices at each operating point. For the acceleration limiter, the schedule of CDT (non-dimensionalized over fan inlet total temperature Tt2) against the corrected rotational speed of the high-pressure spool NH
c is obtained by imposing a large transient at each operating point and establishing the CDT value for which the high pressure compressor (HPC) surge margin is at a certain limit (e.g., 8%). The schedule of any variable-geometry components is also determined at this stage, depending on the requirements. An example is presented in the next section for the case of the variable-area nozzle.
The final FMU module performs a transient maneuver on the engine model with control system to check compliance with the Federal Aviation Administration’s (FAA) 5 s regulation [
37]. This is basically to test that the engine can accelerate from 15% to 95% of rated take-off thrust in no more than 5 s. The maneuver also includes a deceleration part (back to idle) to check the operation of the relevant controller. Currently, the output of this assessment does not feed back to the overall engine design, and it is left to the user to make any necessary adjustments in case of noncompliance.
In the following section, an application case is presented that utilizes all of the above modules.
3. Application Example
Using the simulation workflow presented in
Figure 2, an optimization calculation was defined in order to establish an optimum UBGF engine with a VAN, as shown in
Figure 1. The objective was to minimize fuel burn for a given aircraft mission, examine other mission ranges and assess the transient response of the optimum engine design.
3.1. Aircraft Requirements
Top-level aircraft requirements were obtained assuming a short-range application similar to Airbus A320, but with improved aerodynamics for an EIS of 2030. Based on the information provided in [
38], a lift-to-drag ratio of 19 was assumed, with a maximum take-off mass of 78 metric tons. The three operating points considered in the MPD analysis were ToC, mid-cruise (MCR) and RTO, with net thrust requirements calculated according to [
39] and [
32]. An all-electric application was considered with no customer bleeds, and thus customer power extraction (PWX) was adjusted accordingly [
18]. The specifications are presented in
Table 1.
3.2. Engine Parameters
The cycle design parameters at ToC were FPR, OPR, BPR, specific thrust sFN and the pressure ratio split parameter between the low and high-pressure compressors nPR. Typical values were used as design values for duct and burner pressure losses, burner efficiency and component inlet/outlet Mach numbers, e.g., from [
40]. Suitable performance maps were selected for the turbomachinery components. The location of the design point on these maps was defined based on the preliminary off-design calculations to ensure that all operating points in the flight envelope remained within the maps. To this effect, a schedule was defined for the variable bleed valves at the exit of the low pressure compressor (LPC), while the operation of the fan bypass VAN was scheduled so that a unique fan operating line, near the maximum fan efficiency locus, was obtained. The latter is described in more detail in
Section 3.7.
The analysis was performed for fixed aerodynamic design options, as follows. The number of turbomachinery stages (1_G_3_8_2_3) was taken as equal to that of the PW1100G engine. For the aerodynamic calculations at MCR conditions, the LPC was designed with the constant hub option, assuming constant stage loading while the HPC is designed with the constant mean diameter option, and assuming an enthalpy change distribution. For both compressors, a linear distribution of the flow coefficient between the component inlet and outlet was assumed, and the stage efficiency was established through a losses approach [
23]. Α default blockage factor distribution was selected, and stage reaction was calculated by specifying the absolute flow angle at the stage inlet. For the turbines, a linear distribution of mean diameter was assumed with constant loading and symmetrical velocity diagrams. Stage isentropic efficiency was calculated using a Smith-type chart. For all other compressor and turbine design parameters (e.g., aspect, blade gap and hub-to-tip ratios), typical values were specified, e.g., from [
40]. Fan bypass polytropic efficiency was assumed to be a function of FPR, according to [
41].
For the HPT cooling model, the values corresponding to the advanced set of cooling technology factors in [
42] were considered, with the exception of the second-stage rotor, for which no film cooling was assumed. The combustion pattern factors were set to 0.1 and 0.05 for the first-stage stator and rotor, respectively, and to 0 for the second stage. No reduction to cooling air temperature due to pre-swirling was considered. The stage efficiency cooling correction factors were set to 0.1 and 0.2 for the stators and rotors, respectively. In order to set the HPT cooling flows at RTO conditions, the design blade metal temperature for the HPT stator rows was set to 1320 K, and for rotor rows, to 1220 K.
To establish the high and low-pressure spool rotational speeds, the corresponding turbine blade stress parameters AN
2 were set to 30 (at RTO) and 35 (at ToC) 10
6∙m
2∙rpm
2. The gearbox ratio was then determined from the fan rotational speed, which was set according to a correlation of corrected fan blade tip speed with FPR from [
41].
3.3. Mission Details
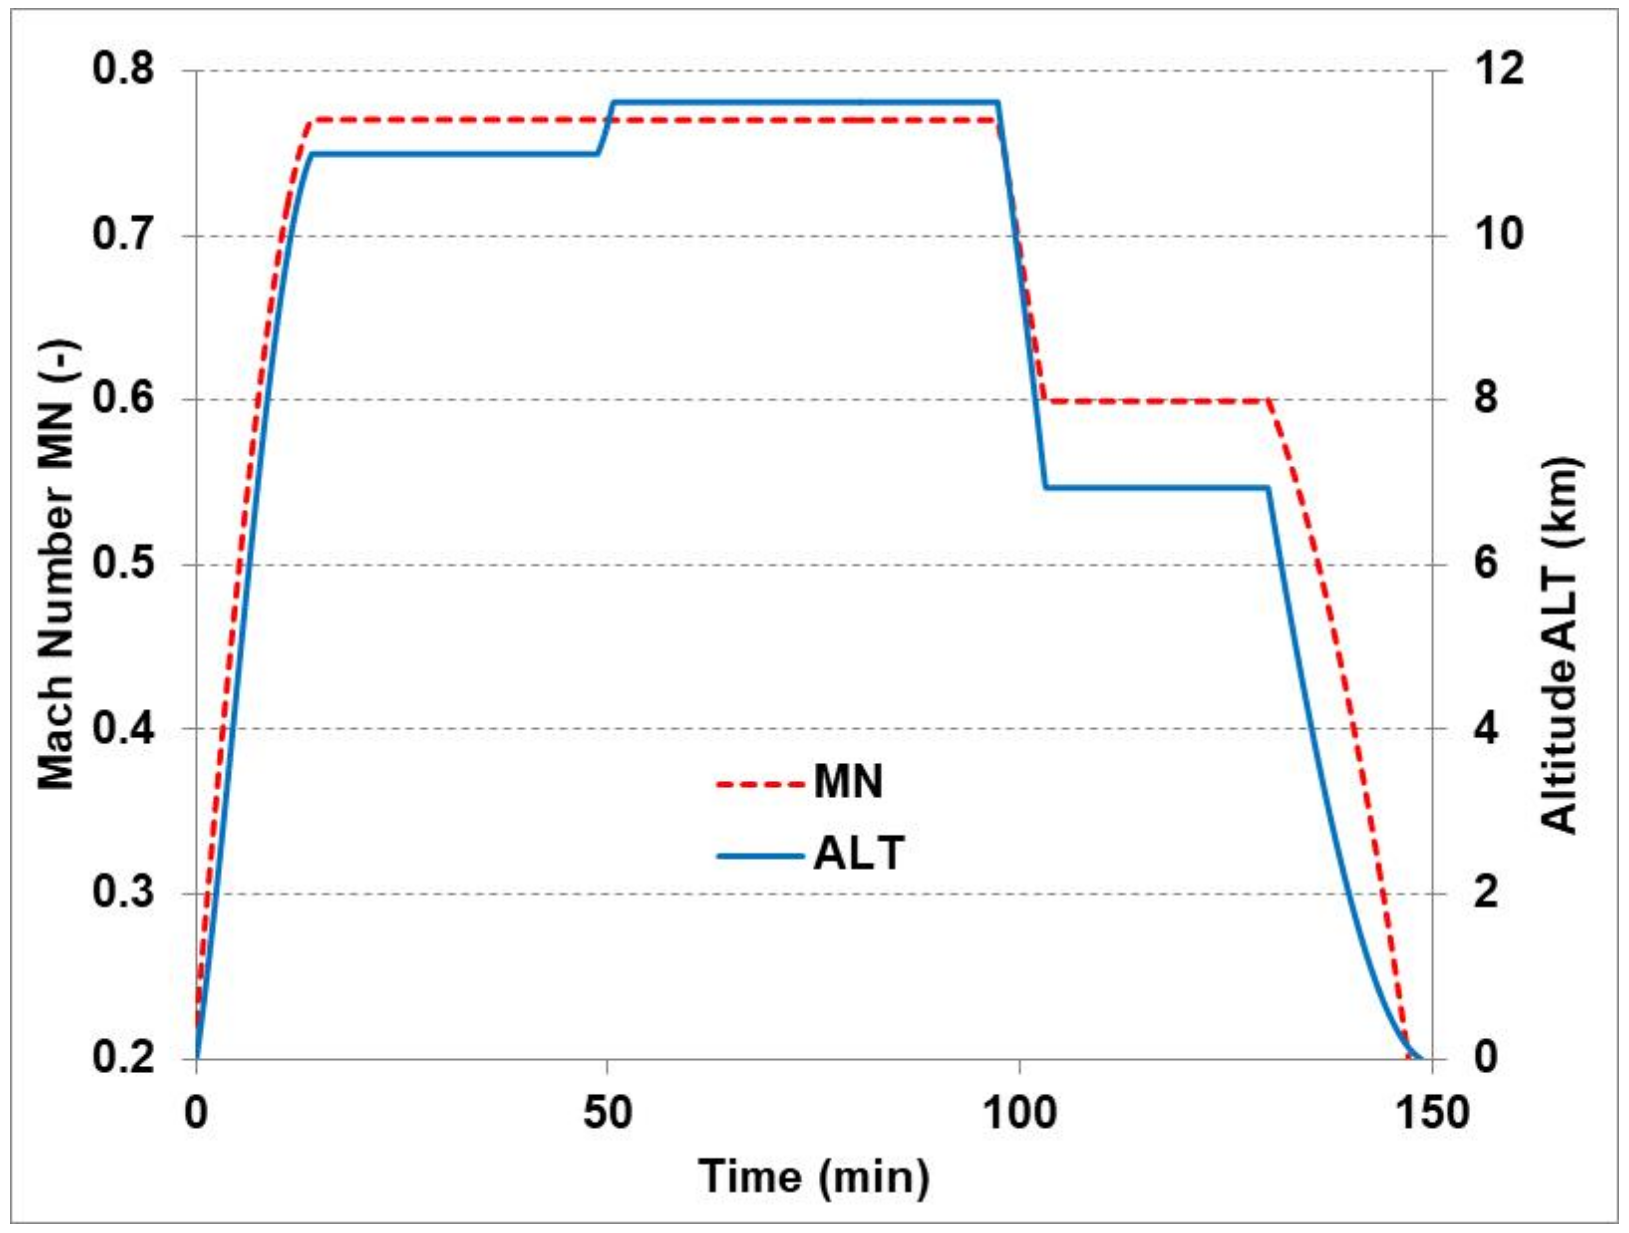
In order to assess the fuel-burn benefits of the advanced UBGF propulsion concept in relation to past and current technology engines, a contemporary aircraft application was considered. Specifically, the aircraft mission was based on an A320 flight between Athens and Berlin (ATH–BER), for which detailed mission data were available to the authors [
43]. The variation of ALT and MN with time is presented in
Figure 4. The flight distance was 1804 km (974.1 nm), and the flight duration was 2.48 h. A payload of 14,250 kg was assumed (corresponding to 150 passengers), while the fuel reserve was set to 15% of the total fuel load.
3.4. Optimization Process
Regarding the optimization strategy, two different algorithms were tested for searching the design space; the adaptive simulated annealing (ASA) technique [
44] and the in-house evolution algorithm EASY [
45]. Independent of which algorithm was used, re-initializations from different corners of the design space were performed. Once a global optimum was established, a downhill simplex [
46] algorithm was applied to further refine the search around it. Finally, a design of experiments was performed to visualize the space around the optimum design point.
The results of any optimization or design space exploration studies are highly dependent on the constraints imposed. In the current study, the main technological limits are summarized in
Table 2. Upper limits were placed on both CDT and TET at RTO conditions where the maximum values of these parameters occurred. These acted mainly as surrogates to lifing calculations and to control cooling-air requirements. A lower limit was placed on the last-stage blade height of the HPC to avoid performance losses associated with very small cores. According to [
47], the upper limit for a single stage gearbox is 4.5, and this was used here. Finally, the maximum diameter of the fan was limited to 2.5 m, to minimize integration issues.
3.5. Optimization Results
The main results of an optimization calculation for minimum FB (single-objective) are presented in
Table 3. An ultra-high BPR value of 18.3 was obtained at ToC conditions. OPR at ToC reached the maximum value (50.3) that can be attained without violating the RTO CDT constraint of 950K. The optimum value of FPR (at ToC) was found to be 1.3, requiring the VAN to open by almost 13% at RTO compared to the ToC area, in order to keep the fan operating on its unique line. The combination of sFN (78.3 m/s), fan inlet MN (0.6) and fan hub-to-tip ratio (0.32) resulted in a fan tip diameter of 2.4 m and a propulsive efficiency of 83.5%. The efficient, high-rotational-speed LPC led the optimizer to a high work split (0.371), with an LPC pressure ratio (PR) of 3.6 and an HPC PR of 11.9, at ToC. This pressure ratio split lies between those typically found in conventional two-spool and three-spool configurations, as also suggested by Epstein [
48]. The choices of AN
2 values and fan corrected tip speed led to a gearbox ratio of almost 4.2, while to maintain RTO turbine blade metal temperatures at the imposed value, 10.7% of the compressor discharge flow (WcQW3) must be extracted for HPT cooling. The high fan polytropic efficiency (95.7%) and LPT isentropic efficiency (93.3%) resulted in a high transfer efficiency (86.7%) and a specific fuel consumption (SFC) of 13.4 g/(kN·s) at MCR. TET at RTO was close to the level of current-technology engines (1795 K). As discussed by Cumpsty [
39], the high thrust lapse rate of ultra-high bypass ratio engines leads to higher pressure ratios and temperatures (and hence thermal efficiency, but also NOx emissions) at cruise and climb, and reduced turbine-entry temperatures (TET) at take-off (derated engine). Becker et al. [
18] stated that this may be beneficial to hot end component lifing in terms of thermal fatigue, but could increase HPT creep, so hot section life and maintenance requirements must be carefully assessed, especially for short-range aircraft applications, which typically operate at high-power conditions for a large part of their operational life. Alternatively, as suggested by Ivey [
49], the excess power available at take-off can be used to reduce take-off distances, allow for steeper climb rates or enable the engine to be installed on a larger aircraft. LTO NOx emissions, expressed as mass of NOx (D
p) over rated thrust at SLS (F
oo), were 6.2 g/kN, which is 90% of the CAEP-8 limit [
50].
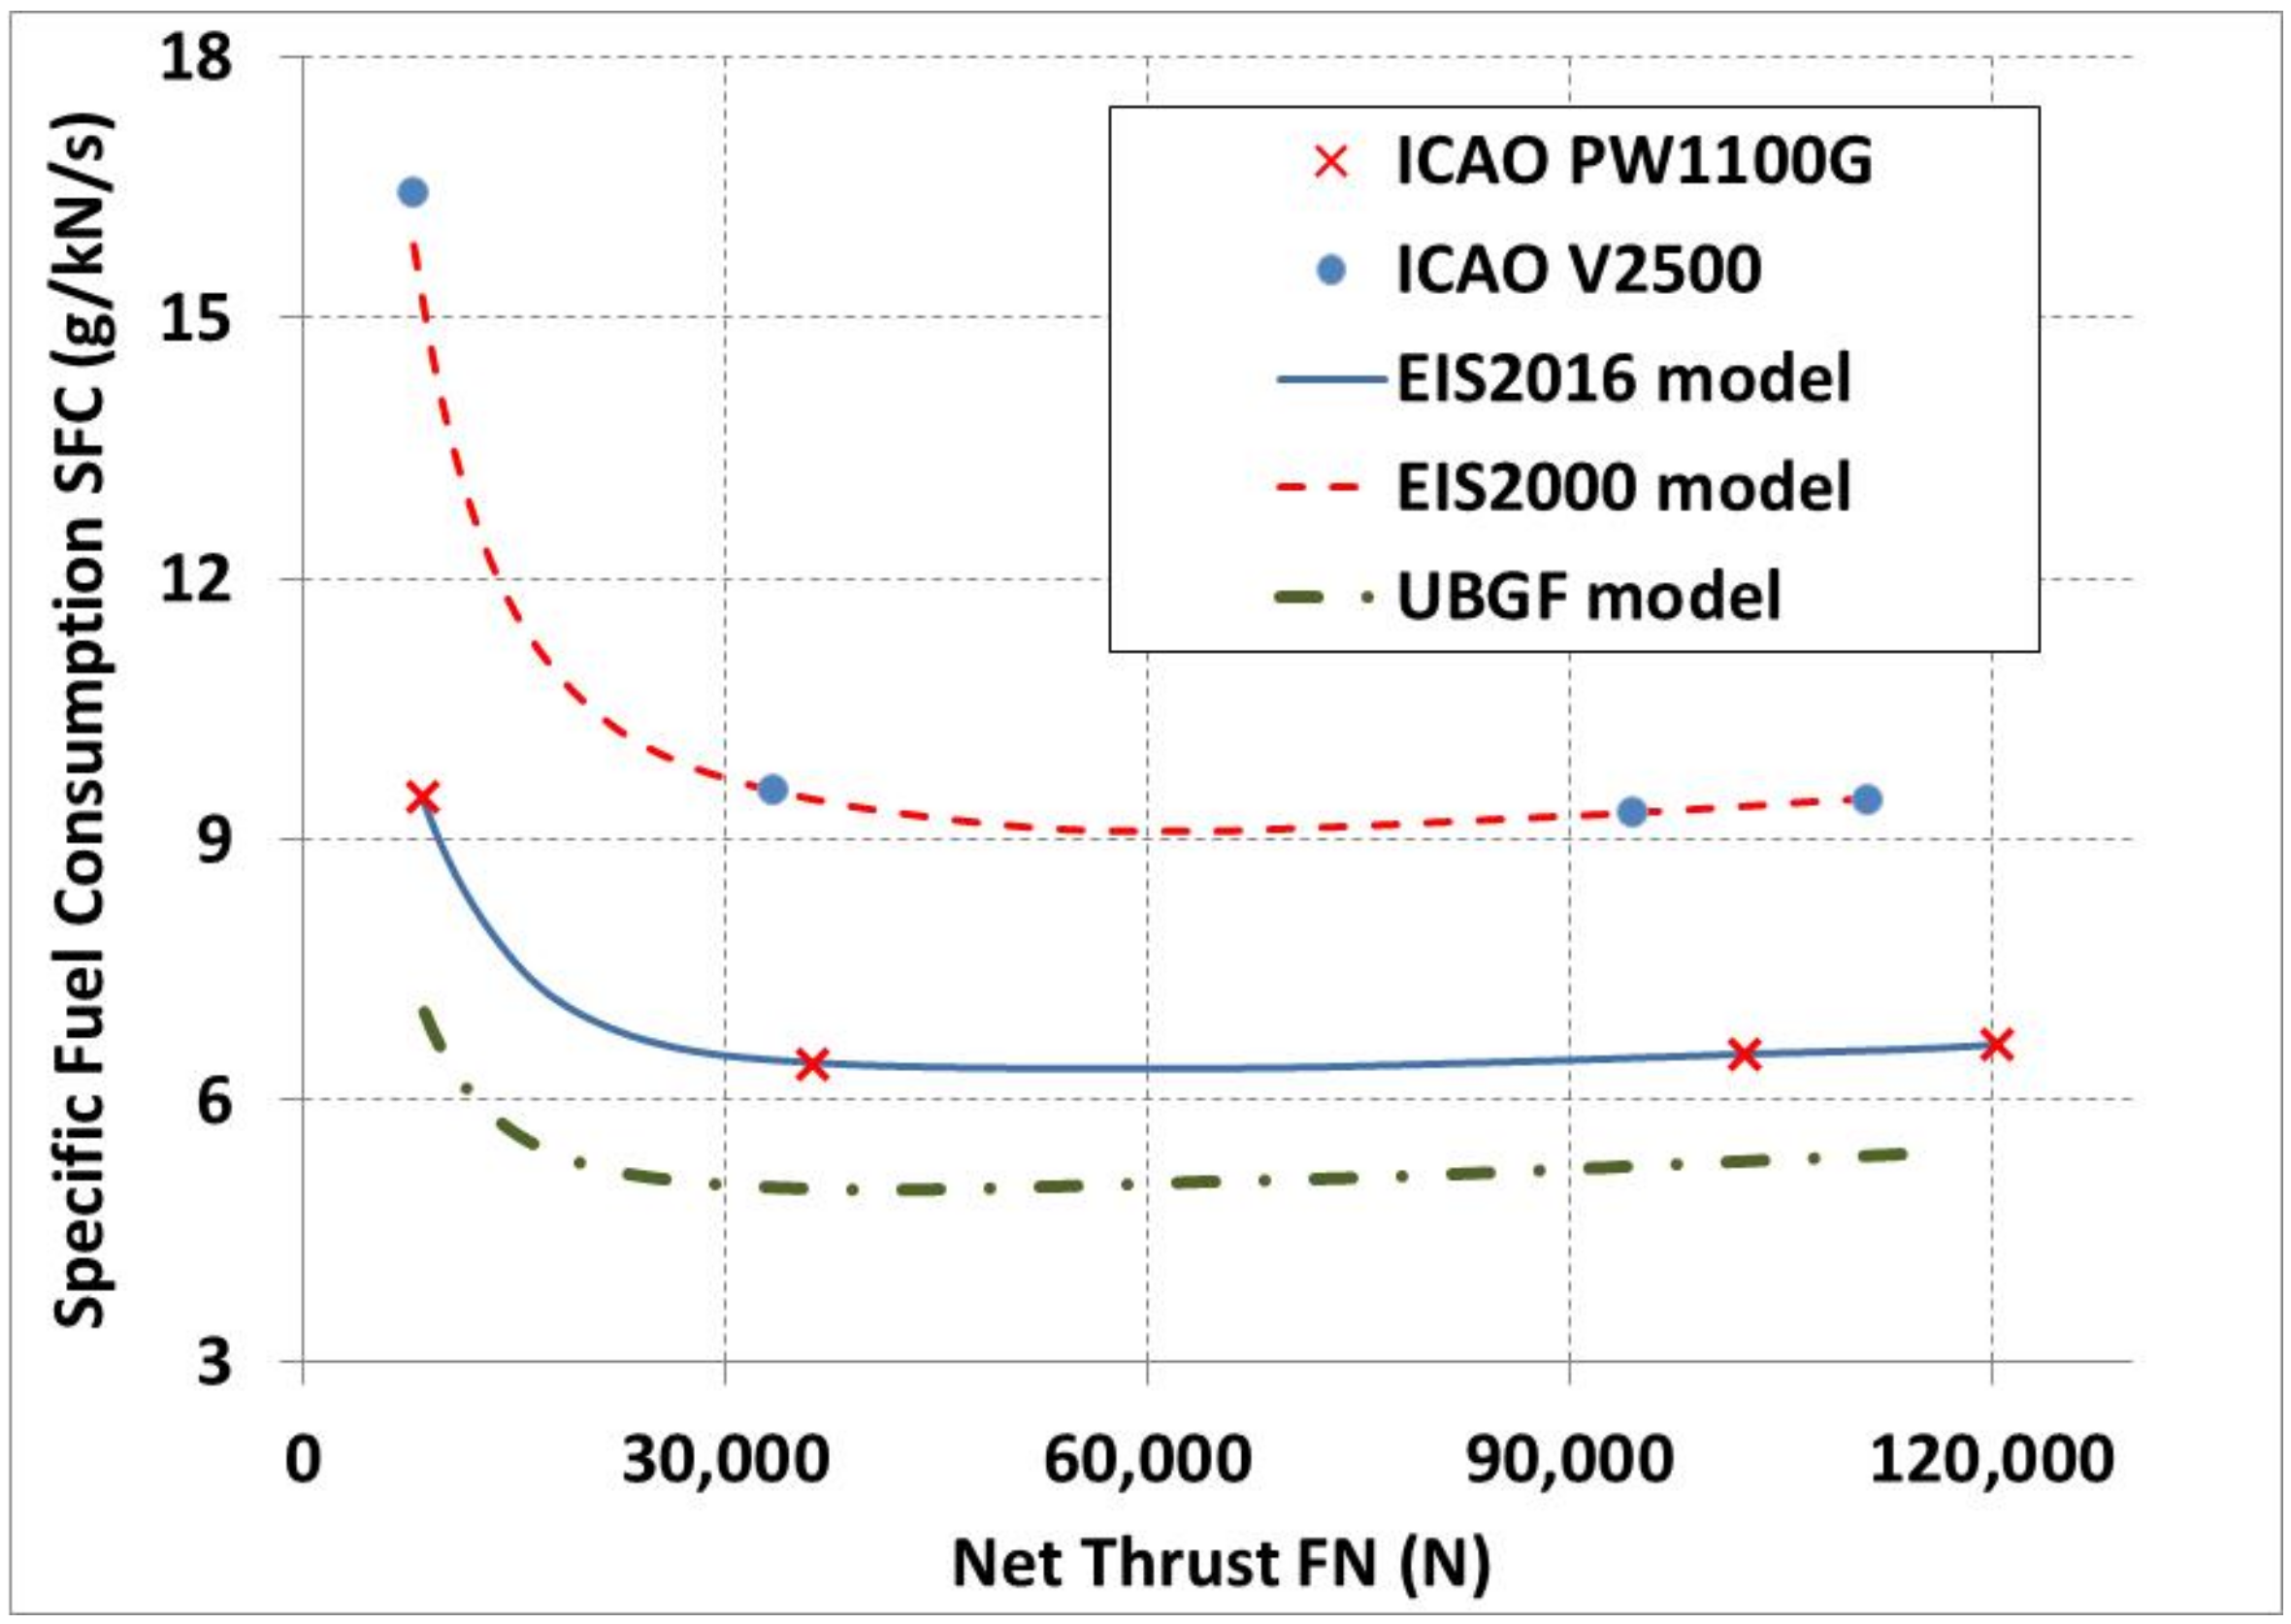
FB for the optimum UBGF engine design was found to be 5019 kg, which is 12.9% lower than the FB obtained (5759 kg) if the same mission was simulated using a current-technology engine (e.g., similar to a geared turbofan engine of EIS-2016). Using the EIS-2000 engine model (similar to IAE’s V2500) reported in [
43] and performing the same mission again, an FB value of 6709 kg was obtained. This was a 25.2% reduction, a value consistent with that reported in [
32]. The UBGF FB benefit over the EIS-2000 and EIS-2016 engines was due to its lower SFC, as shown in
Figure 5, in which the SFC-FN variation at SLS conditions for all three engines is presented. Also included in the figure are the data available in the ICAO emission databank [
51] for two existing engines that serve to demonstrate the quality of the produced engine performance models (<0.2% difference for both engines, except for the idle performance of the EIS-2000, which was 3.5%).
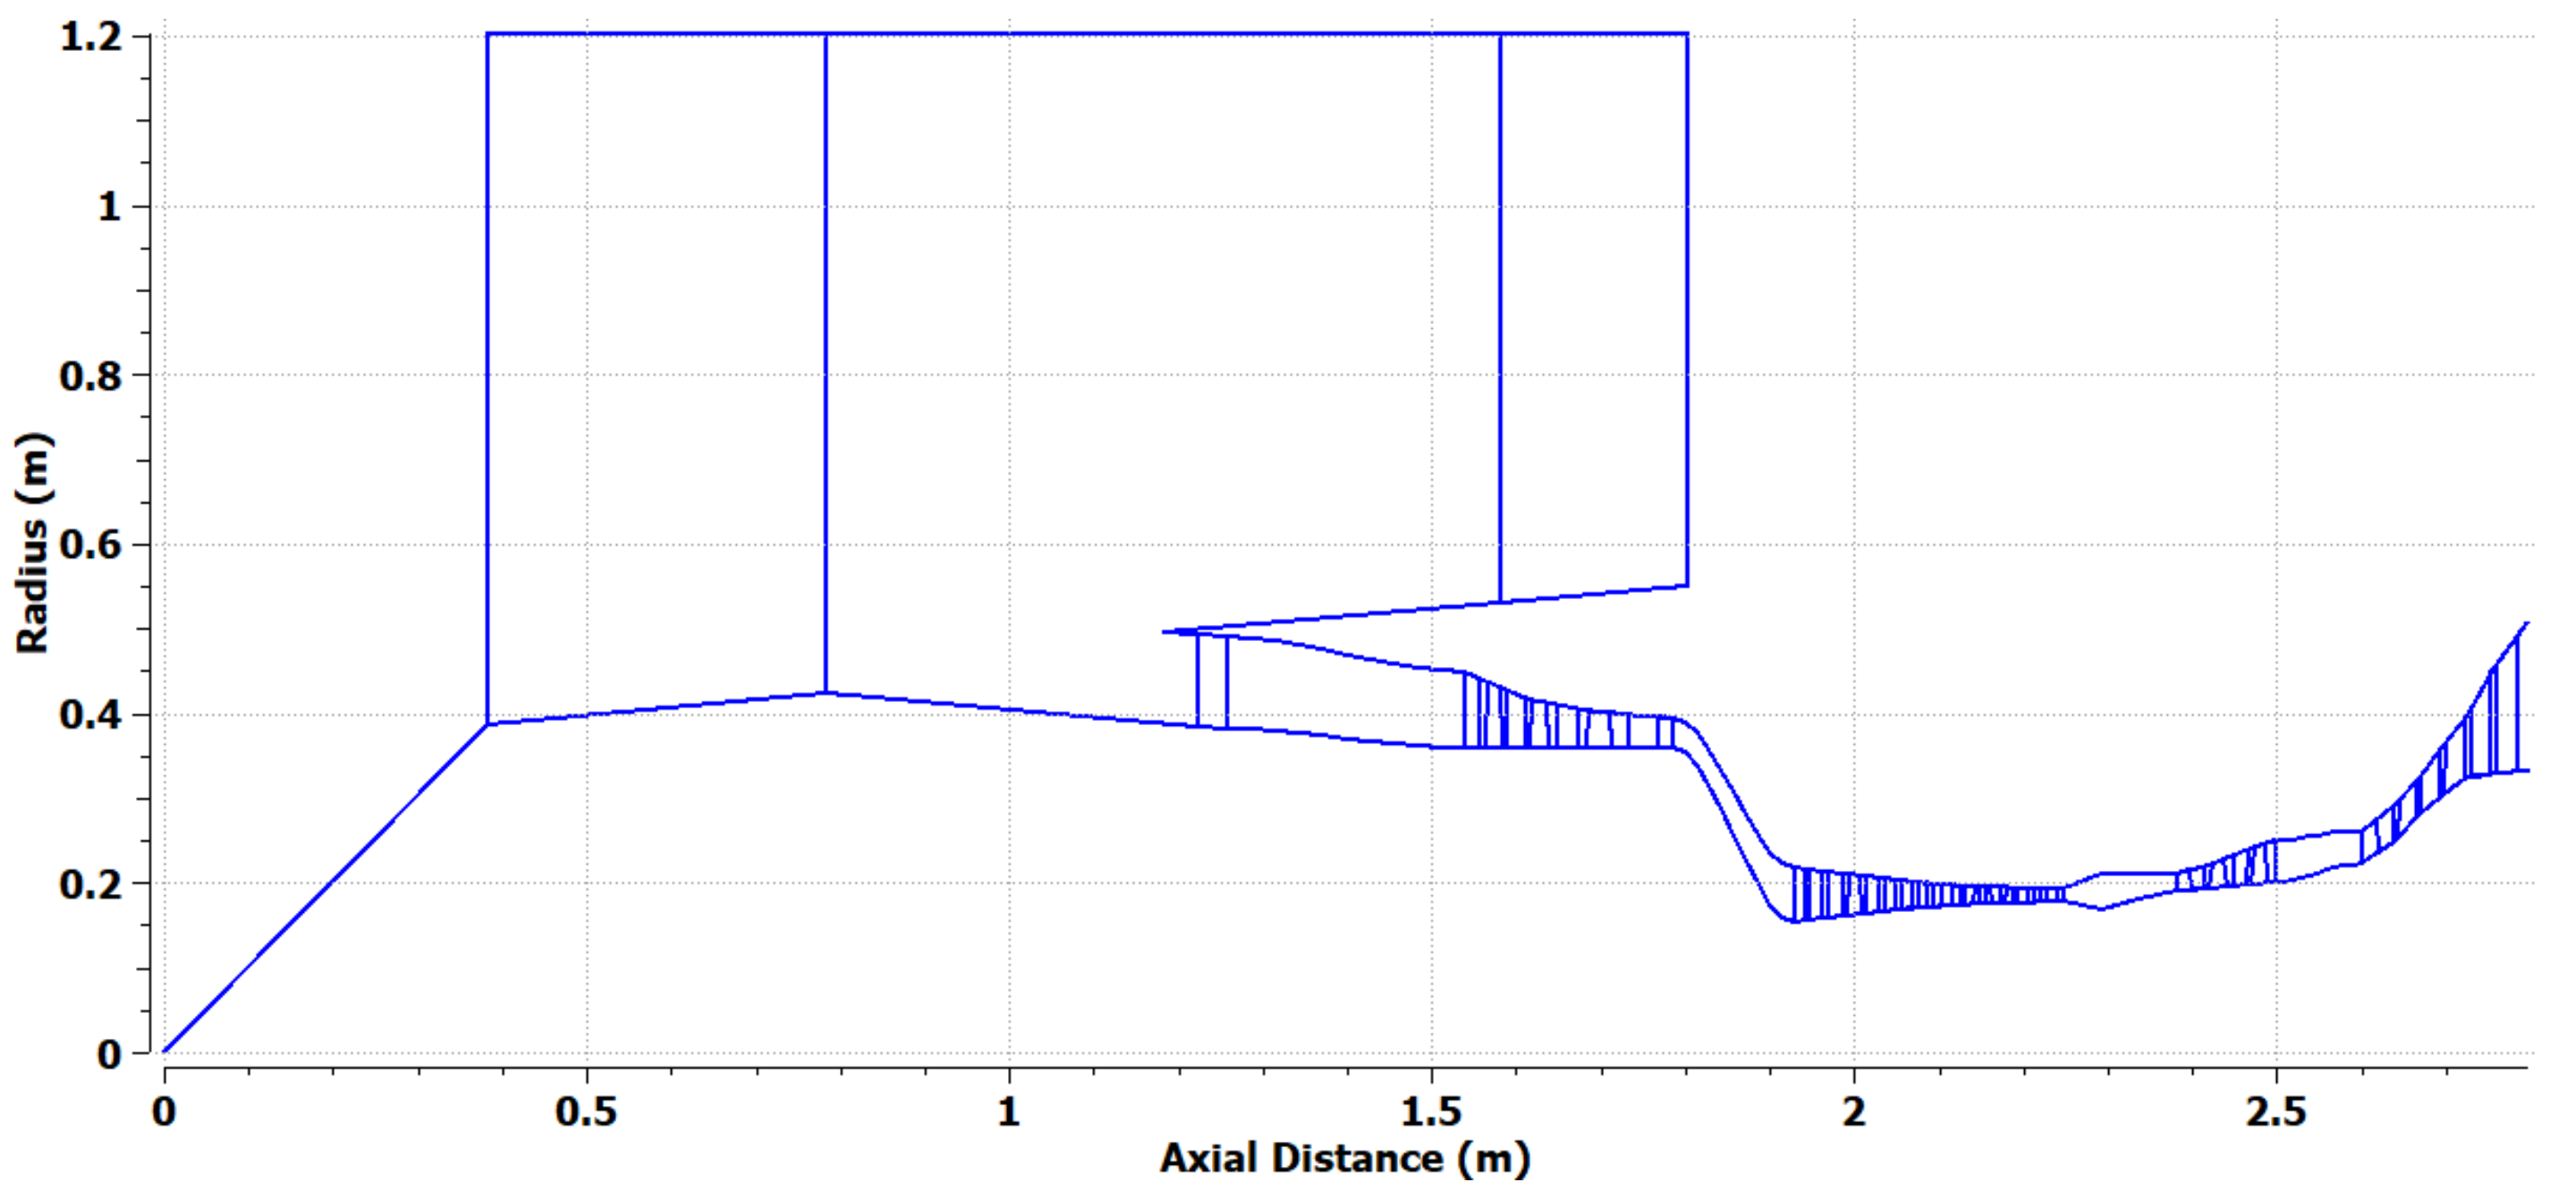
Finally,
Figure 6 shows the resulting main gas flowpath. The pod engine weight was estimated to be 3244 kg, while the LSBH was 14.3 mm.
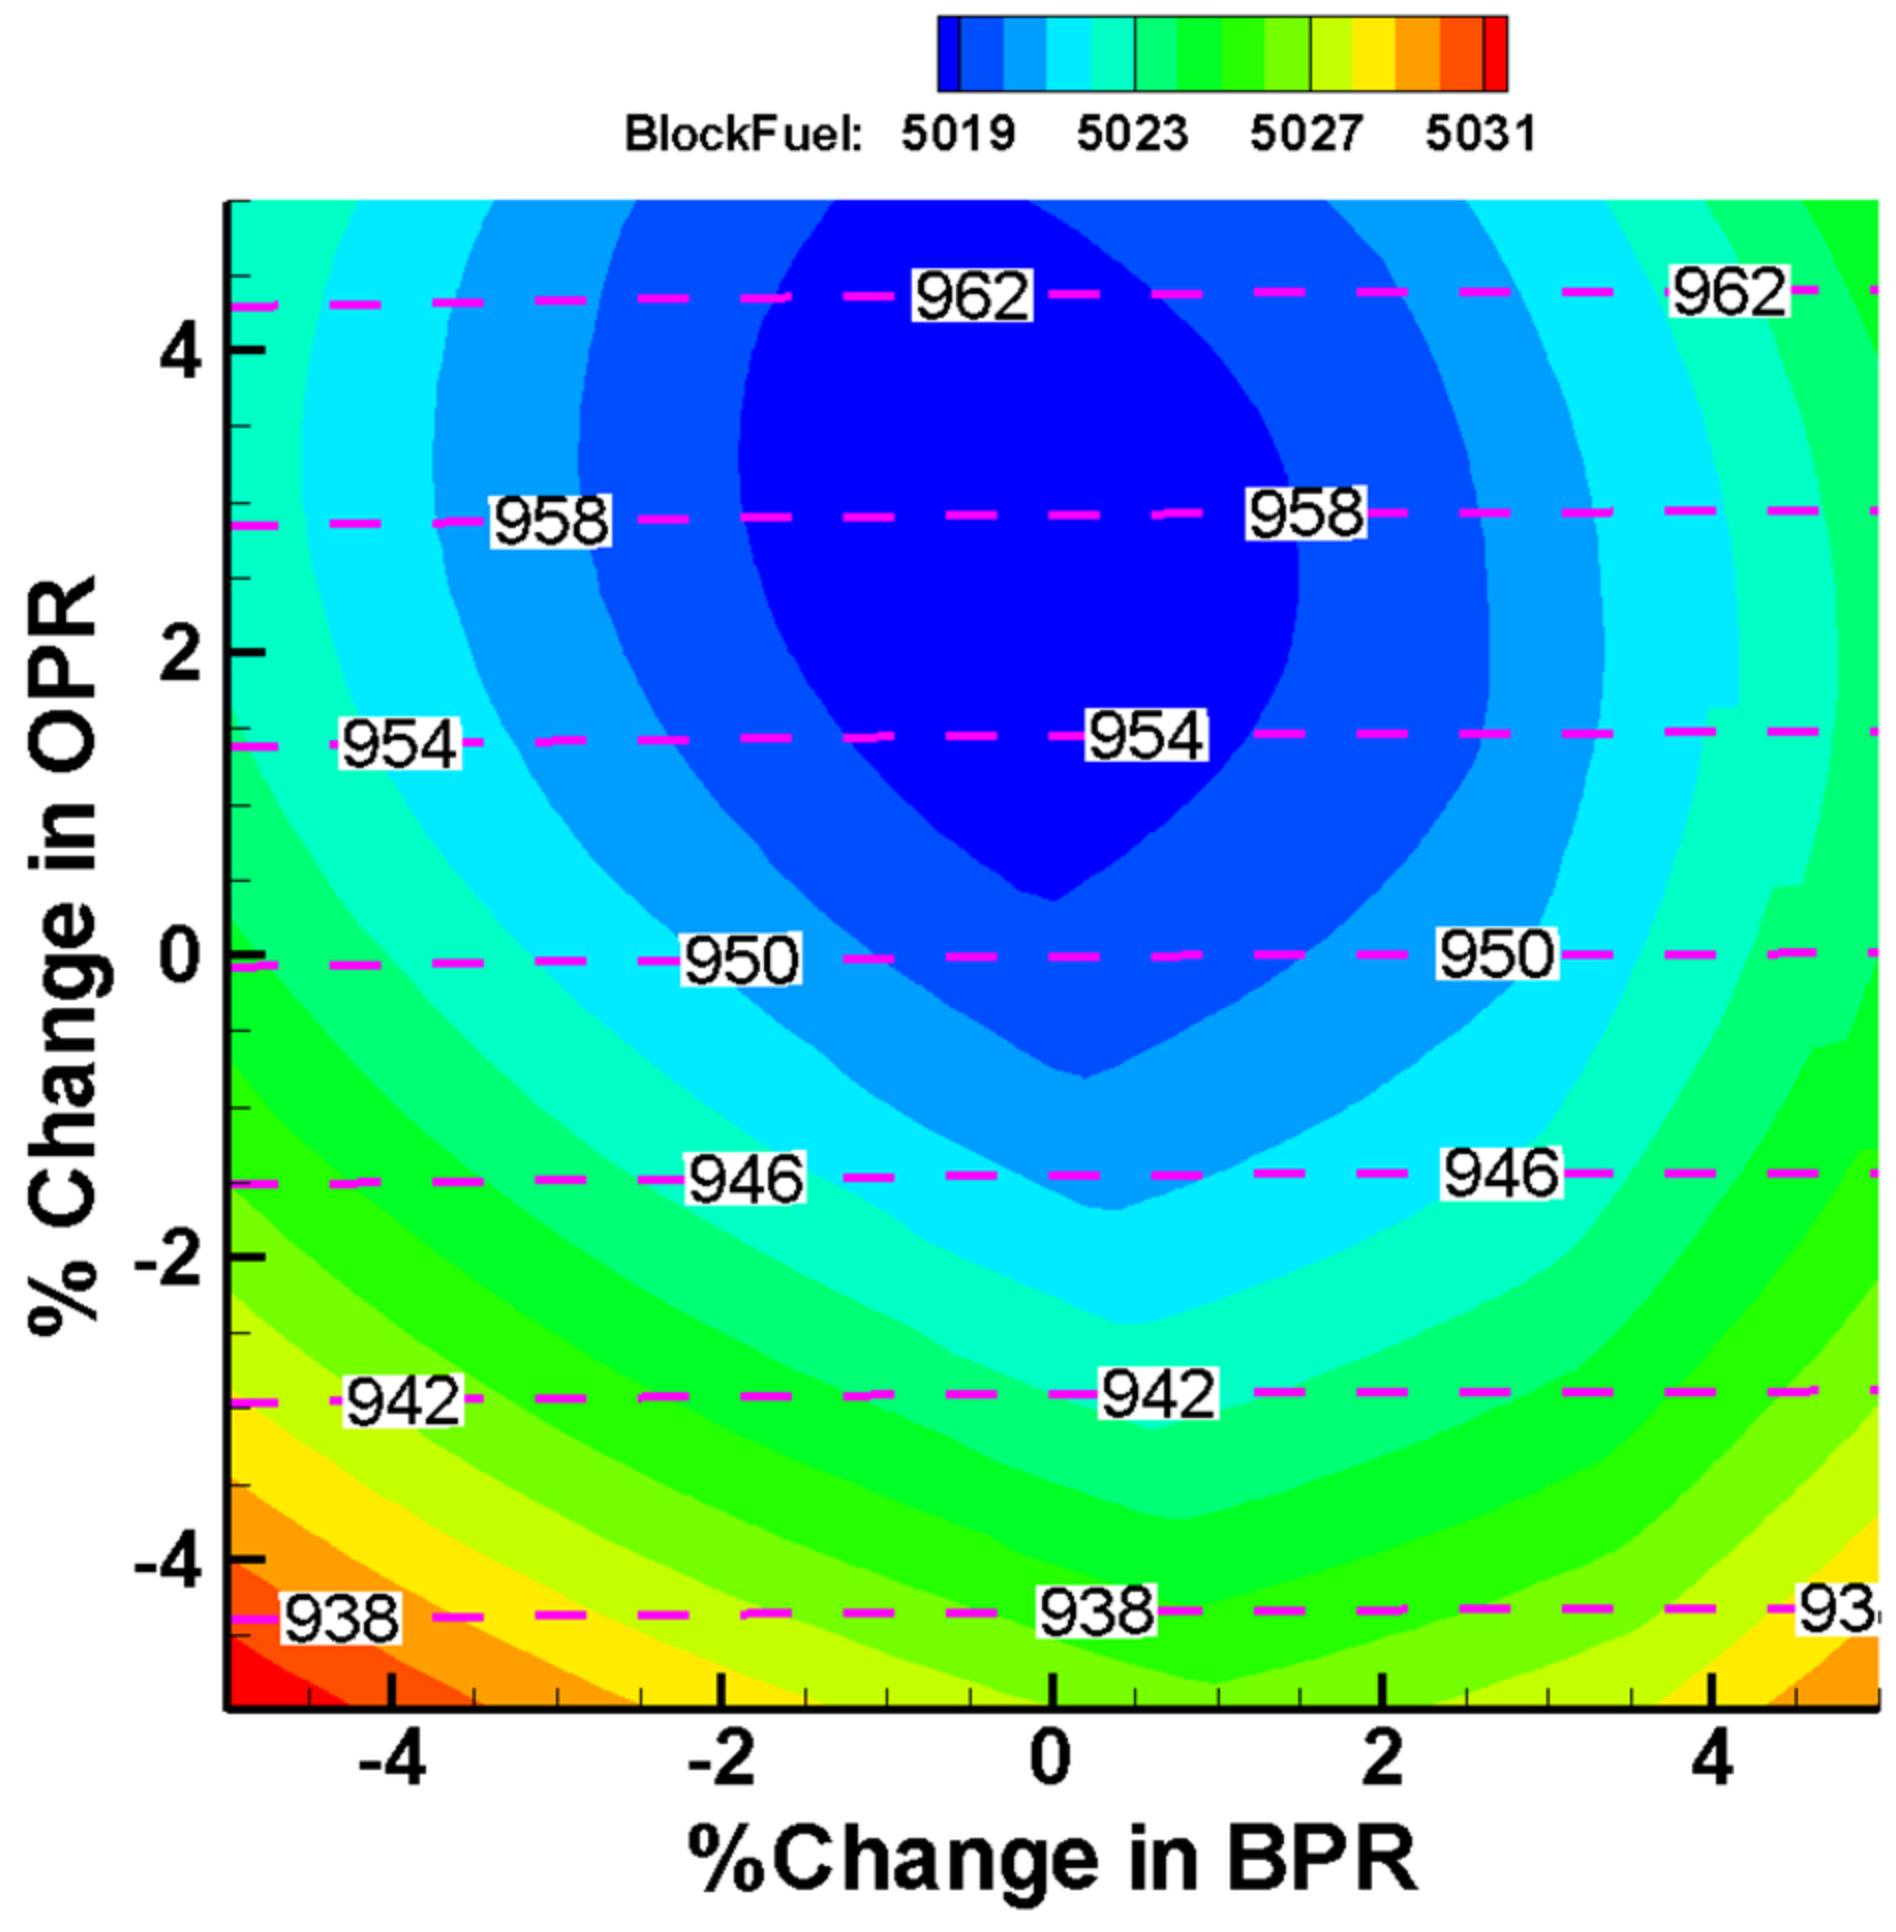
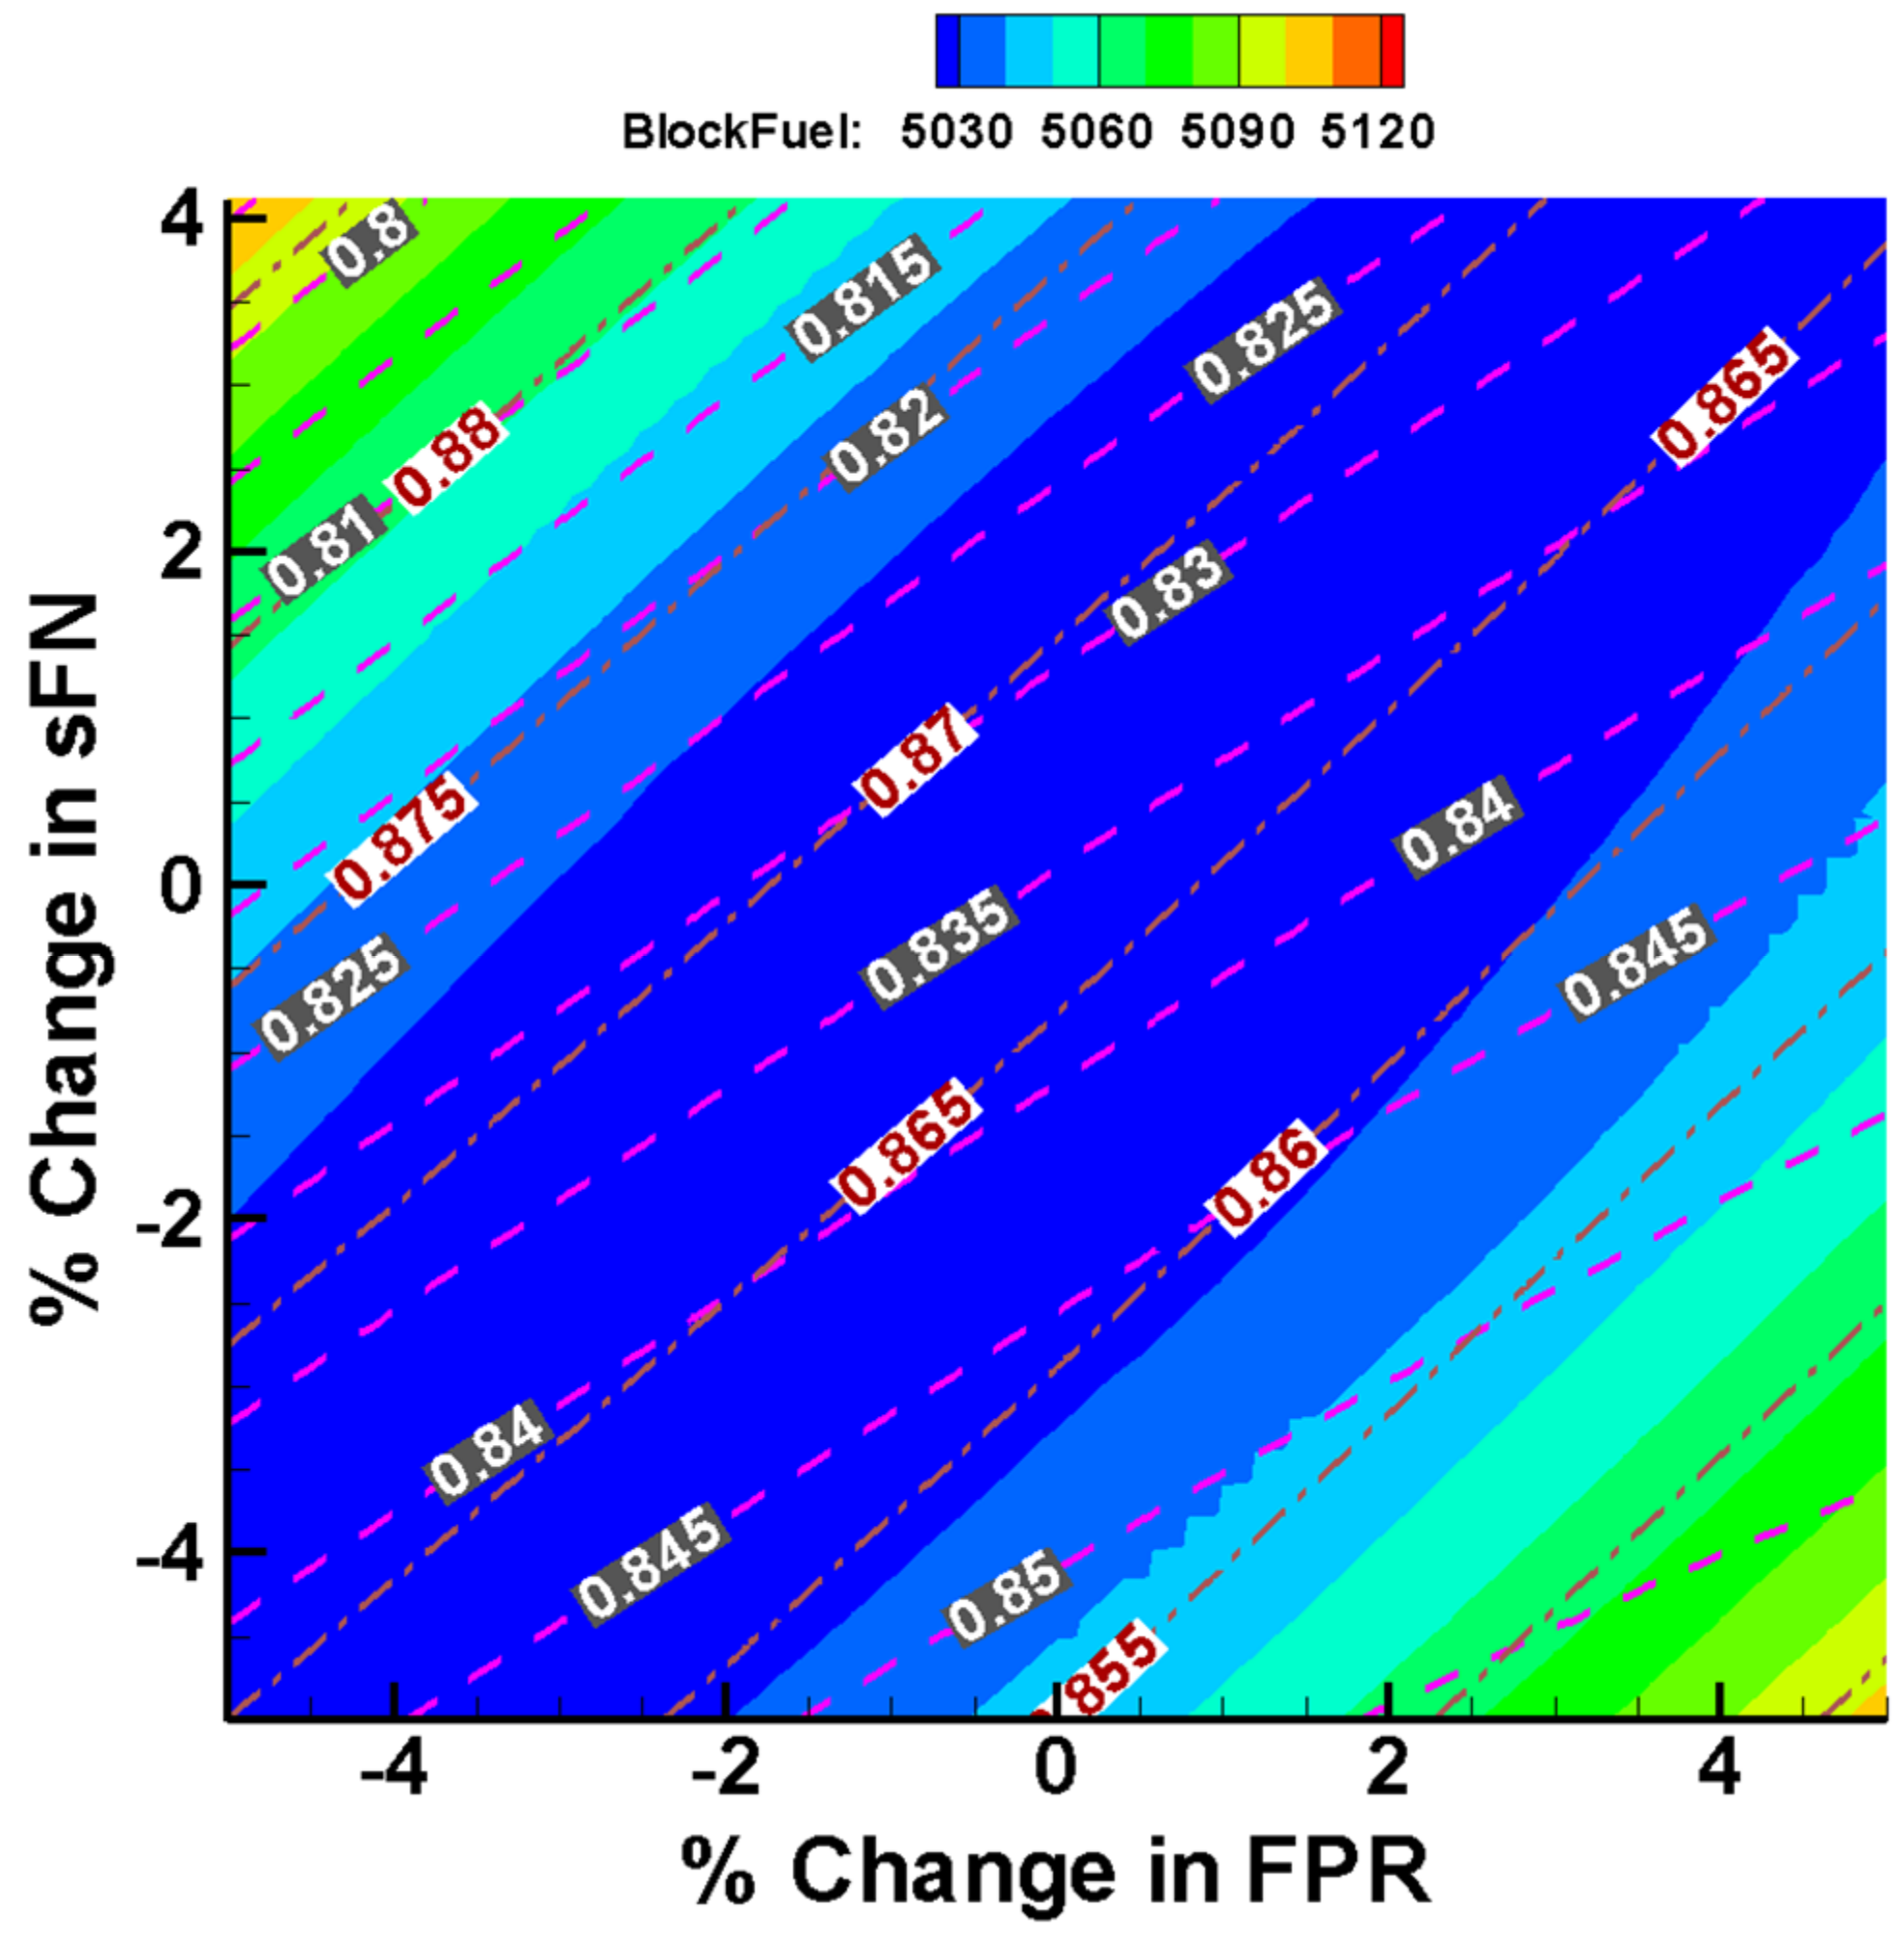
The design space around the optimal solution was investigated through a DoE study. The optimal Latin hypercube sampling method [
52] was used to verify the location of the optimal design in the range of ± 5% around it, for all five cycle design variables.
Figure 7 shows a contour plot of FB with design variables OPR and BPR at ToC (as % change from the corresponding optimum value) in which the minimum value of FB occurs at a higher value of OPR compared to the established optimum one. Overlaying the CDT isolines (dashed lines) on the plot confirmed that the location of the optimum was established by the imposed CDT limit at RTO (950 K).
Figure 8 exemplifies the strong correlation between ΔFPR and ΔsFN (~one to one), with the FB optimum values occurring at the point at which the trends of propulsive and transfer efficiency, engine weight and nacelle drag balanced out.
3.6. Mission Range Analysis
Having established an optimum UBGF engine design for a specific mission, four additional missions were simulated with the ATH–BER mission-optimized UBGF engine and the conventional EIS-2000 [
43] and EIS-2016 (
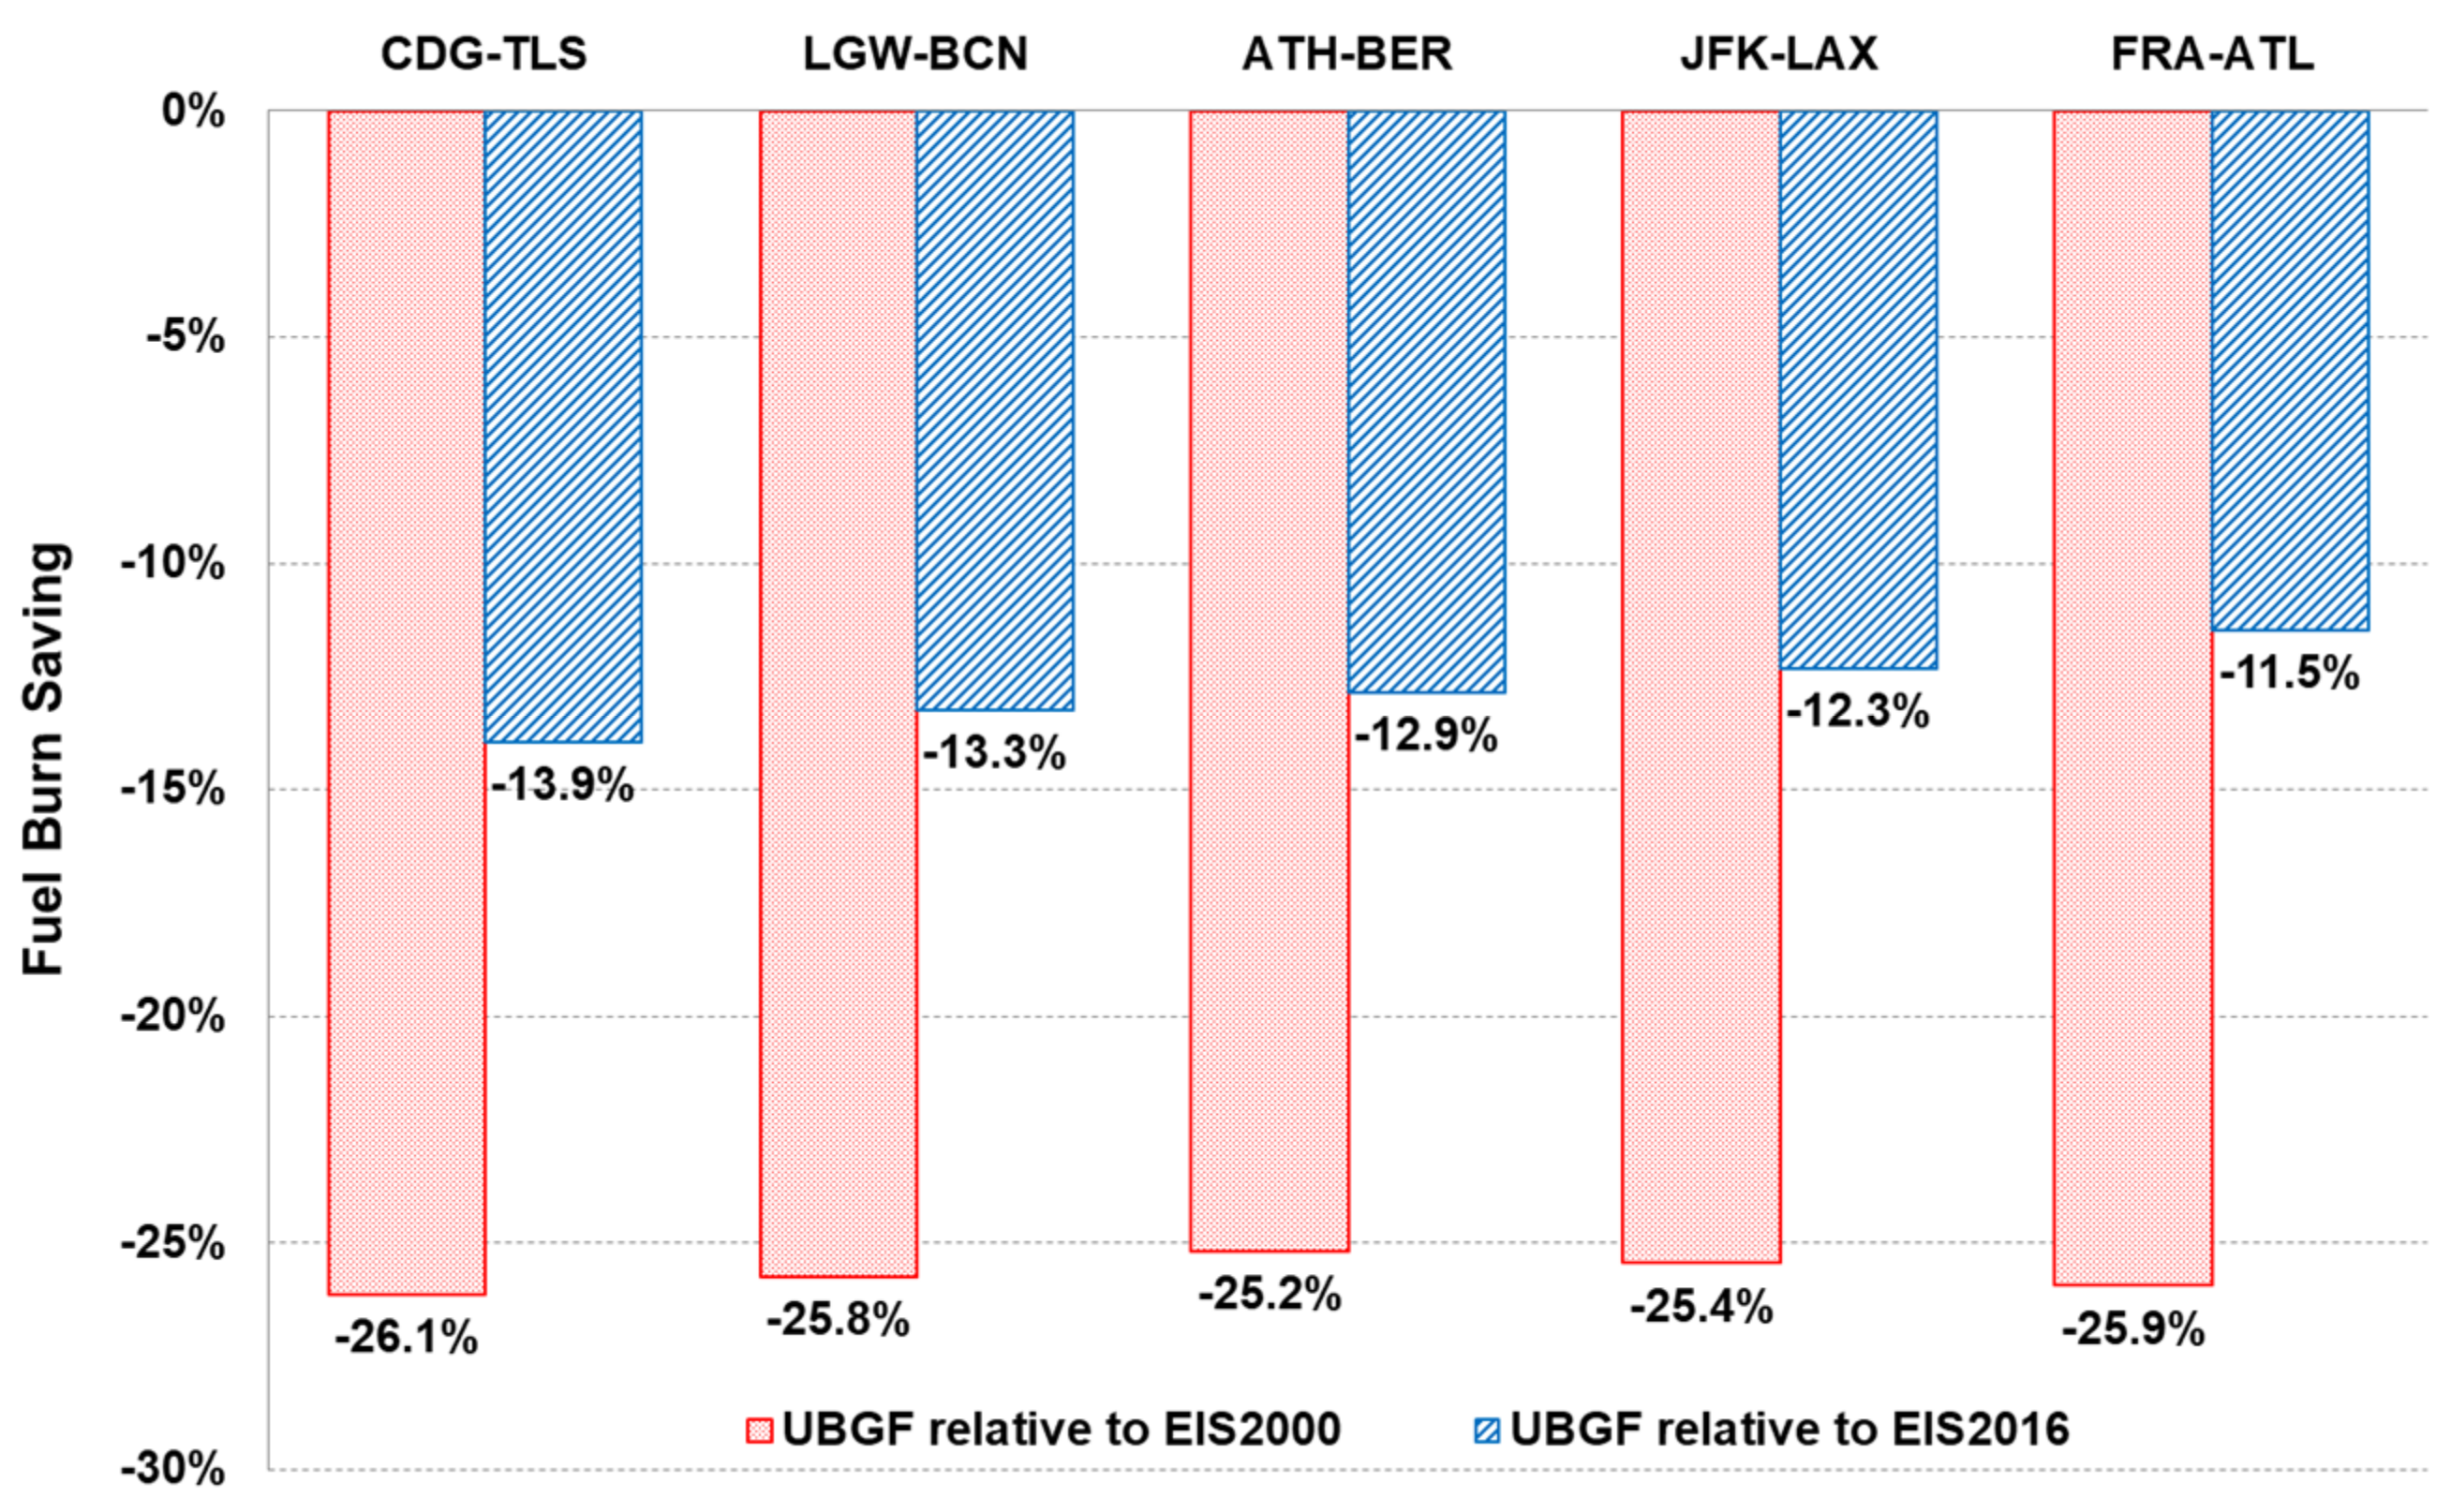
Figure 3) engines. The missions examined included very short range (e.g., Paris (CDG) to Toulouse (TLS) of 605 km), average short range (e.g., London (LGW) to Barcelona (BCN) of 1109 km), long range (e.g., New York (JFK) to Los Angeles (LAX) of 3983 km) and very long range distances (e.g., Frankfurt (FRA) to Atlanta (ATL) of 7426 km). For all missions, the A320 aircraft data were used and assumed the same payload (14,250 kg) and reserve fuel (15%) as for the ATH–BER mission. The changes in aircraft weight and drag due to different engines were accounted for as described in the Methodology section.
Figure 9 demonstrates that FB savings of over 25% were obtained for all four missions when using the ATH–BER-optimized UBGF engine instead of the EIS-2000 one. Compared to the EIS-2016 engine, there was a dependence on mission distance, with FB benefits varying from 13.9% for the very short range to 11.5% for the very long range. Similarly, the FB benefits of using the EIS-2016 over the EIS-2000 engine depended on distance, and varied from 14% for the very short range to 16% for very long distances. These numbers were consistent with observations from the industry regarding the benefits of current-technology engines [
53].
Starting with the ATH–BER mission-optimized UBGF engine design, an optimization was performed for each of the other four missions separately in order to establish if further FB benefits were possible. The results showed that only a small improvement was possible for the very short range (−0.17%) and very long range (−0.24%) missions. In the former case, this was achieved via increasing BPR by more than 4% through making the core smaller and lighter (−40 kg) but also hotter (+30 K in RTO TET), resulting in higher LTO NOx emissions (+0.4 g/kN). On the other hand, the long range mission benefited from a 3.5% reduction in sFN that led to a larger (+5 cm in fan diameter) and heavier (+165 kg) engine, but with improved propulsive efficiency (+1.2%) and cruise SFC (−0.22%), and lower LTO NOx emissions (−0.9 g/kN). Since optimizing the engine for each mission separately did not produce any significant FB benefit, a multi-objective optimization (MOO) was performed next, in which the target was to simultaneously minimize FB for the very short range and the long range cases. A set of non-dominated solutions (Pareto Front) was obtained (7 points) in which all solutions were achieved by reducing FPR and sFN and increasing BPR. Using the engine designs corresponding to each point in the Pareto Front, all five missions were simulated. Compared to the ATH–BER mission-optimized engine design, there were small (<0.1%) FB savings for the two missions for which the MOO was carried out, but an increase in FB for the other three missions.
Based on the assumptions and simplifications in the implemented models, the imposed performance specifications and technology limits, and without considering explicitly the influence of other important disciplines in the engine-design process (e.g., lifing, costs, noise), the above analyses indicate that for an aircraft operating over a wide range of distances, it is sufficient to optimize engine performance for minimum FB considering only a single, average-distance mission.
3.7. Transient-Performance Assessment
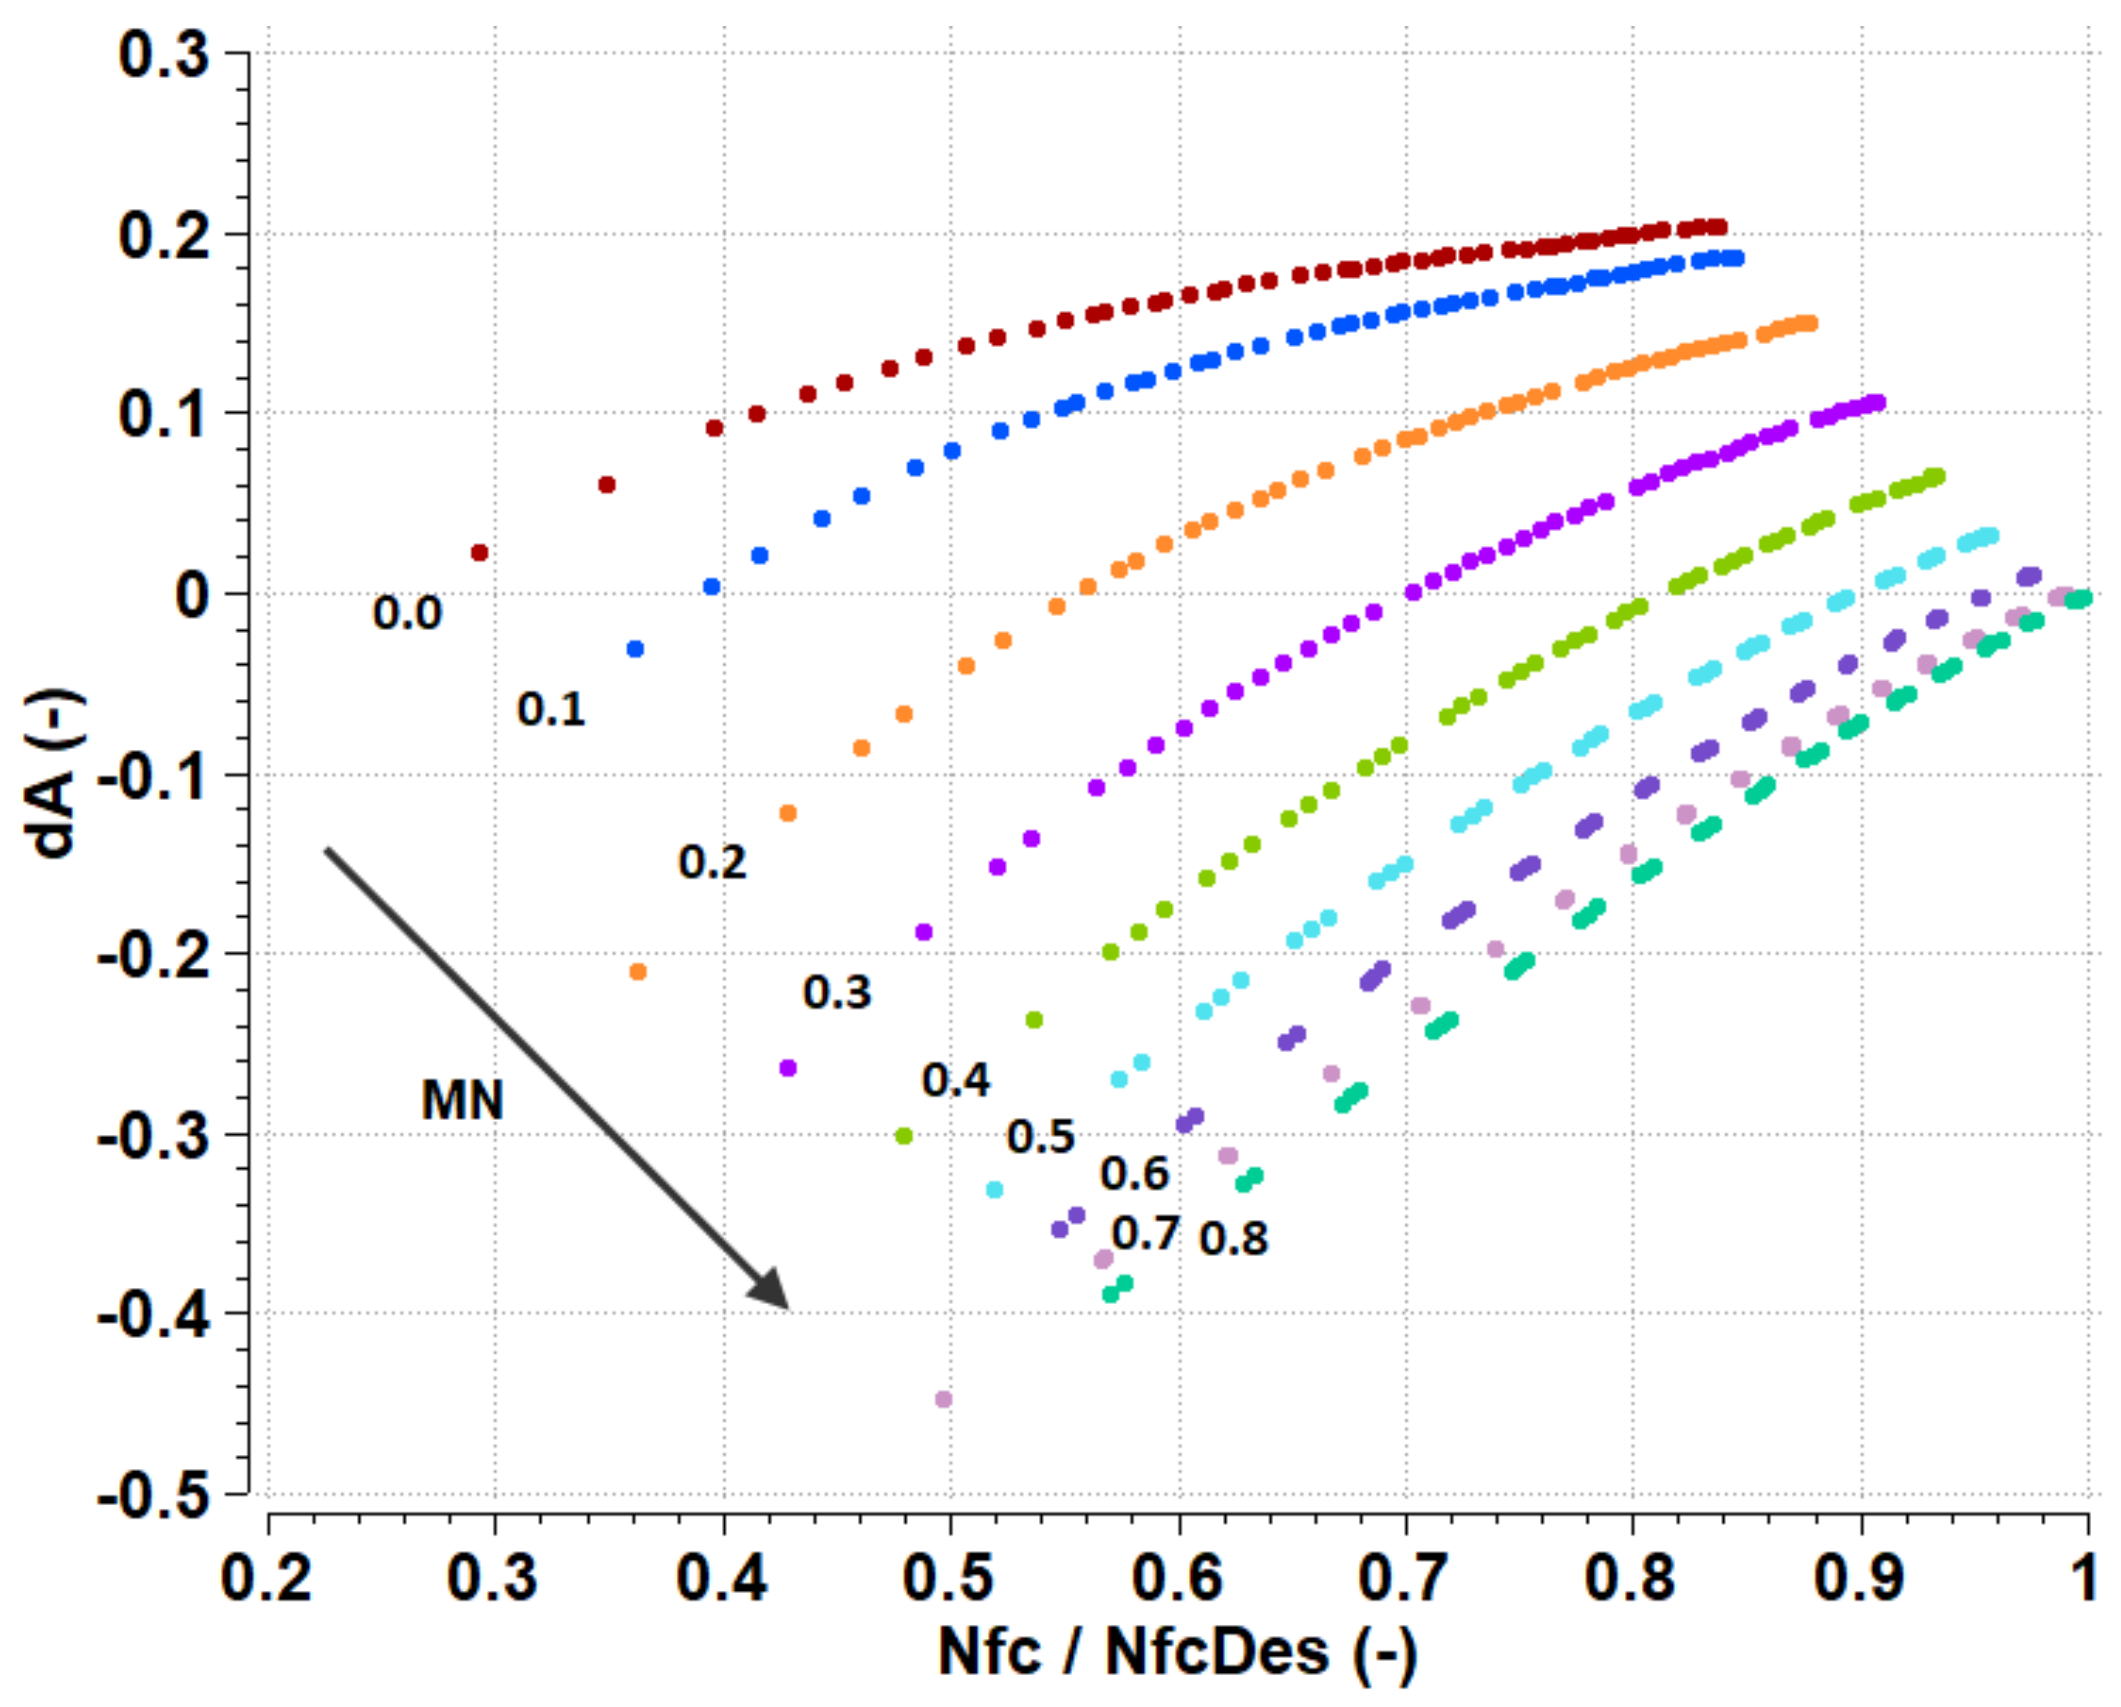
For the bypass stream, a VAN was used to avoid fan stability issues at low flight speeds when the nozzle unchoked and the fan operating line was displaced to reduced mass flows and closer to the surge line. The VAN moved the operating line away from surge, while the fan map (and surge line) was not affected. Specifically, at low flight speeds, the fan nozzle throat area increased to allow more airflow to pass through it, thus moving the fan operating point to higher flow capacities. In addition to extending the fan’s stable operating range, the VAN also provided an additional degree of freedom for engine optimization, at the expense of added weight, mechanical complexity and maintenance cost. Thus a VAN schedule is required that produces a larger area at take-off to provide additional surge margin and a smaller area at cruise for improved performance. The approach proposed in [
54] was implemented, where the VAN area was designed to keep the fan map operating line close to maximum efficiency during steady-state operation. Nf
c was used as the scheduling parameter, representing the power level.
Figure 10 shows the variation of dA (change in nozzle area) with Nf
c relative to design for different values of MN (i.e., the VAN schedule).
In addition to the VAN schedule calculation, the control design FMU module performed automatic linearization of the engine model, calculated the gains of the setpoint and acceleration PI controllers and established an acceleration limiter schedule. The quality of the linearization process (<1% difference) was confirmed by comparing the output variables from a piecewise linear dynamic model (PLDM) with the corresponding nonlinear models, for a square cycle (30 < PLA < 80) at SLS conditions. The PLDM was constructed by connecting together the linear models at each operating point, based on the methodology described in [
55].
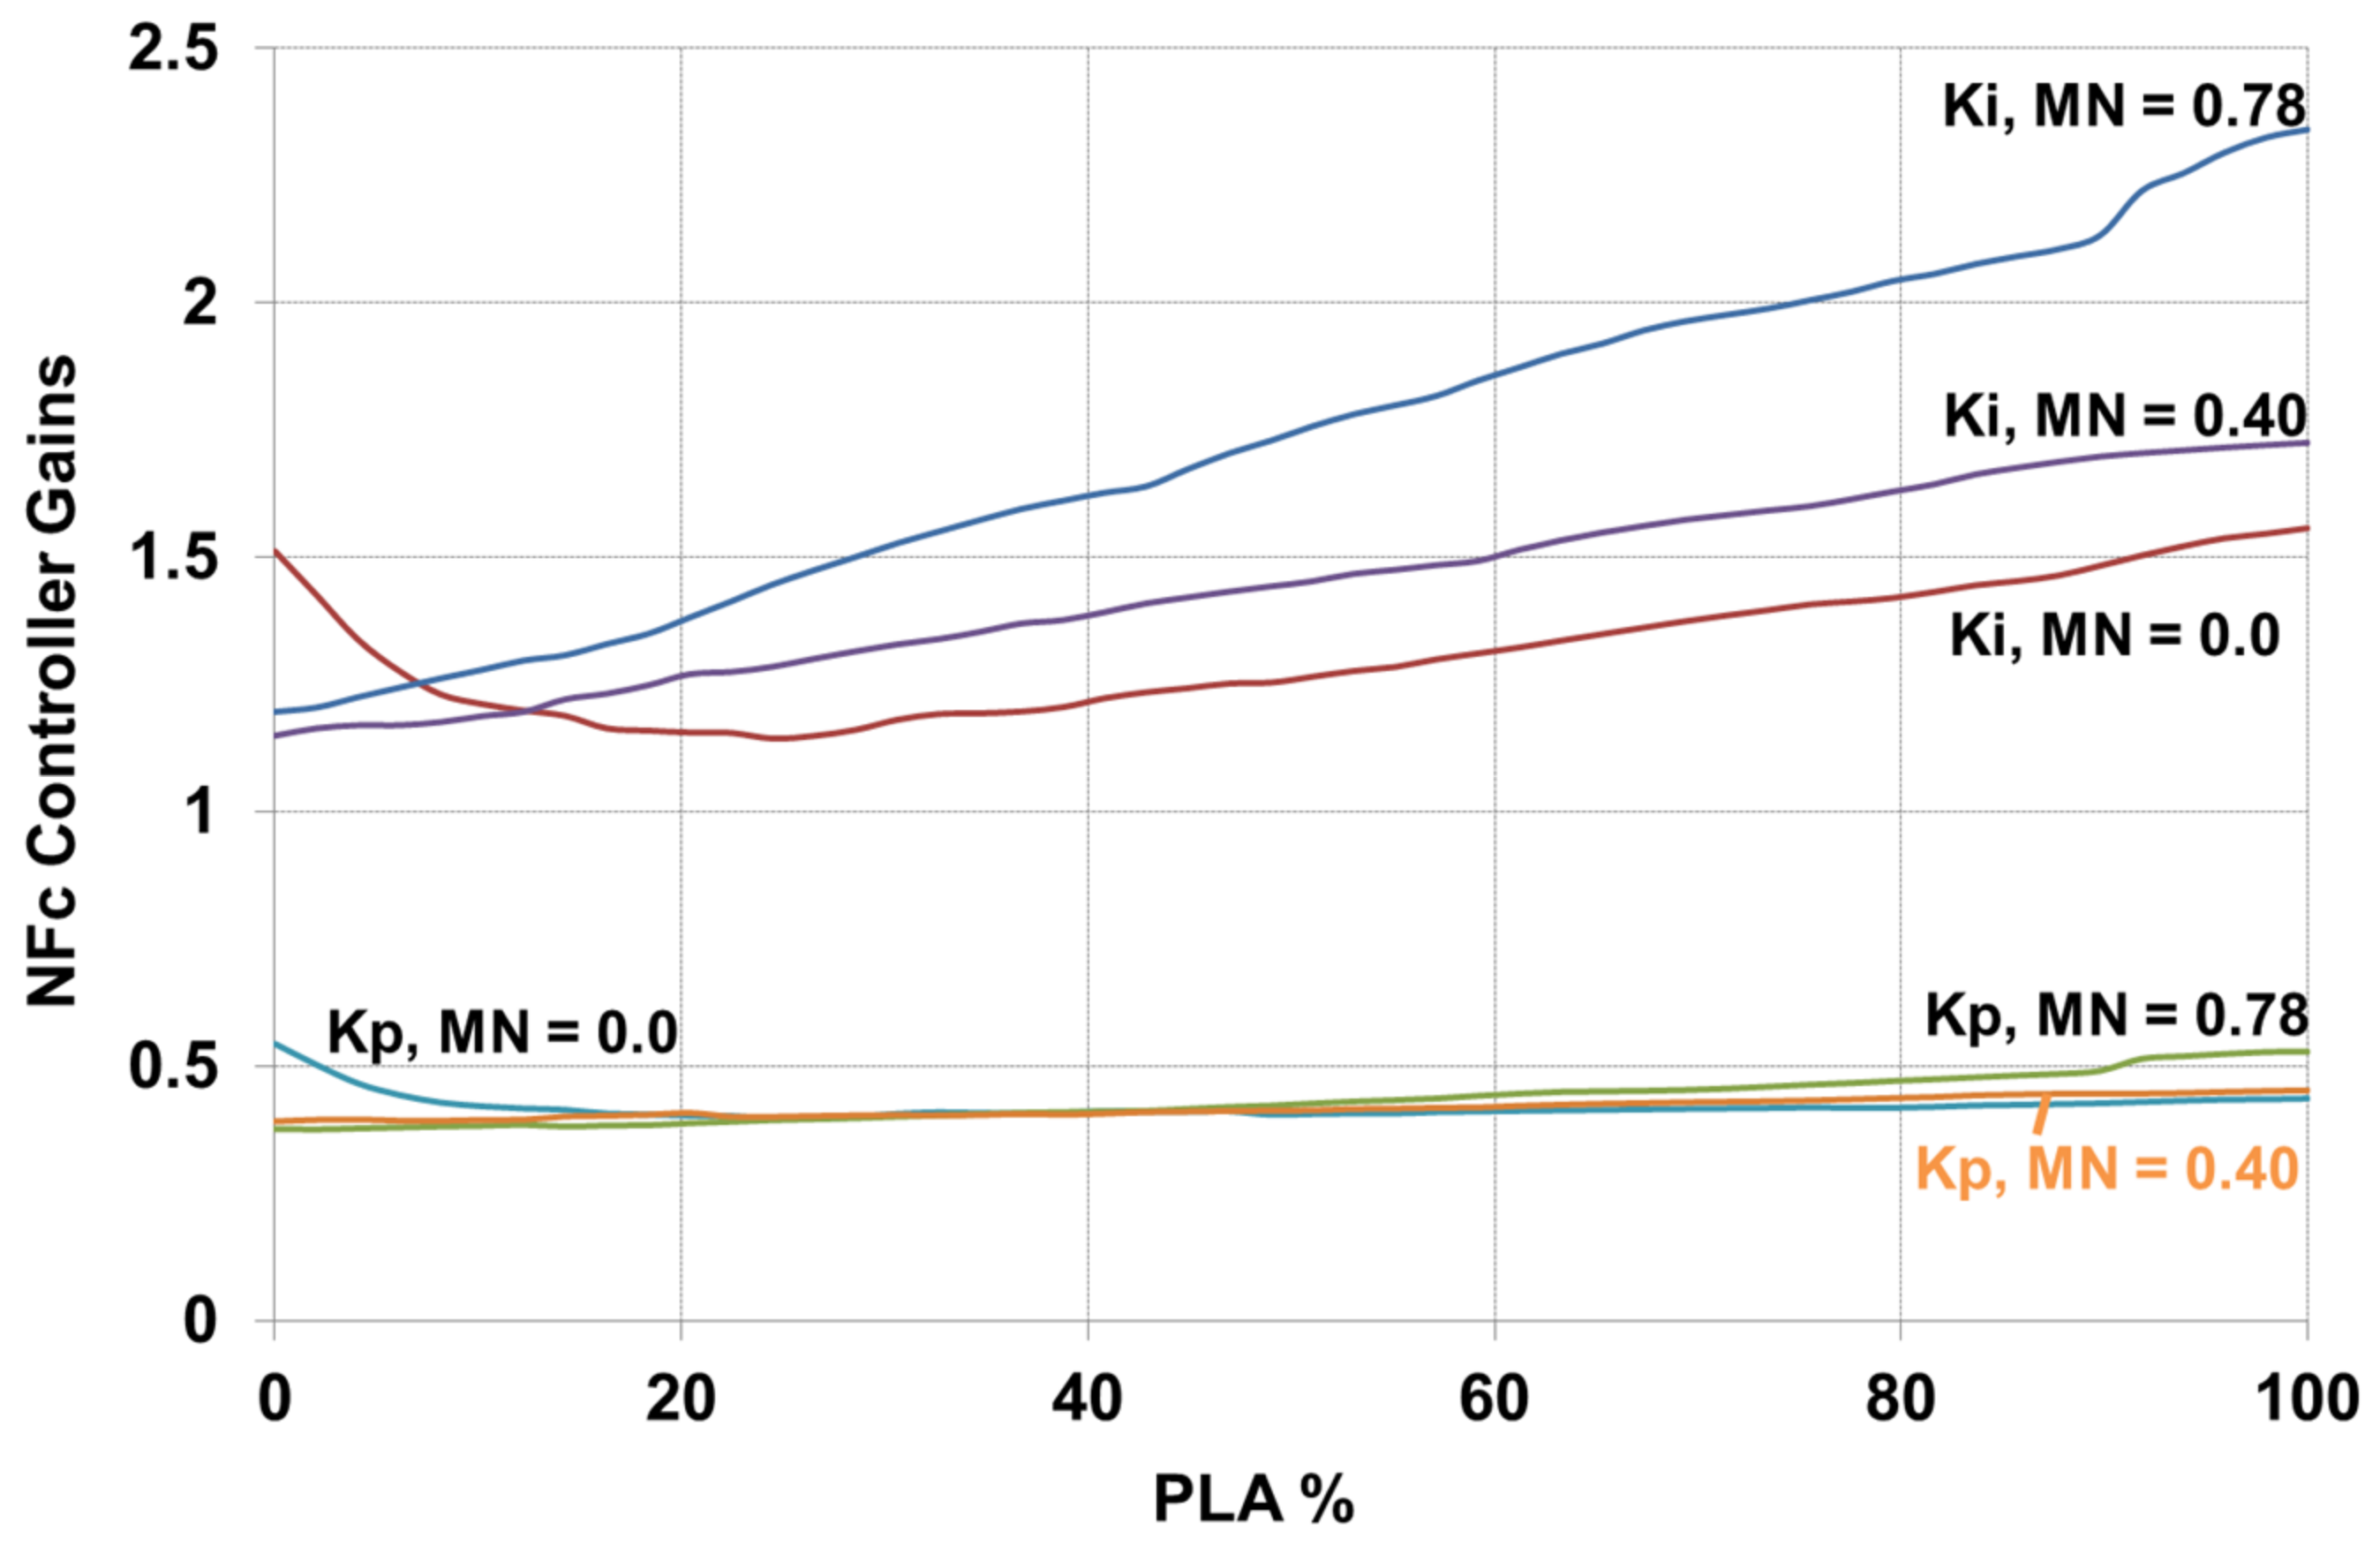
The gain scheduling procedure generated the required 2D tables of the setpoint parameters EPR and Nf
c and the gains (Kp, Ki and IWG) of the setpoint (EPR, Nf
c) and acceleration (CDT) PI controllers in terms of MN and PLA. The importance of gain scheduling is demonstrated in
Figure 11, which presents the variation of Kp and Ki gains of the Nf
c PI controller. Finally, the acceleration schedule was established to keep the operating line on the HPC within a specified surge margin limit. A low limit of 8% was selected in this study due to the significant mismatch between the fan’s low-pressure (>300 kg·m
2) and high-pressure spool inertias (<5 kg·m
2).
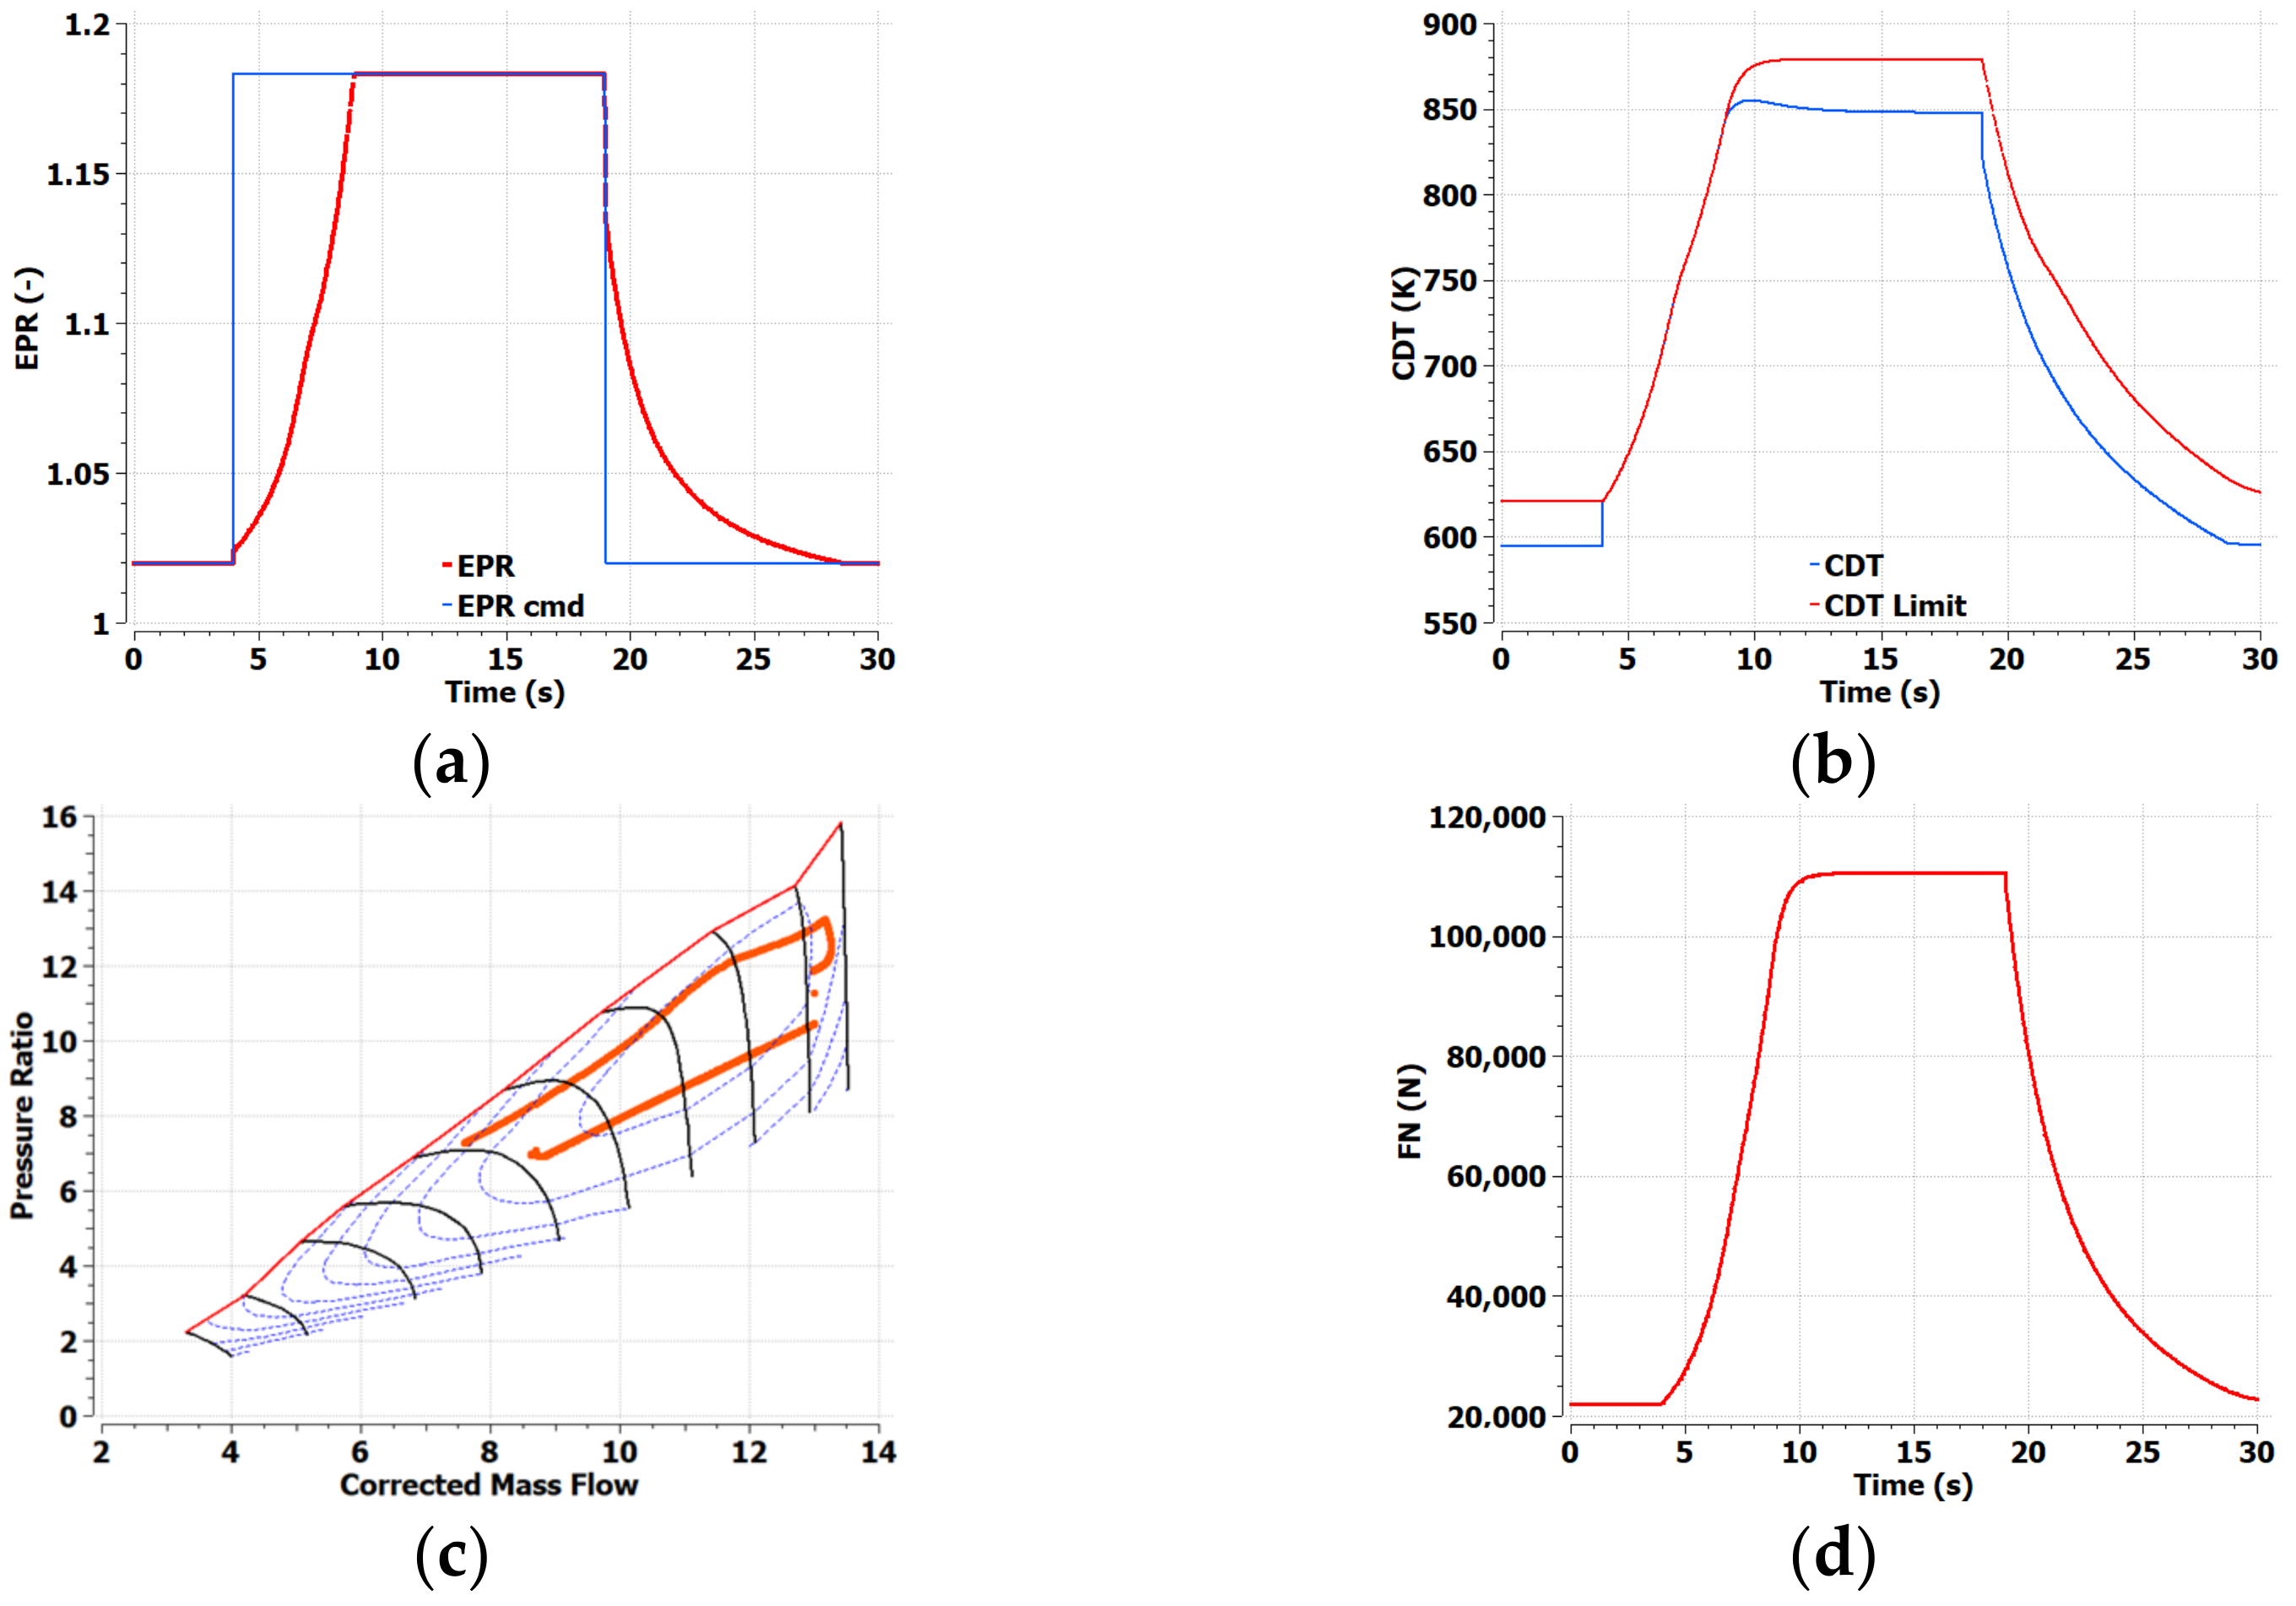
For this engine model and control system, a 30 s square cycle simulation was performed at SLS conditions (initially not considering VAN dynamics), which included both the FAA certification acceleration maneuver and a corresponding deceleration part. During this maneuver, both the acceleration and the deceleration limiters were active during parts of the corresponding phases of the transient simulation. Hence, the actual EPR (setpoint control for this simulation) did not follow the commanded value (
Figure 12a). More specifically, from the start of the acceleration phase, CDT followed the acceleration limiter schedule (
Figure 12b) in order to keep the HPC surge margin above the minimum value of 8% (
Figure 12c). This caused a slower thrust response (
Figure 12d), and as a result, the current engine design does not meet the FAA 5 s rule, albeit by a small margin.
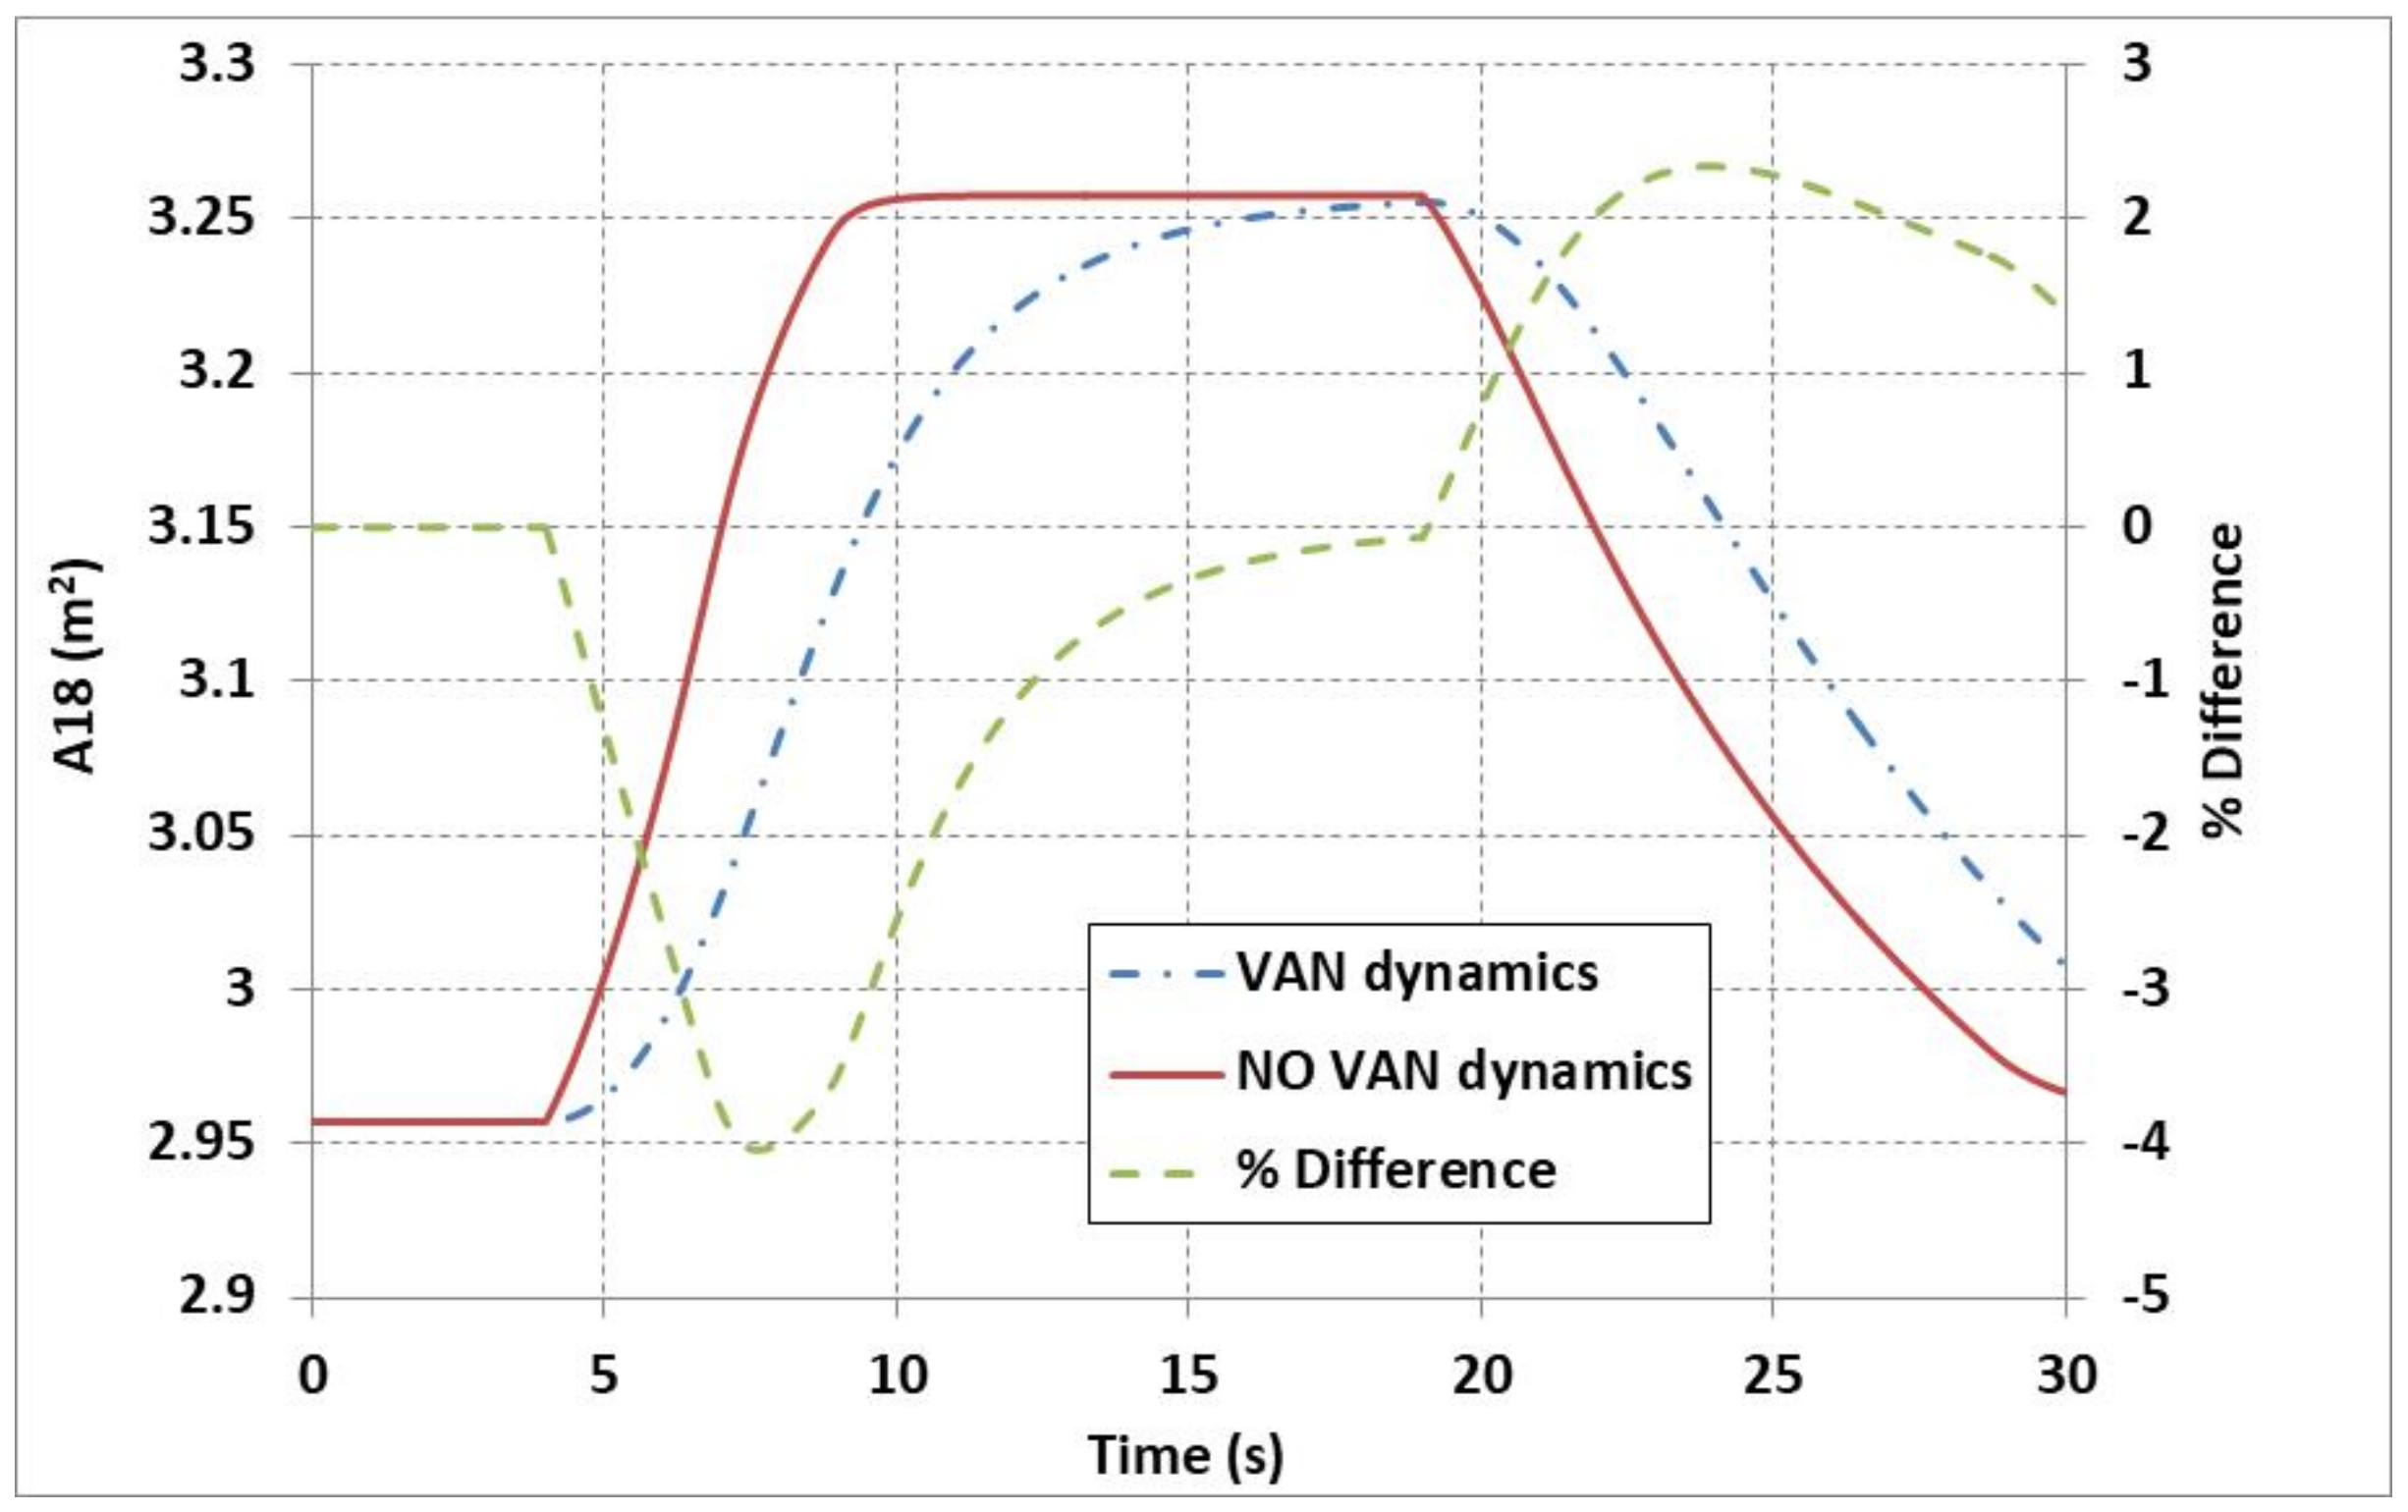
The implementation of a VAN system for this kind of engine is still under research, because the conventional approach of electrical and hydraulic systems is not a feasible solution for civil aviation due to high complexity and weight. A proposed solution is the adoption of shape-memory alloys, whose shape is temperature-dependent. This ability of the alloy is used to control the mechanical system that regulates the movement of a sliding ring that controls the nozzle area pedals [
10]. However, an issue that has arisen is the slow response of this system, which can take 9.8 s from nominal to full stroke displacement and 25 s to again reach the initial state; this system is still under development. To simulate VAN dynamics, a first-order lag approach was used. Based on a settling time of 9.8 s, the time constant used in the relevant actuator component was 2.45 s. Simulating an abrupt square cycle as before, but including VAN dynamics through a first-order lag, delayed the opening and closing of the nozzle, as depicted in
Figure 13. As a consequence, there was a slower thrust response during the transient phases, with a net difference in FN in the order of 1%. The lag also affected the fan operating line by causing a drop in the surge margin during acceleration, since the nozzle area did not open according to the design schedule in order to reduce the pressure ratio.
4. Summary and Conclusions
To quickly and accurately evaluate alternative aero-engine designs, appropriate preliminary design tools are necessary that are capable of capturing the effects of new technologies on engine performance and assess their feasibility in a multi-disciplinary and multi-point operational context.
The framework presented in this paper enables the capability to explore the design space and optimize the performance of virtually any future propulsion concept. Its robustness, flexibility, modularity and extendibility, along with the use of an established state-of-the-art simulation environment, guarantee its long-term applicability. Thus, the developed tool is an ideal platform for collaborative work on assessing innovative engine configurations and can be used by different stakeholders in the aeronautical industry, including aircraft and engine manufacturers, research centers, academia and even governments, for setting up environmental policies or prioritizing research.
The framework developed was used to optimize the design of an ultra-high bypass ratio geared turbofan configuration with a variable-area nozzle, for short/medium-range applications and an EIS-2030. The objective was to minimize the amount of fuel burn, an objective that led to both minimum CO2 production and fuel costs. Optimizations were performed for representative civil aircraft missions (range from 600 to 7500 km). Based on the technology-level assumptions made and the constraints imposed in the design, fuel-burn reduction (and therefore CO2 emissions) in excess of 12% are anticipated, compared to conventional EIS-2016 engines, due to the improvement in engine efficiency.
Our study showed that single- or multi-objective optimization at different mission distances did not lead to designs that bring significant further FB benefits compared to the engine design optimized over an average distance mission.
For this optimum design, a control system was designed that consisted of power-management and protection-logic parts. A square cycle simulation was then performed to test compliance with regulations and to assess the effects of VAN dynamics. The results stressed the importance of evaluating transient performance as early in the engine development phase as possible to avoid costly redesigns later, since, as demonstrated herein, an optimum design in terms of fuel burn may not meet engine-response requirements.
The value of the results obtained from the procedure described here would increase if the underlying calculations are more accurately performed. For example, using a physics-based approach for weight calculation, enhancing the coupling of aerodynamic and performance disciplines through turbomachinery map generation (instead of using generic ones), including additional operational points in the design calculations (e.g., idle), considering additional dynamic effects in transient performance and integrating dynamic system analysis in the overall optimization scheme could be beneficial. The authors’ group is working toward incorporating such improvements.
Author Contributions
Conceptualization, A.A. N.A. and K.M.; methodology, A.A. and N.A.; software, A.A., N.A. and I.K.; validation, A.A., N.A. and I.K.; formal analysis, A.A. and N.A.; investigation, A.A., N.A. and I.K.; resources, A.A. and N.A.; data curation, A.A., N.A., I.K.; writing—original draft preparation, A.A.; writing—review and editing, A.A., N.A. and K.M.; visualization, A.A.; supervision, N.A. and K.M.; project administration, K.M., N.A. and A.A.; funding acquisition, K.M. and A.A. All authors have read and agreed to the published version of the manuscript.
Funding
This project has received funding from the Clean Sky 2 Joint Undertaking under the European Union’s Horizon2020 research and innovation program under Grant Agreement No. 686340, Project “DEMOS–Developing Advanced Engine Multi-disciplinary Optimization Simulations.”
Data Availability Statement
The data presented in this study are available on request from the corresponding author. The data are not publicly available as they are proprietary under Grant Agreement No. 686340 of the European Union’s Horizon 2020 research and innovation program, and under the NTUA’s contractual obligations.
Acknowledgments
The authors are grateful to Airbus Operations SAS, Empresarios Agrupados Internacional (EAI) SA and Cranfield University for their collaboration in the DEMOS project, during which the results presented in this paper have been produced. The help of Fernando Puech Helguero from EAI with FMI in PROOSIS is greatly appreciated.
Conflicts of Interest
The authors declare no conflict of interest.
References
- Jeschke, P.; Kurzke, J.; Schaber, R.; Riegler, C. Preliminary gas turbine design using the multidisciplinary design system MOPEDS. ASME J. Eng. Gas Turbines Power 2004, 126, 258–264. [Google Scholar] [CrossRef]
- Panchenko, Y.; Moustapha, H.; Mah, S.; Patel, K.; Dowhan, M.J.; Hall, D. Preliminary multi-disciplinary optimization in turbomachinery design. In Proceedings of the RTO AVT Symposium, RTO-MP-089, 57/1-22, Paris, France, 22–25 April 2002. [Google Scholar]
- Ogaji, S.O.T.; Pilidis, P.; Sethi, V. Advanced power plant selection: The TERA (techno-economic environmental risk analysis) framework. In Proceedings of the 19th ISABE Conference, ISABE-2009-1115, Montreal, QC, Canada, 7–11 September 2009. [Google Scholar]
- Vieweg, M.; Reitenbach, S.; Hollmann, C.; Schnös, M.; Behrendt, T.; Krumme, A.; Otten, T.; Meier zu Ummeln, R. Collaborative aircraft engine preliminary design using a virtual engine platform, part B: application. In Proceedings of the AIAA Scitech 2020 Forum, AIAA-2020-0124, Orlando, FL, USA, 6–10 January 2020. [Google Scholar] [CrossRef]
- Kirby, M.; Mavris, D. The environmental design space. In Proceedings of the 26th International Congress of the Aeronautical Sciences, ICAS-2008-4.7.3, Anchorage, AK, USA, 14–19 September 2008. [Google Scholar]
- GasTurb. Available online: http://www.gasturb.de/ (accessed on 28 January 2021).
- Gas Turbine Simulation Program. Available online: http://www.gspteam.com/ (accessed on 28 January 2021).
- GitHub-Nasa/T-MATS. Available online: http://www.github.com/nasa/T-MATS/ (accessed on 28 January 2021).
- Kyprianidis, K.G.; Colmenares Quintero, R.F.; Pascovici, D.S.; Ogaji, S.O.T.; Pilidis, P.; Kalfas, A.I. EVA: A tool for environmental assessment of novel propulsion cycles. In Proceedings of the ASME Turbo Expo 2008, GT2008-50602, Berlin, Germany, 9–13 June 2008. [Google Scholar] [CrossRef]
- Csank, J.T.; Thomas, G.L. Dynamic analysis for a geared turbofan engine with variable area fan nozzle. In Proceedings of the 53rd AIAA/SAE/ASEE Joint Propulsion Conference, AIAA 2017-4819, Atlanta, GA, USA, 10–12 July 2017. [Google Scholar] [CrossRef]
- Vieweg, M.; Wolters, F.; Reitenbach, S.; Hollmann, C.; Becker, R.-G. Multi-disciplinary tool coupling for the determination of turbofan transients during preliminary design. In Proceedings of the ASME Turbo Expo 2019, GT2019-91402, Phoenix, AZ, USA, 17–21 June 2019. [Google Scholar] [CrossRef]
- EcosimPro|PROOSIS Modelling and Simulation Software. Available online: http://www.proosis.com/ (accessed on 28 January 2021).
- Final Report Summary—VIVACE (Value Improvement through a Virtual Aeronautical Collaborative Enterprise). European Commission. Available online: https://cordis.europa.eu/result/rcn/47814_en.html (accessed on 28 January 2021).
- Roumeliotis, I.; Alexiou, A.; Aretakis, N.; Sieros, G.; Mathioudakis, K. Development and integration of rain ingestion effects in engine performance simulations. ASME J. Eng. Gas Turbine Power 2014, 137, 041202. [Google Scholar] [CrossRef]
- Jacob, F.; Rolt, A.M.; Sebastiampillai, J.M.; Sethi, V.; Belmonte, M.; Cobas, P. Performance of a supercritical CO2 bottoming cycle for aero applications. J. Appl. Sci. 2017, 7, 255. [Google Scholar] [CrossRef] [Green Version]
- Templalexis, I.; Alexiou, A.; Pachidis, V.; Roumeliotis, I.; Aretakis, N. Direct coupling of a two-dimensional fan model in a turbofan engine performance simulation. In Proceedings of the ASME Turbo Expo 2016, GT2016-56617, Seoul, Korea, 13–17 June 2016. [Google Scholar] [CrossRef]
- Pilet, J.; Lecordix, J.-L.; Garcia-Rosa, N.; Barènes, R.; Lavergne, G. Towards a fully coupled component zooming approach in engine performance simulation. In Proceedings of the ASME Turbo Expo 2011, GT2011-46320, Vancouver, BC, Canada, 6–10 June 2011. [Google Scholar] [CrossRef]
- Becker, R.; Schaefer, M.; Reitenbach, S. Assessment of the efficiency gains introduced by novel aero engine concepts. In Proceedings of the 21st ISABE Conference, ISABE-2013-1720, Busan, Korea, 9–13 September 2013. [Google Scholar]
- Larsson, L.; Gronstedt, T.; Kyprianidis, K.G. Conceptual design and mission analysis for a geared turbofan and an open rotor configuration. In Proceedings of the ASME Turbo Expo 2011, GT2011-46451, Vancouver, BC, Canada, 6–10 June 2011. [Google Scholar] [CrossRef]
- Guynn, M.D.; Berton, J.J.; Tong, M.J.; Haller, W.J. Advanced single-aisle transport propulsion design options revisited. In Proceedings of the 2013 Aviation Technology, Integration, and Operations Conference, AIAA-2013-4330, Los Angeles, CA, USA,, 12–14 August 2013. [Google Scholar] [CrossRef] [Green Version]
- Alexiou, A. Introduction to Gas Turbine Modelling With PROOSIS, 4th ed.; Empresarios Agrupados International (EAI) S.A.: Madrid, Spain, 2020. [Google Scholar]
- Alexiou, A.; Aretakis, N.; Roumeliotis, I.; Kolias, I.; Mathioudakis, K. Performance modelling of an ultra-high bypass ratio geared turbofan. In Proceedings of the 23rd ISABE Conference, ISABE-2009-22512, Manchester, UK, 3–8 September 2017. [Google Scholar]
- Kolias, I.; Alexiou, A.; Aretakis, N.; Mathioudakis, K. Direct integration of axial turbomachinery preliminary aerodynamic design calculations in engine performance component models. In Proceedings of the ASME Turbo Expo 2018, GT2018-76494, Oslo, Norway, 11–15 June 2018. [Google Scholar] [CrossRef]
- Athanasakos, G.; Aretakis, N.; Alexiou, A.; Mathioudakis, K. Turboelectric distributed propulsion modelling accounting for fan boundary layer ingestion and inlet distortion. In Proceedings of the ASME Turbo Expo 2020, GT2020-14621, Virtual Conference, 21–25 September 2020. [Google Scholar]
- Alexiou, A.; Frantzis, C.; Aretakis, N.; Riziotis, V.; Roumeliotis, I.; Mathioudakis, K. Contra-rotating propeller modelling for open rotor engine performance simulations. In Proceedings of the ASME Turbo Expo 2016, GT2016-56645, Seoul, Korea, 13–17 June 2016. [Google Scholar] [CrossRef]
- Alexiou, A.; Roumeliotis, I.; Aretakis, N.; Tsalavoutas, A.; Mathioudakis, K. Modelling contra-rotating turbomachinery components for engine performance simulations: The geared turbofan with contra-rotating core case. J. Eng. Gas Turbine Power 2012, 134, 111701. [Google Scholar] [CrossRef]
- Alexiou, A.; Aretakis, N.; Roumeliotis, I.; Mathioudakis, K. Short and long range mission analysis for a geared turbofan with active core technologies. In Proceedings of the ASME Turbo Expo 2010, GT2010-22701, Glasgow, UK, 14–18 June 2010. [Google Scholar] [CrossRef]
- Functional Mock-Up Interface. Available online: https://fmi-standard.org/ (accessed on 28 January 2021).
- Raymer, D.P. Aircraft Design: A Conceptual Approach, 2nd ed.; AIAA: Washington, DC, USA, 1992; ISBN 0-930403-51-7. [Google Scholar]
- Mattingly, J.D.; Heiser, W.H.; Pratt, D.T. Aircraft Engine Design; AIAA: Reston, VA, USA, 2002; ISBN 1-56347-538-3. [Google Scholar]
- Tong, M.T.; Thurman, D.R.; Guynn, M.D. Conceptual design study of an advanced technology open rotor propulsion system. In Proceedings of the 20th ISABE Conference, ISABE-2011-1311, Gothenburg, Sweden, 12–16 September 2011. [Google Scholar]
- Jones, S.M.; Haller, W.J.; Tong, M.T. An N+3 Technology Level Reference Propulsion System; TM–2017–219501; NASA: Cleveland, OH, USA, 2017. [Google Scholar]
- Kelaidis, M.; Aretakis, N.; Tsalavoutas, A.; Mathioudakis, K. Optimal mission analysis accounting for engine aging and emissions. ASME J. Eng. Gas Turbines Power 2009, 131, 011201. [Google Scholar] [CrossRef]
- Katsikogiannis, D.; Thoma, M.; Mathioudakis, K.; Aretakis., N.; Alexiou, A. Optimal civil aircraft missions exploiting free routing possibilities. In Proceedings of the 9th EASN International Conference, 05004, Athens, Greece, 3–6 September 2019. [Google Scholar] [CrossRef]
- Nuic, A. User Manual for the Base of Aircraft Data (BADA), Revision 3.9; 11/03/08-08; EUROCONTROL: Brussels, Belgium, 2011. [Google Scholar]
- Richter, H. Advanced Control of Turbofan Engines; Springer: New York, NY, USA, 2011; ISBN 978-1-4614-1171-0. [Google Scholar]
- Electronic Code of Federal Regulations. Available online: https://www.ecfr.gov/cgi-bin/text-idx?SID=aa3a99819fbf162f142eee0ec759f8df&mc=true&node=se14.1.33_173&rgn=div8 (accessed on 28 January 2021).
- Cumpsty, N.; Mavris, D.; Kirby, M. Aviation and the Environment: Outlook. In ICAO Report Doc 10127, Independent Expert Integrated Technology Goals Assessment and Review for Engines and Aircraft; International Civil Aviation Organization: Montreal, QC, Canada, 2019; pp. 24–37. [Google Scholar]
- Cumpsty, N. Preparing for the future: Reducing gas turbine environmental impact. In Proceedings of the ASME Turbo Expo 2009, GT2009-60367, Orlando, FL, USA, 8–12 June 2009. [Google Scholar] [CrossRef]
- Walsh, P.P.; Fletcher, P. Gas Turbine Performance, 2nd ed.; Blackwell Publishing: Oxford, UK, 2004; ISBN 063206434X. [Google Scholar]
- Felder, J.L.; Kim, H.D.; Brown, G.V.; Chu, J. An examination of the effect of boundary layer ingestion on turboelectric distributed propulsion systems. In Proceedings of the 49th AIAA Aerospace Sciences Meeting, AIAA-2011-300, Orlando, FL, USA, 4–7 January 2011. [Google Scholar] [CrossRef] [Green Version]
- Wilcock, R.C.; Young, J.B.; Horlock, J.H. The effect of turbine blade cooling on the cycle efficiency of gas turbine power cycles. ASME J. Eng. Gas Turbines Power 2005, 127, 109–120. [Google Scholar] [CrossRef]
- Aretakis, N.; Roumeliotis, I.; Alexiou, A.; Romesis, C.; Mathioudakis, K. Turbofan engine health assessment from flight data. ASME J. Eng. Gas Turbine Power 2014, 137, 041203. [Google Scholar] [CrossRef]
- Ingber, L. Simulated annealing: Practice versus theory. J. Math. Comput. Model. 1993, 18, 29–57. [Google Scholar] [CrossRef] [Green Version]
- Kyriacou, S.A.; Asouti, V.G.; Giannakoglou, K.C. Efficient PCA-driven EAs and metamodel-assisted EAs, with applications in turbomachinery. J. Eng. Optim. 2014, 46, 895–911. [Google Scholar] [CrossRef]
- Nelder, J.A.; Mead, R. A simplex method for function minimization. Comput. J. 1965, 7, 308–313. [Google Scholar] [CrossRef]
- Bijewitz, J.; Seitz, A.; Hornung, M. Architectural comparison of advanced ultra-high bypass ratio turbofans for medium to long range applications. In Proceedings of the Deutscher Luft- und Raumfahrtkongress, 340105, Augsburg, Germany, 16–18 September 2014. [Google Scholar]
- Epstein, A.H. Aeropropulsion for commercial aviation in the twenty-first century and research directions needed. J. AIAA 2014, 52. [Google Scholar] [CrossRef]
- Ivey, M.S. The impact of bypass ratio on the performance of future civil aero engines. In Proceedings of the IMechE Aerotech 89 Conference, Seminar 15, Birmingham, UK, 31 October–3 November 1989. [Google Scholar]
- International Civil Aviation Organization. Committee on Aviation Environmental Protection. Report of the 8th Meeting; ICAO: Montréal, QC, Canada, 2010; ISBN 978-92-9231-588-7. [Google Scholar]
- ICAO Aircraft Engine Emissions Databank|EASA. Available online: https://www.easa.europa.eu/domains/environment/icao-aircraft-engine-emissions-databank#group-easa-downloads (accessed on 28 January 2021).
- McKay, M.; Beckman, R.; Conover, W. A comparison of three methods for selecting values of input variables in the analysis of output from a computer code. J. Technometrics 1979, 21, 239–245. [Google Scholar] [CrossRef]
- ANALYSIS: What Operators Have to Say About the A320neo|Analysis|Flight Global. Available online: https://www.flightglobal.com/analysis/analysis-what-operators-have-to-say-about-the-a320neo/130587.article (accessed on 17 November 2020).
- Chapman, J.W.; Litt, J.S. Control design for an advanced geared turbofan engine. In Proceedings of the 53rd AIAA/SAE/ASEE Joint Propulsion Conference, AIAA 2017-4820, Atlanta, GA, USA, 10–12 July 2017. [Google Scholar] [CrossRef] [Green Version]
- Kulikov, G.G.; Thompson, H.A. Dynamic Modelling of Gas Turbines: Identification, Simulation, Condition Monitoring and Optimal Control; Springer: London, UK, 2004; ISBN 978-1-4471-3796-2. [Google Scholar]
| Publisher’s Note: MDPI stays neutral with regard to jurisdictional claims in published maps and institutional affiliations. |
© 2021 by the authors. Licensee MDPI, Basel, Switzerland. This article is an open access article distributed under the terms and conditions of the Creative Commons Attribution (CC BY) license (http://creativecommons.org/licenses/by/4.0/).


