
Sensitivity Analysis of Maximum Circulation of Wake Vortex Encountered by En-Route Aircraft


Division of Aerospace Engineering, Department of Physics, Universitat Politècnica de Catalunya (UPC BarcelonaTECH), c/Esteve Terradas 7, 08860 Castelldefels, Spain
*
Authors to whom correspondence should be addressed.
Aerospace 2021, 8(7), 194; https://0-doi-org.brum.beds.ac.uk/10.3390/aerospace8070194
Submission received: 1 June 2021
/
Revised: 12 July 2021
/
Accepted: 14 July 2021
/
Published: 16 July 2021
(This article belongs to the Special Issue Aircraft Operations and CNS/ATM)
Abstract
:Wake vortex encounters (WVE) can pose significant hazard for en-route aircraft. We studied the sensitivity of wake vortex (WV) circulation and decay to aircraft mass, altitude, velocity, density, time of catastrophic wake demise event, eddy dissipation rate, wing span, span-wise load factor, and WV core radius. Then, a tool was developed to compute circulations of WV generated/encountered by aircraft en-route, while disregarding unrealistic operational conditions. A comprehensive study is presented for most aircraft in the Base of Aircraft Data version 4.1 for different masses, altitudes, speeds, and separation values between generator and follower aircraft. The maximum WV circulation corresponds to A380-861 as generator: 864 and 840 m2/s at horizontal separation of 3 and 5 NM, respectively. In cruise environment, these WV may descend 1000 ft in 2.6 min and 2000 ft in 6.2 min, while retaining 74% and 49% of their initial strength, respectively. The maximum circulation of WV encountered by aircraft at horizontal separation of 3 NM from an A380-861 is 593, 726, and 745 m2/s, at FL200, FL300, and FL395, respectively. At 5 NM, the circulations decrease down to 578, 708, and 726 m2/s. Our results allow reducing WVE simulations only to critical scenarios, and thus perform more efficient test programs for computing aircraft upsets en-route.
1. Introduction
Wake vortices (WV) are produced by flying aircraft and may persist in the atmosphere for several minutes [1]. The hazards associated with WV encounters (WVE) have been thoroughly analyzed for aircraft on approach and departure phases [2,3,4,5,6,7,8], but for several reasons WVE en-route used to receive less attention, regardless the atmospheric conditions are often favorable for WV to remain strong for a long time, mainly because the natural atmospheric turbulence is generally low at cruise altitudes [9,10]. A first reason was that, when cruising, much altitude is available for recovery from strong WVE, which contributed to the perception that WVE do not pose a hazard. Secondly, the probability of severe WVE en-route is significantly lower than the probability of a similar situation when sequencing and merging arrival traffic flows in terminal airspace, or when giving take-off clearances in airports. Finally, since large WV-induced rolling deviations are extremely rare during cruise, and extreme vertical load variations can be attributed to many atmospheric irregularities such as clear air turbulence, a WV hazard was often believed not to exist at cruise [11].
Although the current rate of reported incidents related to WVE at en-route altitudes may be low, the problem of WVE en-route has received increasing attention in the last decade. This is due to the fact that WVE have become more frequent [1] and they will probably increase in the near future due to the expected evolution of the main factors contributing to WVE risk en-route (the characteristics of the generator and follower aircraft, encounter geometry, and tropopause altitude [12]) and other issues [13]: a growing amount of traffic in a very limited airspace (optimal cruise altitudes for the majority of jet aircraft lie in a rather thin layer around the tropopause); an increasing disparity in the size of aircraft cruising at the same level (with the irruption, for instance, of business jets) [14]; and the actual trend of reduction of aircraft separations thanks to the enhanced accuracy of navigation systems [10]. Particularly, the Single European Sky Air Traffic Management (ATM) Research program (SESAR program) and NextGen program aim at increasing airspace capacity and will indeed modify how air traffic is organized in Europe and the USA, respectively, affecting the risk of hazardous WVE [15].
Therefore, while only 26 incidents were reported in the upper European airspace during the period 2009–2012, severe WVE could be expected in upper airspace once every 38 days [12]. Passengers and crew have already suffered serious injuries in this type of incidents due to the violent roll and pitch angle accelerations and variations, and normal accelerations [10], as occurred, for example, on 7 January 2017, when the WV of an Airbus A380-800 sent a Canadair Challenger 604 business (Bombardier Aerospace, Montreal, QB, Canada) into uncontrolled roll and descent, over the Arabian Sea [16]. Moreover, the severity of these incidents might as well increase, especially if WV are not accounted for, considering that aircraft are generally not separated from each other’s wake turbulence in cruise phase, unlike in approach and departure [1,10].
Given this growing evidence that WVE can pose significant hazard for en-route aircraft, there is dire concern about the need to address this issue. Proposals are being suggested to reduce the risk/severity of en-route WVE, based on recognition, anticipation, and best practices. The purpose is that air traffic control officers (ATCO) and pilots can anticipate WVE and avoid or mitigate them [1,12]. In this work, the first objective was to study the sensitivity of WV circulation, decay, and vertical transport to several parameters such as aircraft mass, altitude, true airspeed (TAS), etc. The second objective was to develop a tool to compute the circulations of WV generated/encountered by aircraft en-route. The third objective was to use the tool to compute the maximum possible circulation of WV generated and encountered by multiple aircraft in a comprehensive set of en-route scenarios, using current air traffic separation standards, including reduced vertical separation minima (RVSM), and smaller separations. In all these computations, unrealistic cruise operational conditions (i.e., impossible combinations of aircraft mass, TAS, and cruise altitude) were disregarded, based on aircraft performance information available in EUROCONTROL’s Base of Aircraft Data (BADA) version 4.1 [17].
An ultimate goal would be that, thanks to the WV circulations from this work, the most severe upsets on aircraft due to en-route WVE could be evaluated by other researchers in terms of induced aircraft attitude deviations (i.e., rolling and pitching moments), and variations of lift, load factor, TAS, and altitude, allowing for computation of the roll and sink rates, pitch and bank angles, etc., as a function of time [3,18,19,20,21]. In safety assessment studies, if using only the realistic worst-case circulations obtained from the tool presented in this work, the number of WVE simulations can be reduced to critical scenarios. Thus, the tool allows performing more efficient test and validation programs. From this, and after establishing objective severity criteria and target safety levels, pilots can assess objectively (and subjectively) the WVE severity [12]. This is key because the current separation standards used in en-route airspace (5 NM horizontally and 1000 ft vertically in RVSM environment with radar control [1]) may be over-conservative in some cases (allowing for reduction of separation minima, potentially leading to significant increase in airspace capacity), whereas they may not be protecting sufficiently the traffic against WV hazards in other situations [20]. Thus, as in the RECAT-EU [3] and R-WAKE projects [20], our research helps studying the safety of current and potential future separation standards, contributing towards more flexible and dynamic aircraft separation paradigms.
After this Introduction, Section 2 presents the theory on WV modeling relevant to this work. Then, Section 3 shows the sensitivity analyses and Section 4 the development of the circulation generator module and the results obtained with this tool. Finally, Section 5 lists the main findings and conclusions from this research.
2. Modeling of Wake Vortex
The wake generated by aircraft forms a WV system composed of two counter-rotating vortices. According to the Kutta-Joukowsky theorem, for a generator aircraft in level flight, their initial circulation is:
where is the gravity acceleration, is the air density, and , , and b are the mass, TAS, and wing span of the generator aircraft, respectively, and is the span-wise load factor: the ratio between the initial lateral spacing between the vortices and .
The vortices sink due to the mutually induced velocity, and also experience lateral motion (called transport), depending on the prevailing wind. The lift distribution and mass of the generator aircraft have a significant influence on this trajectory. Particularly, the initial WV is formed about 10 wing spans behind the aircraft and then starts descending and decaying [21], i.e., the WV circulation decreases with time, starting from . The decay and descent rates depend mainly on the wind shear, atmospheric turbulence, and thermal stratification [10,22,23]. The latter is the atmospheric condition that causes the greatest effect on the WV evolution, and is frequently described by the Brunt-Väisälä frequency [12,24]:
where is the potential temperature, is the potential temperature lapse rate, and is the altitude. Higher is associated with higher stability and buoyancy force acting on the WV, which causes faster WV decay rate [12]. is generally higher in the stratosphere than the troposphere. Moreover, an increase in the tropopause altitude due to global warming has been reported [25]. This is concerning since the probability of WVE is usually larger in the troposphere [1], i.e., from sea level (SL) to the tropopause, usually at around 11 km at medium latitudes. In addition, the severity of the WVE increases for increasing tropopause altitude [12]. Thus, works such as the present research, focused on WVE in en-route phase, will become increasingly important.
Unfortunately, there is a lack of validated WV decay models for cruise flight. This is why Luckner and Reinke [21] used Sarpkaya’s decay model although it has only been tested against measurements at low altitudes, leaving uncertainty regarding its applicability at cruise altitudes. Namely, researchers claimed that additional efforts should be directed at improving WV models for en-route applications after observing that the WV descent rate was in one case probably much higher than predicted by the model [12]. Anyway, the decay in Sarpkaya’s model affects only the effective WV circulation [26]:
where is time and is the time of the catastrophic wake demise event. This model does not account for the effect of stratification on WV decay, which can be neglected for low stratification levels of the atmosphere [21], as usual below the tropopause [10]. Conversely, the eddy dissipation rate (EDR) has a significant effect on , given a normalized EDR and a normalized time of catastrophic wake demise event :
the relation between both variables is , for or which is most interesting for our work, given the typical values of [27]:
For modeling the decay, researchers have also used a Betz WV model based on far field conservation principles, modified with an empirically based core size [28], and the probabilistic/deterministic two-phase WV transport and decay model (P2P/D2P), describing WV decay and transport based on atmospheric conditions [29,30,31]. In particular, P2P/D2P describes the vortex decay and descent through two consecutive decay phases, following large eddy simulation (LES) results [32,33]. In the first phase (the diffusion phase), the normalized circulation as a function of the non-dimensional time is [31]:
while in the second phase (the rapid decay phase), it is [31]:
In the P2P/D2P model, is the average over circles of radii from 5 to 15 m, . The characteristic decay parameters (i.e., , , , , , and ) are shown in [31] as a function of atmospheric conditions (e.g., and ), where applicable (see details later on). The dependency of on for null for the mentioned LES data is also shown, together with a model by Sarpkaya relating with for null .
The velocities induced by the WV on the flow field can be obtained by superimposing the two single vortices (left and right vortices, which are assumed to have identical circulation but of opposite direction [21]), using the tangential velocity model of Burnham-Hallock [34], based on [35], which yields good results [21,36,37,38]:
where is the radial distance from the WV center line and is the WV core radius. The WV sink rate can be computed based on Equation (10) by imposing [21]:
Integrating Equation (11), we obtain the WV altitude descent (or sinking) with time [21]:
3. Sensitivity Analyses
Sensitivity analyses were done on the effect on WV circulation, decay and sinking of variations of several parameters [20]. From the propagation theory, the sensitivity of a parameter to variations of a parameter is:
If we analyze the sensitivity of to changes in generator aircraft mass , it appears from Equations (1) and (13) that a variation of a given order of magnitude in causes a variation of of the same order of magnitude. However, if we consider that, in levelled rectilinear horizontal flight, the aircraft lift is:
where is the wing lay-out area and is the lift coefficient, then, changes in would propagate into changes of half as large:
A previous work reports that variations in propagate not directly into exactly the same variations of but into slightly smaller variations [21]. We arrive to similar results if in the previous equations we assume a linear relationship between and as in [39], i.e., , obtained using data from [40] (a similar approach is followed in [36], where a functional relation is established between the MTOW and various aircraft parameters, such as , based on data of existing aircraft):
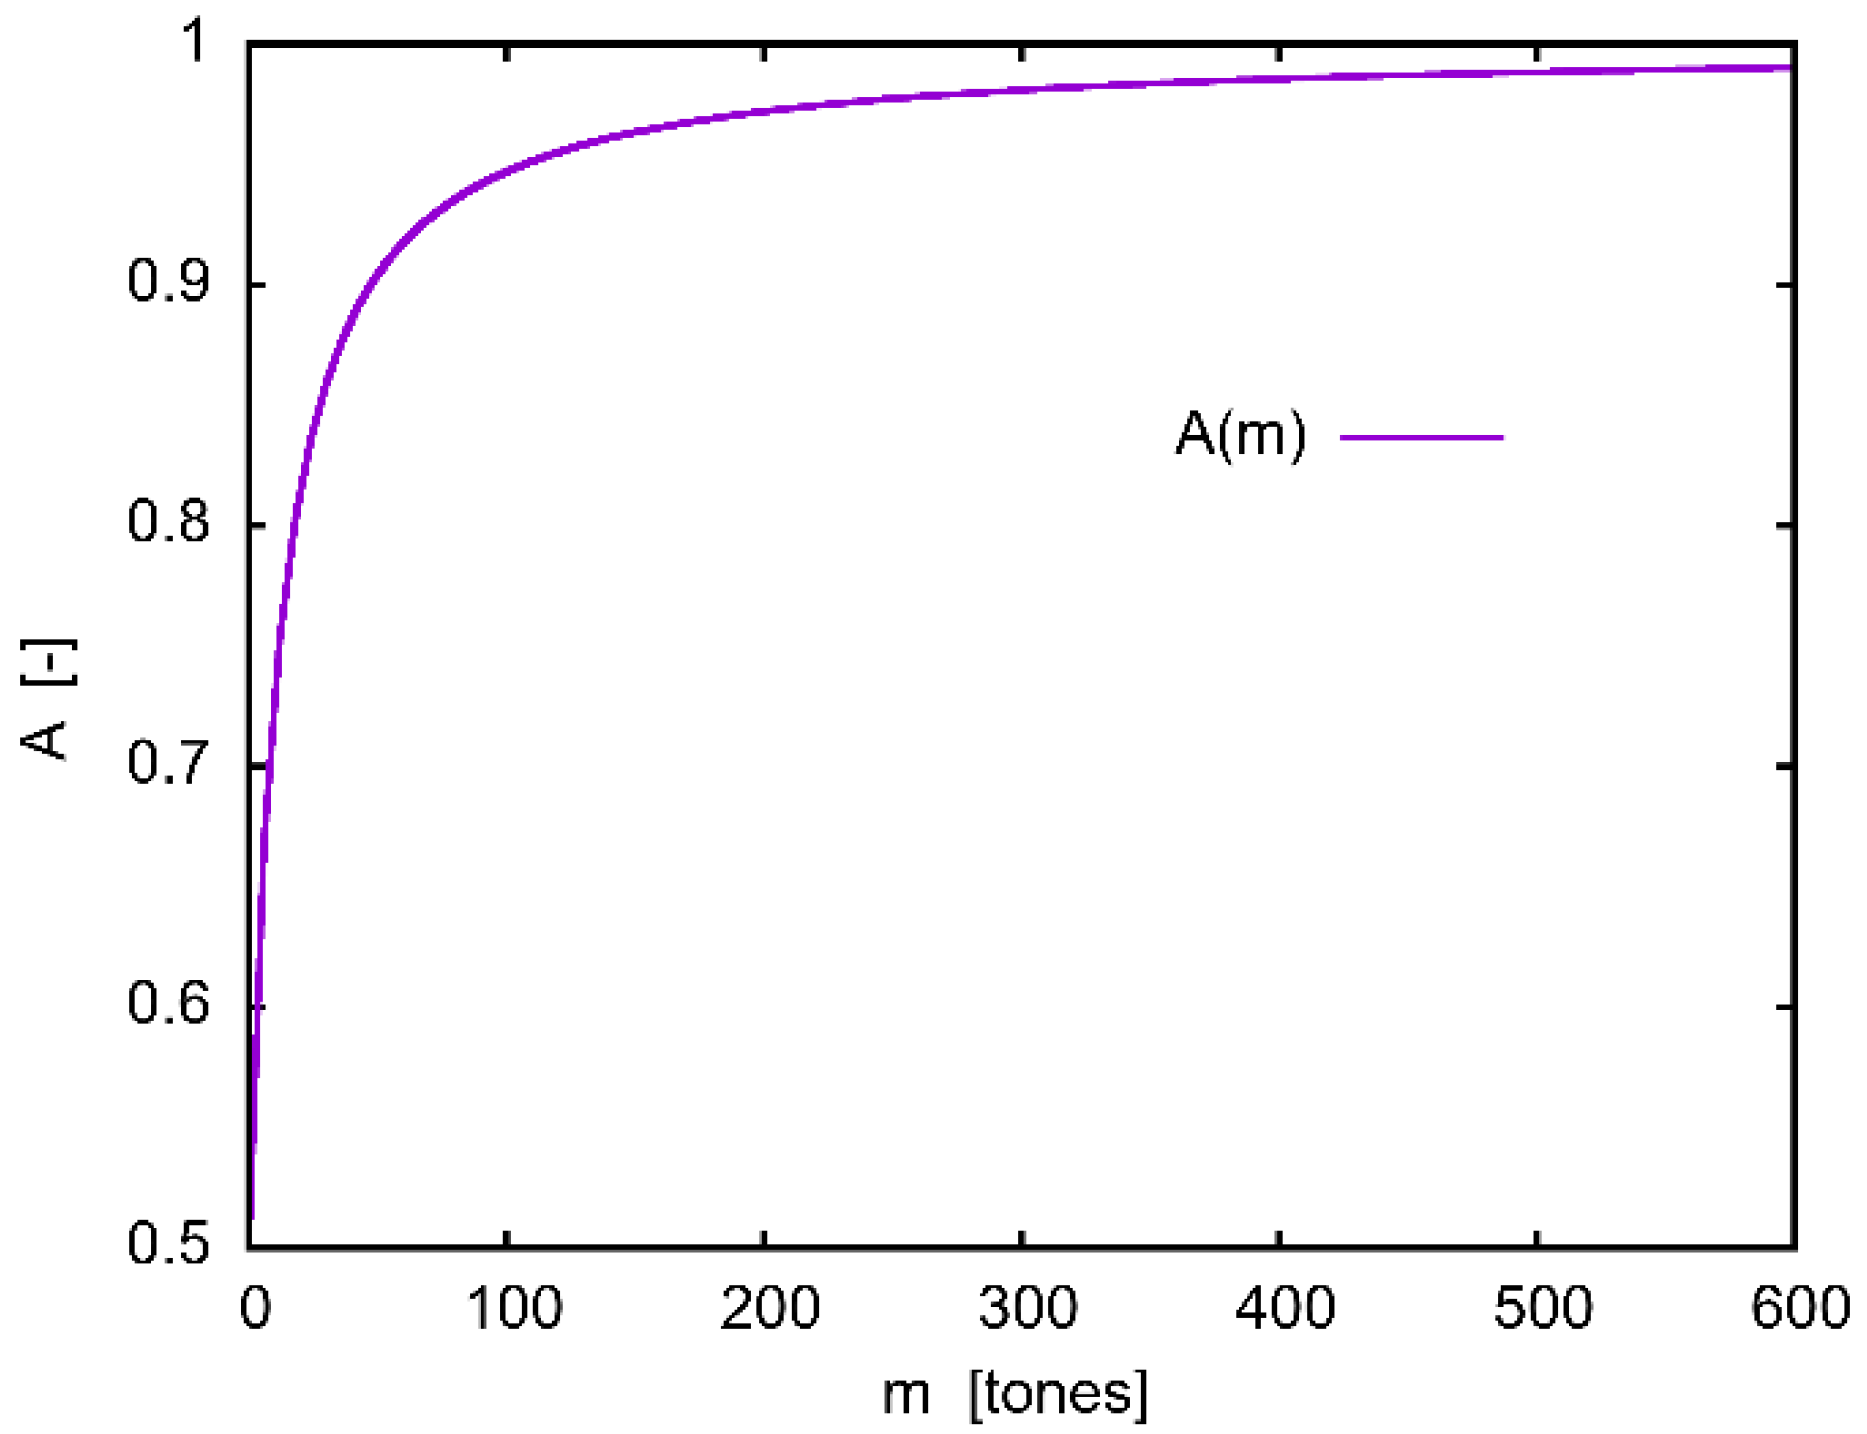
The parameter in Equation (17) is 0.5 for = 0 and tends to 1 with increasing value of (see Figure 1); e.g., > 0.90 for > 47.5 tons, following the linear correlation between and [39]. The key is that Equation (16) would be the one relevant to ATCO and ATM (interested in the sensitivity of to the mass of an aircraft already built, i.e., with a given value of ). Conversely, Equation (17) would be relevant to aircraft manufacturers for aircraft design.
As per the sensitivity of to changes in flight altitude , from Equations (1) and (18), we can obtain Equation (19):
where is the adiabatic coefficient for air and is the universal gas constant divided by the air molecular mass. If we consider that and follow the International Standard Atmosphere (ISA) [41], while all the other parameters are constant with altitude since the error is negligible (e.g., the change in from SL to = 20 km is below 0.63%), then:
where and are the ISA temperature and density at SL (288.15 K and 1.225 kg/m3, respectively), and is the ISA temperature lapse rate (−6.5 K/km). In the lowest layer of the stratosphere, from 11 to 20 km, = 0 K/km, thus is constant, and:
where and are the ISA temperature and density at the tropopause ( = 11 km). Thus, the sensitivity of to the flight altitude can be finally expressed as:
From Equation (23), for example, an altitude increment of 1000 ft at flight level FL195, i.e., = 5.13%, causes an increase of of 3.78%, while an increment of 1000 and 2000 ft at FL460, i.e., = 2.17% and 4.35%, causes an increase of of 4.80% and 9.60% (see in Figure 2).
If we consider the sensitivity of to , a variation of a given order of magnitude in causes a variation of of the same order of magnitude but with opposite sign (the same occurs if we consider variations of density , Mach number , span-wise load factor , wing span , or initial lateral spacing between vortices ):
However, in levelled rectilinear horizontal flight, from Equations (1) and (14), we obtain , hence:
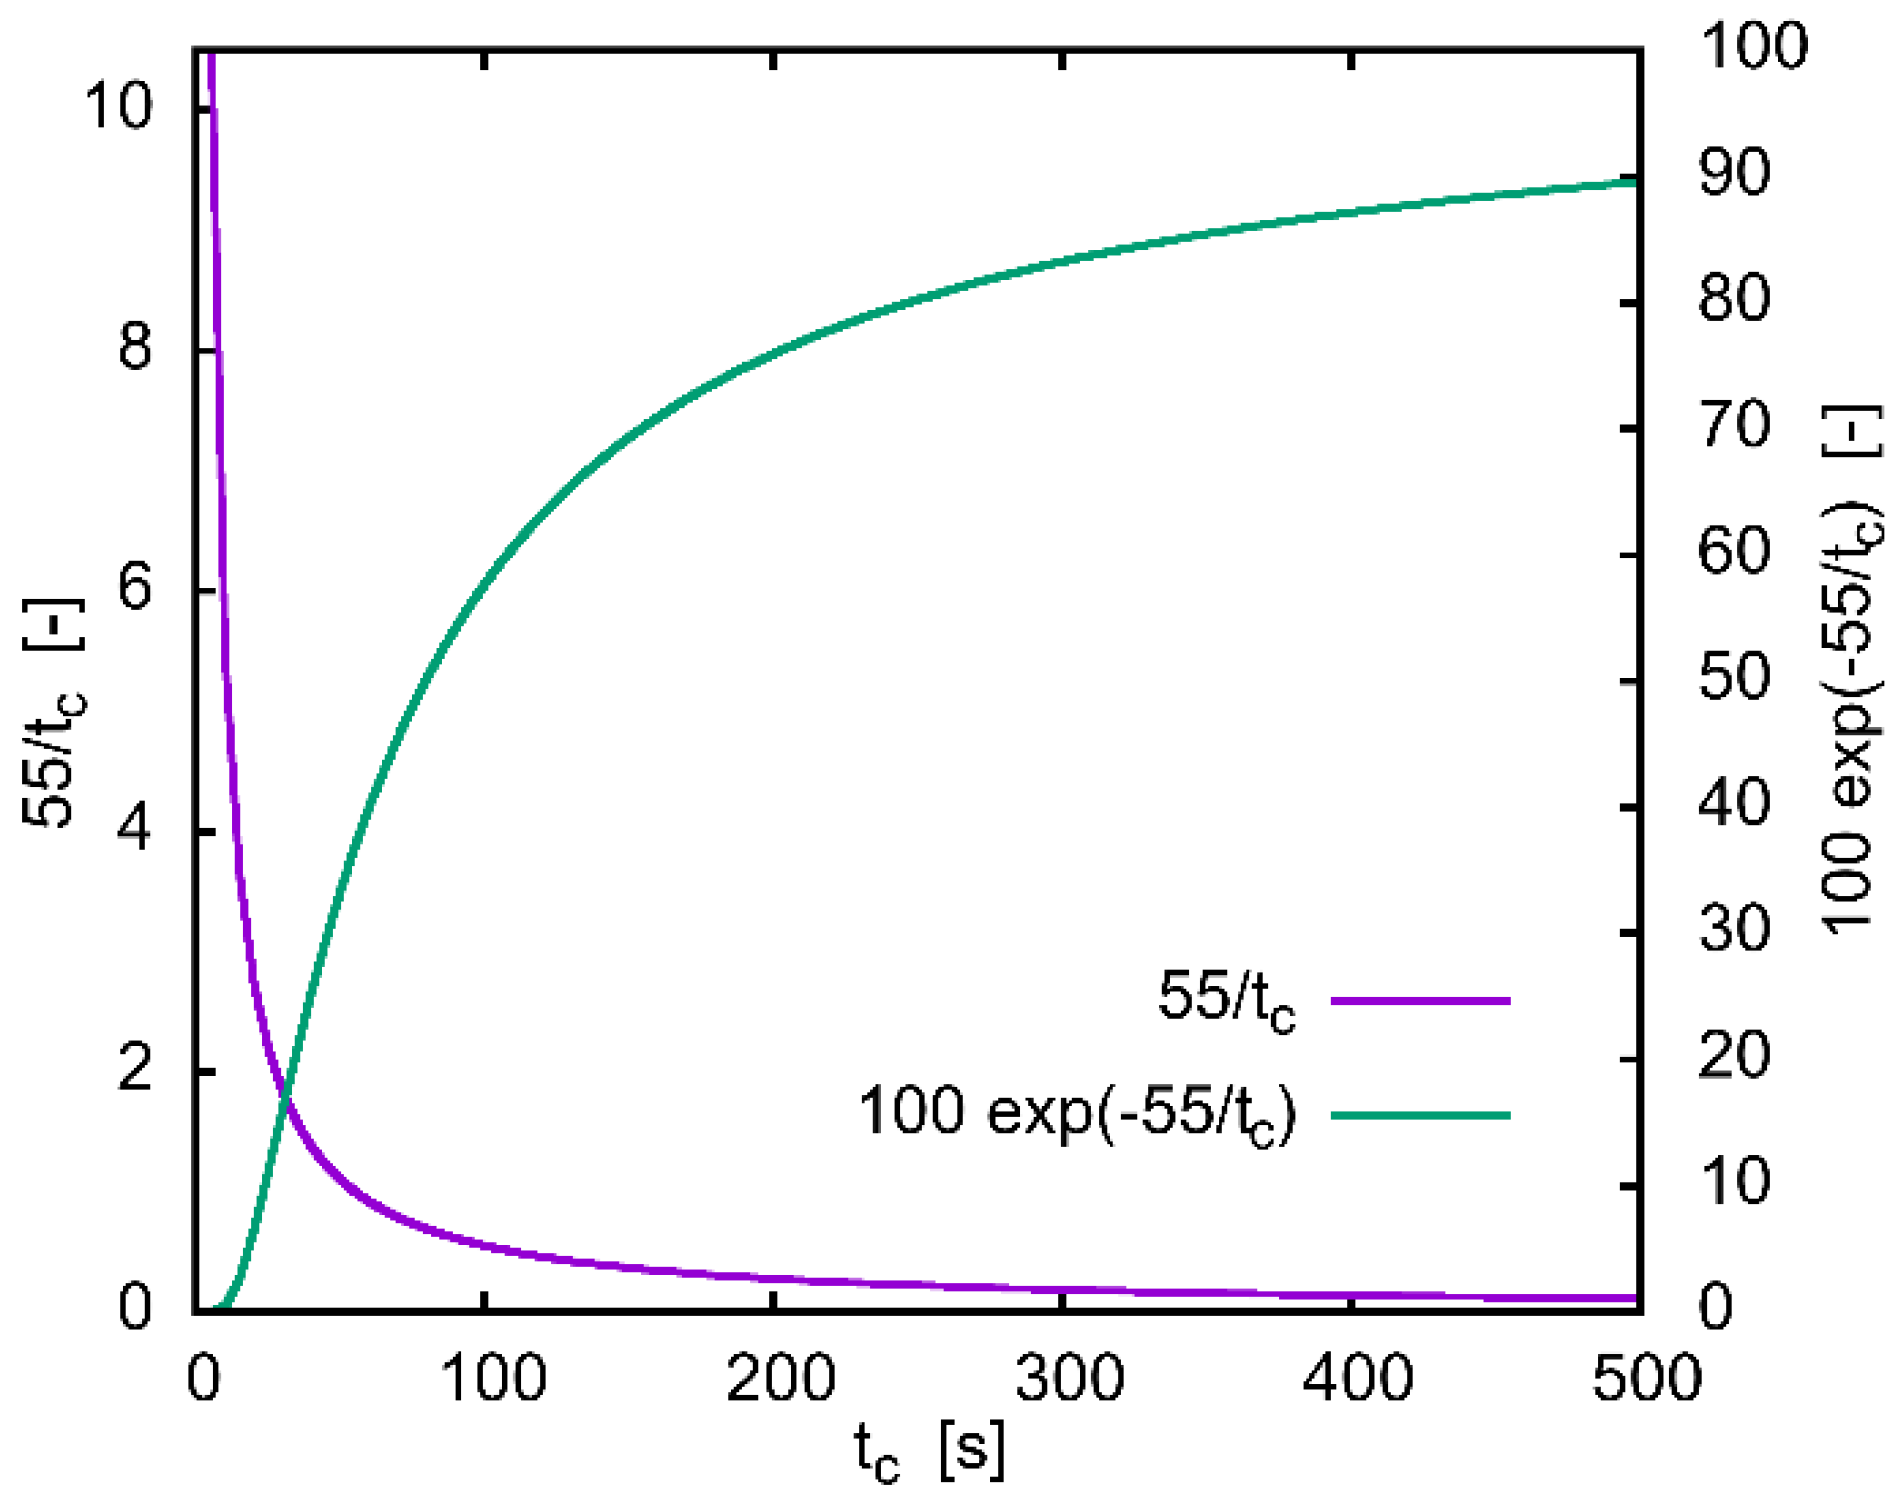
and the same occurs if we consider variations of wing lay-out area or lift coefficient . Regarding the decay in effective WV circulation , from Equations (3) and (13), a variation of a given order of magnitude in causes a variation of of the same order of magnitude. Moreover, based on the previous sensitivity analyses for , we can deduce the sensitivity of to the parameters that affect . As per the sensitivity of to , from Equation (3) we obtain this expression (see example plot of in Figure 3):
Regarding the sensitivity of to changes in , since affects the value of , as shown in Equations (4)–(7):
When analyzing the WV sink rate , from Equations (3) and (11):
a variation of a given order of magnitude in causes a variation of of the same order of magnitude. Based on the previous sensitivity analyses, we can deduce directly the sensitivity of to and the parameters that affect , with the exceptions of , , , and , which are now treated joining Equations (1) and (29):
Taking advantage of the typical relationship between the WV core radius and (i.e., is usually defined as a small percentage of [36,37,38,42,43,44]), the sensitivities of to variations in , , , and are as follows:
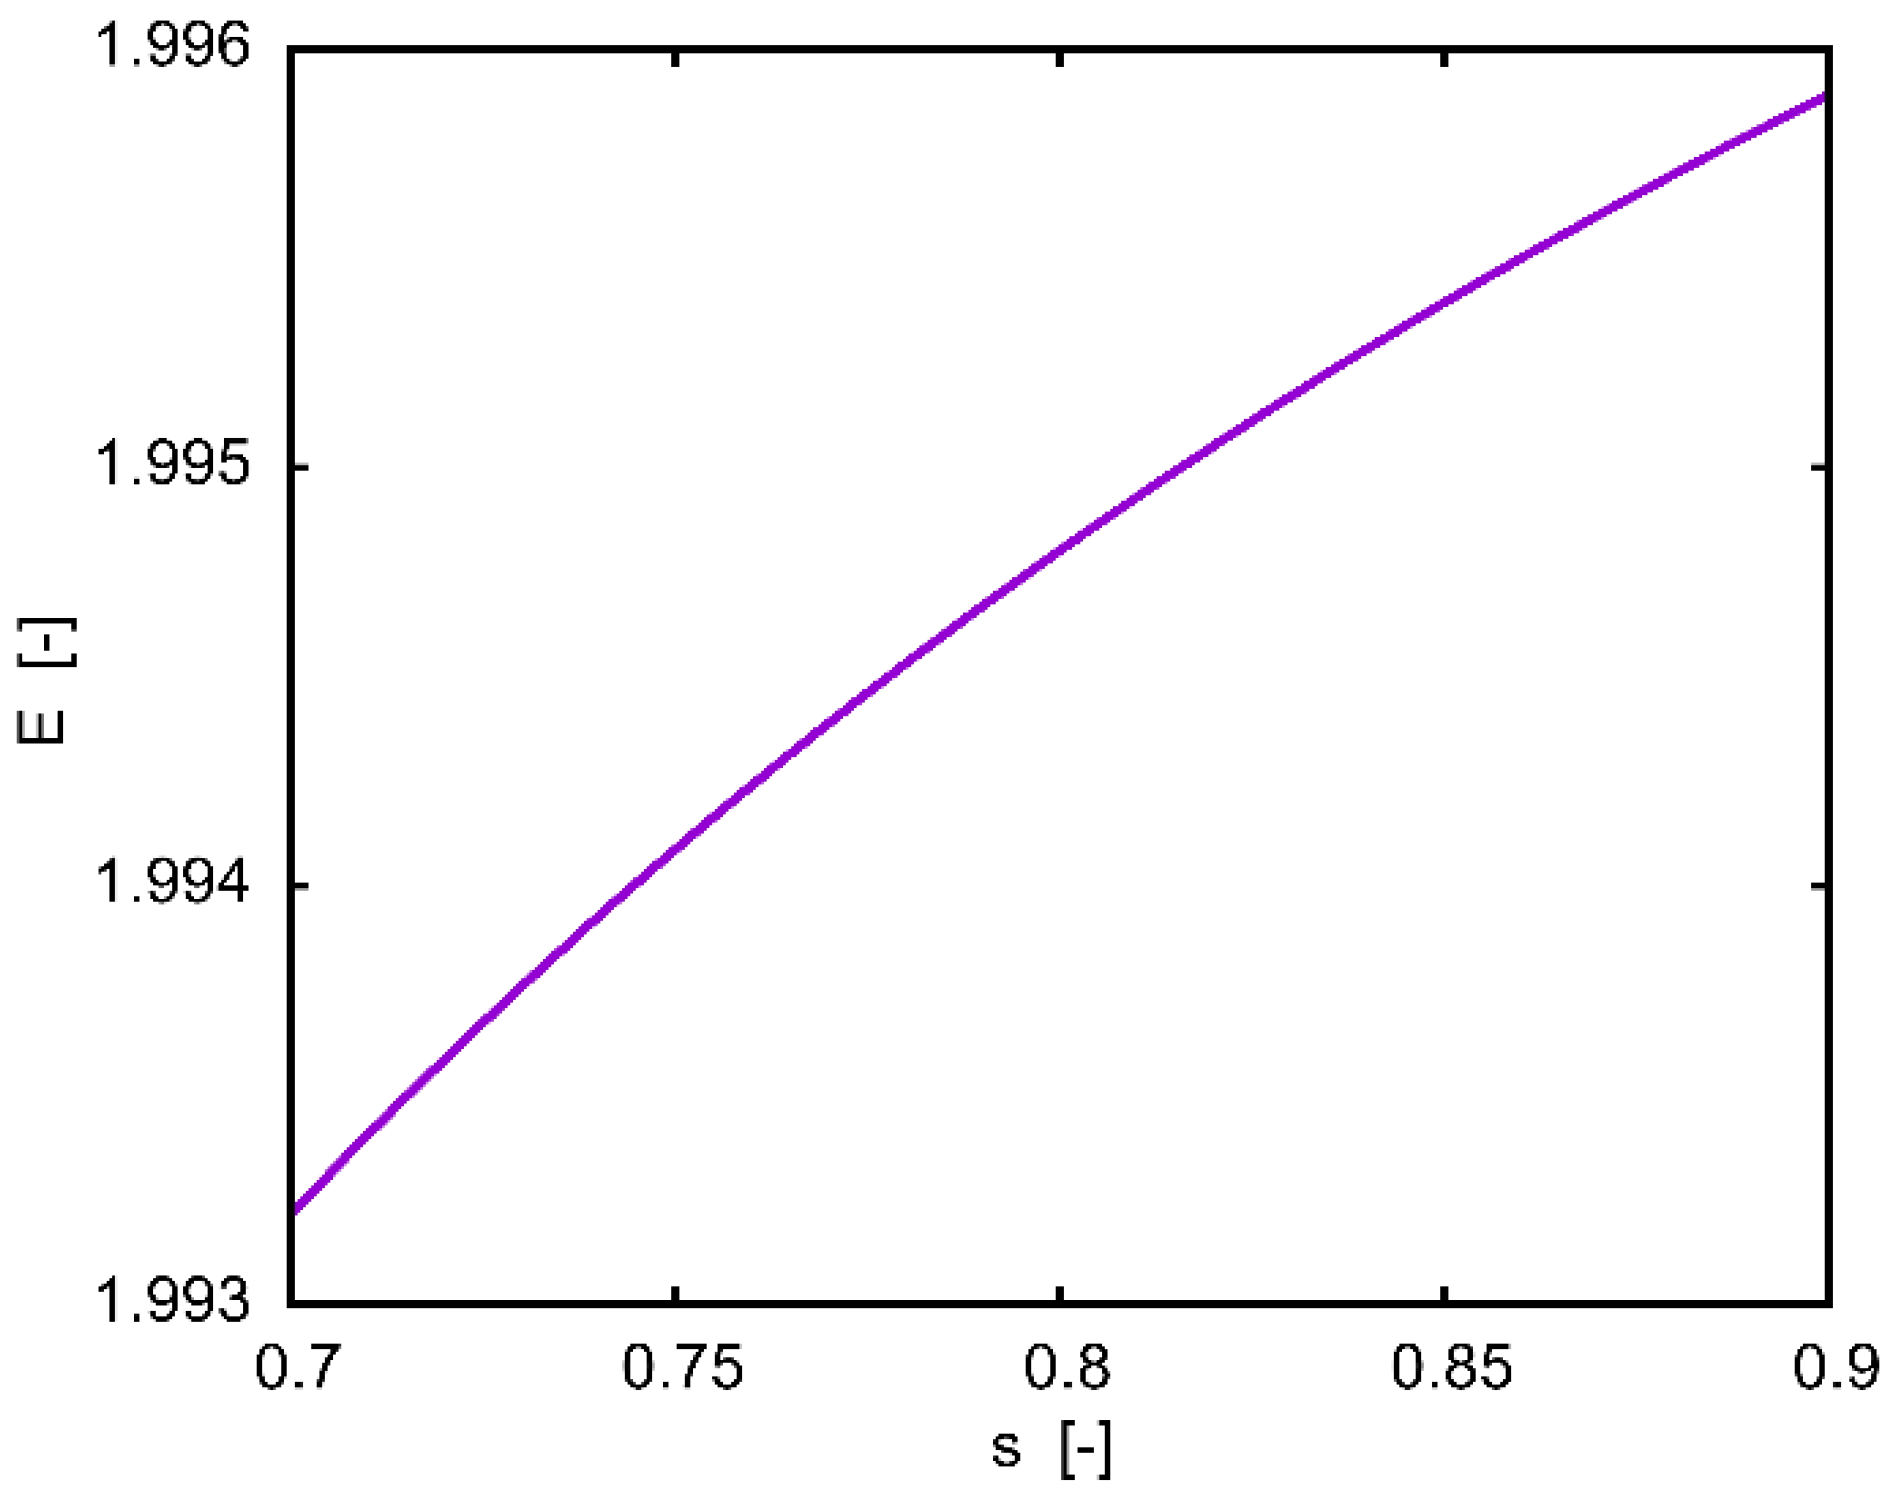
Thus, changes in and propagate into changes of twice as large in absolute terms. Almost the same occurs for and : using typical values of , (i.e., 1% to 5% of [36,37,38,42,43,44]), (i.e., 0.75 to 0.85 [3,36]), and , yields values above 1.990. Particularly, the higher the values of , , or , or the lower the value of , the closer is to 2 (see Figure 5). However, as long as (which is mostly the case), a change of does not impact the WV descent. What matters most for this research is the hazard of large aircraft, where the mutual velocity induction is compared to the region of potential vortex (e.g., in P2P/D2P, m and we use ). Thus, the impact that matters is the variation of due to wing design (inboard and/or outboard loading) and dynamic variations of en-route for new aircraft (e.g., the A350 uses the flaps for having variable camber during flight).
4. Circulation Generator Module
4.1. Methodology
In our research, a circulation generator module (CGM) was developed, which produces circulation values and other outputs that can be used as input for computing the upsets in follower aircraft. As an example, the following values of initial WV circulation were used in previous works: 343, 683, and 783 m2/s [21], and 530 m2/s [24]. However, the CGM is able to compute the maximum possible circulation of WV generated or encountered by aircraft for a given set of conditions, while disregarding unrealistic scenarios. Among other benefits, this allows keeping to a minimum the costly computations of upsets in follower aircraft to search for the most severe upsets. The main input data necessary to execute the CGM are:
- Generator aircraft and/or follower aircraft type: Any aircraft for which the necessary data are available in BADA version 4.1 [17] can be used;
- Flight Level (FL) of the corresponding aircraft: In a previous work on WVE, most of the tests were made at FL370 (37,000 ft), and the influence of WVE altitude was studied at FL410 [21]. In our case, the CGM is able to find the maximum circulation either for a specific FL or in a given range of FL, from a minimum specified FL (e.g., FL200, as this is a typical lower limit for cruising FL) to the highest possible FL (i.e., the ceiling of the corresponding aircraft for the given flight conditions);
- Generator-follower separation: This must be provided in terms of horizontal distance or time (e.g., 5 NM, as in [21]), to compute the decay of the encountered WV and/or vertical separation.
Once these input data are introduced, the CGM computes the initial circulation of the WV downwind of the generator aircraft using Equation (1). This can be done for a range of FL, masses, and speeds of the generator aircraft (see details below), generating multiple scenarios with their corresponding . Then, the CGM disregards unrealistic scenarios, i.e., impossible combinations of , , and FL for the generator and follower aircraft, based on their performance. For this purpose, aircraft performance data from BADA is used. For example, an aircraft may generate WV with very large for a given FL, but the follower aircraft may not be able to reach that FL, for any of the scanned combinations of and . In brief, the method is based on computing the maximum rate of climb (ROC) that the aircraft can achieve for the given flight conditions. If, for those conditions, that value is below a minimum specified ROC (see details below), the corresponding scenario is discarded. Then, among the non-discarded scenarios, the maximum is obtained. Finally, is computed using Sarpkaya’s and the P2P/D2P decay models, and the maximum circulation of the WV encountered by the follower aircraft is established based on the input aircraft separation. In all the computations done in this work, the following hypotheses were assumed:
- Atmospheric properties: The values of the atmospheric variables (e.g., , temperature , pressure , kinematic viscosity , and the speed of sound ) depend on the FL, as established by the ISA [41];
- Eddy dissipation rate (EDR): EDR ranging from 10–8 to 2 × 10⁻⁷ m2/s3 and 10–6 to 10–1 m2/s3 appear in [24,45], while Meischner et al. [46] measured a maximum of 0.05 m2/s3 inside strong storm cells. The CGM allows using an EDR value determined by the flight altitude, as in [47] or setting a given EDR value at the user’s discretion. In our case, the EDR was set to 10–6 m2/s3, assuming neutral stratification (i.e., null ) and low levels of atmospheric turbulence, as in [21,45,48]. This is natural at just above/below the tropopause [10,24], and is a conservative approach, since those atmospheric conditions imply the largest hazard potential of WVE [12], i.e., this low EDR corresponds to worst-case scenarios as per potential upsets on the follower aircraft, since the WV decay is slow and the WV persistence is high;
- Aircraft mass: In a research on WVE, aircraft weights in steps of 5% ranging from 65% to 95% of the maximum take-off weight (MTOW) were considered [12]. In another work with the A330-300 aircraft, three masses were used [21]: 145 tons; 177 tons (i.e., the maximum aircraft mass at FL410); and 210 tons (i.e., 97.7% of the MTOW, which represents the maximum aircraft mass at FL370). In our simulations, we used 65% and 95% of the MTOW from BADA, and some intermediate values;
- Aircraft velocity: In a previous work, tests were made at Mach number = 0.81 [21]. In our analysis, the CGM sampled three values: the aircraft’s maximum range cruise Mach , 97% of the maximum operating Mach number from BADA, and the average of both values. Finally, to compute the decay of the encountered WV, the aircraft velocity is assumed constant, as in [21];
- WV core radius or size: Usually, the initial WV core radius is specified between 1% and 5% of [42,43,44]. A smaller for a given is a conservative approach for hazard considerations [49], as confirmed by our sensitivity analysis around Equation (32): smaller leads to faster sink rate. From flight test measurements, is 3.5% of [36,37,38]. While grows with increasing vortex age, it does not change much (e.g., the decay in Sarpkaya’s model does not affect ), and it does not change either with the atmospheric conditions. Hence, a constant WV core radius = was assumed in [36]. Likewise, we kept constant at 3.5% of (4.5% of ) from BADA. Different simulations revealed that has no significant effect on the upsets on follower aircraft [50,51], while a previous work [8] suggests otherwise;
- WV span-wise load factor: This factor depends on combined effects of the loadings of the wing and horizontal tail plane [3], and usually ranges from 0.75 to 0.85. For the wing, it is often assumed an elliptical lift distribution [3], which is particularly valid for aircraft flying en-route above FL285 [12]. For these wings, is commonly assumed to be [36]. Again, does not change much with time or the atmospheric conditions (except maybe with stratification), particularly, assuming low levels of turbulence, as long as the decay rates are moderate, is constant [21]. Thus, we assumed that is constant at
- Minimum rate of climb: In most of the controlled airspace, a minimum ROC is imposed by ATM regulations and practices. Thus, optimal cruise altitudes are typically the highest FL that allow for this minimum ROC, given the aircraft mass and maximum thrust that can be achieved for that particular altitude (note, however, that wind conditions aloft might significantly change this cruise altitude, leading in some cases to lower optimal altitudes with more “benign” winds). This minimum ROC is typically 500 ft/min [52], and this value is used in this work to disregard unrealistic combinations of , , and FL. Nevertheless, this parameter is at the user’s discretion, and might be configured to any other value;
- Turbofan thrust model: BADA includes performance data for various turbofan thrust control models. For computing the maximum ROC, we used the maximum climb (MCMB) turbofan rating model;
- Aircraft hyper-lift devices configuration: We assumed a clean configuration for the hyper-lift devices, as this is the customary configuration for cruise flight;
- Parameters of the P2P/D2P model: In Equation (8), the radius is 10 m (average value within the interval 5–15 m [31]). The other parameters are = 1.1, = −3.48, and = 1.78 × 10⁻³. In Equation (9), we used = 7.2 and = 5.5 × 10⁻³ [31,53], which are suitable for low atmospheric turbulence and neutral stratification.
4.2. Practical Application: Maximum Circulation of Wake Vortex Generated by Aircraft
In a first analysis, the CGM was configured to compute the maximum possible circulation of WV generated by multiple aircraft in realistic scenarios. The input data were:
- Generator aircraft type: Almost all aircraft for which the necessary data can be found in BADA version 4.1 (this excludes propeller-driven light aircraft: SR20 and SR22). Thus, we used 62 different aircraft, which represent 47% of the traffic in USA and Australia, almost 80% of the traffic in ECAC, and 87% and 98% of the traffic in Japan and Brazil [54], respectively;
- FL of the generator aircraft: Several FL were considered: FL200, the ceiling of the aircraft for the given input conditions, and various intermediate FL;
- Generator-follower separation: We used the current minimum horizontal separation en-route in radar environment (i.e., 5 NM), and vertical separations of 10 and 20 FL (1000 and 2000 ft). Seeking for worst-case scenarios to test the feasibility of reduced separation standards, horizontal separations of 0.5 and 3 NM were also tested (the rationale would be the possibility of increasing airspace capacity, based on the requirement of standard deviation of lateral path-keeping error of 0.3 NM [55]).
Table 1 shows the obtained results for several generator aircraft, and their flight operation conditions. Here, is the initial WV circulation, and and are the circulations of the WV from Sarpkaya’s and the P2P/D2P decay models, respectively, at different horizontal separation distances between the generator and follower aircraft. The table also shows the time separation between the aircraft for the given flight velocity , and the WV sinking , equivalent to the generator-follower vertical separation. Namely, the maximum values of obtained in this analysis, at horizontal separation of 0.5, 3, and 5 NM, were 896, 864, and 840 m2/s, respectively, corresponding to the A380-861 as generator. The equivalent results for were 859, 829, and 805 m2/s (see also Figure 6). Table S1, provided as supplementary material, shows the results obtained for all the aircraft for which the necessary data are available in BADA version 4.1.
Several simple tests allowed checking the robustness of the CGM and the consistency of the results. Firstly, aircraft weights were sampled up to MTOW, on one side, and up to 95% of MTOW, on the other. As expected, this did not have an effect on the obtained maximum WV circulations, since scenarios with MTOW at cruise altitudes are discarded by the tool as unrealistic. Secondly, Mach values were sampled up to 97% of the , on one side, and up to the , on the other. Again, as expected, this did not have an effect on the obtained maximum WV circulations, meaning that these are always obtained not at the highest but the lowest tested Mach numbers (i.e., the in this case). This is explained by Equation (1) and the fact that, for given conditions in levelled rectilinear horizontal flight, flying at lower requires using higher values of , as shown in Equation (14), and thus higher intensity of the wing tip vortices. Despite this, we did not test Mach numbers lower than since they are not interesting for nominal cruise operations, as the aircraft would fly slower and with higher fuel consumption (and potential future linear holding operations, where these low Mach values may be interesting [56], are out of the scope of this work).
Finally, as shown in Table 1 and Figure 7, the overall maximum circulation is generally obtained at the ceiling of the corresponding aircraft (the ceilings were obtained using a criterion described later on, and thus may not be coincident with public aircraft specifications or the maximum operating altitude in BADA). The relation between flight altitude and circulation in levelled rectilinear horizontal flight is indeed interesting: Equation (14) alone would not provide a conclusive answer, since, to keep the lift constant, the decrease of air density with altitude could be compensated by either increasing or . For given flight conditions, increasing would lead to higher intensity of the wing tip vortices (i.e., higher ). On the other hand, Equations (1) and (14) combined show that:
Thus, if we increase or the altitude, or we decrease density, would increase (this agrees with the assessments made around Equations (23)–(25), which provide highly valuable insights). However, there are a few exceptions for which the overall maximum circulation is achieved at intermediate FL, not the ceiling or close to it. This is likely because the aircraft mass also affects , as shown in Equation (1). That is, these exceptions would be cases in which the drop in due to the lower flight altitude is counterbalanced by the fact that the aircraft can fly at those lower FL with much higher mass than at the ceiling.
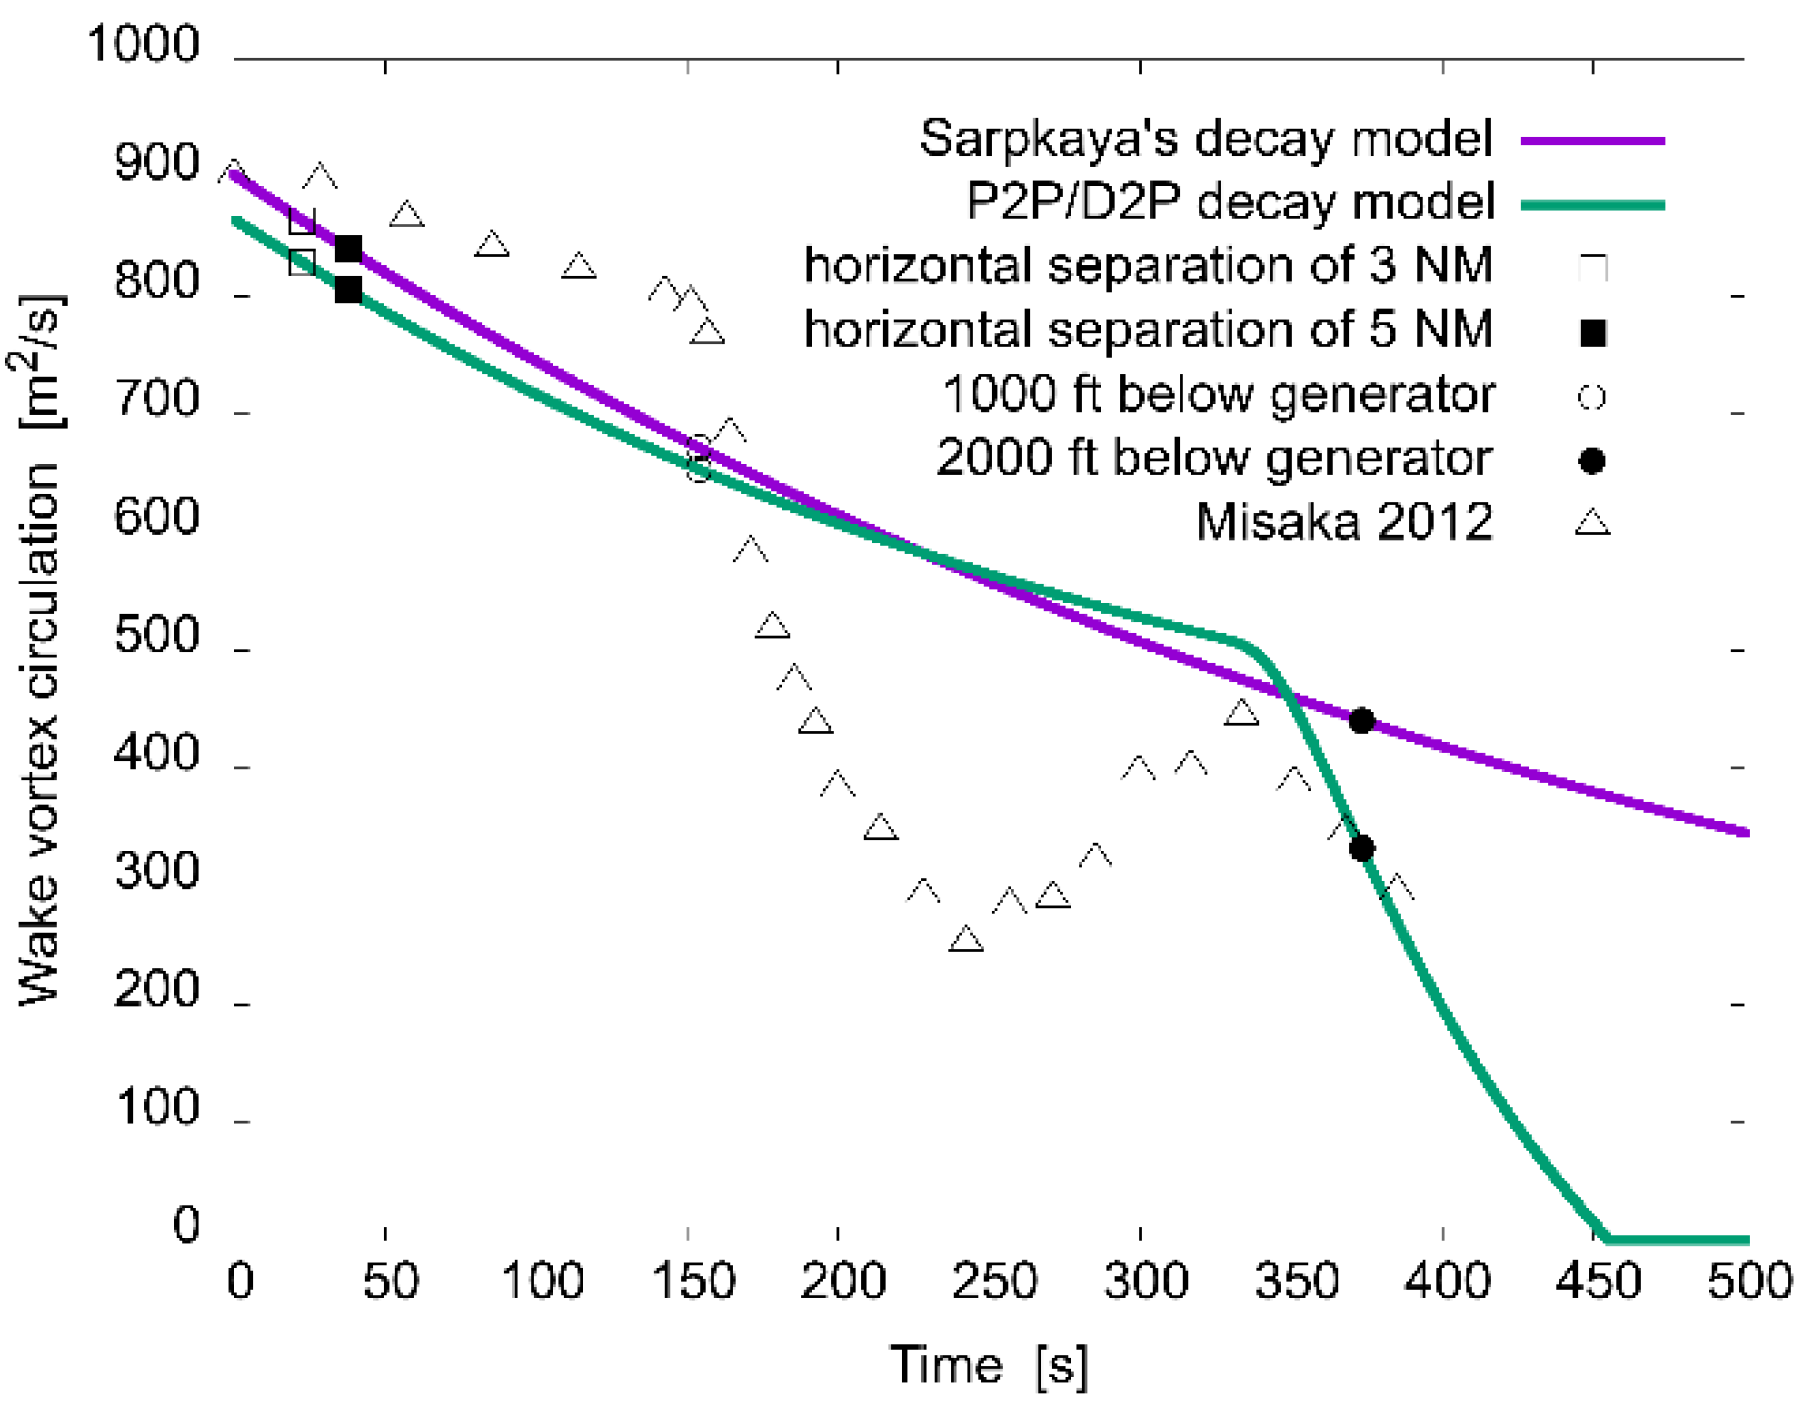
For the case in which the A380-861 generates the maximum WV circulation, Figure 6 shows the circulation decay, as well as data from [24]. The circulation at generator-follower aircraft horizontal separation of 3 and 5 NM, and 1000 and 2000 ft, i.e., 304.8 and 609.6 m, below the altitude of the generator aircraft is also shown. P2P/D2P usually leads to vortices with longer lifetimes than Sarpkaya’s model in stratified environments [29], but shorter lifetimes for neutral stratification (, as we assumed). This is why the WV lifetime by Sarpkaya’s model is longer in all our tests, as shown in Figure 6. P2P/D2P may predict slightly higher (up to 6.2% higher) circulations than Sarpkaya’s model around the transition from first to second decay phase, but in general the results from both are very similar in the first phase (difference of 1.3% on average with a standard deviation of 3.1%, the −4.2% gap of P2P/D2P with respect to Sarpkaya’s model in the first instant of time is due to the fact that P2P/D2P uses a circulation averaged over circles of radii from 5 to 15 m). However, the WV strength by P2P/D2P in the second decay phase is significantly lower than that given by Sarpkaya’s model, and reaches 0 much earlier. Finally, the results from Misaka et al. [24] are higher than those from the P2P/D2P and Sarpkaya’s models in the first half of the first decay phase, and lower in the second half. For instance, the difference between Misaka’s results and P2P/D2P is on average −13.8%, with a standard deviation of 24.8%.
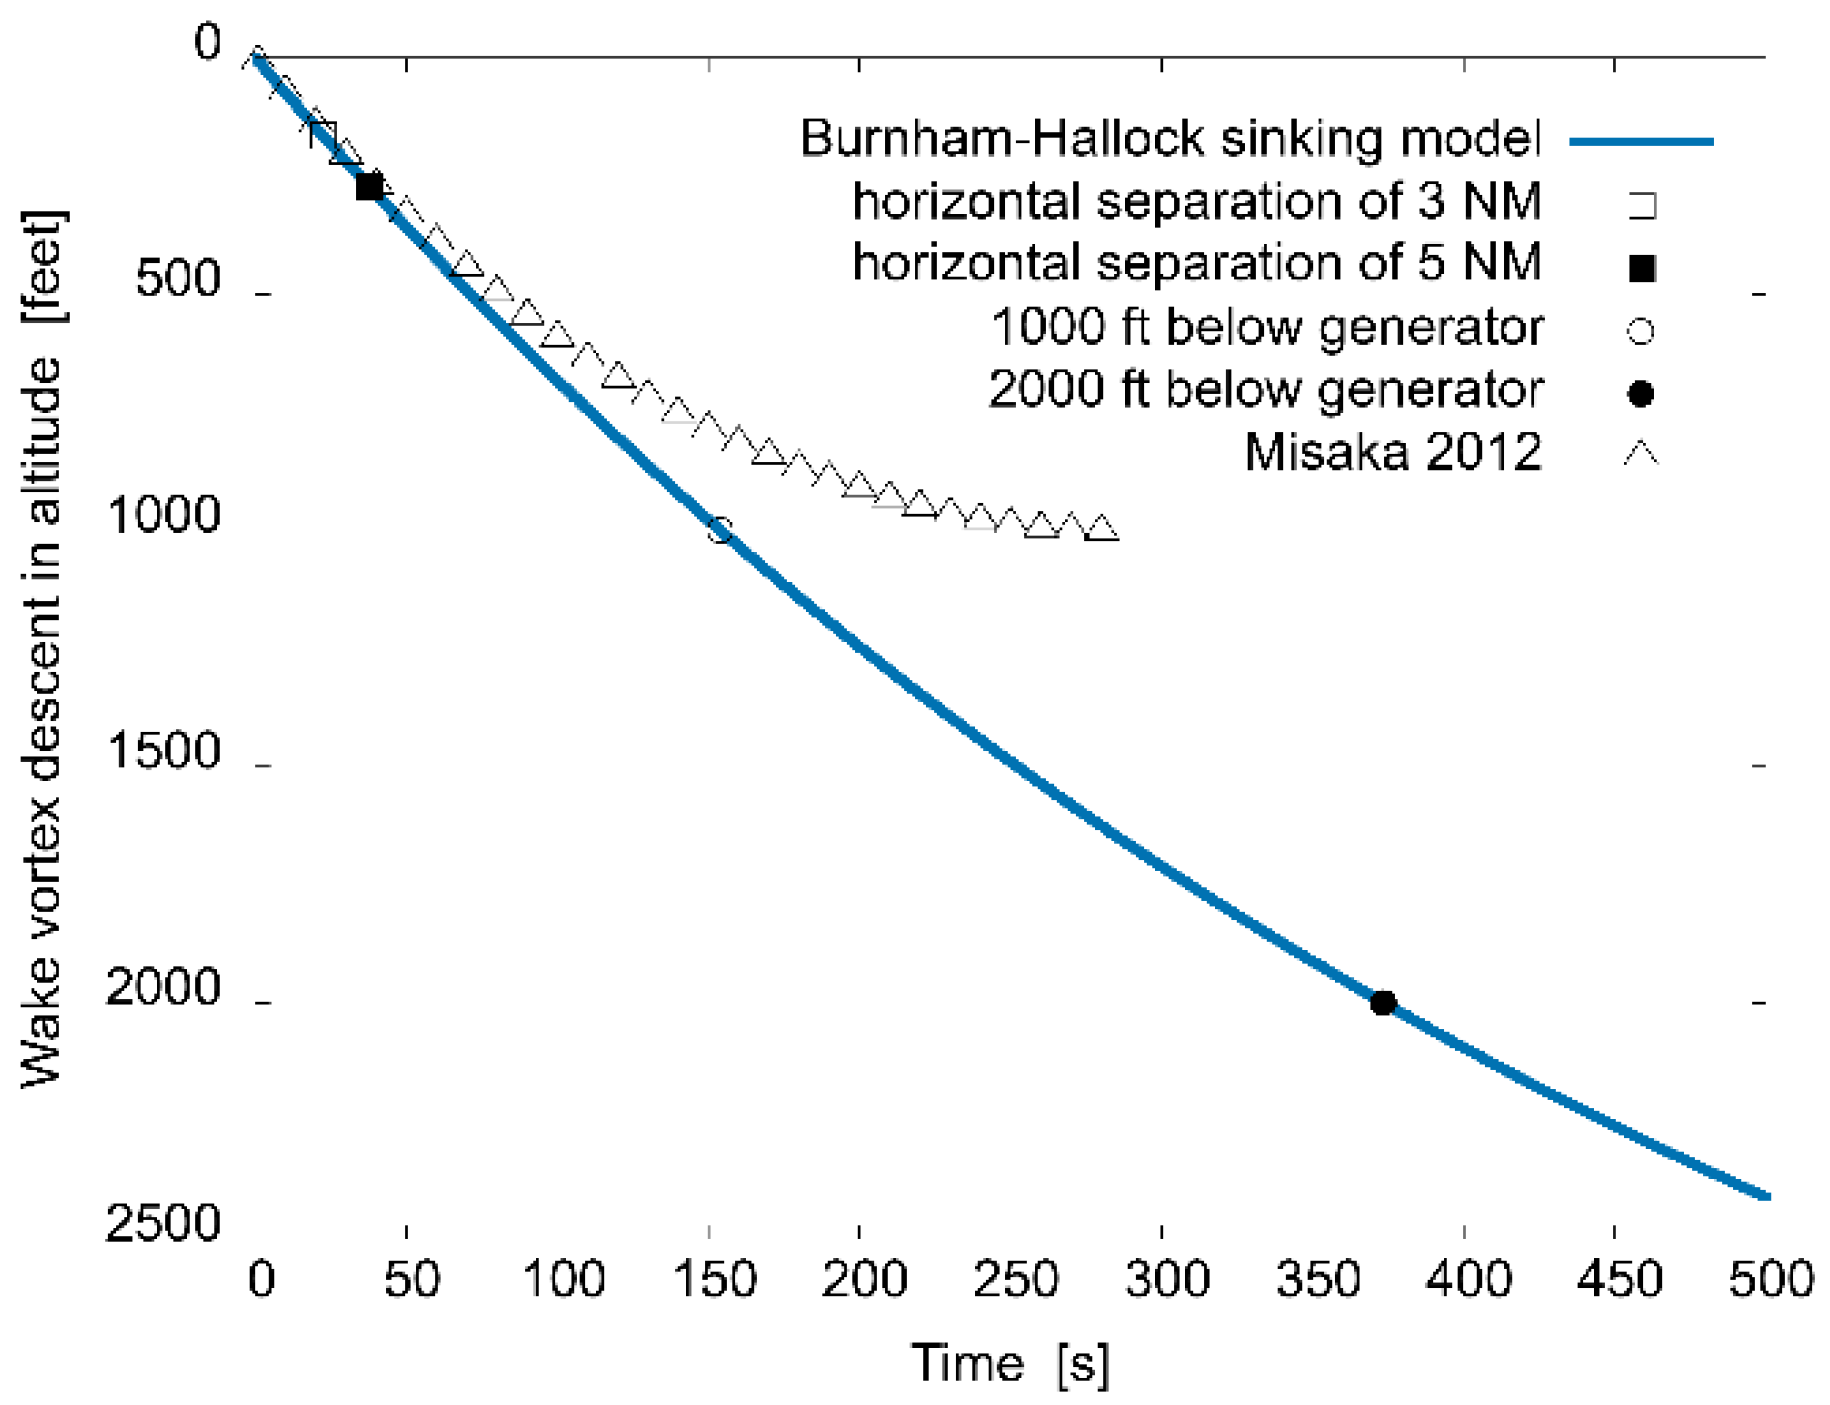
For the same case mentioned above, Figure 8 shows the WV descent in altitude vs. time, as obtained from [24], the Burnham-Hallock model and Sarpkaya’s circulation decay, shown in Figure 6. The WV sinking at generator-follower aircraft horizontal separation of 3 and 5 NM (50 and 83 m, in 22 and 37 s, respectively), and a descent of 1000 and 2000 ft below the generator aircraft altitude are also indicated. Note that, in cruise level environment, the WV of an A380-861 may descend 1000 ft in 2.6 min and 2000 ft in 6.2 min, while retaining a significant fraction of its initial strength: 74.4% and 48.8%, respectively, according to Sarpkaya’s model or 72.4% and 36.8%, according to P2P/D2P. In addition, it is worth recalling that Sarpkaya’s model tends to predict faster weakening of the WV descent rate than P2P/D2P, resulting in smaller overall WV descent [29]. This agrees with Misaka et al. [24], who claim that WV may descent more than 2500 ft, well beyond the 1000-ft vertical aircraft separation prescribed in RVSM airspace, and typical en-route WV persistence of 2–3 min and sink rate of 400 ft/min [1]. In one case, researchers observed a WV descent rate probably much higher than predicted by the WV sink rate model [12]. Hence, encounters with WV of even higher circulations could happen well below the altitude of the generator aircraft.
4.3. Practical Application: Maximum Circulation of Wake Vortex Encountered by Aircraft
In a second analysis, the CGM was configured to compute the maximum possible circulation of WV encountered by several aircraft in realistic scenarios. The input data were:
- Generator and follower aircraft type: F100-650, A320-212, A330-301, B772LR, and A380-861 were used in this analysis (a total of 25 combinations of generator-follower);
- FL of the follower aircraft: Three different FL were considered: FL200, the ceiling of the aircraft for the given input conditions, and an intermediate FL;
- Generator-follower separation: We used the current minimum horizontal separation en-route in radar environment (i.e., 5 NM), and vertical separations of 10 and 20 FL (1000 and 2000 ft). Seeking for worst-case scenarios to test the feasibility of reduced separation standards, horizontal separations of 0.5 and 3 NM were also tested (the rationale would be the possibility of increasing airspace capacity [55]).
Table 2 shows, for the scanned masses and Mach numbers for the A320-212, realistic combinations of flight operation conditions at FL200, FL300, FL395, and FL398 (its ceiling). Table A1, Table A3 and Table A5 in the Appendix A show, respectively, for the A330-301, B772LR, and A380-861, realistic combinations of flight operation conditions at FL200, FL300, and their ceilings. Table 3 shows, for several generator-follower horizontal and vertical separations, the maximum circulations of WV encountered by any aircraft that can fly at the indicated FL, behind a selected set of generator aircraft. The parameters shown are the same as in Table 1. The overall maximum circulation obtained in this analysis from Sarpkaya’s model, at horizontal separation of 3 and 5 NM, was 593 and 578 m2/s at FL200, 726 and 708 m2/s at FL300, and 745 and 726 m2/s at FL395, corresponding to the A380-861 as generator aircraft (the results at FL398 are not shown as they are very close to FL395). As expected, for the reasons explained before, the obtained maximum WV circulations increase with altitude.
Table A2, Table A4 and Table A6 in the Appendix A show, respectively, the ceilings of the A330-301, B772LR, and A380-861, the same parameters as in Table 3. Note that, if the generator and follower aircraft are flying at the same FL with separation of 3 or 5 NM, the WV sinking is around 100 or 200 ft, respectively. For 5 NM, the sinking is large enough so that the follower may likely fly above the WV, considering the typical error in altitude. Conversely, if the separation is reduced to 0.5 NM, the follower may perfectly encounter the WV left behind by a generator at its same FL (altitude-keeping errors from systems such as flight data recorders show that height-keeping errors below 50 ft predominate, while the proportion of errors beyond 300 ft is less than 2.0 × 10⁻³ [55]).
5. Conclusions
The sensitivity of wake vortex (WV) to several parameters was studied: (a) changes in aircraft mass propagate into changes of initial circulation half as large or almost as large, depending on and whether the wing lay-out area is given or we assume linearity between and ; (b) the higher the flight altitude, the more sensitive is to altitude variations; (c) a variation of a given order of magnitude in true airspeed , density , Mach number , span-wise load factor , wing span or initial lateral spacing between vortices causes a variation of of the same order of magnitude; (d) a variation of a given order of magnitude in causes a variation of and WV sink rate of the same order of magnitude; (e) finally, changes in and propagate into changes of twice as large in absolute terms, and almost the same occurs for and . Then, a tool named circulation generator module (CGM) was developed to compute the circulation of WV generated/encountered by aircraft in en-route scenarios. The tool disregards impossible combinations of aircraft mass, true airspeed and altitude, based on aircraft performance data from BADA version 4.1. The maximum possible WV circulations were computed with the CGM in a comprehensive set of en-route scenarios, scanning several parameters for multiple generator and follower aircraft. The main conclusions are:
- The overall maximum WV circulation corresponds to the A380-861 as generator aircraft; at generator-follower horizontal separation of 0.5, 3, and 5 NM, the results were: 896, 864, and 840 m2/s, with WV sinking 28, 165, and 271 ft (8.5, 50.5, and 82.6 m), in 4, 22, and 37 s, respectively;
- In a cruise environment, these WV may descend 1000 ft in 2.6 min and 2000 ft in 6.2 min, while retaining 74% and 49% of their initial strength, respectively;
- The maximum circulations of WV encountered by aircraft behind A380-861, at generator-follower horizontal separation of 3 and 5 NM, were: 593 and 578 m2/s at FL200, 726 and 708 m2/s at FL300, and 745 and 726 m2/s at FL395, 754 and 734 m2/s at FL398, ceiling of A320-212; 807 and 785 m2/s at FL415, ceiling of A330-301; 849 and 825 m2/s at FL427, ceiling of B772LR; and 864 and 840 m2/s at FL431, ceiling of A380-861;
- Since experimental data are not available yet for validation purposes, flight tests could greatly help assess the accuracy of the proposed approach and the obtained results; and
- The CGM and our results can be used to assess the severity of WVE in the en-route phase. Indeed, the worst-case WV circulations obtained under realistic operational conditions allow reducing WVE simulations only to critical scenarios, and thus to perform more efficient test programs for computing aircraft upsets.
Supplementary Materials
The following is available online at https://0-www-mdpi-com.brum.beds.ac.uk/article/10.3390/aerospace8070194/s1. Table S1: Maximum circulations of the wake vortex generated by several aircraft and flight conditions of the generator.
Author Contributions
Conceptualization, J.I.R., M.M. and X.P.; methodology, J.I.R. and M.M.; software, J.I.R.; formal analysis, J.I.R.; investigation, J.I.R. and M.M.; resources, X.P.; data curation, J.I.R.; writing—original draft preparation, J.I.R.; writing—review and editing, J.I.R., M.M. and X.P.; visualization, J.I.R.; supervision, X.P.; project administration, X.P.; funding acquisition, X.P. All authors have read and agreed to the published version of the manuscript.
Funding
This research was funded by SESAR Joint Undertaking (SJU), grant number 699247, as part of the European Union’s Horizon 2020 (H2020) research and innovation program: R-WAKE project. The opinions expressed herein reflect the authors’ views only. Under no circumstances shall the SJU be responsible for any use that may be made of the information contained herein.
Data Availability Statement
Some or all data, models or code used during the study were provided by a third party (Base of Aircraft Data (BADA) version 4.1). Direct requests for this material may be made to the provider as indicated in the Acknowledgments. Some or all data, models or code that support the findings of this study are available from the corresponding author upon reasonable request (the circulation generator module (CGM)).
Acknowledgments
The authors would like to thank, on one side, the valuable feedback from Ramon Dalmau about the information in Base of Aircraft Data (BADA), and, on the other side, EUROCONTROL, for giving us the license to use the BADA version 4.1. Direct requests for this material may be made to EUROCONTROL.
Conflicts of Interest
The authors declare no conflict of interest.
Notation
The following symbols are used in this paper:
| dimensionless constant [-] | |
| speed of sound [m/s] | |
| generic constants of a linear polynomial | |
| aircraft wing span [m] | |
| aircraft lift coefficient [-] | |
| horizontal separation between the generator and follower aircraft [m] [NM] | |
| gravitational acceleration [m/s2] | |
| altitude [m] | |
| wake vortex altitude descent (or sinking) [m] [ft] | |
| temperature lapse rate in the International Standard Atmosphere [K/m] | |
| aircraft lift [N] | |
| Mach number [-] | |
| maximum operating Mach number [-] | |
| maximum range cruise Mach number [-] | |
| aircraft mass [kg] [tons] | |
| Brunt-Väisälä frequency [1/s] | |
| mean radius [m] | |
| universal gas constant divided by the air molecular mass [J/(kg·K)] | |
| radial coordinate or distance from the wake vortex center line [m] | |
| wake vortex core radius [m] | |
| wing lay-out area [m2] | |
| wake vortex span-wise load factor [-] | |
| temperature [K] | |
| normalized time of catastrophic wake demise event in the P2P model [-] | |
| time [s] | |
| time of the catastrophic wake demise event [s] | |
| time separation between the generator and follower aircraft [s] | |
| free stream velocity, true airspeed or aerodynamic velocity [m/s] | |
| tangential vortex velocity [m/s] | |
| wake vortex altitude descent per unit time (or sinking rate) [m/s] | |
| generic variables | |
| adiabatic coefficient for air [-] | |
| (effective) wake vortex circulation [m2/s] | |
| initial wake vortex circulation [m2/s] | |
| wake vortex circulation from P2P/D2P decay model [m2/s] | |
| wake vortex circulation from Sarpkaya’s decay model [m2/s] | |
| eddy dissipation rate [m2/s3] | |
| potential temperature [K] | |
| (effective) kinematic viscosity [m2/s] | |
| air density [kg/m3] | |
| potential temperature lapse rate [K/m] | |
| Subscripts | |
| initial, at time 0 | |
| 1st phase (diffusion phase) of the P2P model | |
| 2nd phase (rapid decay phase) of the P2P model | |
| at sea level | |
| free stream | |
| P2P/D2P decay model | |
| Sarpkaya’s decay model | |
| separation | |
| Superscripts | |
| normalized/dimensionless quantity | |
Appendix A
Further results from the CGM are included in this appendix as well as in Table S1 as supplementary material. Particularly, Table A1, Table A3 and Table A5 show, respectively, for the A330-301, B772LR, and A380-861, realistic combinations of flight operation conditions at FL200, FL300, and their respective ceilings (FL415, FL427, and FL431), for the scanned masses and Mach numbers. Table A2, Table A4 and Table A6 show, for several generator-follower horizontal and vertical separations, the maximum circulations of WV encountered by any aircraft that can fly at the ceilings of the A330-301, B772LR, and A380-861, respectively. The parameters are the same as in Table 3.

Table A1.
Realistic flight operation conditions for A330-301 at FL200, FL300, and FL415.
| FL200 | FL300 | FL415 | |||
|---|---|---|---|---|---|
| Mass (t) | (-) | Mass (t) | (-) | Mass (t) | (-) |
| 138 | 0.49 | 138 | 0.60 | 138 | 0.75 |
| 0.66 | 0.72 | 0.77 | |||
| 0.83 | 0.83 | 0.80 | |||
| 170 | 0.53 | 170 | 0.67 | ||
| 0.68 | 0.75 | ||||
| 0.83 | 0.83 | ||||
| 201 | 0.58 | 201 | 0.72 | ||
| 0.71 | 0.78 | ||||
| 0.83 | 0.83 | ||||
Table A2.
Maximum circulations of wake vortex encountered by aircraft behind several generator aircraft in realistic scenarios at the ceiling of A330-301, and flight conditions of the generator.
Table A2.
Maximum circulations of wake vortex encountered by aircraft behind several generator aircraft in realistic scenarios at the ceiling of A330-301, and flight conditions of the generator.
| Generator | Mass (t) | (-) | FL (-) | ||||||
|---|---|---|---|---|---|---|---|---|---|
| A330-301 | 138 | 0.76 | 415 | 451.10 | 0.5 | 447.74 | 429.34 | 4.11 | 20 |
| 3 | 431.32 | 414.93 | 24.64 | 120 | |||||
| 5 | 418.62 | 403.69 | 41.06 | 196 | |||||
| n/p | n/p | 425 | n/p | n/p | n/p | n/p | n/p | 1000 | |
| n/p | n/p | 435 | n/p | n/p | n/p | n/p | n/p | 2000 | |
| B772LR | 226 | 0.82 | 415 | 659.34 | 0.5 | 653.68 | 626.47 | 3.82 | 26 |
| 3 | 626.12 | 600.29 | 22.93 | 155 | |||||
| 5 | 604.92 | 580.07 | 38.22 | 255 | |||||
| 226 | 0.82 | 425 | 691.34 | 21.7 | 469.61 | 462.50 | 165.5 | 1000 | |
| n/p | n/p | 435 | n/p | n/p | n/p | n/p | n/p | 2000 | |
| A380-861 | 370 | 0.83 | 415 | 841.10 | 0.5 | 835.34 | 800.64 | 3.77 | 26 |
| 3 | 807.12 | 774.32 | 22.64 | 155 | |||||
| 5 | 785.23 | 753.77 | 37.73 | 255 | |||||
| 370 | 0.84 | 425 | 878.28 | 21.1 | 651.97 | 635.48 | 158.3 | 1000 | |
| n/p | n/p | 435 | n/p | n/p | n/p | n/p | n/p | 2000 |
n/p (not possible) means that the FL is above the maximum operating altitude of the generator.
Table A3.
Realistic flight operation conditions for B772LR at FL200, FL300, and FL427.
| FL200 | FL300 | FL427 | |||
|---|---|---|---|---|---|
| Mass (t) | (-) | Mass (t) | (-) | Mass (t) | (-) |
| 226 | 0.57 | 226 | 0.71 | 226 | 0.82 |
| 0.71 | 0.78 | ||||
| 0.84 | 0.84 | ||||
| 278 | 0.63 | 278 | 0.80 | ||
| 0.74 | 0.82 | ||||
| 0.84 | 0.84 | ||||
| 330 | 0.68 | 330 | 0.82 | ||
| 0.76 | 0.83 | ||||
| 0.84 | 0.84 | ||||
Table A4.
Maximum circulations of wake vortex encountered by aircraft behind several generator aircraft in realistic scenarios at the ceiling of B772LR, and flight conditions of the generator.
Table A4.
Maximum circulations of wake vortex encountered by aircraft behind several generator aircraft in realistic scenarios at the ceiling of B772LR, and flight conditions of the generator.
| Generator | Mass (t) | (-) | FL (-) | ||||||
|---|---|---|---|---|---|---|---|---|---|
| B772LR | 226 | 0.82 | 427 | 697.96 | 0.5 | 691.71 | 662.84 | 3.82 | 28 |
| 3 | 661.31 | 633.56 | 22.92 | 164 | |||||
| 5 | 637.95 | 611.03 | 38.19 | 269 | |||||
| n/p | n/p | 437 | n/p | n/p | n/p | n/p | n/p | 1000 | |
| n/p | n/p | 447 | n/p | n/p | n/p | n/p | n/p | 2000 | |
| A380-861 | 370 | 0.84 | 427 | 886.20 | 0.5 | 879.92 | 843.30 | 3.75 | 28 |
| 3 | 849.17 | 814.26 | 22.51 | 162 | |||||
| 5 | 825.35 | 791.63 | 37.52 | 267 | |||||
| n/p | n/p | 437 | n/p | n/p | n/p | n/p | n/p | 1000 | |
| n/p | n/p | 447 | n/p | n/p | n/p | n/p | n/p | 2000 |
n/p (not possible) means that the FL is above the maximum operating altitude of the generator.
Table A5.
Realistic flight operation conditions for A380-861 at FL200, FL300, and FL431.
| FL200 | FL300 | FL431 | |||
|---|---|---|---|---|---|
| Mass (t) | (-) | Mass (t) | (-) | Mass (t) | (-) |
| 370 | 0.56 | 370 | 0.69 | 370 | 0.84 |
| 0.71 | 0.77 | 0.85 | |||
| 0.86 | 0.86 | ||||
| 455 | 0.61 | 455 | 0.76 | ||
| 0.74 | 0.81 | ||||
| 0.86 | 0.86 | ||||
| 541 | 0.67 | 541 | 0.81 | ||
| 0.76 | 0.84 | ||||
| 0.86 | 0.86 | ||||
Table A6.
Maximum circulations of wake vortex encountered by aircraft behind several generator aircraft in realistic scenarios at the ceiling of A380-861, and flight conditions of the generator.
Table A6.
Maximum circulations of wake vortex encountered by aircraft behind several generator aircraft in realistic scenarios at the ceiling of A380-861, and flight conditions of the generator.
| Generator | Mass (t) | (-) | FL (-) | ||||||
|---|---|---|---|---|---|---|---|---|---|
| A380-861 | 370 | 0.84 | 431 | 902.39 | 0.5 | 895.92 | 858.60 | 3.75 | 28 |
| 3 | 864.22 | 828.54 | 22.49 | 165 | |||||
| 5 | 839.67 | 805.13 | 37.48 | 271 | |||||
| n/p | n/p | 441 | n/p | n/p | n/p | n/p | n/p | 1000 | |
| n/p | n/p | 451 | n/p | n/p | n/p | n/p | n/p | 2000 |
n/p (not possible) means that the FL is above the maximum operating altitude of the generator.
References
- EASA. EASA Safety Information Bulletin—Operations—SIB No.: 2017-10—En-Route Wake Turbulence Encounters. 2017. Available online: https://ad.easa.europa.eu/blob/EASA_SIB_2017_10.pdf/SIB_2017-10_1 (accessed on 15 July 2021).
- De Visscher, I.; Lonfils, T.; Winckelmans, G. Fast-time modeling of ground effects on wake vortex transport and decay. J. Aircr. 2013, 50, 1514–1525. [Google Scholar] [CrossRef]
- De Visscher, I.; Winckelmans, G.; Treve, V. A Simple Wake Vortex Encounter Severity Metric—Rolling Moment Coefficient due to Encounter of an Aircraft with a Wake Vortex. In Proceedings of the 11th USA/Europe Air Traffic Management Research and Development Seminar, ATM 2015, Lisbon, Portugal, 23–26 June 2015; pp. 1–10. [Google Scholar]
- ICAO International Working Group. Safety Case for Wake Vortex Encounter Risk due to the Airbus A380-800, 4th ed.; ICAO International Working Group: Montreal, QC, Canada, 2008; pp. 1–92. [Google Scholar]
- ICAO International Working Group. Safety Case for Wake Vortex Separation Minima for the B747-8, 1st ed.; ICAO International Working Group: Montreal, QC, Canada, 2011. [Google Scholar]
- Holzäpfel, F.; Frech, M.; Gerz, T.; Tafferner, A.; Hahn, K.-U.; Schwarz, C.; Joos, H.-D.; Korn, B.; Lenz, H.; Luckner, R.; et al. Aircraft wake vortex scenarios simulation package—WakeScene. Aerosp. Sci. Technol. 2009, 13, 1–11. [Google Scholar] [CrossRef] [Green Version]
- Matayoshi, N. Dynamic wake vortex separation combining with traffic optimization. In Proceedings of the 29th International Congress on Aeronautical Sciences, Saint Petersburg, Russia, 7–12 September 2014; pp. 1–10. [Google Scholar]
- Höhne, G.; Fuhrmann, M.; Luckner, R. Critical wake vortex encounter scenarios. In Proceedings of the German Aerospace Congress, Munich, Germany, 17–20 November 2003; pp. 1–11. [Google Scholar]
- Holzäpfel, F. Effects of environmental and aircraft parameters on wake vortex behavior. J. Aircr. 2014, 51, 1490–1500. [Google Scholar] [CrossRef]
- De Cleyn, K. Forecast Based En-Route Wake Turbulence Separation. Master’s Thesis, Delft University of Technology, Delft, The Netherlands, 2011. [Google Scholar]
- Rossow, V.J.; James, K.D. Overview of wake-vortex hazards during cruise. J. Aircr. 2000, 37, 960–975. [Google Scholar] [CrossRef]
- Hoogstraten, M.; Visser, H.G.; Hart, D.; Treve, V.; Rooseleer, F. Improved Understanding of En-route Wake Vortex Encounters. J. Aircr. 2015, 52, 981–989. [Google Scholar] [CrossRef]
- Nelson, R.C. Trailing Vortex Wake Encounters at Altitude—A Potential Flight Safety Issue? In Proceedings of the AIAA Atmospheric Flight Mechanics Conference and Exhibit, Keystone, CO, USA, 21–24 August 2006; Volume 6268, pp. 1–17. [Google Scholar] [CrossRef] [Green Version]
- Nelson, R.C. The trailing vortex wake hazard: Beyond the takeoff and landing corridors. In Proceedings of the AIAA Atmospheric Flight Mechanics Conference and Exhibit, Providence, RI, USA, 16–19 August 2004; pp. 1–14. [Google Scholar]
- Holzäpfel, F.; Reinke, A.; Kauertz, S.; Konopka, J.; Bauer, T.; Fischenberg, D.; Niedermeier, D.; Schwarz, C.; Vechtel, D.; Wolkensinger, C.; et al. Aircraft Wake Vortex State-of-the-Art & Research Needs. 2015. Available online: https://0-doi-org.brum.beds.ac.uk/10.17874/BFAEB7154B0 (accessed on 15 July 2021).
- Hradecky, S. Accident: Emirates A388 over Arabian Sea on 7th January 2017, Wake Turbulence Sends Business Jet in Uncontrolled Descent. Aviat Her 2017. Available online: https://avherald.com/h?article=4a5e80f3 (accessed on 27 November 2020).
- EUROCONTROL Experimental Centre (EEC). User Manual for the Base of Aircraft Data (BADA) Family 4; EEC Technical/Scientific Report No. 12/11/22-58; EEC: Brétigny-Sur-Orge, France, 2014; pp. 1–118. [Google Scholar]
- Campos, L.M.B.C.; Marques, J.M.G. On wake vortex response for several combinations of leading and following aircraft. Aeronaut. J. 2004, 108, 295–310. [Google Scholar] [CrossRef]
- Klar, J.-U.; Breitsamter, C. Unsteady aerodynamic loads on a high-agility aircraft due to wake vortex encounter. J. Aircr. 2014, 51, 1511–1521. [Google Scholar] [CrossRef]
- Melgosa, M.; Ruiz, S.; Busto, J.; Steen, M.; Rojas, J.I.; Prats, X. Wake vortex hazards in en-route airspace and suspected hazard area identification using high fidelity simulation models. In Proceedings of the IEEE/AIAA 37th Digital Avionics Systems Conference, London, UK, 23–27 September 2018; pp. 1–10. [Google Scholar]
- Luckner, R.; Reinke, A. Pilot Models for Simulation of Wake Vortex Encounters in Cruise. In Proceedings of the AIAA Atmospheric and Space Environments Conference, Toronto, ON, Canada, 2–5 August 2010; pp. 1–32. [Google Scholar] [CrossRef]
- Greene, G.C. An approximate model of vortex decay in the atmosphere. J. Aircr. 1986, 23, 566–573. [Google Scholar] [CrossRef]
- De Visscher, I.; Bricteux, L.; Winckelmans, G. Aircraft vortices in stably stratified and weakly turbulent atmospheres: Simulation and modeling. AIAA J. 2013, 51, 551–566. [Google Scholar] [CrossRef]
- Misaka, T.; Holzäpfel, F.; Hennemann, I.; Gerz, T.; Manhart, M.; Schwertfirm, F. Vortex bursting and tracer transport of a counter-rotating vortex pair. Phys. Fluids 2012, 24, 025104. [Google Scholar] [CrossRef] [Green Version]
- Azorín-Molina, C.; Vicente-Serrano, S.M.; McVicar, T.R.; Jerez, S.; Sanchez-Lorenzo, A.; López-Moreno, J.-I.; Revuelto, J.; Trigo, R.M.; Lopez-Bustins, J.A.; Espírito-Santo, F.; et al. Homogenization and assessment of observed near-surface wind speed trends over Spain and Portugal, 1961–2011. J. Clim. 2014, 27, 3692–3712. [Google Scholar] [CrossRef]
- Sarpkaya, T.; Robins, R.; Delisi, D. Wake-vortex eddy-dissipation model predictions compared with observations. J. Aircr. 2001, 38, 687–692. [Google Scholar] [CrossRef]
- Sarpkaya, T. New model for vortex decay in the atmosphere. J. Aircr. 2000, 37, 53–61. [Google Scholar] [CrossRef]
- Ning, S.A.; Flanzer, T.C.; Kroo, I.M. Aerodynamic performance of extended formation flight. J. Aircr. 2011, 48, 855–865. [Google Scholar] [CrossRef]
- Proctor, F.H.; Hamilton, D.W. Evaluation of Fast-Time Wake Vortex Prediction Models. In Proceedings of the 47th AIAA Aerospace Sciences Meeting including the New Horizons Forum and Aerospace Exposition, Orlando, FL, USA, 5–8 January 2009; pp. 1–10. [Google Scholar] [CrossRef] [Green Version]
- Holzäpfel, F.; Robins, R.E. Probabilistic Two-Phase Aircraft Wake Vortex Model: Application and Assessment. J. Aircr. 2004, 41, 1117–1126. [Google Scholar] [CrossRef]
- Holzäpfel, F. Probabilistic Two-Phase Wake Vortex Decay and Transport Model. J. Aircr. 2003, 40, 323–331. [Google Scholar] [CrossRef] [Green Version]
- Holzäpfel, F.; Gerz, T.; Baumann, R. The turbulent decay of trailing vortex pairs in stably stratified environments. Aerosp. Sci. Technol. 2001, 5, 95–108. [Google Scholar] [CrossRef]
- Proctor, F.H.; Switzer, G.F. Numerical simulation of aircraft trailing vortices. In Proceedings of the 9th Conference on Aviation, Range, and Aerospace Meteorology, Orlando, FL, USA, 11–15 September 2000; pp. 511–516. [Google Scholar]
- Burnham, D.; Hallock, J.N. Chicago Monoacoustic Vortex Sensing System. Volume IV. Wake Vortex Decay; Transportation Systems Center: Cambridge, MA, USA, 1982. [Google Scholar]
- Rosenhead, L. The Formation of Vortices from a Surface of Discontinuity; Series A; Royal Society London: London, UK, 1932; pp. 170–192. [Google Scholar]
- Schwarz, C.W.; Hahn, K.-U.; Fischenberg, D. Wake Encounter Severity Assessment Based on Validated Aerodynamic Interaction Models. In Proceedings of the AIAA Atmospheric and Space Environments Conference, Toronto, ON, Canada, 2–5 August 2010; pp. 1–9. [Google Scholar] [CrossRef] [Green Version]
- Fischenberg, D. Determination of wake vortex characteristics from flight test data. In Proceedings of the German Aerospace Congress, Stuttgart, Germany, 23–26 September 2002. DGLR-JT2002-170. [Google Scholar]
- Jategaonkar, R.; Fischenberg, D.; Gruenhagen, W.V. Aerodynamic modeling and system identification from flight data–Recent applications at DLR. J. Aircr. 2004, 41, 687. [Google Scholar] [CrossRef]
- Trillo Arroyo, J.L. Effect of Large Fuel Tanks on Aerodynamic Performances of Blended Wing Body Aircraft. Bachelor’s Thesis, Universitat Politècnica de Catalunya, Barcelona, Spain, 2018. [Google Scholar]
- Hahn, K.-U.; Schwarz, C.W.; Friehmelt, H. A simplified hazard area prediction (SHAPE) model for wake vortex encounter avoidance. In Proceedings of the 24th International Congress on Aeronautical Sciences, Yokohama, Japan, 29 August–3 September 2004; pp. 1–13. [Google Scholar]
- White, F.M. Fluid Mechanics, 5th ed.; McGraw-Hill: Boston, MA, USA, 2003; pp. 1–866. [Google Scholar]
- Hahn, K.-U.; Schwarz, C.W. Safe limits for wake vortex penetration. In Proceedings of the AIAA Guidance, Navigation and Control Conference and Exhibition, Hilton Head, SC, USA, 20–23 August 2007. AIAA 2007-6871. [Google Scholar] [CrossRef] [Green Version]
- Gerz, T.; Holzäpfel, F.; Darracq, D. Commercial Aircraft Wake Vortices. Prog. Aerosp. Sci. 2002, 38, 181–208. [Google Scholar] [CrossRef]
- Burnham, D.C.; Hallock, J.N. Decay Characteristics of Wake Vortices from Jet Transport Aircraft. J. Aircr. 2013, 50, 82–87. [Google Scholar] [CrossRef] [Green Version]
- Barbaresco, F.; Thobois, L.; Dolfi-Bouteyre, A.; Jeannin, N.; Wilson, R.; Valla, M.; Hallermeyer, A.; Feneyrou, P.; Brion, V.; Besson, L.; et al. Monitoring wind, turbulence and aircraft wake vortices by high resolution RADAR and LIDAR remote sensors in all weather conditions. J. Sci. URSI Fr. 2015, 81–110. [Google Scholar]
- Meischner, P.; Baumann, R.; Höller, H.; Jank, T. Eddy dissipation rates in thunderstorms estimated by Doppler radar in relation to aircraft in situ measurements. J. Atmos. Ocean. Technol. 2001, 18, 1609–1627. [Google Scholar] [CrossRef]
- Nastrom, G.D.; Eaton, F.D. Turbulence eddy dissipation rates from radar observations at 5–20 km at White Sands Missile Range, New Mexico. J. Geophys. Res. 1997, 102, 19495–19505. [Google Scholar] [CrossRef] [Green Version]
- Kaden, A.; Luckner, R. Impact of wake vortex deformation on aircraft encounter hazard. J. Aircr. 2019, 56, 800–811. [Google Scholar] [CrossRef]
- Schwarz, C.W.; Hahn, K.-U. Hazard of wake vortex encounter. In Proceedings of the German Aerospace Congress, Munich, Germany, 17–20 November 2003. DGLR-JT2003-242. [Google Scholar]
- Sammonds, R.I.; Stinnett, G.W., Jr.; Larsen, W.E. Criteria relating wake vortex encounter hazard to aircraft response. J. Aircr. 1977, 14, 981–987. [Google Scholar] [CrossRef]
- Loucel, R.E.; Crouch, J.D. Flight-simulator study of airplane encounters with perturbed trailing vortices. J. Aircr. 2005, 42, 924–931. [Google Scholar] [CrossRef]
- Dalmau, R.; Prats, X. Assessing the impact of relaxing cruise operations with a reduction of the minimum rate of climb and/or step climb heights. Aerosp. Sci. Technol. 2017, 70, 61–70. [Google Scholar] [CrossRef] [Green Version]
- Holzäpfel, F. Probabilistic two-phase aircraft wake-vortex model: Further development and assessment. J. Aircr. 2006, 43, 700–708. [Google Scholar] [CrossRef]
- Nuic, A. BADA APM: What’s new? In Proceedings of the 2018 Base of Aircraft Data User Group and Conference, Cornwall, ON, Canada, 3 August 2018. [Google Scholar]
- ICAO. Doc 9574 AN/934—Manual on Implementation of a 300 m (1000 ft) Vertical Separation Minimum Between FL 290 and FL 410 Inclusive; ICAO: Montreal, QB, Canada, 2002. [Google Scholar]
- Xu, Y.; Dalmau, R.; Prats, X. Maximizing airborne delay at no extra fuel cost by means of linear holding. Transp. Res. Part C 2017, 81, 137–152. [Google Scholar] [CrossRef] [Green Version]
Figure 1.
Parameter vs. generator aircraft mass , assuming linearity between wing lay-out area and as in [39].
Figure 1.
Parameter vs. generator aircraft mass , assuming linearity between wing lay-out area and as in [39].

Figure 2.
Parameter vs. flight altitude of the generator aircraft.

Figure 3.
Parameter and vs. time of the catastrophic wake demise event , for s and m2/s.

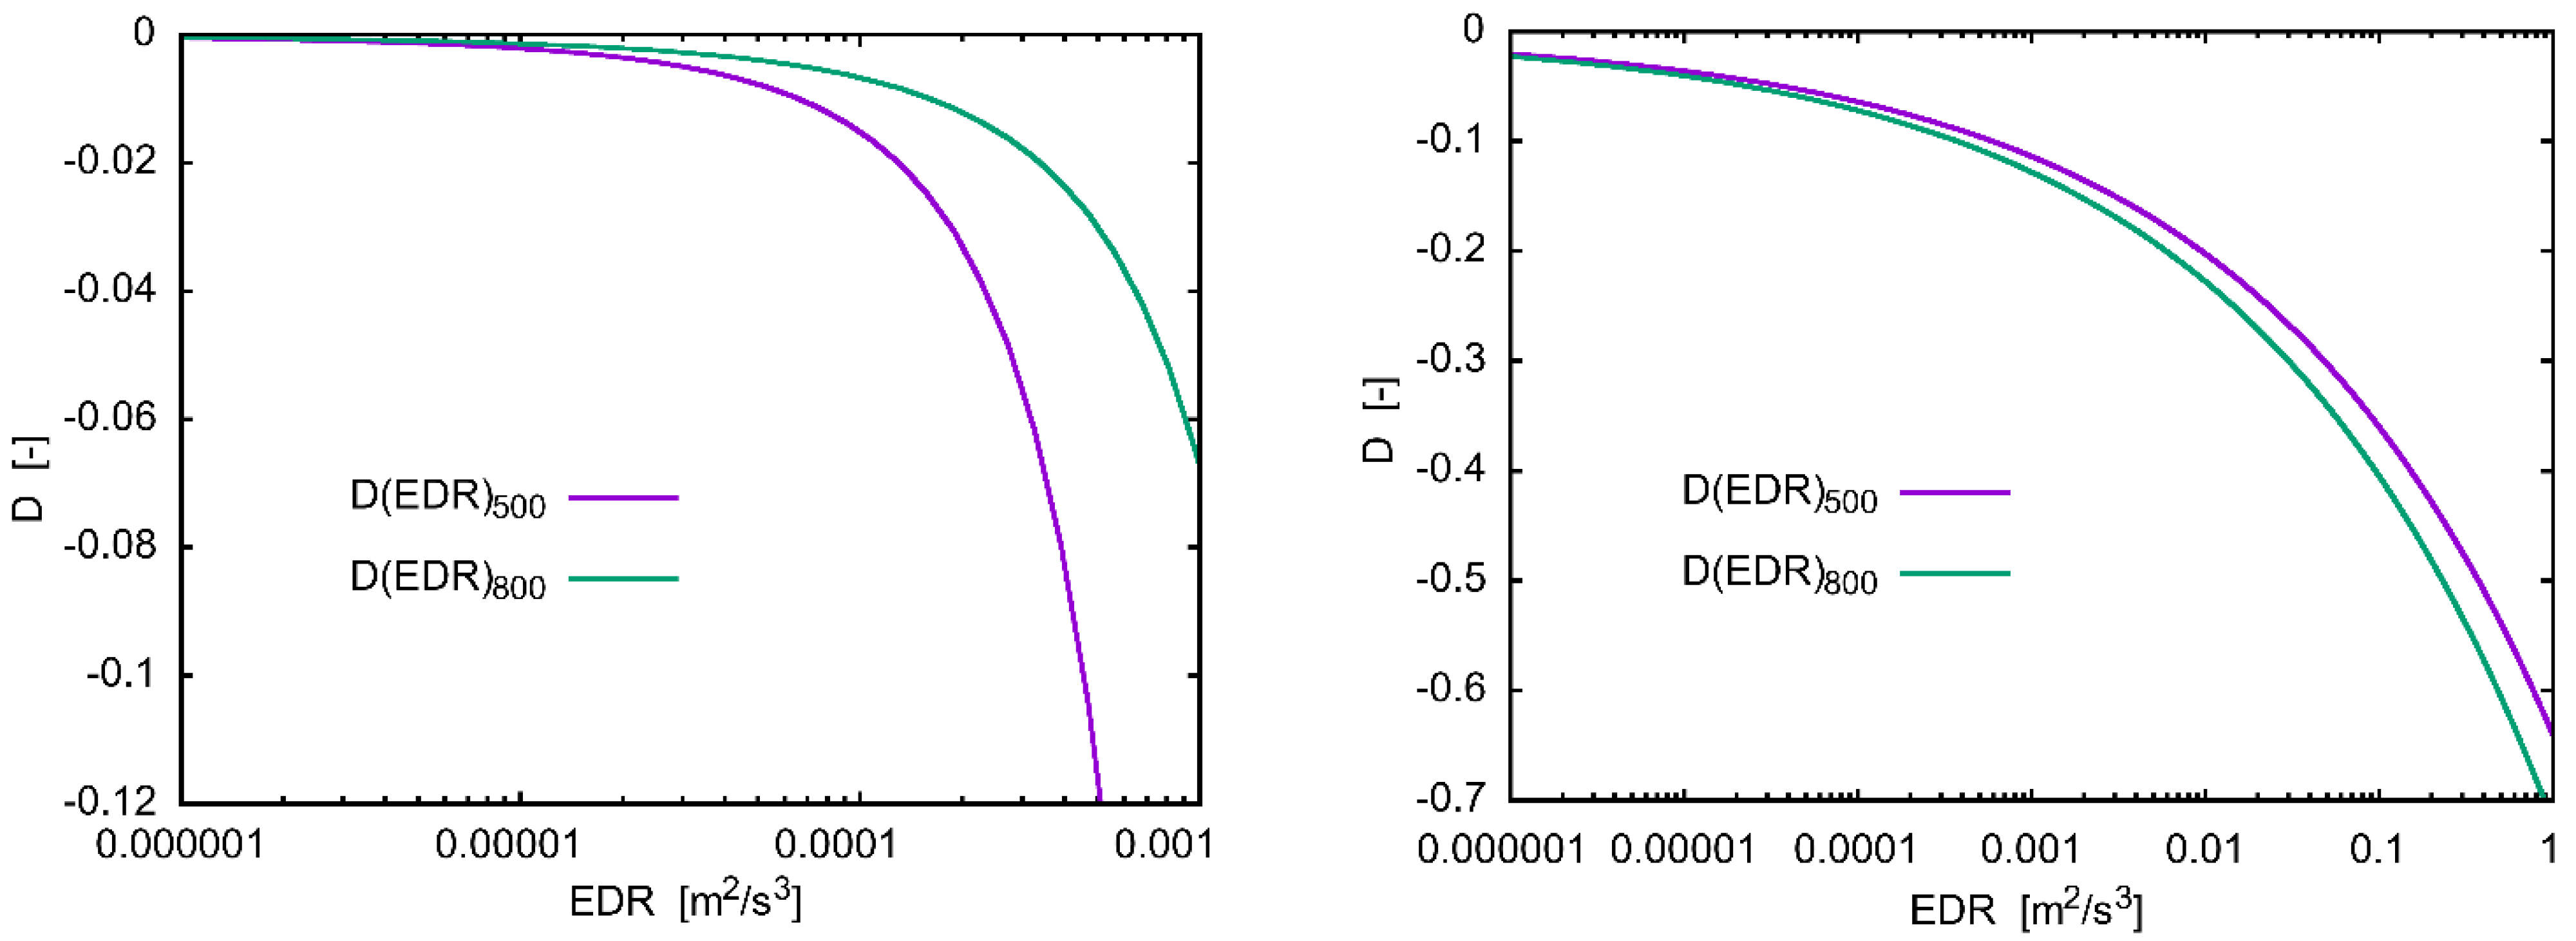
Figure 4.
Parameter vs. eddy dissipation rate (EDR), for s, wing span m, and and m2/s, from (left) Equation (27) and (right) Equation (28).
Figure 4.
Parameter vs. eddy dissipation rate (EDR), for s, wing span m, and and m2/s, from (left) Equation (27) and (right) Equation (28).

Figure 5.
Parameter vs. span-wise load factor , for WV core radius , as in [43].
Figure 5.
Parameter vs. span-wise load factor , for WV core radius , as in [43].

Figure 6.
Wake vortex circulation vs. time from Sarpkaya’s [26] and P2P/D2P [31] decay models, and data for and , taken from [24], for A380-861 aircraft.

Figure 7.
Maximum initial wake vortex circulation vs. flight level (1 FL = 100 ft) and aircraft mass (in tons), for aircraft (a) A320-212, (b) A330-301, (c) B772LR, and (d) A380-861.
Figure 7.
Maximum initial wake vortex circulation vs. flight level (1 FL = 100 ft) and aircraft mass (in tons), for aircraft (a) A320-212, (b) A330-301, (c) B772LR, and (d) A380-861.

Figure 8.
Wake vortex descent in altitude vs. time from the Burnham-Hallock model [34], and data for and [24], for the A380-861 aircraft.

Table 1.
Maximum circulations of the wake vortex generated by several aircraft and flight conditions of the generator.
Table 1.
Maximum circulations of the wake vortex generated by several aircraft and flight conditions of the generator.
| Generator | Mass (t) | (-) | FL (-) | |||||||||
|---|---|---|---|---|---|---|---|---|---|---|---|---|
| F100-650 | 44 | 205.26 | 0.69 | 350 | 0.98 | 22.05 | 248.45 | 0.5 | 243.82 | 233.60 | 4.51 | 26 |
| 3 | 221.95 | 212.35 | 27.07 | 150 | ||||||||
| 5 | 205.87 | 197.24 | 45.11 | 241 | ||||||||
| 32.9 | 72.07 | n/a | 297.0 | 1000 | ||||||||
| n/a | n/a | n/a | n/a | 2000 | ||||||||
| A320-212 | 50 | 220.96 | 0.75 | 370 | 1.19 | 26.78 | 289.83 | 0.5 | 268.84 | 257.73 | 4.19 | 22 |
| 3 | 251.28 | 241.26 | 25.14 | 128 | ||||||||
| 5 | 238.06 | 228.96 | 41.91 | 208 | ||||||||
| 34.7 | 106.77 | n/a | 290.6 | 1000 | ||||||||
| n/a | n/a | n/a | n/a | 2000 | ||||||||
| A330-301 | 138 | 225.50 | 0.76 | 410 | 2.11 | 47.36 | 525.68 | 0.5 | 447.74 | 429.34 | 4.11 | 20 |
| 3 | 431.32 | 414.93 | 24.64 | 120 | ||||||||
| 5 | 418.62 | 403.69 | 41.06 | 196 | ||||||||
| 30.6 | 285.71 | 294.70 | 251.0 | 1000 | ||||||||
| 88.4 | 120.34 | n/a | 726.2 | 2000 | ||||||||
| B772LR | 226 | 242.45 | 0.82 | 427 | 2.20 | 49.43 | 697.96 | 0.5 | 691.71 | 662.84 | 3.82 | 28 |
| 3 | 661.31 | 633.56 | 22.92 | 164 | ||||||||
| 5 | 637.95 | 611.03 | 38.19 | 269 | ||||||||
| 21.4 | 474.66 | 467.05 | 163.8 | 1000 | ||||||||
| 56.8 | 251.41 | n/a | 433.8 | 2000 | ||||||||
| A380-861 | 370 | 247.07 | 0.84 | 431 | 2.79 | 62.64 | 902.39 | 0.5 | 895.92 | 858.60 | 3.75 | 28 |
| 3 | 864.22 | 828.54 | 22.49 | 165 | ||||||||
| 5 | 839.67 | 805.13 | 37.48 | 271 | ||||||||
| 20.5 | 671.45 | 653.16 | 153.9 | 1000 | ||||||||
| 49.8 | 440.42 | 332.44 | 373.3 | 2000 |
n/a (not applicable) means that the WV does not sink 1000 or 2000 ft or is null, with the corresponding sinking model.
Table 2.
Realistic flight operation conditions for the A320-212 at FL200, FL300, FL395, and FL398.
| FL200 | FL300 | FL395 | FL398 | ||||
|---|---|---|---|---|---|---|---|
| Mass (t) | (-) | Mass (t) | (-) | Mass (t) | (-) | Mass (t) | (-) |
| 50 | 0.50 | 50 | 0.60 | 50 | 0.75 | 50 | 0.75 |
| 0.65 | 0.70 | 0.77 | 0.77 | ||||
| 0.80 | 0.80 | 0.80 | 0.80 | ||||
| 62 | 0.54 | 62 | 0.66 | ||||
| 0.67 | 0.73 | ||||||
| 0.80 | 0.80 | ||||||
| 73 | 0.58 | 73 | 0.73 | ||||
| 0.69 | 0.76 | ||||||
| 0.80 | 0.80 | ||||||
Table 3.
Maximum circulations of wake vortex encountered by aircraft behind several generator aircraft in realistic scenarios, and flight conditions of the generator.
Table 3.
Maximum circulations of wake vortex encountered by aircraft behind several generator aircraft in realistic scenarios, and flight conditions of the generator.
| Generator | Mass (t) | (-) | FL (-) | ||||||
|---|---|---|---|---|---|---|---|---|---|
| F100-650 | 44 | 0.54 | 200 | 172.45 | 0.5 | 169.54 | 162.67 | 5.38 | 22 |
| 3 | 155.71 | 150.29 | 32.30 | 125 | |||||
| 5 | 145.46 | 141.25 | 53.84 | 202 | |||||
| 44 | 0.55 | 210 | 176.12 | 43.3 | 40.20 | n/a | 460.0 | 1000 | |
| 44 | 0.56 | 220 | 179.98 | n/a | n/a | n/a | n/a | 2000 | |
| 44 | 0.64 | 300 | 217.62 | 0.5 | 213.74 | 204.90 | 4.77 | 24 | |
| 3 | 195.38 | 187.56 | 28.63 | 140 | |||||
| 5 | 181.83 | 175.08 | 47.71 | 225 | |||||
| 44 | 0.65 | 310 | 223.32 | 35.9 | 60.79 | n/a | 338.8 | 1000 | |
| 44 | 0.66 | 320 | 229.26 | n/a | n/a | n/a | n/a | 2000 | |
| 44 | 0.69 | 350 | 248.45 | 0.5 | 243.82 | 233.60 | 4.51 | 26 | |
| 3 | 221.95 | 212.35 | 27.07 | 150 | |||||
| 5 | 205.87 | 197.24 | 45.11 | 241 | |||||
| n/p | n/p | 360 | n/p | n/p | n/p | n/p | n/p | 1000 | |
| n/p | n/p | 370 | n/p | n/p | n/p | n/p | n/p | 2000 | |
| A320-212 | 73 | 0.58 | 200 | 223.40 | 0.5 | 220.30 | 211.33 | 5.04 | 22 |
| 3 | 205.41 | 198.01 | 30.24 | 126 | |||||
| 5 | 194.23 | 188.05 | 50.39 | 204 | |||||
| 73 | 0.59 | 210 | 228.04 | 36.0 | 83.10 | n/a | 358.0 | 1000 | |
| 73 | 0.60 | 220 | 232.67 | n/a | n/a | n/a | n/a | 2000 | |
| 73 | 0.73 | 300 | 264.63 | 0.5 | 261.15 | 250.37 | 4.19 | 21 | |
| 3 | 244.45 | 234.82 | 25.15 | 124 | |||||
| 5 | 231.86 | 223.17 | 41.91 | 202 | |||||
| 73 | 0.74 | 310 | 271.27 | 35.3 | 106.15 | n/a | 292.0 | 1000 | |
| 73 | 0.75 | 320 | 279.41 | n/a | n/a | n/a | n/a | 2000 | |
| 50 | 0.75 | 395 | 269.40 | 0.5 | 265.80 | 254.82 | 4.20 | 22 | |
| 3 | 248.53 | 238.67 | 25.22 | 127 | |||||
| 5 | 235.53 | 226.60 | 42.03 | 206 | |||||
| n/p | n/p | 405 | n/p | n/p | n/p | n/p | n/p | 1000 | |
| n/p | n/p | 415 | n/p | n/p | n/p | n/p | n/p | 2000 | |
| A330-301 | 201 | 0.58 | 200 | 347.43 | 0.5 | 344.82 | 330.80 | 5.03 | 19 |
| 3 | 332.02 | 320.31 | 30.20 | 113 | |||||
| 5 | 322.12 | 312.12 | 50.34 | 185 | |||||
| 201 | 0.60 | 210 | 352.94 | 33.1 | 214.77 | 229.19 | 326.8 | 1000 | |
| 201 | 0.61 | 220 | 358.47 | 101.4 | 79.05 | n/a | 983.5 | 2000 | |
| 201 | 0.72 | 300 | 416.52 | 0.5 | 413.51 | 396.56 | 4.24 | 19 | |
| 3 | 398.75 | 383.87 | 25.43 | 114 | |||||
| 5 | 387.32 | 373.96 | 42.38 | 187 | |||||
| 201 | 0.73 | 310 | 426.48 | 31.9 | 267.79 | 278.24 | 266.6 | 1000 | |
| 201 | 0.75 | 320 | 437.37 | 91.5 | 114.10 | n/a | 755.6 | 2000 | |
| 170 | 0.78 | 395 | 492.48 | 0.5 | 488.66 | 468.51 | 4.01 | 22 | |
| 3 | 470.00 | 451.77 | 24.06 | 127 | |||||
| 5 | 455.58 | 438.73 | 40.10 | 209 | |||||
| 170 | 0.79 | 405 | 514.09 | 27.4 | 331.72 | 336.77 | 218.4 | 1000 | |
| 138 | 0.76 | 415 | 451.10 | 88.4 | 120.34 | n/a | 726.2 | 2000 | |
| B772LR | 330 | 0.68 | 200 | 464.19 | 0.5 | 460.76 | 441.84 | 4.28 | 21 |
| 3 | 443.98 | 427.23 | 25.70 | 123 | |||||
| 5 | 431.01 | 415.82 | 42.83 | 202 | |||||
| 330 | 0.70 | 210 | 470.17 | 29.7 | 304.35 | 312.39 | 248.8 | 1000 | |
| 330 | 0.72 | 220 | 476.08 | 83.9 | 141.37 | n/a | 688.2 | 2000 | |
| 330 | 0.82 | 300 | 577.86 | 0.5 | 573.46 | 549.71 | 3.74 | 23 | |
| 3 | 551.98 | 529.95 | 22.46 | 134 | |||||
| 5 | 535.38 | 514.58 | 37.44 | 220 | |||||
| 330 | 0.82 | 310 | 600.50 | 25.6 | 401.29 | 400.78 | 192.0 | 1000 | |
| 330 | 0.82 | 320 | 625.09 | 65.7 | 214.51 | n/a | 494.2 | 2000 | |
| 226 | 0.82 | 395 | 600.46 | 0.5 | 595.65 | 570.95 | 3.83 | 24 | |
| 3 | 572.17 | 549.14 | 22.99 | 142 | |||||
| 5 | 554.05 | 532.21 | 38.32 | 233 | |||||
| 226 | 0.82 | 405 | 628.99 | 23.9 | 422.69 | 420.15 | 182.8 | 1000 | |
| 226 | 0.82 | 415 | 659.34 | 60.7 | 231.82 | n/a | 463.8 | 2000 | |
| A380-861 | 541 | 0.67 | 200 | 616.35 | 0.5 | 612.45 | 587.27 | 4.40 | 22 |
| 3 | 593.30 | 570.75 | 26.40 | 133 | |||||
| 5 | 578.41 | 557.78 | 44.00 | 219 | |||||
| 541 | 0.68 | 210 | 626.53 | 26.0 | 450.80 | 451.58 | 225.2 | 1000 | |
| 541 | 0.70 | 220 | 637.01 | 65.0 | 281.29 | 172.57 | 552.4 | 2000 | |
| 541 | 0.81 | 300 | 754.57 | 0.5 | 749.80 | 718.75 | 3.78 | 24 | |
| 3 | 726.36 | 697.48 | 22.70 | 140 | |||||
| 5 | 708.14 | 680.81 | 37.83 | 230 | |||||
| 541 | 0.82 | 310 | 778.63 | 23.8 | 572.01 | 562.66 | 179.4 | 1000 | |
| 541 | 0.82 | 320 | 804.31 | 56.7 | 380. 58 | 271.68 | 424.4 | 2000 | |
| 370 | 0.82 | 395 | 775.15 | 0.5 | 770.08 | 738.17 | 3.83 | 25 | |
| 3 | 745.24 | 715.47 | 22.97 | 145 | |||||
| 5 | 725.95 | 697.70 | 38.28 | 239 | |||||
| 370 | 0.83 | 405 | 806.90 | 22.8 | 594.71 | 583.35 | 172.8 | 1000 | |
| 370 | 0.83 | 415 | 841.10 | 53.5 | 403.16 | 294.62 | 403.6 | 2000 |
n/a (not applicable) means that the WV does not sink 1000 or 2000 ft or is null, with the corresponding sinking model. n/p (not possible) means that the FL is above the maximum operating altitude of the generator.
Publisher’s Note: MDPI stays neutral with regard to jurisdictional claims in published maps and institutional affiliations. |
© 2021 by the authors. Licensee MDPI, Basel, Switzerland. This article is an open access article distributed under the terms and conditions of the Creative Commons Attribution (CC BY) license (https://creativecommons.org/licenses/by/4.0/).
Share and Cite
MDPI and ACS Style
Rojas, J.I.; Melgosa, M.; Prats, X. Sensitivity Analysis of Maximum Circulation of Wake Vortex Encountered by En-Route Aircraft. Aerospace 2021, 8, 194. https://0-doi-org.brum.beds.ac.uk/10.3390/aerospace8070194
AMA Style
Rojas JI, Melgosa M, Prats X. Sensitivity Analysis of Maximum Circulation of Wake Vortex Encountered by En-Route Aircraft. Aerospace. 2021; 8(7):194. https://0-doi-org.brum.beds.ac.uk/10.3390/aerospace8070194
Chicago/Turabian StyleRojas, Jose I., Marc Melgosa, and Xavier Prats. 2021. "Sensitivity Analysis of Maximum Circulation of Wake Vortex Encountered by En-Route Aircraft" Aerospace 8, no. 7: 194. https://0-doi-org.brum.beds.ac.uk/10.3390/aerospace8070194
Note that from the first issue of 2016, this journal uses article numbers instead of page numbers. See further details here.