Article

Environmental Effects on Yield and Composition of Essential Oil in Wild Populations of Spike Lavender (Lavandula latifolia Medik.)

by
Montserrat Fernández-Sestelo
1,2,* and
José M. Carrillo
3
1
Plant Genetic Resources Center, Instituto Nacional Investigación y Tecnología Agraria y Alimentaria, Autovía de Aragón km 36.200, Finca La Canaleja INIA, 28800 Alcalá de Henares, Spain
2
Biotechnology and Genetic Resources of Plants and Associated Microorganisms, School of Agricultural Engineering, Universidad Politécnica de Madrid, Avenida Puerta de Hierro 2, 28040 Madrid, Spain
3
Department of Biotechnology and Plant Biology, School of Agricultural Engineering, Universidad Politécnica de Madrid, Avenida Puerta de Hierro 2, 28040 Madrid, Spain
*
Author to whom correspondence should be addressed.
Submission received: 9 November 2020 / Revised: 9 December 2020 / Accepted: 10 December 2020 / Published: 12 December 2020

Abstract

:
Spike lavender, Lavandula latifolia Medik., is a species of economic importance for its essential oil (EO). The purpose of this study was to estimate the effect of the variable climate and fixed factors such as soil and geographic location on EO yield and quality. The study material was collected in 34 populations from four different Spanish bioregions for three years. The EO extraction from spike lavender leaves and flowers was done with simple hydrodistillation, in Clevenger. Soil samples were also collected. Climate data were provided by the State Meteorological Agency. The EO average yield was obtained for the bioregion mean and in each bioregion. The higher EO yield is related clearly to the climate condition. A greater amount of annual rainfall produced a higher EO yield in the four bioregions and of better quality. Soils richer in organic matter and minerals produced higher EO yield but with less quality. The altitude had little effect on EO yield. Higher altitude favored obtaining higher EO quality. At lower latitude, further south, the populations obtained a higher EO yield. The evaluation of the environmental effect on the EO yield and quality could allow better natural conservation and more accurate selection of the best populations for breeding and spike lavender cultivation protocols.

1. Introduction

The genus Lavandula of the Lamiaceae family comprises about 39 species [1]. This genus is made up of small perennial green shrubs, with aromatic flowers and forage from which essential oil (EO) can be obtained. The main species of the genus from which commercial EO is obtained are Lavandula latifolia Medik. with an estimated average annual production of 200 t, Lavandula angustifolia Mill. with another 200 t, and the hybrid of the two previous species, called Lavandin (L x intermedia Emerik ex Loisel) with about 1000 t [2]. In France, in 2018, 4662 ha of L. angustifolia Mill were cultivated with a production of 116.62 t of EO and 20,770 ha of Lavandin with a production of 1646.13 t of EO [3], which represents slightly more than 3 times kg/ha yield than lavender.
The spike lavender (L. latifolia Medik.) is native to the Mediterranean region, growing wild mainly in the former Yugoslavia, Italy, France, Spain, and Portugal [1]. It grows in forest clearings, especially in limestone rocky or dry pastures on sunny slopes, in basic substrates and alluvial sands [1]. It prefers areas between 600–1000 m of altitude [4]. It is collected in the field and cultivated for its EO, to which antibacterial and antifungal, sedative, and antidepressant properties have been attributed, highly appreciated in aromatherapy and phytotherapy [5,6,7], and is a source of natural antioxidants [8,9]. The spike lavender has been in the past in Spanish regions the species with the highest incidence in its spontaneous collection for the perfume industry [4].
Due to its economic importance, the composition of the spike lavender EO has been widely studied (bibliographic reviews by Boelens [10], García-Vallejo [11], Lis-Balchin [12]). Spike lavender EO consists mainly of monoterpenes and is produced and stored in the glandular trichomes that cover the surface of the aerial parts of the plant, although its production and composition are different in the flower than in other parts of the plant [13]. The main monoterpenes are 1,8-cineole, linalool, and camphor, which determine the olfactory body of EO and comprise about 80% of EO [10,12]. The commercial value of an aromatic plant is determined by the EO yield and composition. Higher levels of linalool and lower amounts of 1,8-cineole and camphor in L. latifolia Medik. are positive factors for the pharmaceutical and cosmetic industry and are considered higher quality EO [10,14]. EO with high proportions of camphor is used in the phytosanitary industry [7,15].
The EO of spike lavender, like that of other EOs, is the end product of a complex biological process and its production and composition can vary considerably at the intraspecific level depending on the genotype, on the part of the plant that is used for extraction [10,13], on environmental factors such as climatic conditions and soil composition, geographic location [16], and date of collection [17]. Despite the commercial importance of spike lavender EO, the influence of some environmental factors on its production and quality has been poorly characterized.
Spain is the largest producer of spike lavender EO with 150–200 t per year [2] and its EO is the most important of the essential oils commercially produced in Spain [12]. The Spanish Ministry of Agriculture publishes joint data on lavender and lavandin on acreage and biomass production. In 2018, there were 4725 ha and 15,844 t of biomass [18]. Most studies on the production and chemical composition of EO have been carried out in wild populations in different Spanish regions. The most extensive study of populations has been carried out by Herraiz-Peñalver et al. [16], analyzing 194 samples from 6 different biogeographic Spanish regions. Muñoz-Bertomeu et al. [13] analyzed the differences in production and quality in 7 populations of the Valencian region. Salido et al. [17] analyzed the seasonal behavior in samples from 3 different localities in Andalucía. Its behavior has also been analyzed under cultivation conditions in Spanish regions adapted to the species [4,7].
The quality of an aromatic plant is determined by its secondary metabolite content and its biomass yield. The prospecting and chemical characterization of wild populations and the analysis of the factors that influence their quantity and quality provide essential starting information for the conservation programs and for the selection of parental lines that allow obtaining in future adapted cultivars. Productions from wild collections carry products that are difficult to trace and can pose environmental problems due to overexploitation of natural populations. It is more convenient to collect the species plants in culture.
The objective of this study is to estimate the environmental effects on the production and composition of spike lavender EO in wild populations of various Spanish regions of the North, Center, and Southeast with the dual purpose of conserving natural populations and selecting populations in order to obtain suitable genotypes for spike lavender cultivation and as progenitors of new Lavandin varieties in crosses with L. angustifolia.

2. Materials and Methods

2.1. Vegetable Samples

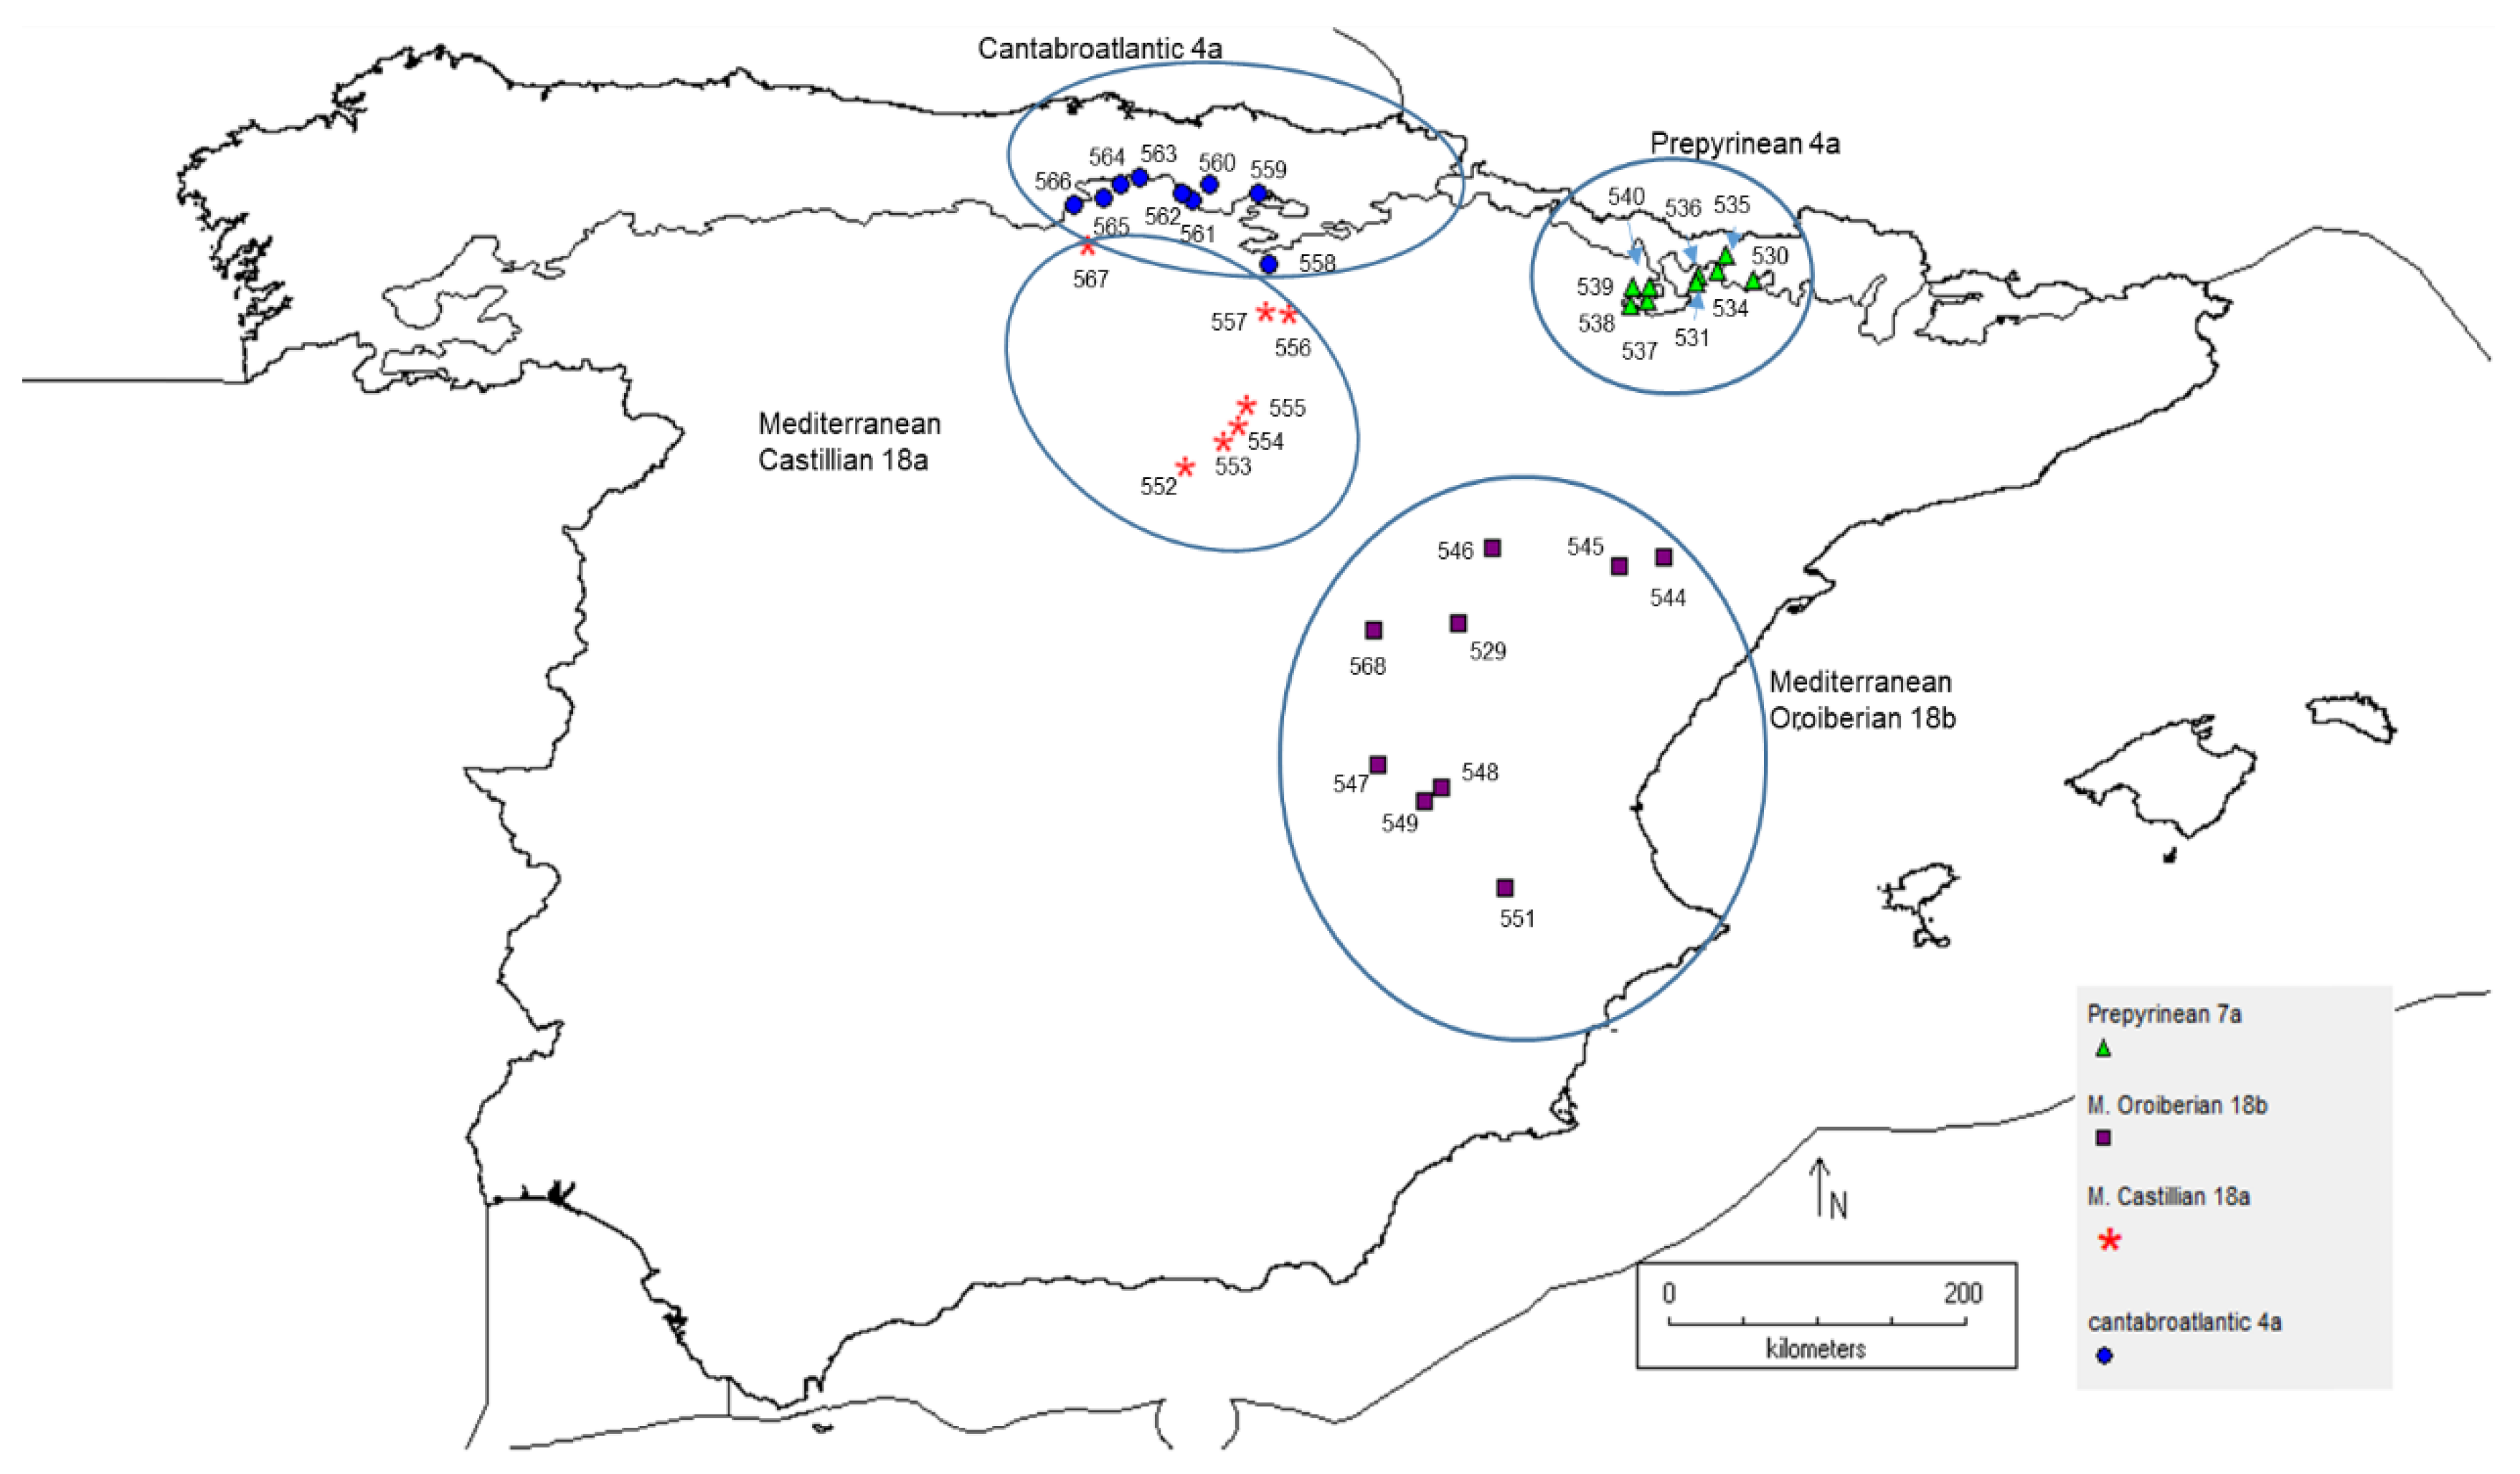
Plant samples were collected in 34 wild populations of L. latifolia Medik. for three consecutive years in 2011, 2012, and 2013 in three Biogeographic Regions: Atlantic European 4, Cévenno-Pyrenean 7, Mediterranean Central Iberian 18, defined by Rivas-Martínez and Rivas-Saenz [19]. The populations were distributed in four bioregions dividing the Mediterranean Biogeographic region in two due to its extension. The Cantabroatlantic bioregion 4a (C-4a) with 9 populations, the Prepyrenean 7a (P-7a) with 9 populations, the Mediterranean Castillian 18a (MC-18a) with 7 populations, and the Mediterranean Oroiberian 18b (MO-18b) with 9 populations were the four bioregions (Figure 1). Biogeographic regions layer source Ministerio para la Transición Ecológica (MITECO) (10 February 2018). Software Diva-GIS is available at https://www.diva-gis.org/download. Table S1 shows the latitude and longitude coordinates and collection date for three years of the 34 populations studied.
The plant samples collected consisted of flowers and leaves of about 25 plants per population until reaching an approximate weight of 500 g. The collections were made at the time of full flowering, with more than 50% of the plants with open flowers [20] at the end of August–September, depending on the geographical location. The samples from each population were dried at room temperature in shade, and they reached a constant weight in a week.

2.2. Soils

To establish the edaphic characteristics, soil samples were collected from each population in which the plant material was collected. By removing the first centimeters of soil to eliminate the vegetation cover, a kg of soil was collected from the first 20 cm or until reaching bedrock. The characteristics that were analyzed are: pH using a CRISON BASIC 20 (CRISON INSTRUMENTS, S.A., Alella, Spain) [21] model pH meter, % fines, percentage of soil less than 2 mm in diameter, electrical conductivity (EC) using a model conductivity meter micro CM 2200 CRISON (CRISON INSTRUMENTS, S.A., Alella, Spain) [22], the oxidizable carbon content in the soil (SOC) according to Walkley and Black [23], the total nitrogen content of the soil (SN) according to the Kjeldahl method, the assimilable phosphorus (P) content [24] using a spectrophotometer Genesys 10S UV-VIS (Thermo Scientific, Madison, WI, USA), and the bioavailable potassium (K) content [25] using an inductively coupled plasma atomic emission spectrometer ICP-AES Óptima 5300 DV (Perkin Elmer, Wellesley, MA, USA).

2.3. Climatic Data

The climatic variables were obtained from the information provided by the State Meteorological Agency (AEMET) Ministry of Agriculture, Food, and Environment.
For the meteorological data, the three campaigns from August 2010 to August 2013 were considered, the end of the agricultural year coinciding with the collection of the material to be distilled. From the data of extreme temperatures by months and monthly precipitation, the quarterly values were calculated taking the agricultural years: Quarter 1: from September to November; Quarter 2: from December to February; Quarter 3: from March to May; Quarter 4: from June to August.
A Gaussen climogram was constructed [26] to represent the climatic variability to which the sampled populations were subjected.

2.4. Analysis and Quantification of Chemical Parameters

The EO was obtained following the methodology proposed by the European Pharmacopoeia with simple hydrodistillation, in Clevenger [27]. Each sample (180 g of leaves and flowers of dry material) is introduced so as to form a fixed bed in an alembic with water (2L) and boiled for 150 min. The identification of the volatile active principles that make up the EO is analyzed with Gas–Liquid chromatography. The analyses were performed on a Hewlett-Packard Agilent HP 6890N GC system equipped with a quadrupole mass spectrometer Agilent 5973N (Agilent Technologies, S.L., Palo Alto, CA, USA) and DB-5 capillary column with stationary phase phenyl methyl silicone (non-polar) of 30 m long (0.25 mm in diameter and 0.25 µm in film thickness), applying a temperature gradient from 343.15 K to 513.15 K, with an increase of 276.15 K per minute, maintaining the final temperature for two minutes. Additionally, an Agilent 5975 B (Agilent Technologies, S.L., Santa Clara, CA, USA) model gas chromatograph (GC/MS) was used, coupled to an electronic impact mass spectrometer (70 eV) with a column equal to that used in the FID gas chromatograph, to check the active principles.
For the identification of the EO components, n-alkanes standards from C6 (hexane) to C25 (pentacosane) have been injected into the GC/MS column under the same conditions as the samples, the relative retention times of pure substances (standards) and the corresponding Kovats retention indices (RI) were used. The quantification of the percentages of the components is performed according to the areas of the chromatographic peaks. With this methodology, there are several samples in which some active principles do not separate well, so they are considered together. These active principles are: sabinene + β pinene and limonene + 1,8-cineole.
The EO yield and the active principles that were detected with a percentage higher than 1% that appear in the ISO-4719 [28] were EO yield, α pinene, camphene, sabinene + β pinene, limonene + 1,8-cineole, linalool, camphor, borneol, and α-terpineol. Given the low percentage of limonene, around a mean value of 1% [13,16,17,29], the result tables will show only 1-8-cineole instead of limonene + 1,8-cineole, so the percentage of 1,8-cineole will be somewhat overrated.

2.5. Statistical Analysis

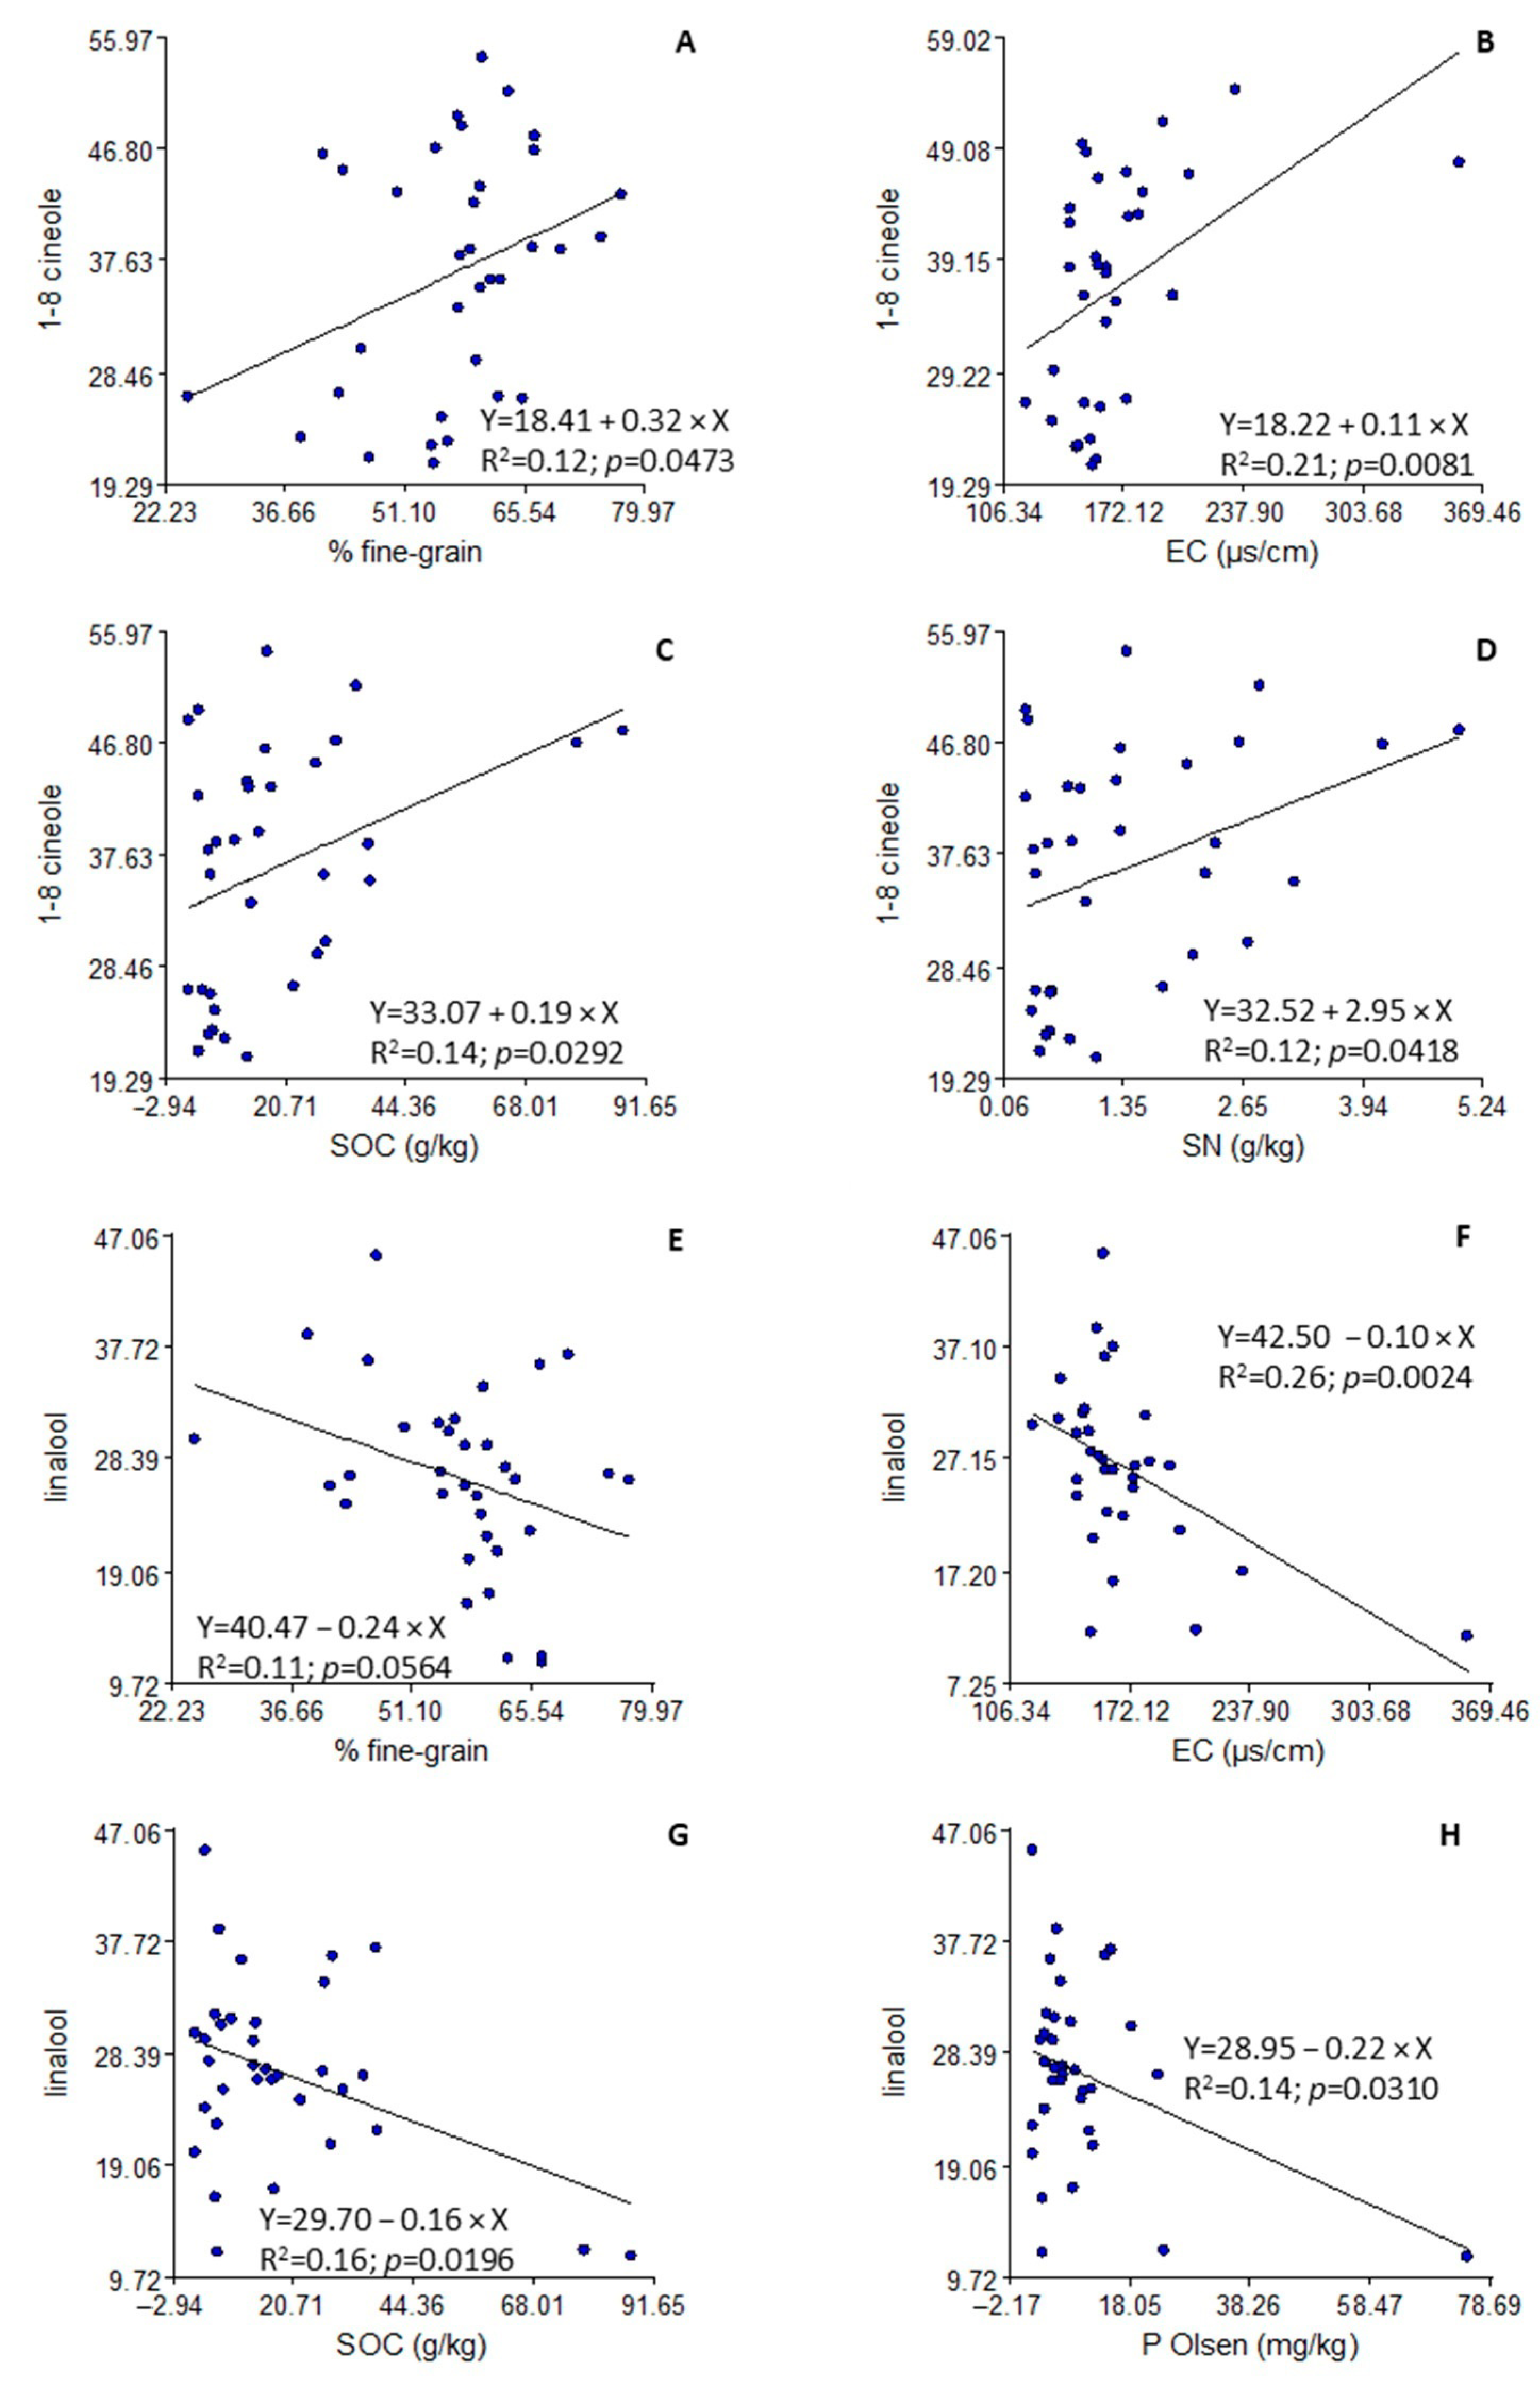
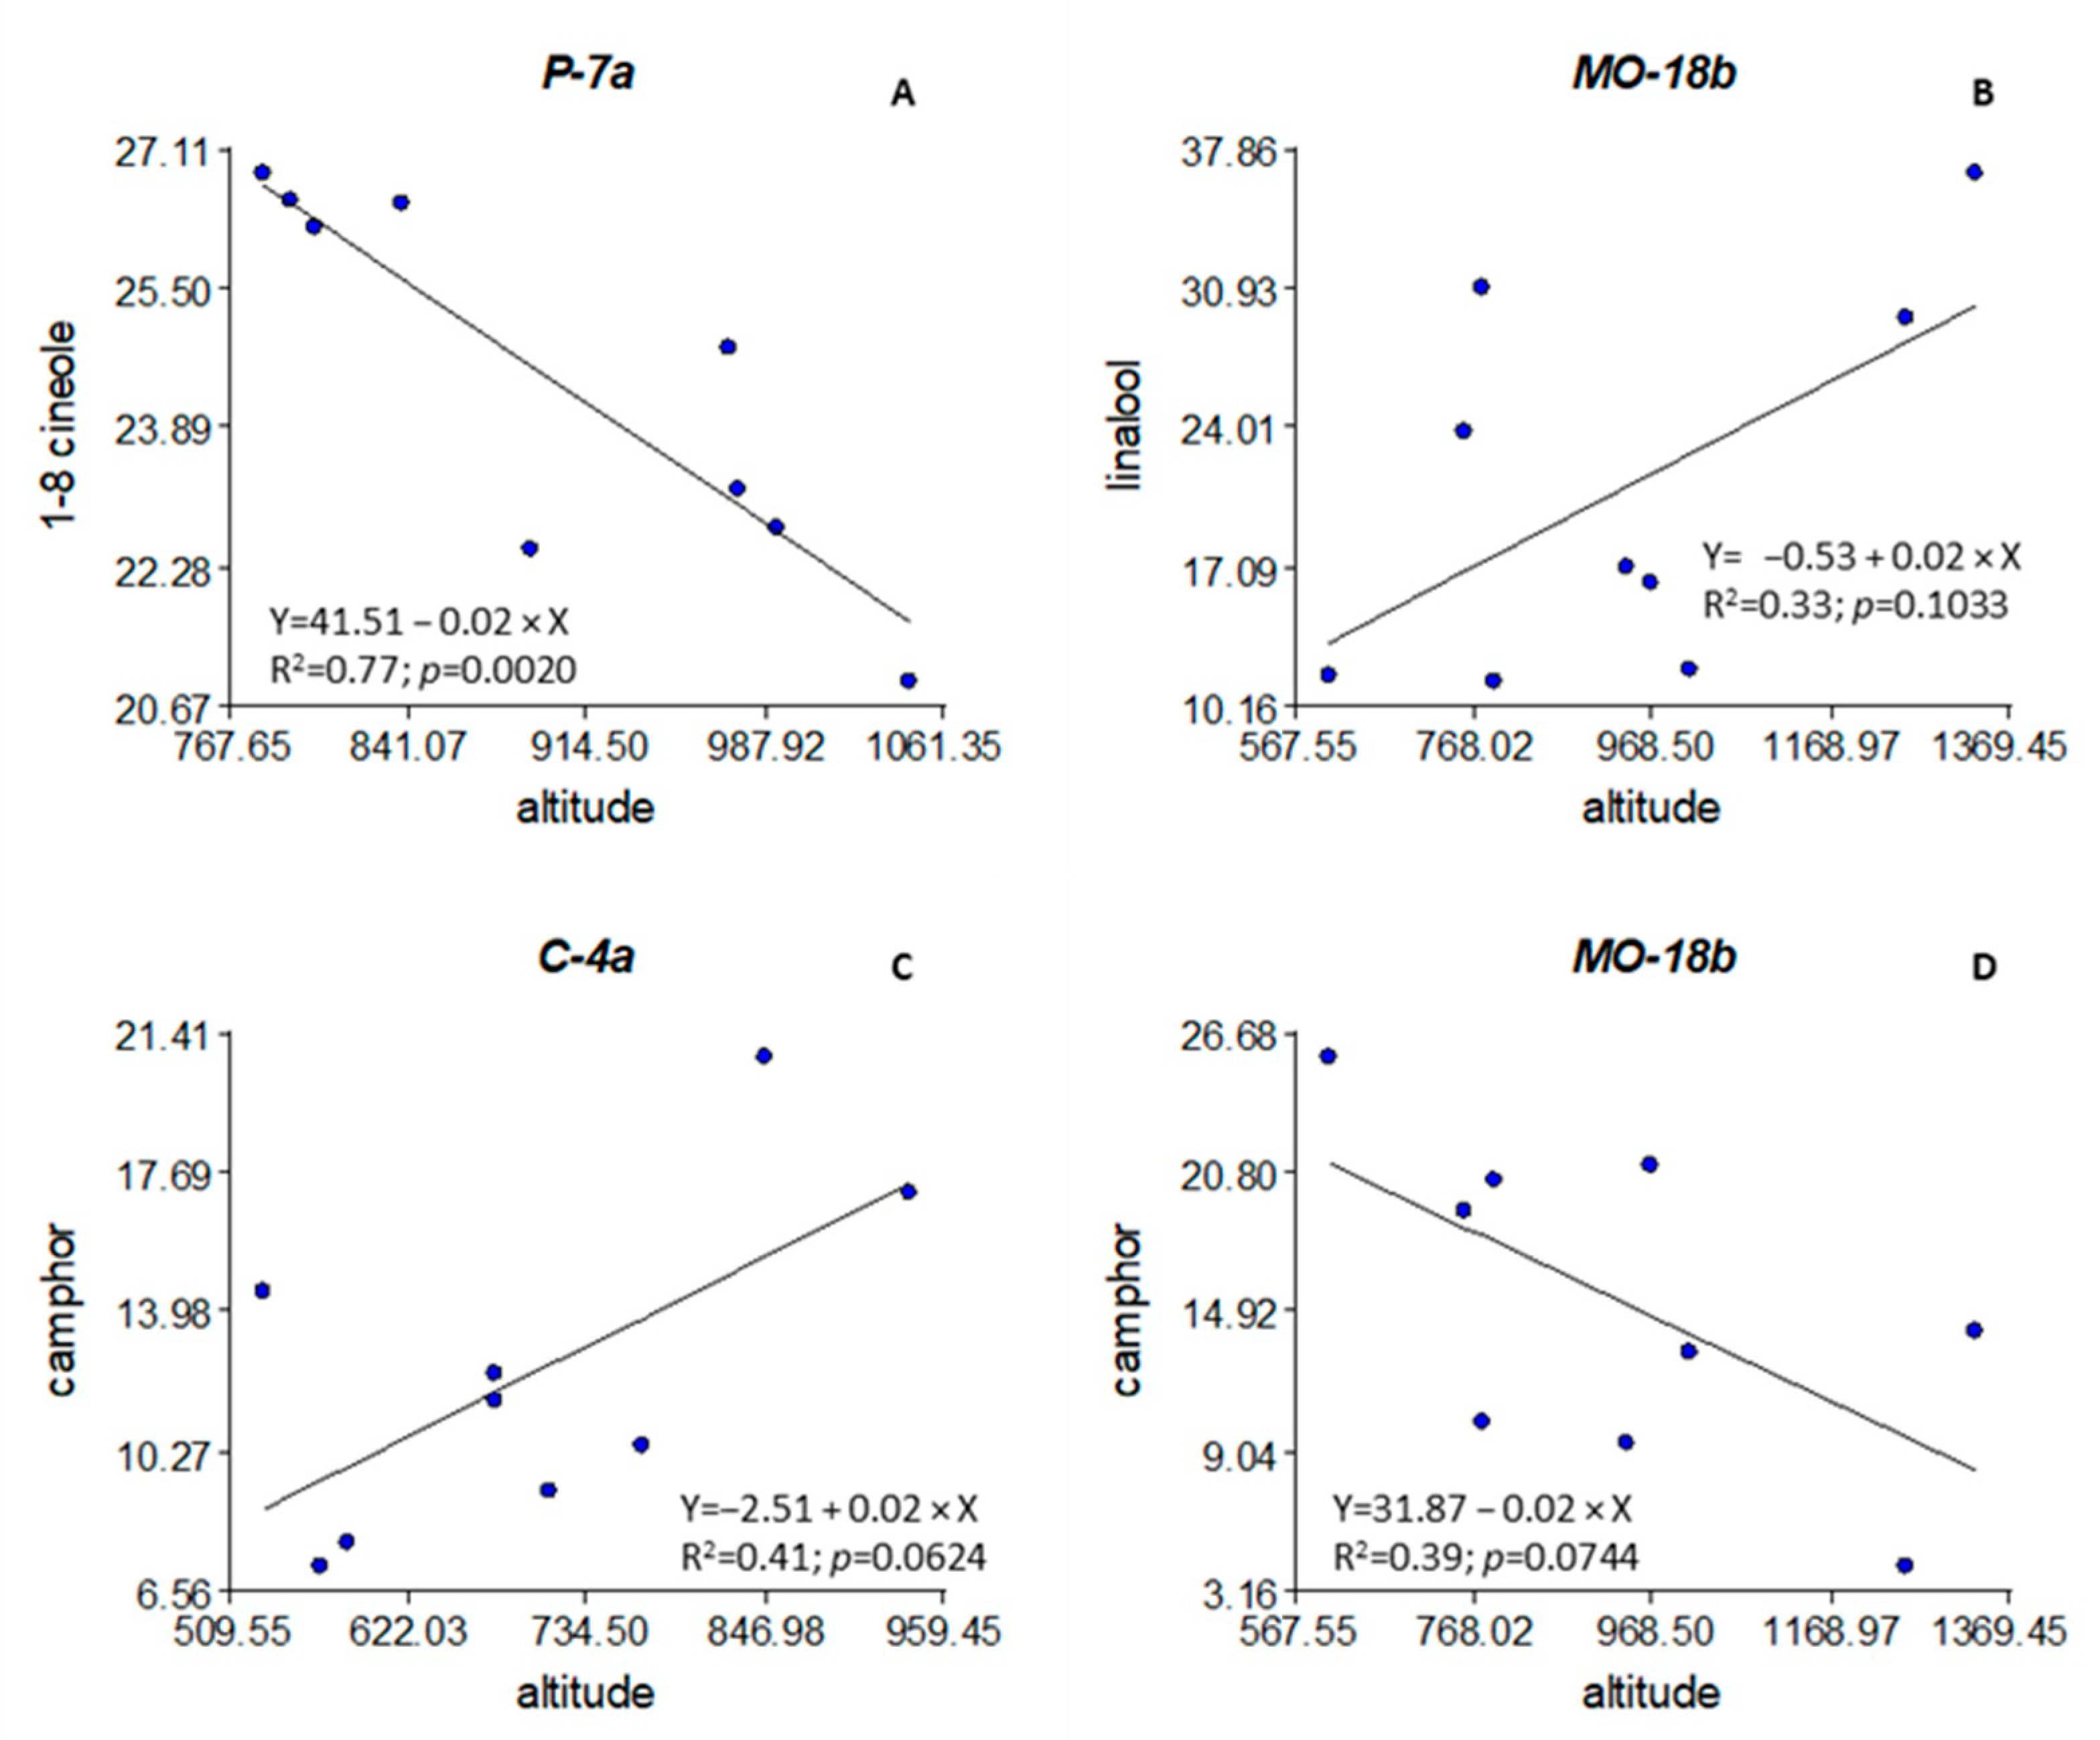
In order to compare the different variables, they were standardized. The means are presented with their standard differences (±S.D). One-way analysis of variance (ANOVA) was used to test the effect of experimental years and different geographical origins on the variables EO yield, 1,8-cineole, linalool, camphor, and rainfall. Tukey’s test was performed to determine differences between treatment means. The Pearson correlation coefficients between EO yield, 1,8-cineole, linalool, and camphor were also determined. Linear regressions of the dependent variables, EO yield, 1,8-cineole, linalool, and camphor, were made on edaphic and location characteristics of the populations. The level of statistical significance was set at p < 0.05 and p < 0.01 (**). All statistical analyses were performed with the InfoStat statistical package (InfoStat v2016; Grupo InfoStat, FCA, Universidad Nacional de Córdoba, Argentina, 2016).

3. Results

3.1. EO Yield and Composition

The EO yield mean value in the 34 populations of the four bioregions for three years was 2.95%, with values between 1.75–4.58% (Table 1). Of the 8 components that represent around 90% of the EO, three components account for 80% of the EO: 1,8-cineole represents 36.62%, linalool 26.74%, and camphor 17.23%.
There are significant differences among the bioregions in the EO yield and the proportion of its components (Table 1). The MO-18b region is with the highest significant EO mean yield, 3.63%. The other three bioregions obtain a similar yield, P-7a with 2.86%, MC-18a with 2.77%, and the C-4a region having the lowest value, 2.52%.
The EO composition is different in the four bioregions (Table 1). The major component is 1,8-cineole, with values around 40% in the two Mediterranean regions and in C-4a, while in the P-7a region its proportion falls to less than 25%. Linalool is the first EO component in P-7a with 29.39% and is the second in the other bioregions, 30.69% in C-4a and somewhat lower in the two Mediterranean regions, 25.60% in MC-18a and 21.03% in MO-18b. The proportion of camphor is 27.04% in P-7a, about double the values of the other bioregions.
There are significant differences in EO yield among years (Table 2). The average value of the 34 populations in 2013 is the highest EO yield (3.99%), followed by 2011 (2.77%), and with the lowest yield is 2012 (2.06%). The same order of years in EO yield is maintained in the bioregions C-4a (Table S2), P-7a (Table S3), MC-18a (Table S4), and MO-18b (Table S5). In MC-18a, the difference is not significant in EO yield between 2011 and 2012.
In each of the three years, the order from highest to lowest proportion of 1,8-cineole, linalool, and camphor is maintained in the EO composition (Table 2). However, their percentages differ among the years. In 2012, the percentage of 1-8 cineol is 42.04%, significantly higher than in the other two years. In 2013, linalool presents a significantly higher proportion, 34.00%, and camphor, a significantly lower value, 15.49%, than in 2012 and 2011. In each bioregion (Tables S2–S5), there are the same orders in the percentages of the EO components in the years 2012 and 2013 that occur in the 34 population means.

3.2. Climate

Comparing rainfall among years (Table 3), the agricultural year 2013 was the year of significantly higher rainfall in all bioregions, followed by 2011, and 2012 with the worst record; however, the differences between these two years are not statistically significant, except in P-7a where, in 2012, precipitation is significantly lower.
Comparing rainfall among bioregions (Table 3), MO-18b has the lowest annual rainfall in the three years, followed by MC-18a with slightly higher values. The two northern bioregions, C-4a and P-7a, have significantly higher annual rainfall than the two Mediterranean bioregions for the three years. They have very similar annual values, but taking into account the rainfall of the fourth quarter of the plant cycle (June, July, and August), P-7a has a significantly higher value than C-4a in the three years. In this fourth quarter, the two Mediterranean bioregions have rainfall values significantly lower than P-7a, and with respect to C-4a, the difference is significant only in 2011. Figure S1 shows a Gaussen climogram with the maximum and minimum temperatures in °C and quarterly precipitation (mm) during the three years and in the four bioregions.

3.3. Edaphic Characteristics

The soils of the populations of the four bioregions (Table 4) present a similar pH value, between 7.5 and 8, these are basic soils. The P-7a bioregion shows lower mean values than the other bioregions in all the edaphic variables and with more homogeneous values in its 9 populations than the other bioregions. It has a lower percentage of fines, that is, more stony soil and a lower electrical conductivity (EC), which may indicate a lower presence of salts in its soil and also lower values with respect to the other bioregions in organic soil (SOC) in soil nitrogen content (SN), potassium (K), and phosphorus (P).
The soil values of MO-18b populations present a greater dispersion, less in the physical texture of the soil, with a high value of fines %, somewhat lower than the other Mediterranean bioregion. It also presents higher mean values than the other bioregions in EC, SOC, SN, P, and a high K value.
The EO yield % does not show a relationship with the variability of the values of the different edaphic variables of the 34 populations. In the EO composition, the 1-8 cineol increases significantly with higher values of fine grain % (Figure 2A), EC (Figure 2B), SOC (Figure 2C), and SN (Figure 2D), and the proportion of linalool decreases significantly with higher values of fine grain % (Figure 2E), EC (Figure 2F), SOC (Figure 2G), and P (Figure 2H). The different pH values in the populations show no relationship with changes in the EO component proportions, although there is a trend of more EO yield in more basic soil.

3.4. Altitude, Latitude, and Longitude of the Populations

The altitude mean of the populations (Table 5) is similar in the Mediterranean bioregions and higher than in the Nord bioregions. The altitude is 997 in MC-18a and is 937 m in MO-18b. The C-4a bioregion has a lower mean height of 700 m. The P-7a is the most homogeneous in altitude, almost all the localities with a height greater than 800 m and an average value of 900 m.
To analyze whether the population altitude was related to the EO yield and components, regressions were performed of the 34 populations’ mean values in EO yield, linalool, 1,8-cineole, and camphor on their altitude. None regression gave significant values, and there seems to be a trend towards a higher EO yield as the altitude of the population increases.
Analyzing the regression by bioregions, none have shown any relationship of greater EO yield as altitude increases. Regarding the relationship with the EO components (Figure 3), there is a significant negative relationship in P-7a with 1,8-cineole (Figure 3A); with linalool, there is a positive relationship in the two Mediterranean, MO-18b (Figure 3B); and with camphor, there is a positive relationship in C-4a (Figure 3C) and negative in the two Mediterranean, M-18b (Figure 3D).
Populations with lower latitude have significantly higher EO yield (Figure 4A), a higher proportion of 1,8-cineole (Figure 4B), and a lower proportion of linalool in EO composition (Figure 4C). Therefore, populations with higher latitude produce less EO, a lower proportion of 1,8-cineole, and a significantly higher proportion of linalool.
Regarding the longitude location of the populations, the EO yield and the linalool proportion do not have a significant relationship with the longitude. There are significant values of 1,8-cineole and camphor with a greater longitude, negative and positive, respectively (Figure 4D,E).

3.5. Relationship between EO Yield Main Components

Considering the mean values of the 34 populations for the three years, the higher or lower EO yield does not show a correlation with the variability of the values of the three main EO components (Table 6). For the mean values in each of the four bioregions, there is only a significant and negative correlation in C-4a between EO yield and 1,8-cineole (−0.82 **) (Table S6).
In the relationship between the three main components (Table 6), 1-8 cineol shows a significant and negative correlation with camphor (−0.76 **) and with linalool (−0.48 **). In the bioregions (Table S6), the correlations between 1-8 cineol and camphor and linalool show negative non-significant values; only in C-4a, it is significant with linalool (−0.78 *).

4. Discussion

4.1. EO Yield and Composition

The EO yield mean value of 2.95% with respect to the dry weight of flowers and leaves of the plant could be a fairly real estimate of the average EO yield of L. latifolia in its natural environment and on a national scale (Table 1). That mean value has been obtained as an average of three years of different climatology and of four different bioclimatic and edaphological regions.
There are almost no estimates of EO yield in L. latifolia from a high number of wild populations and several years. The study by Herraiz-Peñalver et al. [16] stands out, with an average EO yield of 4.2%, in a two-year analysis and with a wide sample of populations. The higher value obtained in their study could be due to the weather being more favorable or to the fact that only flowers were used for extraction [13]. To be able to compare EO yield per unit area extracting from flowers and leaves or only from flowers, it would be necessary to know the percentage of the flower weight with respect to flowers and leaves weight in the plant.
The estimate of the average EO yield in three years in the four bioregions is also a good approximation to the production capacity of each of the bioregions. The MO-18b bioregion stands out in a significant way with respect to the other bioregions, with EO yield of 3.63%. The C-4a bioregion has the lowest EO yield with 2.52%, but it does not differ significantly from P-7a and MC-18a, with 2.86% and 2.77%, respectively. Herraiz-Peñalver et al. [16] did not find significant yield differences due to biogeographic origin. There is little information on EO yield in wild populations of spike lavender. Burillo [4] found significant differences in yield trials between different localities in the region of Aragón. Salido et al. [17] found values of 1.5%–2.2% of EO yield in 6 populations from southern Spain.
The EO composition is relevant because of the implication in its quality and commercial value. There is usually a high variability between populations and between plants within the same population [13]. The EO composition may vary depending on the part of the plant, flowers, or leaves, which is used for its extraction [13], the geographical situation, and the climatic differences [10]. García-Vallejo [11] in a bibliographic review on the proportion of the main EO constituents gives ranges of 20.5–44.8% for 1,8-cineole, 11.0–53.9% for linalool, and of 5.3–35.3% for camphor. Linalool is usually the main component in most studies, so in wild populations [16], and in cultivated plots [7,29,30]. The linalool content is higher if the EO is extracted only from flowers instead of all parts of the plant because the glandular trichomes of the leaves do not secrete linalool, only 1,8-cineole and camphor [13]. In our study, the main EO component is 1,8-cineole, 36.62%, followed by linalool, 26.74%, and camphor, 17.13%, in the mean values of the 34 populations (Table 1). The average values do not give high-quality oil for perfumery, even though the % of camphor is low.
The EO composition in the bioregions (Table 1) gives a more realistic idea of the EO quality extracted in the natural populations of spike lavender. The bioregion P-7a is that diverges the most in the EO composition from the others. Linalool (29.39%) is its first EO component, while in the other three bioregions, 1,8-cineole is the main component with values around 40%. P-7a differs significantly in a higher % of camphor (27.04%), twice of the others, and in a lower % of 1,8-cineole (24.46%). The two northern bioregions have a significantly higher value in linalool % with respect to the two Mediterranean ones. The highest camphor % in the Prepyrenean region, P-7a, coincides with Herraiz-Peñalver et al. [16] and differs in which the Mediterranean regions have lower, not higher, linalool mean.

4.2. Climate

The weather had a great impact on EO yield since the differences between years are significant (Table 3), with 2013 having the highest yield with 3.99%, 2011 with 2.77%, and 2012 with the lowest production, 2.06%. The yield difference between years also occurs in all bioregions (Tables S2–S5). Herraiz-Peñalver et al. [16] found yield differences in two years, 4.6% and 3.9%, attributing the difference to the high importance of annual climatic conditions.
In the present work, it is verified that the EO yield difference in spike lavender between years has clear correspondence with the different rainfall between years. There are significant differences in the annual rainfall quantity between years (Table 3). The agricultural year 2013 is the rainiest in all the bioregions, followed by 2011 and 2012. The greater or lesser rainfall coincides with the greater or lesser EO yield. The year 2013 differs significantly from the other two years both in rainfall and in EO yield. Moreover, 2012 is the year with the lowest rainfall and EO yield (Table 2 and Table 3). The same relationship between rainfall and EO yield occurs in the 4 bioregions for the three years (Tables S2–S5). The EO yield is estimated at a fixed weight of dry matter; therefore, the higher EO yield may be due to a greater number of glandular trichomes or to the fact that they store more EO. In a situation of more rain, the production per unit area would probably be higher than that shown in the tables since it has been found that the EO yield per ha in spike lavender in cultivation follows a similar pattern to the yield in vegetable matter, which is usually superior in rainy conditions [4].
The rainfall influences the yield and also the EO composition (Table 2 and Table 3). In the wettest year 2013, the higher EO yield is accompanied by a higher proportion of linalool, 34%, significantly higher than the proportions in 2012 and 2011, and at the same time a significantly lower proportion of camphor with respect to the other two years. The year 2012, the one with the lowest yield and rainfall, significantly increased 1,8-cineole, 42%, with respect to the other two years. The same pattern is observed in the four bioregions (Tables S2–S5). In L. angustifolia, the water deficit increases the proportion of 1,8-cineole in the essential oil [31]. These results partially contradict what was obtained in experimental plots of spike lavender by Burillo [4] who affirms that the scarcity of water influences the biosynthesis of linalool, or by Usano-Alemany [32] that the high percentage of linalool obtained in lavender and lavandin could be due to the drought during the quarter before harvest. In our experiment, the fourth agronomic quarter is always the driest and could influence the biosynthesis of more linalool, but the 4th quarter of 2013 is the least dry of the three years and is the year that shows the highest proportion of linalool. With more annual rainfall, a higher EO yield with higher quality was obtained.
However, rainfall was not the only determining factor in the EO yield in bioregions. MO-18b was the bioregion with the highest EO yield in the three years and was the one with the lowest rainfall during the three years. The other Mediterranean region does not differ significantly from the other two northern bioregions in EO yield, although it differs significantly in lower annual rainfall over the three years.

4.3. Edaphic Characteristics

The components of the soil of the different bioregions could influence the EO yield and characteristics. The soil of MO-18b populations, with the highest significant EO yield (Table 1), presents a set of characteristics conducive to greater production, such as a less stony soil due to its high percentage of fines, a lower presence of salts due to their higher significant EC, and higher values than in the other bioregions in SOC, in N, K, and P (Table 4). The edaphic variables could also influence the EO composition. Considering the means of 34 populations, the 1,8-cineole proportion increases significantly with higher values of the edaphic variables (Figure 2A–D) and the linalool proportion decreases significantly (Figure 2E–H), and the camphor proportion show a tendency to lower values. The two Mediterranean regions fulfill this composition on their oil. The inverse situation could be applied to the P-7a bioregion, which has a higher significant value of camphor and presents lower mean values than the other bioregions in all edaphic variables. We have not found bibliographic references about the relationship between edaphic variants and the EO yield and composition of the spike lavender. In L. angustifolia, the EO yield was remained unaffected under N and P different levels, and 1,8-cineole and camphor of leaves EO were affected [33]. On the other hand, different levels of K application affected both the EO yield and constituents [34].

4.4. Altitude, Latitude, and Longitude of the Populations

Other factors that could influence the EO yield and composition of the spike lavender are the fixed and different factors of altitude, latitude, and longitude of the populations. The bioregions differ in the mean altitude values, and the C-4a bioregion shows a significantly lower mean altitude than the two Mediterranean bioregions (Table 5) and presents the lowest EO yield (Table 1) but was significant only with respect to MO-18b. It could be one of the causes of lower C-4a EO yield comparing to the other bioregions. However, there is a considerable disparity between altitude and production data in the bioregions (Table 5), and the regression of the altitude of all populations on the EO yield does not give significant values, although it seems that there is a trend of greater EO yield at a greater altitude.
The EO composition in bioregions could be affected by their altitude. In P-7a, there is a significant negative relationship between 1,8-cineole proportion and altitude (Figure 3A). In MO-18b, there is a positive relationship between higher altitude and higher linalool proportion (Figure 3B). These data may coincide with Muñoz-Bertomeu et al. [13] who, in spike lavender populations in the Valencia region, described that the higher altitude favored populations with EO rich in linalool, and the lower altitude favored the accumulation of 1,8-cineole. The camphor proportion showed a tendency in the bioregion populations toward a lower content with higher altitude (Figure 3D), but not in C-4a where it was positive (Figure 3C). Herraiz-Peñalver et al. [16] found a significant and negative correlation between altitude and camphor concentration in their spike lavender population study. Our results show that higher altitude favors obtaining plants with higher EO quality, more content in linalool and less in 1,8-cineole and camphor.
The geographical location in latitude and longitude could be a factor influencing the EO biosynthesis. There are differences between the populations in EO yield according to their latitudinal situation. The populations with a lower latitude, further south, show significantly higher EO yield, such as the MO-18b populations, and in the populations with higher latitude, further north, such as the C-4a and P-7a populations, their EO yield is lower (Figure 4A). The longitudinal, west-east situation of the populations shows no relationship with EO yield. The effect of the geographical location on the EO yield and composition of L. latifolia has not been directly addressed by other authors. Herraiz-Peñalver et al. [16] in their study in populations of different peninsular geographic regions did not find differences in EO yield. They find differences in the EO composition, the northern and eastern regions have higher camphor content, and the central and southern regions are characterized by higher linalool content. In our study, it is agreed that the populations further north and east have significantly higher camphor content (Figure 4E) as Prepyrenean bioregion, but it differs with respect to linalool content. The populations located at less latitude, further south, have less linalool and more 1,8-cineole (Figure 4B,C).
Between the EO yield and its main components (Table 6), there is no significant correlation in the mean values of the 34 populations and in the bioregions. There is a negative and significant correlation between 1,8-cineole and linalool and camphor. There is a weak, non-significant negative correlation between camphor and linalool, also in bioregions (Table S6), as it was described by Herraiz-Peñalver et al. [16].
From the data provided on the EO yield and composition of the populations, valuable genotypes could be selected and propagated to transfer them to culture (Table 5). Selecting for EO yield and better quality in relation to linalool/camphor, in the C-4a bioregion, population 558 could be selected with three-year mean data of 3.5% EO yield, and a 45.4%/14.1% ratio; in MC-18a, the population 552 with 3.3% EO yield and a ratio of 26.6%/7.8%; and in MO-18b, the population 568 with 4.1% EO yield and a ratio of 36.6%/14.1%. These last two populations are located in localities above 1000 m of altitude, and the genotypes obtained for cultivation could be competitive in that altitude compared to the hybrid Lavandin adapted to more thermophilic conditions. In the P-7a region, there are genotypes with high camphor % and could be selected to obtain EO for phytosanitary uses. The selected genotypes could serve also as genitors in crosses with L. angustifolia to obtain new Lavandin lines since the current lines in culture are of French origin [32] and hybrid lines with wider adaptation would be useful.

5. Conclusions

The new information provided in this work about EO yield and composition and the climatic, edaphic, and geographic influence could serve as a reference for better conservation and possible restoration of spike lavender populations. The study shows a fairly real value of the production and quality of spike lavender EO obtained from wild populations, both on a national scale and in different Spanish regions. The influence of falling rain on the EO yield and quality is verified. Higher annual rainfall results in higher EO yield in all bioregions and also better quality. There are other factors that also influence EO yield and quality since the bioregion with the highest yield is the one with the least rainfall. It is found that the composition of the soil influences the EO yield and quality. Soils richer in organic matter and minerals result in more production and poorer quality. The altitude at which the populations are found has little effect on their EO yield. It seems that the higher altitude influences the quality of oils. The geographical location of the population could influence their production and quality. At lower latitude, further south, the populations obtain a higher EO yield. The populations located to the northeast have a higher content of camphor, and further south, less linalool. The detailed provision of data from all populations, both in their location and in their behavior in EO yield and composition, allows the selection of the best genotypes for different breeding plans and useful information to improve culture protocols for L. latifolia Medik.

Supplementary Materials

The following are available online at https://0-www-mdpi-com.brum.beds.ac.uk/2077-0472/10/12/626/s1, Table S1: Decimal coordinates of the 34 populations of bioregions and collection date in the three years, Table S2: EO yield (% on dry weight) and major components (in EO %) in 34 wild populations of L. latifolia Medik. for years and the mean for each year. For the Cantabroatlantic (C-4a) bioregion, Table S3: EO yield (% on dry weight) and major components (in EO %) in 34 wild populations of L. latifolia Medik. for the Prepyrinean (P-7a) bioregion, Table S4: EO yield (% on dry weight) and major components (in EO %) in 34 wild populations of L. latifolia Medik. for the Mediterranean Castillian (MC-18a) bioregion, Table S5: EO yield (% on dry weight) and major components (in EO %) in 34 wild populations of L. latifolia Medik. for the Mediterranean Oroiberian (MO-18b) bioregion, Table S6: Relationship between EO yield main components means of 34 populations of L. latifolia Medik. for three years based on the Pearson correlation matrix with standardized variables by bioregions. With significance level p < 0.05 (*) and p < 0.01 (**). Figure S1: Gaussen’s climatic diagrams by year quarters in each bioregion.

Author Contributions

M.F.-S. and J.M.C. conceived and designed the study; M.F.-S. performed the experiment; M.F.-S. and J.M.C. analyzed the data; M.F.-S. wrote the manuscript; M.F.-S. and J.M.C. reviewed and edited the manuscript. All authors have read and agreed to the published version of the manuscript.

Funding

Spanish Ministerio de Economía y Competitividad RTA2012-00057-C03-02 supported the research work.

Acknowledgments

The authors would like to thank Federico Varela for helping in collecting plants and Mª Brigida Fernández de Simón for helping in the interpretation of chromatography.

Conflicts of Interest

The authors declare no conflict of interest.

References

  1. Morales, R. Lavandula. In Flora Iberica Volume 12; Morales, R., Quintanar, A., Cabezas, F., Pujadas, A.J., Cirujano, S., Eds.; Real Jardín Botánico, CSIC: Madrid, Spain, 2010; pp. 484–496. [Google Scholar]
  2. Lesage-Meessen, L.; Bou, M.; Sigoillot, J.C.; Faulds, C.B.; Lomascolo, A. Essential oils and distilled straws of lavender and lavandin: A review of current use and potential application in white biotechnology. Appl. Microbiol. Biotechnol. 2015, 99, 3375–3385. [Google Scholar] [CrossRef] [PubMed]
  3. Agreste. La statistique, l’évaluation et la prospective du ministère de l’Agriculture et de l’Alimentation. Available online: https://agreste.agriculture.gouv.fr/agreste-web/disaron/SAANR_DEVELOPPE_2/detail/ (accessed on 8 December 2020).
  4. Burillo, J. Investigación y Experimentación de Plantas Aromáticas y Medicinales En Aragón. Cultivo, Transformación y Analítica; Burillo, J., Ed.; Gobierno de Aragón, Departamento de Agricultura, Dirección General de Tecnología Agraria: Zaragoza, Spain, 2003. [Google Scholar]
  5. Lis-Balchin, M.; Hart, S. Studies on the mode of action of the essential oil of Lavender (Lavandula angustifolia P. Miller). Phyther Res. 1999, 13, 540–542. [Google Scholar] [CrossRef]
  6. Haig, T.J.; Haig, T.J.; Seal, A.N.; Pratley, J.E.; An, M.; Wu, H. Lavender as a source of novel plant compounds for the development of a natural herbicide. J. Chem. Ecol. 2009, 35, 1129–1136. [Google Scholar] [CrossRef] [PubMed]
  7. Santana, O.; Cabrera, R.; Giménez, C.; Sánchez-Vioque, R.; de los Mozos-Pascual, M.; Rodríguez-Conde, M.F.; Laserna-Ruiz, I.; Usano-Alemany, J. Perfil químico y biológico de aceites esenciales de plantas aromáticas de interés agro-industrial en Castilla-La Mancha (España). Grasas y Aceites 2012, 63, 214–222. [Google Scholar] [CrossRef] [Green Version]
  8. Méndez-Tovar, I.; Herrero, B.; Pérez-Magariño, S.; Pereira, J.A.; Asensio-S-Manzanera, M.C. By-product of Lavandula latifolia essential oil distillation as source of antioxidants. J. Food Drug Anal. 2015, 23, 225–233. [Google Scholar] [CrossRef] [PubMed] [Green Version]
  9. Quílez, M.; Ferreres, F.; López-Miranda, S.; Salazar, E.; Jordán, M.J. Seed oil from mediterranean aromatic and medicinal plants of the lamiaceae family as a source of bioactive components with nutritional. Antioxidants 2020, 9, 510. [Google Scholar] [CrossRef] [PubMed]
  10. Boelens, M.H. The essential oil of spike Lavender Lavandula latifolia Vill. (L. spica DC). Perfum. Flavorist 1986, 11, 43–63. [Google Scholar]
  11. García Vallejo, M.I. Aceites Esenciales De Las Lavandulas Ibericas Ensayo Ide La Quimiotaxonomi; Universidad Complutense de Madrid: Madrid, Spain, 1992; Available online: http://bibdigital.rjb.csic.es/PDF/García-Vallejo_Aceites_esenciales_Lavandulas_ibéricas_Tesis_2002.pdf (accessed on 20 March 2020).
  12. Lis-Balchin, M. Chemical composition of essential oils from different species, hybrids and cultivars of Lavandula. In Lavender; Taylor & Francis Inc.: New York, NY, USA, 2002; pp. 251–262. [Google Scholar]
  13. Muñoz-Bertomeu, J.; Arrillaga, I.; Segura, J. Essential oil variation within and among natural populations of Lavandula latifolia and its relation to their ecological areas. Biochem. Syst. Ecol. 2007, 35, 479–488. [Google Scholar] [CrossRef]
  14. Cavanagh, H.M.A.; Wilkinson, J.M. Biological activities of lavender essential oil. Phyther. Res. 2002, 16, 301–308. [Google Scholar] [CrossRef]
  15. Kaloustian, J.; Pauli, A.M.; Pastor, J. Evolution of camphor and others components in the essential oils of two labiate species during the biological cycle. Analusis 2000, 28, 308–315. [Google Scholar] [CrossRef] [Green Version]
  16. Herraiz-Peñalver, D.; Cases, M.Á.; Varela, F.; Navarrete, P.; Sánchez-Vioque, R.; Usano-Alemany, J. Chemical characterization of Lavandula latifolia Medik. essential oil from Spanish wild populations. Biochem. Syst. Ecol. 2013, 46, 59–68. [Google Scholar] [CrossRef]
  17. Salido, S.; Altarejos, J.; Nogueras, M.; Sánchez, A. Chemical composition and seasonal variations of spike lavander oil from southern Spain. J. Essent Oil Res. 2004, 16, 206–210. [Google Scholar] [CrossRef]
  18. Mapa. Ministerio de Agricultura, Pesca y Alimentación. Available online: https://www.mapa.gob.es/es/ (accessed on 8 December 2020).
  19. Rivas-Martínez, S.; Rivas-Saenz, S. Worldwide Bioclimatic Classification System; Phytosociological Research Center: Madrid, Spain, 2011. [Google Scholar]
  20. Cases, M.A.; Navarrete, P.; Calvo, R.; López-Ceper, P.; Pérez-Mao, D.; Varela, F. Recolección y caracterización química de espliego (Lavandula latifolia Medik.) en Las Alcarrias (Guadalajara y Cuenca). Primer paso de un programa de selección y mejora. IV Congr Mejor Genética Córdoba 2008, 51, 355–356. [Google Scholar]
  21. Thomas, G.W. Soil pH and soil acidity. In Methods of Soil Analysis. Part. 3. Chemical Methods; Sparks, D.L., Ed.; Soil Science Society of America, Inc.: Madison, WI, USA, 1996; pp. 475–490. [Google Scholar]
  22. Rhoades, J.D. Salinity: Electrical conductivity and total dissolved solid. In Methods of Soil Analysis. Part. 3. Chemical Methods; Sparks, D.L., Ed.; Soil Science Society of America, Inc.: Madison, WI, USA, 1996; pp. 417–435. [Google Scholar]
  23. Walkley, A.; Black, I.A. An examination of Degtjareff method for determining soil organic matter and a proposed modification of the chromic acid titration method. Soil Sci. 1934, 37, 29–38. [Google Scholar] [CrossRef]
  24. Watanabe, F.S.; Olsen, S.R. Test of an ascorbic acid method for determining phosphorous in water and NaHCO3 extracts from soil. Soil Sci. Soc. Am. J. 1965, 677–678. [Google Scholar] [CrossRef]
  25. Pratt, P.F. Availability indexes. Potassium. In Methods of Soil Analysis. Part. 2. American Society of Agronomy; Soil Science Society of America, Inc.: Madison, WI, USA, 1965; pp. 1027–1028. [Google Scholar]
  26. Bagnouls, F.; Gaussen, H. Saison seche el régime xerothermique, [Dry season and xerothermic regime]. Documents pour les Cartes des Production Vegetates, Sér. Géneralités. Toulouse 1953, 3, 193–239. [Google Scholar]
  27. Council of Europe. Eurpean Pharmacopoeia, 3rd ed.; Council of Europe: Strasbourg, France, 1996. [Google Scholar]
  28. International Organization for Standardization. ISO 4719: Oil of Spike Lavender [Lavandula Latifolia (L.f.) Medikus], Spanish Type; International Organization for Standardization: Vernier, Switzerland, 1999. [Google Scholar]
  29. Carrasco, A.; Martinez-Gutierrez, R.; Tomas, V.; Tudela, J. Lavandula angustifolia and Lavandula latifolia Essential Oils from Spain: Aromatic Profile and Bioactivities. Planta Med. 2015, 82, 163–170. [Google Scholar] [CrossRef] [Green Version]
  30. Guillen, M.D.; Cabo, N.; Burillo, J. Characterisation of the essential oils of some cultivated aromatic plants of industrial interest. J. Sci. Food Agric. 1996, 70, 359–363. [Google Scholar] [CrossRef]
  31. Chrysargyris, A.; Laoutari, S.; Litskas, V.D.; Stavrinides, M.C.; Tzortzakis, N. Effects of water stress on lavender and sage biomass production, essential oil composition and biocidal properties against Tetranychus urticae (Koch). Sci. Hortic. 2016, 213, 96–103. [Google Scholar] [CrossRef]
  32. Usano-Alemany, J.; Herraiz-Peñalver, D.; Cuadrado Ortiz, J.; De López, B.B.; Ruiz, O.S.; Palá-Paúl, J. Ecological production of lavenders in Cuenca province (Spain). A study of yield production and quality of the essential oils. Bot. Complut. 2011, 35, 147–152. [Google Scholar] [CrossRef] [Green Version]
  33. Chrysargyris, A.; Panayiotou, C.; Tzortzakis, N. Nitrogen and phosphorus levels affected plant growth, essential oil composition and antioxidant status of lavender plant (Lavandula angustifolia Mill.). Ind. Crops Prod. 2016, 83, 577–586. [Google Scholar] [CrossRef]
  34. Chrysargyris, A.; Drouza, C.; Tzortzakis, N. Optimization of potassium fertilization/nutrition for growth, physiological development, essential oil composition and antioxidant activity of Lavandula angustifolia Mill. J. Soil Sci. Plant. Nutr. 2017, 17, 291–306. [Google Scholar] [CrossRef] [Green Version]
Figure 1. Map with location of the 34 wild populations of Lavandula latifolia Medik. by bioregions.
Agriculture 10 00626 g001
Figure 2. Regressions of 1,8-cineole on % fine-grain < 2 mm (A); EC: Electric Conductivity (µm/cm) (B); SOC: Soil Organic Carbon (g/kg) (C); and SN: Soil Nitrogen (g/kg) (D) and regressions of linalool on % fine-grain < 2 mm (E); EC: Electric Conductivity (µm/cm) (F); SOC: Soil Organic Carbon (g/kg) (G); and P Olsen: P assimilable (g/kg) (H).
Agriculture 10 00626 g002
Figure 3. Regressions on altitude: (A) 1,8-cineole in P-7a; (B) linalool in MO-18b; (C) camphor in C-4a; (D) camphor in MO-18b.
Agriculture 10 00626 g003
Figure 4. (A) Regression of EO yield on decimal latitude (LatDEC); (B) Regression of 1,8-cineole on LatDEC; (C) Regression of linalool on LatDEC; (D) Regression of 1,8-cineole on decimal longitude (LongDEC); and (E) Regression of camphor on LongDEC.
Agriculture 10 00626 g004
Table 1. Essential oil (EO) yield (% of dry weight) and major components (in EO %) in 34 wild populations of L. latifolia Medik. Year mean and by bioregions.
BioregionComponentnaMin.MeanS.D.Max.
All populationsessential oil yield341.752.950.714.58
α-pinene340.851.730.533.13
camphene340.370.810.271.45
sabinene+β-pinene341.522.850.874.75
1,8-cineole3420.9636.629.8954.30
linalool3411.4226.747.7445.36
camphor344.2317.237.9731.39
borneol341.052.361.005.97
α-terpineol340.380.880.211.39
Cantabroatlantic (C-4a)essential oil yield91.752.52 b0.633.51
1,8-cineole921.5138.20 a8.6346.91
linalool925.2930.69 a6.9245.36
camphor97.2312.34 b4.4620.73
Prepyrenean (P-7a)essential oil yield92.372.86 ab0.473.70
1,8-cineole920.9624.46 b2.1826.82
linalool922.4329.39 ab4.7338.81
camphor923.1727.04 a2.5831.39
Mediterranean Castillian (MC-18a)essential oil yield72.302.77 b0.463.55
1,8-cineole735.4541.84 a6.1951.41
linalool720.0125.60 ab5.5836.28
camphor77.7613.43 b7.0424.83
Mediterranean Oroiberian (MO-18b)essential oil yield92.283.63 a0.744.58
1,8-cineole930.4043.13 a7.4154.30
linalool911.4221.03 b9.4936.60
camphor94.2315.28 b6.8025.61
na Number of populations in which the component appears. Different letters indicate significant differences among bioregions.
Table 2. EO yield (% of dry weight) and major components (in EO %) in 34 wild populations of L. latifolia Medik. for each of the years analyzed.
YearComponentnaMin.MeanS.D.Max.
2011essential oil yield330.832.77 b1.085.78
1,8-cineole3413.0532.89 b8.9950.51
linalool310.2321.17 b15.9548.94
camphor314.1720.07 a10.1536.67
2012essential oil yield340.972.06 c0.643.18
1,8-cineole3414.0842.04 a13.5566.13
linalool343.0324.36 b11.1349.94
camphor344.9417.11 ab7.8331.97
2013essential oil yield341.693.99 a1.306.80
1,8-cineole3417.0934.92 b10.6755.03
linalool345.3134.00 a10.1854.08
camphor343.6015.49 b7.6531.82
na Number of populations in which the component appears. Different letters indicate significant differences among years.
Table 3. Values of precipitations by agricultural quarters (TRI1: September to November; TRI2: December to February; TRI3: March to May; TRI4: June to August) by bioregions in each year.
YearBioregionTRI1TRI2TRI3TRI4Annual*
2011C-4a239.34 a197.07 a150.51 a119.63 b706.54 aB
P-7a238.67 a157.18 ab162.07 a177.56 a735.47 aB
MC-18a134.01 b145.69 ab194.06 a89.48 bc563.24 abAB
MO-18b128.92 b98.8 b178.94 a49.17 c455.84 bB
2012C-4a180.36 a196.79 a200.73 a71.35 bc649.23 aB
P-7a188.87 a40.33 b240.69 a131.22 a601.11 aC
MC-18a108.37 b66.15 b165.11 b76.91 bc416.55 bB
MO-18b110.99 b36.92 b107.67 c51.34 c306.92 bB
2013C-4a218.28 b430.94 a281.3 a119.72 b1,050.25 aA
P-7a296.47 a232.69 b288.2 a204.16 a1,021.51 aA
MC-18a162.02 bc173.29 bc257.01 a97.52 b689.85 bA
MO-18b197.07 c95.89 c206.58 a124.34 b623.87 bA
Lowercase letters indicate the difference in precipitation among bioregions within each year. * Capital letters in the last column indicate the difference among years for each bioregion for annual precipitation. Source of meteorological data: AEMET.
Table 4. Edaphic characteristics of the 34 L. latifolia Medik. populations by bioregions.
CATpH% Fine-GrainECSOCSNKPAltitude
C-4a
5588.1246.89157.73.460.460158.851.51530
5597.5669.92163.437.092.360418.9714.95566
5607.4541.21158.716.421.321108.966.41676
5617.4560.19143.013.121.271391.815.13584
5628.0454.91173.730.562.615321.5011.32710
5637.9543.55183.026.652.041378.448.83769
5648.2558.90143.17.090.53586.9210.11676
5658.0457.62163.413.940.958235.934.99848
5667.9959.75134.027.152.105301.096.23939
Mean7.87 a54.77 ab157.78 a19.50 a1.52 a266.94 a7.72 a699.78 b
S.D.0.309.2216.6211.370.79125.154.01134.79
P-7a
5307.8138.51154.36.340.55568.385.55977
5317.6024.85118.31.360.58428.543.48838
5347.6343.23174.622.201.788102.249.69781
5357.4665.38159.95.830.55090.911.57802
5368.3355.55133.36.760.370139.1518.43973
5377.5254.56155.212.961.06661.126.831048
5387.8856.46147.35.380.51064.533.84993
5398.1962.46151.34.210.41283.453.71793
5407.5954.27146.78.580.773115.775.42892
Mean7.78 a50.59 b149.00 a8.18 a0.734 a83.79 b6.50 a899.67 ab
S.D.0.3012.8016.006.130.44732.895.04100.58
MC-18a
5527.5263.76194.034.542.83045.6322.661133
5537.7577.35174.917.720.88436.306.83940
5547.8774.80157.515.271.33540.965.401008
5557.7566.51158.910.690.79424.694.761130
5567.8558.16152.21.420.31435.041.58835
5577.5961.46199.628.042.245186.3411.90879
5678.1060.21168.437.263.215323.3111.111056
Mean7.78 a66.04 a172.21 a20.70 a1.66 a98.90 ab9.18 a997.29 a
S.D.0.197.3816.4413.101.11113.806.95117.76
MO-18b
5298.0057.63149.93.370.292126.132.861255
5448.4262.58151.05.700.41740.873.42604
5458.1757.91162.95.450.384153.033.42968
5467.2060.46234.017.141.384154.648.53941
5477.6566.78208.077.984.164687.7123.661012
5488.0850.20181.213.570.766144.847.98777
5497.8259.54143.23.320.298129.833.71757
5517.7366.85357.587.355.004353.5275.01790
5687.3045.90631.528.602.711417.7913.951333
Mean7.82 a58.65 ab246.58 a26.94 a1.71 a245.37 ab15.84 a937.44 a
S.D.0.406.97159.1232.711.81204.1323.20238.49
CAT: Population code. Edaphic variables and units: pH; % fine-grain < 2 mm; EC: Electric Conductivity (µs/cm); SOC: Soil Organic Carbon. (g/kg); SN: Soil Nitrogen (g/kg); K: Potassium assimilable (mg/kg); P: Phosphorus Olsen (mg/kg). Different letters indicate significant differences among bioregions.
Table 5. Altitude (m), EO yield (% on dry weight), and major components (EO %) of the 34 wild populations of L. latifolia Medik. by bioregion.
CATBioregionAltitudeEssential Oil Yield1,8-CineolLinaloolCamphor
558C-4a5303.5121.5145.3614.52
5595661.7538.5337.157.23
5606762.0146.3626.1911.60
5615842.3543.6929.437.85
5627101.9046.9125.429.24
5637692.3845.0926.8910.37
5646762.8738.5725.2912.33
5658482.5233.6926.1720.73
5669393.4129.4134.3117.18
Mean699.78 b2.52 b38.20 a30.69 a12.34 b
S.D.134.790.638.636.924.46
530P-7a9772.3723.1638.8123.17
5318382.4826.4930.0528.25
5347813.3826.8224.5428.61
5358022.6126.2022.4329.25
5369733.0124.8130.7526.51
53710482.4720.9627.3525.08
5389933.7022.7431.6526.58
5397933.1326.5127.7024.54
5408922.5522.4731.2731.39
Mean899.67 ab2.86 b24.46 b29.39 ab27.04 a
S.D.100.580.472.184.732.58
552MC-18a11333.2651.4126.597.76
5539402.3043.0726.568.64
55410082.5539.5127.0710.87
55511302.5038.7836.288.76
5568353.5548.7020.0110.93
5578792.7435.9820.7224.83
56710562.4735.4521.9422.25
Mean997.29 a2.77 b41.84 a25.60 ab13.43 b
S.D.117.760.466.195.587.04
529MO-18b12553.9449.4629.534.23
5446043.6835.9911.6925.61
5459683.5537.9816.3221.04
5469412.2854.3017.109.39
54710122.8046.7211.8913.23
5487773.3543.1230.9510.22
5497574.5842.4123.7619.19
5517904.3347.8211.4220.44
56813334.1130.4036.6014.15
Mean937.44 a3.63 a43.13 a21.03 b15.28 b
S.D.238.490.747.419.496.80
CAT: population code. Different letters indicate significant differences between bioregions.
Table 6. Relationship between EO yield main components means of 34 populations of L. latifolia Medik. for three years based on the Pearson correlation matrix with standardized variables.
Essential Oil Yield1,8-CineoleLinaloolCamphor
essential oil yield1.00
1,8-cineole−0.021.00
linalool−0.15−0.48 **1.00
camphor0.15−0.76 **−0.131.00
** Correlation is significant at the 0.01 level.
Publisher’s Note: MDPI stays neutral with regard to jurisdictional claims in published maps and institutional affiliations.

