Article

Grain Yield and Total Protein Content of Organically Grown Oats–Vetch Mixtures Depending on Soil Type and Oats’ Cultivar

by
Katarzyna Pużyńska
1,*,
Stanisław Pużyński
2,*,
Agnieszka Synowiec
1,
Jan Bocianowski
3 and
Andrzej Lepiarczyk
1
1
Department of Agroecology and Crop Production, Faculty of Agriculture and Economics, University of Agriculture in Krakow, Al. Mickiewicza 21, 31-120 Krakow, Poland
2
Malopolska Agricultural Advisory Centre, ul. Osiedlowa 9, 32-082 Karniowice, Poland
3
Department of Mathematical and Statistical Methods, Poznań University of Life Sciences, Wojska Polskiego 28, 60-637 Poznań, Poland
*
Authors to whom correspondence should be addressed.
Submission received: 15 December 2020 / Revised: 15 January 2021 / Accepted: 15 January 2021 / Published: 18 January 2021
(This article belongs to the Special Issue Productive and Ecological Aspects of Mixed Cropping System)

Abstract

:
The yield and quality of crop mixtures depend on natural and agrotechnical factors and their relationships. This research aimed to analyze the grain yield, its components and total protein content of the organically grown oat–vetch mixture on two different soils and depending on the oat cultivar. The three-year field experiment with two crop rotations was carried out. The experiment was set up in the southern Poland on two soils: Stagnic Luvisol (S.L.) and Haplic Cambisol (H.C.). One of four oat cultivars (‘Celer’, ‘Furman’, ‘Grajcar’ and ‘Kasztan’) was grown with the common vetch cv. ‘Hanka’. The results showed that the grain yield of mixtures was affected mainly by weather conditions. During the dry season, the share of vetch in the grain yield was 46% lower than in the season of regular rainfall. The share of vetch seeds in the mixture’s yield was ca. 21% higher when the mixtures were grown on the S.L. than the H.C. soil. The selection of oats’ cultivar for the mixture with vetch affected significantly the thousand seed mass and protein content in the vetch seeds, 46.2–50.4 g and 270–280 g kg−1, respectively. The mixture with Kasztan cultivar yielded the best and this oat cultivar seemed to be the most appropriate for organic conditions; however, in years with high variability of rainfall distribution its usefulness was less.

1. Introduction

Cereal–legume mixtures are usually cultivated for grain or green fodder, sometimes as a green manure. Compared to their pure sowing, cereal and legume mixtures are characterized by a higher total protein yield, more stable yielding, especially in unfavorable habitats, a better legume health, and higher nutritional value [1,2]. An additional advantage of the mixture is soil enrichment by legumes with symbiotically fixed nitrogen [3,4,5]. In the research mixtures of oats with common vetch were tested.
Oat (Avena sativa L.) is a cereal with phytosanitary properties in the crop rotation because it is rarely infested by fungal pathogens of stem base and roots [6]. The tolerance of oats to soil acidification, poor soil conditions, low temperature, and higher soil humidity make them a frequent component of many crop rotations, especially in mountainous regions, with a higher share of rainfall [7]. Oats’ grain is an excellent feed for horses and dairy cattle because of its chemical composition. Depending on the cultivar, grains of oats contain ca. 100 g kg−1 dry matter (d.m.) of total protein, 40–50 g kg−1 d.m. of crude fat, 100 g kg−1 d.m. of crude fiber, 60 g kg−1 d.m. of nitrogen-free extract [8,9,10]. The biological value of oat protein is not high, but it contains many valuable amino acids, such as lysine and arginine [10]. Of all cereals, oats have the most fiber, mainly in their husks, which reduces their digestibility and energy value [11,12]. Oat products and grain quality can be improved by mixing with legumes [13,14].
Common vetch (Vicia sativa L.) contains high amounts of protein in seeds (approx. 33% of dry matter) and vegetative parts, i.e., in straw (approx. 60–120 g kg−1 d.m.) and green fodder (150–250 g kg−1 d.m.) [15]. Vetch seeds can be used as a supplement for animals’ feed in the absence or limited access to soybean or cornmeal [16]. Ceglarek et al. [17] underline the high content of thiamine acids and methionine in its protein, in comparison to other legume species. Common vetch is ideal for green forage as it has thin stems rich in fine leaves. The slender shoots of vetch can reach a length of up to 150 cm, so it can easily lodge [18]. Common vetch, like oats, is a good forecrop [19]. However, unlike oats, it has high soil demands. It is also characterized by high water requirements, especially during flowering due to the pile root system and a high transpiration rate [20].
The oat–vetch mixture for grain or green forage production combines the advantages of two different species, e.g., reduced fertilization needs due to symbiotic nitrogen fixation. When mixed with oats, vetch plants are less prone to lodging so that harvesting can be done in one step with a combine harvester. The oat and vetch mixture improves soil structure and growth of succeeding crops. In the mixture, the oat protein complements the vetch’s sulfur amino acids, and the vetch protein has a positive effect on the quality of the feed [19,20].
The share of vetch seeds in the mixture with oat is variable [20,21], and for that reason, it is not very popular in cultivation. Moreover, with low rainfall, vetch cannot withstand competition for water with oat, and its share in the mixture yield is small [22]. Another important factor influencing the yield of the mixture are different soil requirements of its components. A proper selection of cultivars for the mixture is essential, especially cereal cultivars characterized by lower competitiveness toward the legume component [21]. To date, there are very few reports in the literature on the effect of cultivar choice on the yield of the cereal and legume mixtures in conditions of organic farming. For this reason, this study aimed to analyze the yield, its components and protein content of grain of four oat cultivars grown organically in a mixture with Hanka’s vetch on two different soils.

2. Materials and Methods

2.1. Field Site and Experiment Descriptions

The research was carried out in 2012–2014 in the Experimental Station Mydlniki-Krakow (50°05′ N 19°51′ E) in the southern Poland. The experiment was set up in a randomized block design, with four replications on two types of soils: Stagnic Luvisol (S.L.) and Haplic Cambisol (H.C.) [23], located about 1 km apart. The area of the experiment was under organic farming management since 2009. The description of the soils is given in Table 1. The preceding crop was winter spelt (Triticum spelta cv. ‘Frankenkorn’).
The mixtures of oat with common vetch (Vicia sativa, cv. ‘Hanka’; breeder: FN Granum, Wodzierady, Poland) were cultivated for grain. The common vetch was mixed with one of the four oats’ cultivars, namely ‘Celer’, ‘Grajcar’, ‘Kasztan’, or ‘Furman’. A characteristic of the oats’ cultivars is presented in Table 2. The mixtures were sown on 23 March 2012; 16 April 2013; and 20 March 2014, on plots of 18 m2 (3 × 6 m) area, using plot drill (Hege 80) at row space 13.0 cm. A total of 32 plots were established each year. The planned density of crops was 500 plants m−2 of oat and 75 plants m−2 of vetch. Crops were cultivated organically.
‘Hanka’ is a common vetch cultivar of a traditional type of growth, i.e., indeterminate. Plants are lush, rich in leaves ending with sticking tendrils; seeds are brown—thousand seeds weight is 52 g. The cultivar is very fertile, of high total protein content (320 g kg−1 d.m.). Tolerance to soil acidification is quite small. It can be grown for seeds, green fodder, or green manure. The cultivar is appropriate for mixing with cereals. Breeder: Firma Nasienna (F.N.) Granum, Poland.

2.2. Measurements

In the early phase of oat growth in BBCH-scale 11–12 (german “Biologische Bundesanstalt, Bundessortenamt und CHemische Industrie”), the number of plants per 1 m2 area was counted to assess mixtures density. Before harvesting, 20 plants were taken for detailed measurements, i.e., the number and weight of panicles, the number of grains, and the 1000 grains weight. Combine harvesting was performed with a plot harvester when oats were fully ripe (BBCH 97–99). After harvesting, grains, and straw of mixtures from the area 18 m2, were weighed. The final yields of grains per plot were converted into a notional humidity of 15%. For that reason, samples of grains (ca. 40 g.) and straw (ca. 40 g.) were dried at 105 °C using a forced-air oven until a constant weight was obtained. Based on the dry mass values, the grain yields were calculated [24]. Protein content (%) was determined using the InfraXact™ analyzer (Foss, Hillerod, Denmark) based on the near-infrared spectroscopy. The analysis was conducted in three technical replications per sample in the 570–1850 nm wavelengths. Each sample was scanned six times and compared with two internal standards (references) before calculating the mean value.

2.3. Statistical Analysis of the Results

The normality of distribution of the observed traits was tested with Shapiro–Wilk’s normality test [25]. Next, the effects of the main factors under study (I factor–soil type: S.L. and H.C.; II factor–oat cultivars: ‘Celer’, ‘Grajcar’, ‘Kasztan’, ‘Furman’; III factor–years: 2012, 2013, 2014) as well as all the interactions between them were estimated with a linear model for the three-way analysis of variance (ANOVA) for particular traits. The relationships between the traits were assessed based on Pearson’s correlation coefficients and tested with the Tukey’s test at p ≤ 0.05. The results were also analyzed with multivariate methods. The canonical variate analysis (CVA) was applied to present a multi-trait assessment of similarity of the investigated treatments in a lower number of dimensions with the least possible loss of information [26]. This enabled graphic illustration of the variation in the traits of all treatments under analysis. The Mahalanobis distance was suggested to measure multi-trait treatments’ similarity [27], whose significance was verified employing critical value Dcr known as the least significant distance [28]. Pearson’s simple correlation coefficients were estimated to determine each original trait’s relative share in the treatments’ multivariate variation between values of the first two canonical variates and original individual traits. The GenStat v. 18 statistical software package was used for all the analyses.
The variation coefficient (V) was calculated to characterize the diversity of the sum of rainfall and temperature in the particular months of the growing season (April–August) 2012–2014.
V = S X ¯ × 100 %
where:
  • V—the coefficient of variation,
  • S—a standard deviation,
  • X ¯ —arithmetic mean of the variable value.

2.4. Weather Conditions

The weather data were collected from the meteorological station in the Experimental Station in Mydlniki-Kraków (50°05′ N 19°51′ E). The weather conditions during the study period varied (Figure 1, Figure 2 and Figure 3). The sums of precipitation (Figure 1 and Figure 2) and the average daily air temperature (Figure 3) in 2012–2014 differed from the average for the long-term period (1951–2000). According to [29], the required amount of precipitation for oats during the vegetation period ranges from 270 mm on light (sandy) soils to 400 mm on heavy soils. The water demand for oats increases as the plant develops, reaching the highest values in June and then July. The critical period for water demands for oat in our study was in May 2012, which was very dry, according to the [30] classification. During that month, the amount of rainfall was only 23% of the long-term period. July 2012 was, according to the classification, average—76% of the long-term period and August 2012 was dry—67% of the long-term period. The total rainfall in these months was below the water demand of oat [29]. Based on the humidity characteristics in 2013, April, July, and August were very dry, May humid, and June too humid (213.1 mm of rainfall). In 2014, three out of five months of vegetation were classified as average (April, July and August), May as wet, and June as very dry (43.4 mm of rainfall).
Common vetch also has a high-water demand, especially during the flowering period. In the study period, the temperatures from sowing to harvest were higher than the average for the multi-year period 1951–2000, except for June 2014, when the average temperature was lower by 0.7 °C from the multi-year period. Based on the air temperature classification for Kraków [31], the months of January, March, April, and June 2012 were classified as warm. May, July, and August 2012 were hot. In 2013, January, February, April, and August were classified as regular. March 2013 was very cold, May and June were warm, and July was extremely warm. In 2014, May, June, and August were classified as regular months. April 2014 was warm, and March and July 2014 were extremely warm.
The variation coefficient (V) of the sum of precipitation in individual months of the vegetation period in 2012 was equal to 26%, proving the average variability of rainfall in that period. In 2013, the V was equivalent to 107%, which shows a substantial variability. In 2014, the V in individual months was 41%, which denotes a large variability of precipitation. Temperature variability in the respective months of vegetation period 2012–2014 was different. The V of temperature for the growing season 2012 was 70%, which denotes a large variability. In 2013, V = 28%, and in 2014, 25% indicated the average variability of temperature.

3. Results

In our study, all 13 quantitative traits had a normal distribution. The ANOVA indicated a statistically significant influence of soil type, years, cultivars, and the year × cultivar and year × soil type interactions for all 13 traits (Table 3). The soil type and soil type × cultivar interactions were not significant only for the tiller number. The year × soil type × cultivar was significant for all traits except panicle number (Table 3).

3.1. Selected Biometric Features of the Mixture

The average spring density of oat was similar for both soil types and the majority of oats’ cultivars (Table 4). The cultivar factor as well as weather during emergency of the oat significantly affected its density.
The number of oat tillers in the mixtures was low and similar, regardless of the soil types (Table 5). However, the oat cultivars in the mixtures tilled differently, with cv. ‘Celer’, which developed the highest number of tillers, especially in 2013, and cv. ‘Kasztan’—the lowest (1.14). The lowest oats’ tillering was noted in 2014; it was 10% lower than in 2013.
Vetch density in the mixtures, as counted in spring, was ca. 30% lower than the planned one (Table 6). A higher density was noted on the H.C. soil than the S.L. soil. The vetch density depended on selected oats cultivar for the mixture and varied between 49.1 for cv. ‘Furman’ to 55.3 pieces m−2 for cv. ‘Celer’. The highest vetch densities in the mixtures were found in 2013 year whereas the lowest in 2014.

3.2. Yield of Mixtures

On average, the mixture yielded 40% lower on Haplic Cambisol (H.C.), compared to Stagnic Luvisol (S.L.) (Table 7). The yield of three oat cultivars’ grown with common vetch on the S.L. soil was 3.06—3.19 t ha−1, except for cv. ‘Grajcar’ that yielded significantly lower. On the H.C. soil, the yield of cv. ‘Kasztan’ was by 0.2—0.46 t ha−1 higher compared to other cultivars. The yielding of oat cultivars with vetch varied between years. The highest yields of the mixtures were in dry 2012, and the lowest, in regular 2014.
The share of vetch seeds in the mixtures was variable. On average, it was 20% higher on the H.C. soil than the S.L. soil (Table 8). It was also highest in 2013 (65.7%) and the lowest–in a dry 2012 (19.6%). The vetch seed’s share also depended on the selected oats cultivar and was the highest for cv. ‘Grajcar’, and the lowest for cv. ‘Kasztan’.
The oat–vetch mixture’s straw yield was significantly differentiated by the examined factors and their interaction (Table 9). A substantially higher straw yield was found on the S.L. soil (4.72 t ha−1) than the H.C. soil (3.72 t ha−1). Contrary to the grains’ yield, the highest straw yield was recorded in 2014 (5.58 t ha−1), and the lowest in 2012 (3.13 t ha−1).

3.3. Selected Components of Yield Structure

A substantially greater number of oats’ panicles was found on H.C. soil (330 pieces m−2) than the S.L. soil (285 pieces m−2) (Table 10). On average, in the mixtures, the largest number of panicles developed cv. ‘Celer’ (344 pieces m−2) and the smallest—cv. ‘Grajcar’ (282 pieces m−2). Interestingly, during the dry 2012 year, oat developed almost twice more panicles than in the regular year 2014. In that year, regardless of the soil type, cv. ‘Celer’ developed the highest number of panicles (559—535 pieces m−2). The number of oat panicles per m−2 decreased in the following years, most probably resulting from a continuous sequence of cereals in the crop rotation, and lack of fertilization.
Significantly more oats’ grains per panicle (GPP), by 32%, were found on the S.L. soil, compared to the H.C. soil (Table 11). The number of GPP differed significantly for the oats’ cultivars and was in a range of 10.5 for cv. ‘Grajcar’ to 14.0 for cv. ‘Kasztan’. Contrary to the number of panicles per m−2, oat developed 13% more GPP in 2014 than in 2012.
The soil type significantly differentiated the mass of 1000 grains (MTG) of oat in the mixture with vetch (Table 12). The MTGs of the oats’ cultivars in this experiment was lower than standard values (Table 2). A greater MTG was found for oats on the H.C. soil than the S.L. soil. The oat cultivars also differed in the MTG, which was in a range of 31.8–38.7 g for mixture with cv. ‘Grajcar’ and cv. ‘Celer’, respectively. In 2013, the oat MTG was 16% higher than in 2012.
The significant relationships of the mass of grains per oats’ panicle were similar to the relationships presented for the MTG of oats (Table 13).
Relative to oats, the mass of 1000 seeds (MTS) of vetch was 12% higher on the S.L. soil than the H.C. soil (Table 14). The MTS of vetch was also considerably influenced by the cultivar of oat, as the mixture companion. The highest MTS of vetch was found in the mixture with oat cv. ‘Grajcar’, and the lowest in the mixture with oat cv. ‘Kasztan’. Moreover, the MTS of vetch varied significantly over the years of the study. The highest MTS of vetch was in a regular 2014, and the lowest in a dry 2012.

3.4. Protein Content in Oat Grains and Vetch Seeds

The soil type significantly differentiated the total protein content in oat grains (Table 15). A 5% higher protein content was found in grains of oats grown in H.C. soil than the S.L. soil. The protein content differed among the oat cultivars in the mixtures and was in a range of 94.4 for cv. ‘Kasztan’ to 107 g kg−1 for cv. Furman. On average, a 39% higher protein content was found in the grains of oats in 2013 than in the dry 2012 year.
The type of soil significantly affected the vetch seeds’ protein content, which was higher on the S.L. soil (Table 16). High protein content in vetch seeds was found in the mixture with oats cv. Furman, which was also rich in protein. The same relationship was found for the lowest protein content in the vetch/oat mixture, which was in the one with oat cv. ‘Kasztan’ (Table 15). On average, the highest protein content in vetch seeds was found in 2013, and the lowest in 2014.
The canonical variate analysis (CVA), which included all the tested traits, was applied to extract the factor that influenced the overall state of the oat–vetch mixtures the most (Figure 4). The first two canonical variates explained jointly 81.19% of the total variation between the treatments. The greatest, significant linear relationship was found for protein content in oat grains (g kg−1) and a share of common vetch seed in the mixture’s yield (positive dependency). The significant negative dependencies were found for the mixtures’ yield, the number of oats panicles per m−2, and the mass of grains per oat panicle. The second canonical variate was significantly positively correlated with the number of oat panicles per m−2 and the density of oat at spring. The negative correlation was found for the number of grains per oat panicle, a share of vetch seed in the mixture’s yield, and the 1000-grain mass of oat.
The diversities in all traits, as measured with Mahalanobis distances, are presented in Table 17.
The CVA analysis pointed to the year (weather conditions) as a main differentiating factor for the mixture’s performance. The best for the mixtures turned to be the year 2013, and the worst—the dry year 2012. Moreover, Haplic Cambisol was better for the tested mixtures than the Stagnic Luvisol. The analysis also revealed that among the studied four cultivars of oats, the best for mixing with vetch cv. ‘Hanka’ was cv. ‘Furman’ and cv. ‘Grajcar’.

4. Discussion

Our results clearly show that the weather course during the vegetation season is a primary factor affecting the performance of oat–vetch mixtures. Interestingly, oats had higher yields during the dry season, whereas vetch had higher yields during seasons classified as regular. Many authors emphasize that oats are more competitive toward companion species in mixtures during dry seasons [32,33,34,35,36,37]. In adverse weather conditions, such as rainfall shortage or inadequate rainfall distribution during vegetation and lack of radiation, the cereal component determines the cereal–legume mixture’s yield [38].
We also showed that particular components of the mixture preferred different soil types; oat yielded better on a fertile Stagnic Luvisol. The vetch’s yield parameters were better on a sandy Haplic Cambisol of a low N content. Moreover, vetch was performing better than oat in the following years of the experiment, when the rainfall distribution was variable. The balance between species is a key factor determining productivity of mixtures [39,40,41]. One of the management factors that affect intercropped species’ relative competitiveness and performance is N availability [35,36,37,42,43,44]. According to [45], the yield of cereal-legume mixtures grown on the poorer soils depends mainly on the cereal component and the species and sowing density of lupine do not have a significant impact on the yield of mixtures.
On the other hand, [44] showed that the mixtures of oats with yellow lupine and triticale with lupine yielded the best on the soil intended for rye cultivation. Other authors [42,46,47] underline that the legume component performs better in a situation of N deficiency, which may happen in the organic crop rotations. Cultivation of mixtures of oat and legumes is beneficial through the structure-forming action of the legume root system [48], increasing soil biodiversity and activating nutrients from compounds inaccessible to the root system of cereals [49].
In our research, oat cultivars significantly differentiated the yield, total protein content of oat grains and vetch seeds, as well as the vetch yield parameters, such as the 1000-seed mass. Similar results were obtained by [50], who found that in the oat–vetch mixture grown for fodder, the selection of oats cultivars and vetch species affected the crude protein content in the mixtures’ biomass. However, [37] underlines that the N content in pea grain is lower in the mixture with cereal, compared to the pure sowing. The reverse situation was noted for the mixture’s cereal component, in which N content in both grain and straw was higher [37].
Cultivation of crop mixtures, composed of at least two species, is a crucial element of proper agricultural technology, particularly in conventional farming, but mostly in the organic one [42,51,52]. The results of our study showed that the yielding and protein content of interspecies mixtures is the result of many natural and agrotechnical factors [7]. Therefore, the identification of yield variability of legume-cereal mixtures is particularly important and justified due to climate change, and more frequently occurring water shortage, as they are considered an important element of agricultural diversification [53].

5. Conclusions

The course of the weather in particular years was the main factor affecting the performance of the organically grown oat–vetch mixture. In warm and dry weather oat component of the mixture affected the final yield. Among the oat cultivars in a mixture with common vetch, the ‘Kasztan’ cultivar was characterized by the highest yield, but varied over the years. In a dry and very warm year with low variability of rainfall distribution, it yielded the highest. On the other hand, warm and average years, with a high variability of rainfall distribution, presented the lowest yields compared to other cultivars.
Common vetch grown with oat increased the protein content of the oat grain. The highest content of total protein was measured in grains of cv. Furman. On the other hand, the highest content of total protein in vetch seeds was in cultivation with ‘Celer’ cultivar. The highest share of vetch seed in the grain yield of the mixture was noted with cv. ‘Grajcar’.
The type of soil was also crucial. A higher yield of mixture was found on Stagnic Luvisol soil whereas total protein content was higher in the mixture grown on Haplic Cambisol soil. On Stagnic Luvisol, the Furman cultivar performed better whereas ‘Kasztan’ fared better on Haplic Cambisol.
Proper selection of oat cultivar for the mixture with common vetch in conditions of organic farming is an important measure affecting the grain yield, yield parameters, and protein content in vetch seeds.

Author Contributions

Conceptualization, K.P. and S.P.; Methodology, K.P. and S.P.; Validation, A.L.; Formal analysis, K.P.; Investigation, K.P. and S.P.; Data curation, K.P., S.P., and J.B.; Writing—original draft preparation, K.P., S.P. and A.S.; Writing—review and editing, K.P., S.P., J.B. and A.L.; Visualization, K.P., S.P., A.S. and J.B.; Funding acquisition, K.P. and A.L. All authors have read and agreed to the published version of the manuscript.
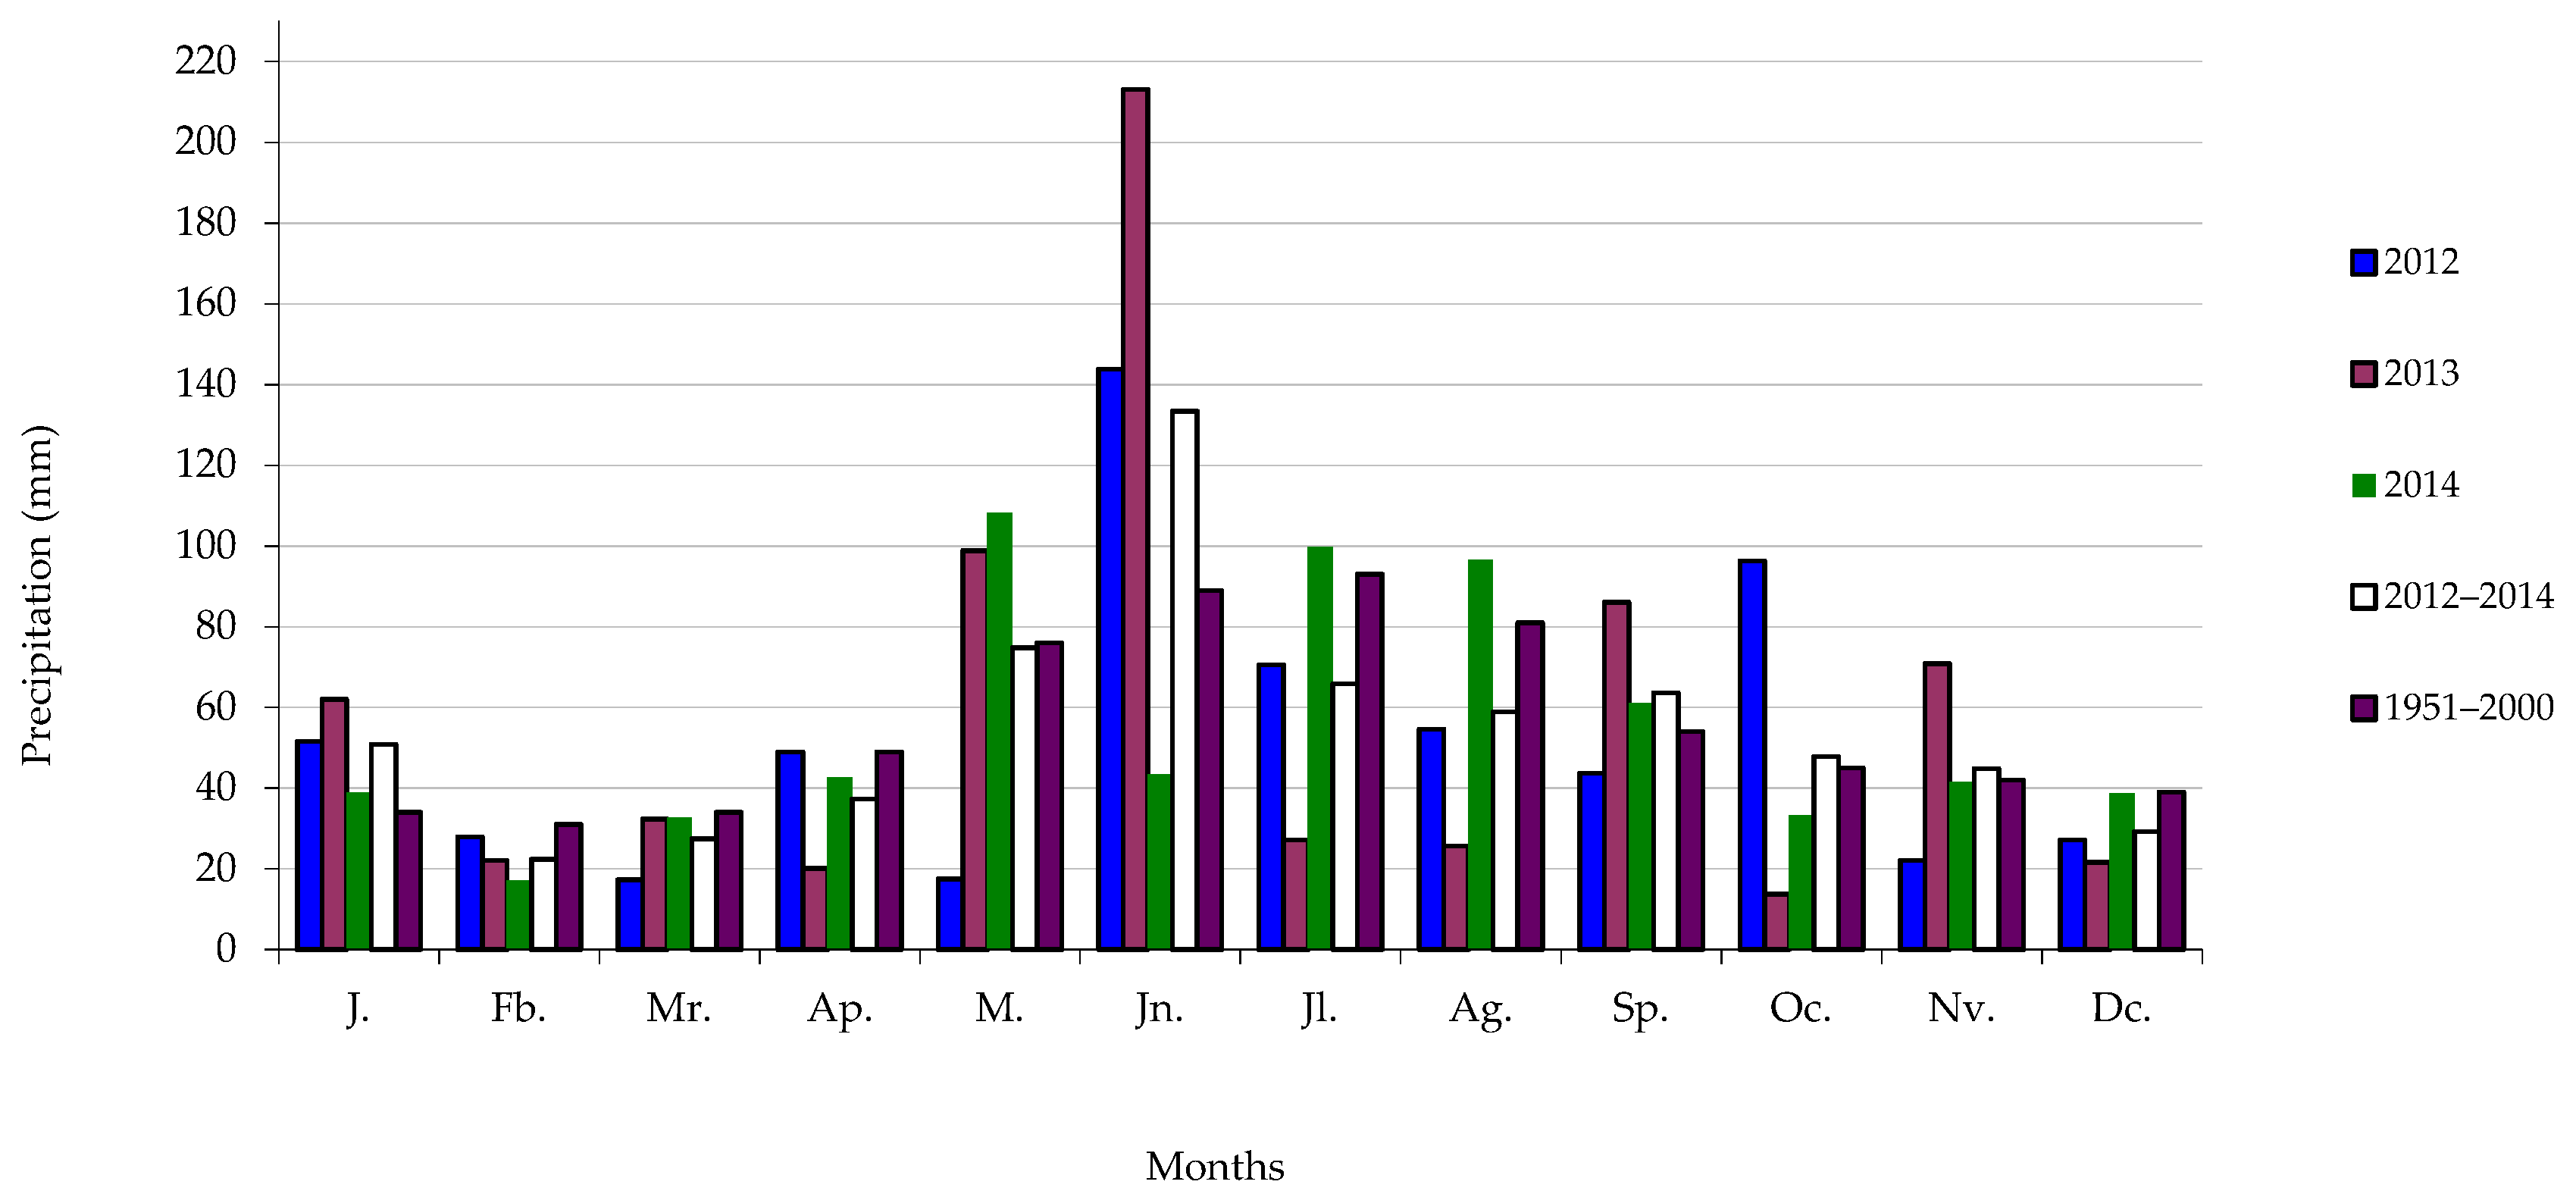
Funding

This research was financed by the Ministry of Science and Higher Education of the Republic of Poland–partially, this research was funded by the Ministry of Science and Higher Education in Poland for education in the years 2010–2015 as a research project (grant no. N N310 446938).

Institutional Review Board Statement

Not applicable.

Informed Consent Statement

Not applicable.

Data Availability Statement

The data presented in this study are available on request from the corresponding authors.

Conflicts of Interest

The authors declare no conflict of interest.

References

  1. Salama, H.S.A. Mixture cropping of berseem clover with cereals to improve forage yield and quality under irrigated conditions of the Mediterranean Basin. Ann. Agric. Sci. 2020, 65, 159–167. [Google Scholar] [CrossRef]
  2. Kamalongo, D.M.; Cannon, N.D. Advantages of bi-cropping field beans (Vicia faba) and wheat (Triticum aestivum) on cereal forage yield and quality. Biol. Agric. Hortic. 2020, 36, 213–229. [Google Scholar] [CrossRef]
  3. Hammelehle, A.; Oberson, A.; Lüscher, A.; Mäder, P.; Mayer, J. Above-and belowground nitrogen distribution of a red clover-perennial ryegrass sward along a soil nutrient availability gradient established by organic and conventional cropping systems. Plant Soil 2018, 425, 507–525. [Google Scholar] [CrossRef]
  4. Peoples, M.B.; Brockwell, J.; Herridge, D.F.; Rochester, I.J.; Alves, B.J.R.; Urquiaga, S.; Boddey, R.M.; Dakora, F.D.; Bhattarai, S.; Maskey, S.L.; et al. The contributions of nitrogen-fixing crop legumes to the productivity of agricultural systems. Symbiosis 2009, 48, 1–17. [Google Scholar] [CrossRef]
  5. Jensen, E.S.; Carlsson, G.; Hauggaard-Nielsen, H. Intercropping of grain legumes and cereals improves the use of soil N resources and reduces the requirement for synthetic fertilizer N: A global-scale analysis. Agron. Sustain. Dev. 2020, 40, 5. [Google Scholar] [CrossRef] [Green Version]
  6. Mielniczuk, E.; Patkowska, E.; Jamiołkowska, A. The influence of catch crops on fungal diversity in the soil and health of oat. Plant Soil Environ. 2020, 66, 99–104. [Google Scholar] [CrossRef] [Green Version]
  7. Klima, K.; Synowiec, A.; Puła, J.; Chowaniak, M.; Pużyńska, K.; Gala-Czekaj, D.; Kliszcz, A.; Galbas, P.; Jop, B.; Dąbkowska, T.; et al. Long-term productive, competitive, and economic aspects of spring cereal mixtures in integrated and organic crop rotations. Agriculture 2020, 10, 231. [Google Scholar] [CrossRef]
  8. Sadiq Butt, M.; Tahir-Nadeem, M.; Khan, M.K.I.; Shabir, R.; Butt, M.S. Oat: Unique among the cereals. Eur. J. Nutr. 2008, 47, 68–79. [Google Scholar] [CrossRef]
  9. Gambuś, H.; Gibiński, M.; Pastuszka, D.; Mickowska, B.; Ziobro, R.; Witkowicz, R. The application of residual oats flour in bread production in order to improve its quality and biological value of protein. Acta Sci. Pol. Techn. Aliment. 2011, 10, 317–325. [Google Scholar]
  10. Biel, W.; Kazimierska, K.; Bashutska, U. Nutritional value of wheat, triticale, barley and oat grains. Acta Sci. Pol. Zootech. 2020, 19, 19–28. [Google Scholar] [CrossRef]
  11. Welch, R.W.; Hayward, M.V.; Jones, D.I.H. The composition of oat husk and its variation due to genetic and other factors. J. Sci. Food Agric. 1983, 34, 417–426. [Google Scholar] [CrossRef]
  12. Lawrence, T.L.J. The effects of cereal particle size and pelleting on the nutritive value of oat-based diets for the growing pig. Anim. Feed Sci. Technol. 1983, 8, 91–97. [Google Scholar] [CrossRef]
  13. Eskandari, H.; Ghanbari, A.; Javanmard, A. Intercropping of cereals and legumes for forage production. Not. Sci. Biol. 2009, 1, 7–13. [Google Scholar] [CrossRef] [Green Version]
  14. Lauk, R.; Lauk, E. Pea-oat intercrops are superior to pea-wheat and pea-barley intercrops. Acta Agric. Scand. B Soil Plant Sci. 2008, 58, 139–144. [Google Scholar] [CrossRef]
  15. Rebolé, A.; Alzueta, C.; Ortiz, L.T.; Barro, C.; Rodríguez, M.L.; Caballero, R. Yields and chemical composition of different parts of the common vetch of flowering and at two seed filling states. Span. J. Agric. Res. 2004, 2, 550. [Google Scholar] [CrossRef]
  16. Sadeghi, G.H.; Tabeidian, S.A.; Toghyani, M. Effect of processing on the nutritional value of common vetch (Vicia sativa) Seed as a feed ingredient for broilers. J. Appl. Poult. Res. 2011, 20, 498–505. [Google Scholar] [CrossRef]
  17. Ceglarek, F.; Rudziński, R.; Buraczyńska, D. The effect of the amount of seeds sown on the crop structure elements and seed yields of common vetch grown as pure and mixed crops with supporting plants. Ann. UMCS 2004, 59, 1147–1154. [Google Scholar]
  18. Vasileva, V.; Kosev, V.; Kaya, Y. Evaluation of winter vetch varieties by quality indicators. Int. J. Innov. Approaches Agric. Res. 2020, 4, 156–165. [Google Scholar]
  19. Vázquez, E.; Benito, M.; Espejo, R.; Teutscherova, N. No-tillage and liming increase the root mycorrhizal colonization, plant biomass and N content of a mixed oat and vetch crop. Soil Tillage Res. 2020, 200, 104623. [Google Scholar] [CrossRef]
  20. Polishchuk, V.; Zuravel, S.; Kravchuk, M.; Klymenko, T. Organic technology of growing vetch and oat mixture under condition of using organic and mineral preparations under different fertilization systems. Sci. Eur. 2020, 47, 4–12. [Google Scholar]
  21. Alemu, B.; Melaku, S.; Prasad, N.K. Effects of varying seed proportions and harvesting stages on biological compatibility and forage yield of oats (Avena sativa L.) and vetch (Vicia villosa R.) mixtures. Livestock Res. Rural Dev. 2007, 19, 12. [Google Scholar]
  22. Dolata, A.; Andrzejewska, J.; Wiatr, K. Reaction of determinate and indeterminate common vetch (Vicia sativa L. ssp. sativa) cultivars to different climatic and soil conditions. Acta Sci. Pol. Agric. 2006, 5, 25–35. [Google Scholar]
  23. IUSS Working Group. World Reference Base for Soil Resources. In World Soil Resources Report No. 103; FAO: Rome, Italy, 2006. [Google Scholar]
  24. Beral, A.; Rincent, R.; Le Gouis, J.; Girousse, C.; Allard, V. Wheat individual grain-size variance originates from crop development and from specific genetic determinism. PLoS ONE 2020, 15, e0230689. [Google Scholar] [CrossRef]
  25. Shapiro, S.S.; Wilk, M.B. An analysis of variance test for normality (complete samples). Biometrika 1965, 52, 591–611. [Google Scholar] [CrossRef]
  26. Rencher, A.C. Interpretation of canonical discriminant functions, canonical variates, and principal components. Am. Stat. 1992, 46, 217–225. [Google Scholar]
  27. Seidler-Łożykowska, K.; Bocianowski, J. Evaluation of variability of morphological traits of selected caraway (Carum carvi L.) genotypes. Ind. Crops Prod. 2012, 35, 140–145. [Google Scholar] [CrossRef]
  28. Mahalanobis, P.C. On the generalized distance in statistics. Proc. Natl. Acad. Sci. India 1936, 12, 49–55. [Google Scholar]
  29. Dzieżyc, J. Czynniki Plonotwórcze Plonowanie Roślin; PWN: Warszawa, Poland, 1993; pp. 1–474. [Google Scholar]
  30. Kaczorowska, Z. Rainfall in Poland Over a Long-Term Cross-Section; Geographic Works; Institute of Geography, Polish Academy of Sciences: Warsaw, Poland, 1962. [Google Scholar]
  31. Ziernicka, A. Klasyfikacja odchyleń temperatury powietrza od normy w Polsce południowo-wschodniej. Zeszyty Naukowe Akademii Rolniczej Krakówie 2001, 22, 5–18. [Google Scholar]
  32. Szpunar-Krok, E.; Bobrecka-Jamro, D.; Tobiasz-Salach, R. Yielding of naked oat and faba bean in pure sowing and mixtures. Fragm. Agron. 2009, 26, 145–151. [Google Scholar]
  33. Pisulewska, E.; Witkowicz, R.; Kidacka, A. Yield, yield components, and accuracy of grain in selected cultivars of oats. Żywność Nauka Technologia Jakość 2010, 3, 117–126. [Google Scholar]
  34. Klima, K.; Stokłosa, A.; Pużyńska, K. Agricultural and economic circumstances of cereal cultivation under differentiated soil and climate conditions. Zeszyty Problemowe Postepow Nauk Rolniczych 2011, 559, 115–121. [Google Scholar]
  35. Iqbal, M.A.; Hamid, A.; Ahmad, T.; Siddiqui, M.H.; Hussain, I.; Ali, S.; Ali, A.; Ahmad, Z. Forage sorghum-legumes intercropping: Effect on growth, yields, nutritional quality and economic returns. Bragantia 2019, 78, 82–95. [Google Scholar] [CrossRef]
  36. Iqbal, M.A.; Hamid, A.; Hussain, I.; Siddiqui, M.H.; Ahmad, T.; Khaliq, A.; Ahmad, Z. Competitive indices in cereal and legume mixtures in a South Asian environment. Agron. J. 2019, 111, 242–249. [Google Scholar] [CrossRef]
  37. Monti, M.; Pellicanò, A.; Santonoceto, C.; Preiti, G.; Pristeri, A. Yield components and nitrogen use in cereal-pea intercrops in mediterranean environment. Field Crops Res. 2016, 196, 379–388. [Google Scholar] [CrossRef]
  38. Layek, J.; Das, A.; Mitran, T.; Nath, C.; Meena, R.S.; Yadav, G.S.; Shivakumar, B.G.; Kumar, S.; Lal, R. Cereal + legume intercropping: An option for improving productivity and sustaining soil health. In Legumes for Soil Health and Sustainable Management; Springer: Singapore, 2018; pp. 347–386. [Google Scholar]
  39. Rudnicki, F.; Wenda-Piesik, A. Productivity of pea-cereal intercrops on good rye soil complex. Zeszyty Problemowe Postepow Nauk Rolniczych 2007, 516, 181–195. [Google Scholar]
  40. Wenda-Piesik, A.; Rudnicki, F. The importance of pea cultivar selection for pea-cereal intercropping on good rye soil complex. Zeszyty Problemowe Postepow Nauk Rolniczych 2007, 516, 277–292. [Google Scholar]
  41. Rudnicki, F.; Kotwica, K. Competitive interactions between spring cerealsand lupinsin mixtures and mixture growing production effectson very good rye complex soil. Fragm. Agron. 2007, 4, 145–152. [Google Scholar]
  42. Yu, Y.; Stomph, T.-J.; Makowski, D.; Zhang, L.; van der Werf, W. A meta-analysis of relative crop yields in cereal/legume mixtures suggests options for management. Field Crops Res. 2016, 198, 269–279. [Google Scholar] [CrossRef] [Green Version]
  43. Gaudio, N.; Escobar-Gutiérrez, A.J.; Casadebaig, P.; Evers, J.B.; Gerard, F.; Louarn, G.; Colbach, N.; Munz, S.; Launay, M.; Marrous, H.; et al. Current knowledge and future research opportunities for modeling annual crop mixtures. A review. Agron. Sustain. Dev 2019, 39, 20. [Google Scholar] [CrossRef] [Green Version]
  44. Kotwica, K.; Rudnicki, F. Production effects of growing spring cereal and cereal-and-legume mixtures on good rye complex soil. Acta Sci. Pol. Agric. 2004, 3, 149–156. [Google Scholar]
  45. Kotwica, K.; Rudnicki, F. Composing of spring cereal mixtures with lupine on light soil. Zeszyty Problemowe Postepow Nauk Rolniczych 2003, 495, 163–170. [Google Scholar]
  46. Rodriguez, C.; Carlsson, G.; Englund, J.-E.; Flöhr, A.; Pelzer, E.; Jeuffroy, M.-H.; Makowski, D.; Jensen, E.S. Grain legume-cereal intercropping enhances the use of soil-derived and biologically fixed nitrogen in temperate agroecosystems. A meta-analysis. Eur. J. Agron. 2020, 118, 126077. [Google Scholar] [CrossRef]
  47. Księżak, J. The development of pea and spring barley plants in the mixtures on various soil types. Zeszyty Problemowe Postepow Nauk Rolniczych 2007, 516, 83–90. [Google Scholar]
  48. Głąb, T.; Pużyńska, K.; Pużyński, S.; Palmowska, J.; Kowalik, K. Effect of organic farming on a stagnic luvisol soil physical quality. Geoderma 2016, 282, 16–25. [Google Scholar] [CrossRef]
  49. Gentsch, N.; Boy, J.; Guggenberger, G. Incorporation of diverse catch crop mixtures in crop rotation cycles increase biodiversity and nutrient availability in soils. In Jahrestagung der DBG; Horizonte des Bodens: Göttingen, Germany, 2017. [Google Scholar]
  50. Molla, E.A.; Wondimagegn, B.A.; Chekol, Y.M. Evaluation of biomass yield and nutritional quality of oats–vetch mixtures at different harvesting stage under residual moisture in Fogera district, Ethiopia. Agric. Food Secur. 2018, 7. [Google Scholar] [CrossRef]
  51. Pużyńska, K.; Synowiec, A.; Pużyński, S.; Bocianowski, J.; Klima, K.; Lepiarczyk, A. Selected canopy indices and yielding of oats-vetch mixture in two contrasting farming systems. Agriculture 2021, in press. [Google Scholar]
  52. Kaut, A.H.E.E.; Mason, H.E.; Navabi, A.; O’Donovan, J.T.; Spaner, D. Organic and conventional management of mixtures of wheat and spring cereals. Agron. Sustain. Dev. 2008, 28, 363–371. [Google Scholar] [CrossRef] [Green Version]
  53. Paut, R.; Sabatier, R.; Tchamitchian, M. Modelling crop diversification and association effects in agricultural systems. Agric. Ecosyst. Environ. 2020, 288, 106711. [Google Scholar] [CrossRef]
Figure 1. Sum of precipitation (mm) in particular months of 2012–2014 and multiyear 1951–2000.
Agriculture 11 00079 g001
Figure 2. Sum of precipitation (mm) in the vegetative period (April–August) and the years of study 2012–2014 compared to multiyear.
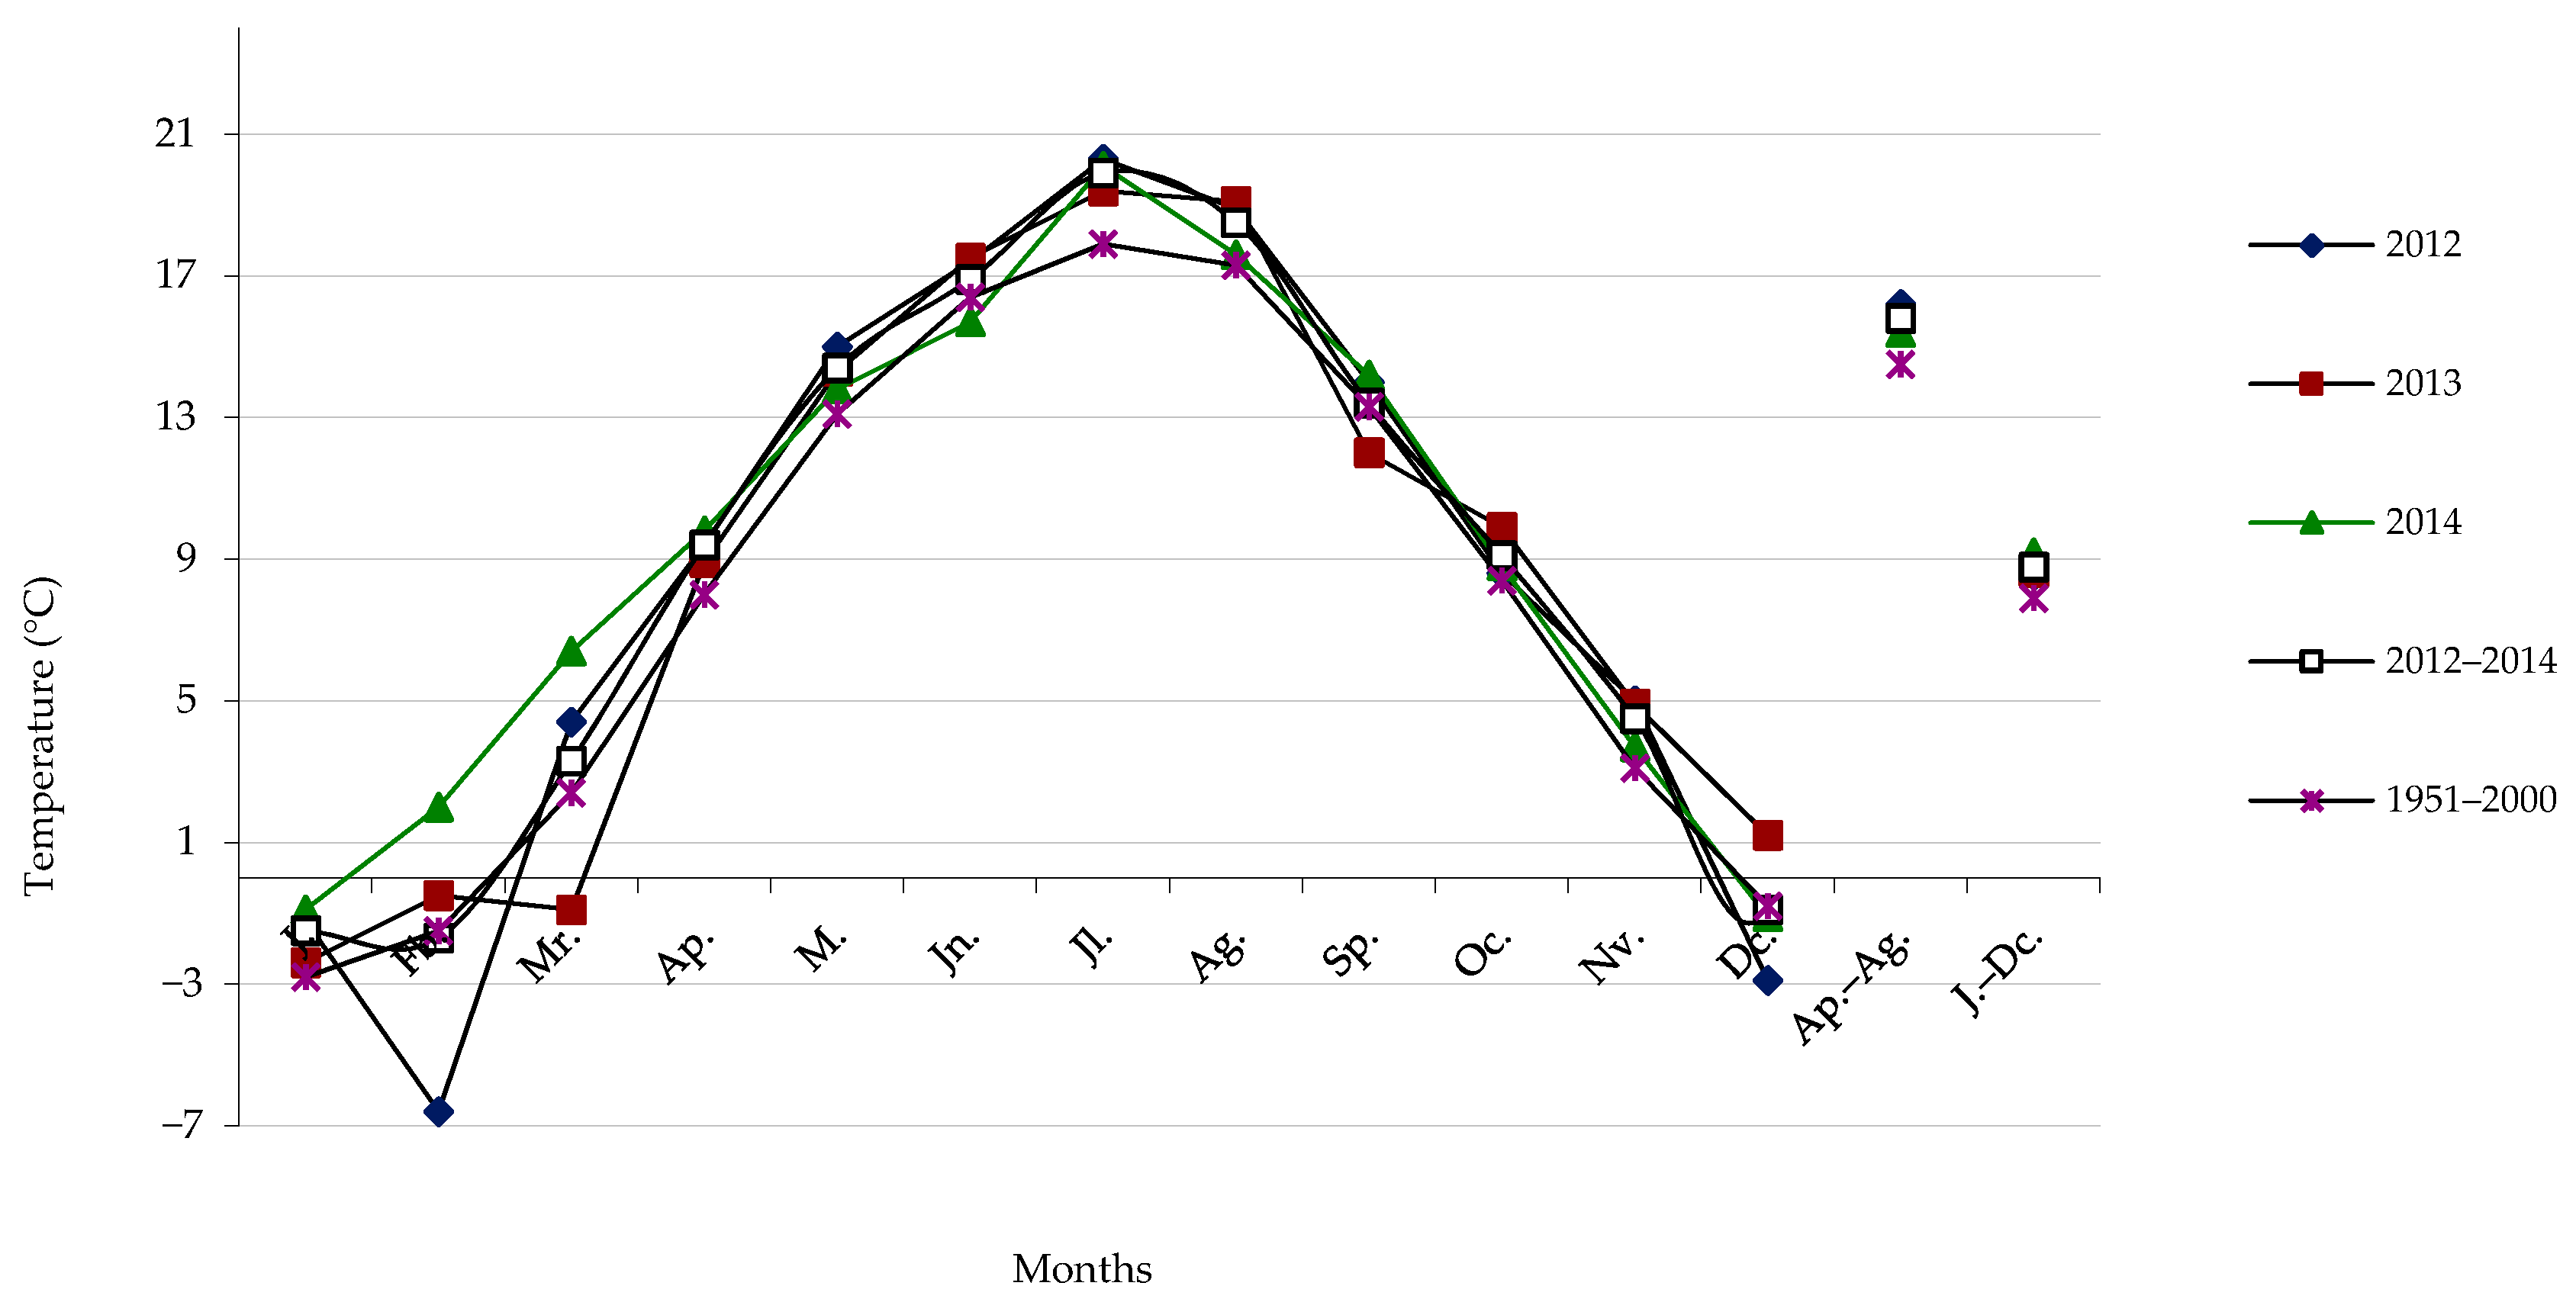
Agriculture 11 00079 g002
Figure 3. Mean temperatures (°C) in the months of 2012–2014 and in multiyear 1951–2000.
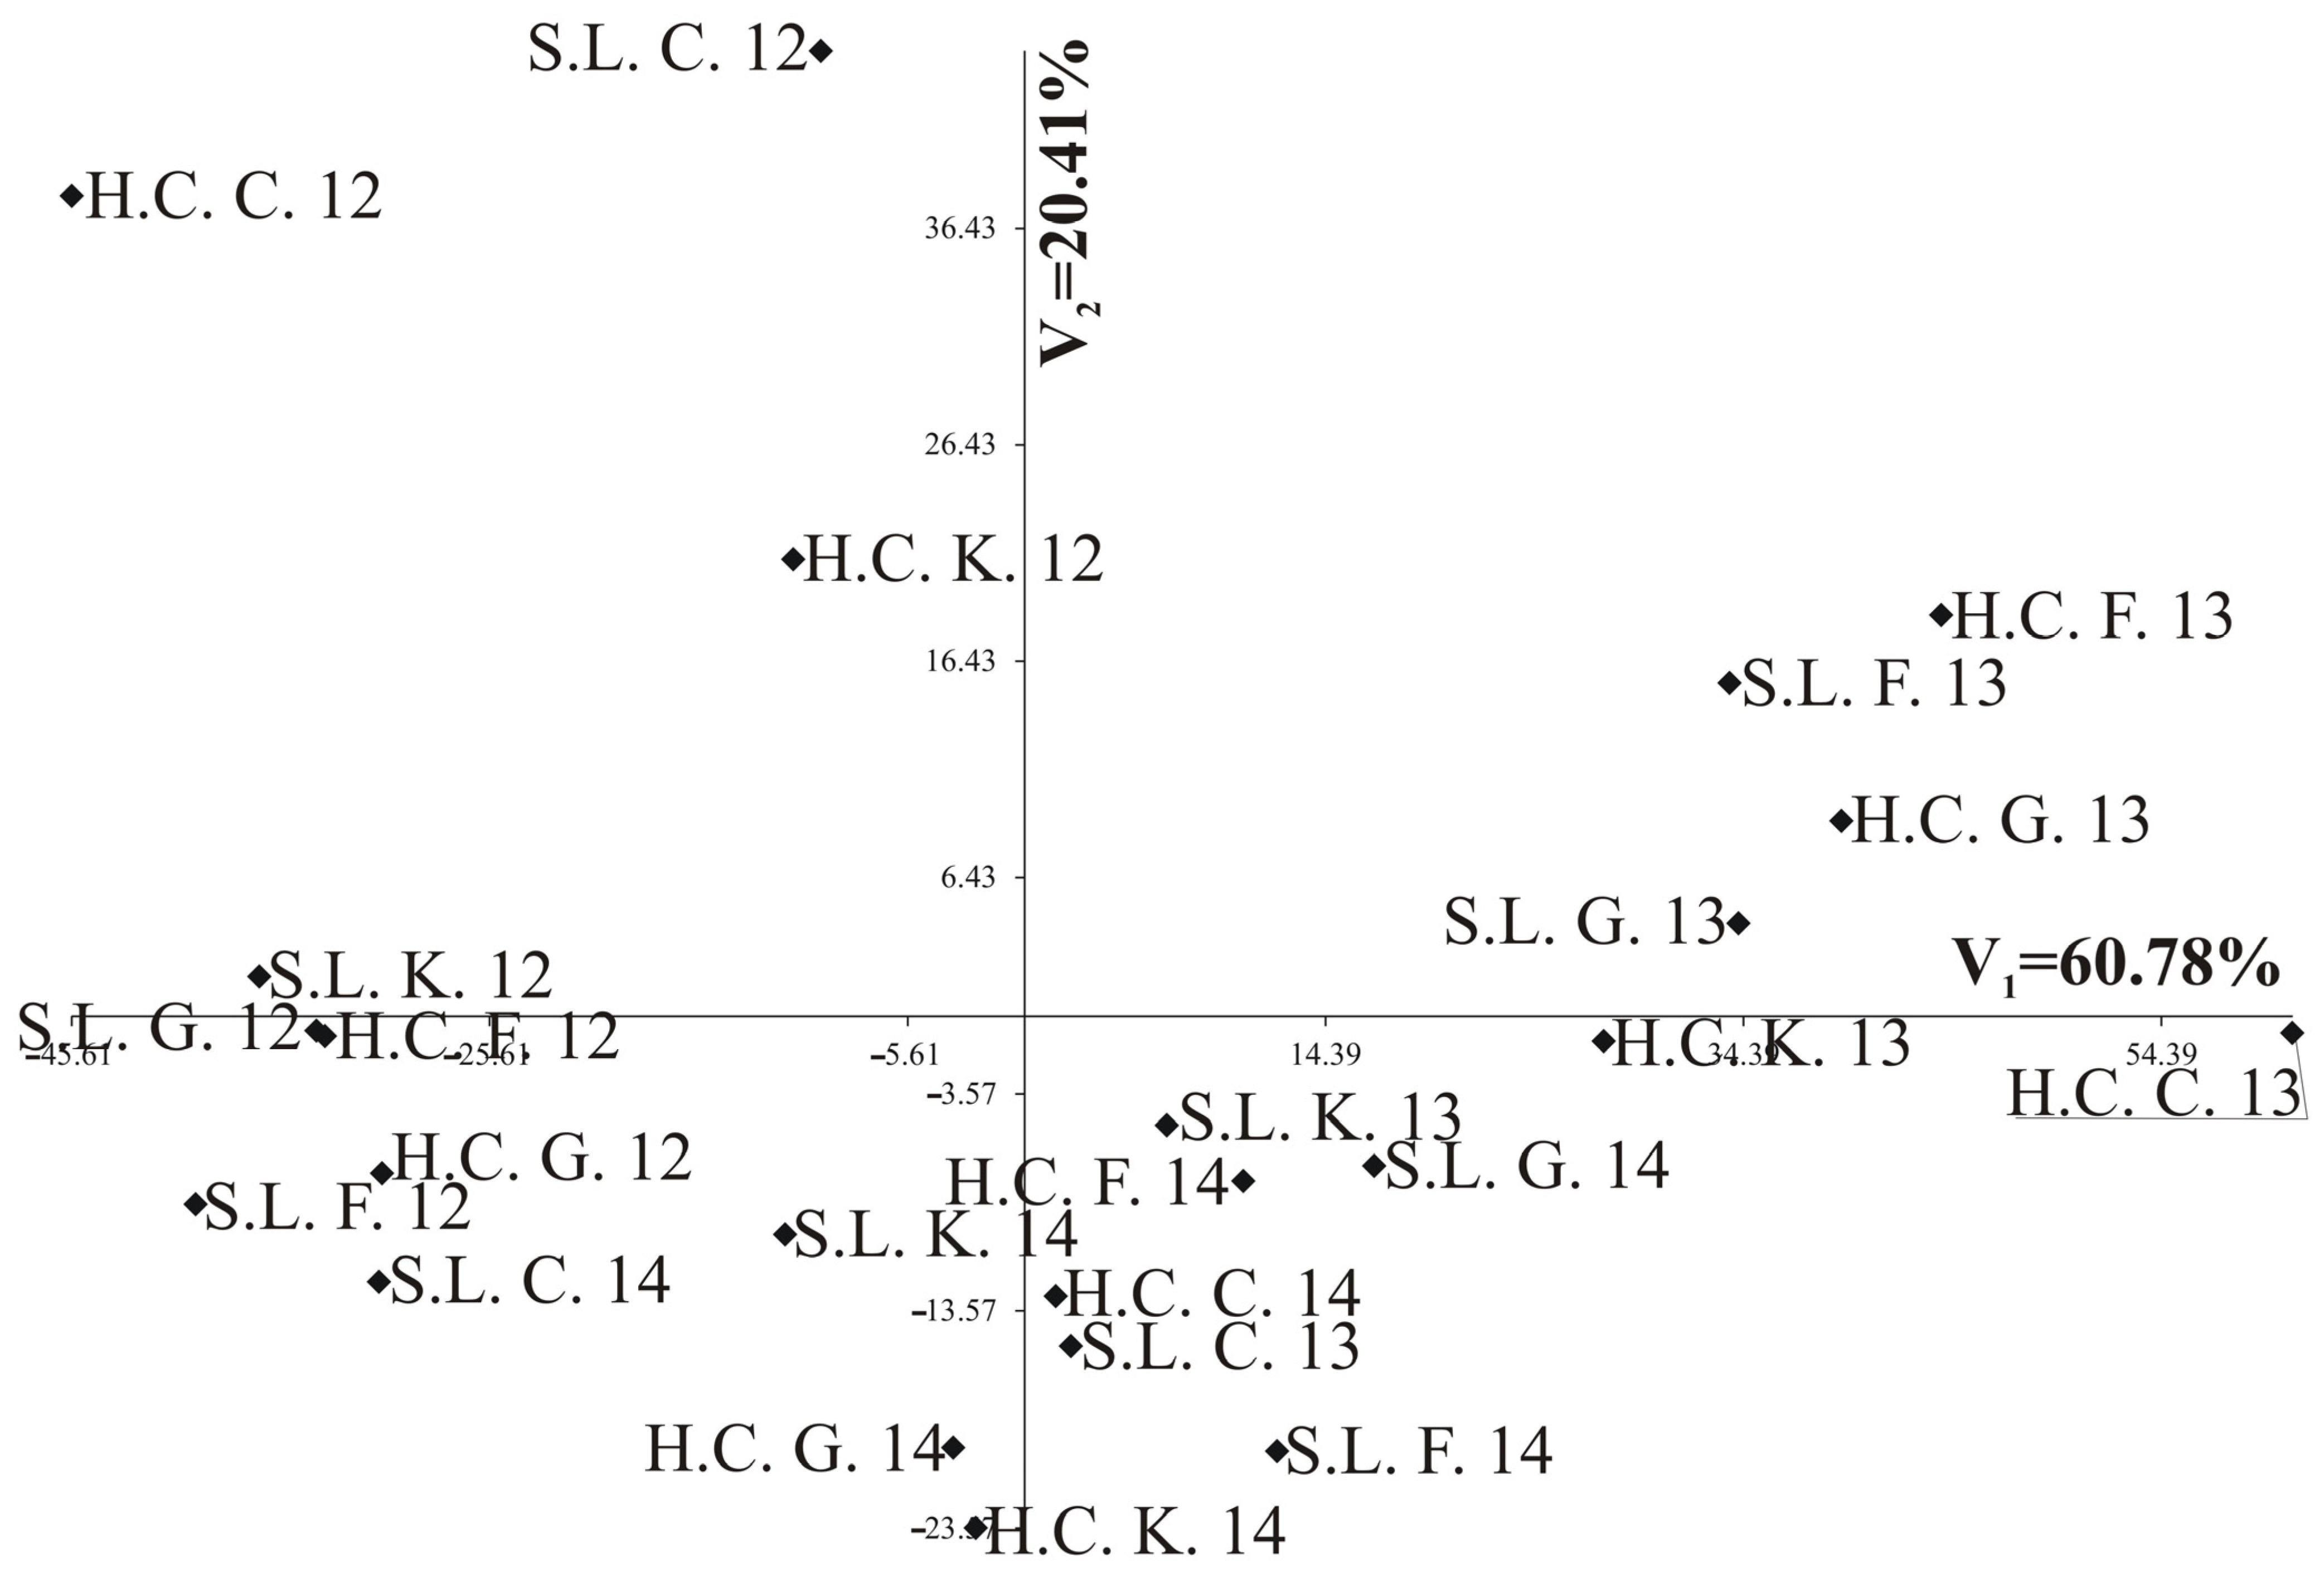
Agriculture 11 00079 g003
Figure 4. Distribution of combinations of treatments in the two first canonical variates. Abbreviations: S.L.—Stagnic Luvisolor, H.C.—Haplic Cambisol; C.—‘Celer’, F.—‘Furman’, G.—‘Grajcar’, K.—‘Kasztan’; 12–14—years 2012–2014.
Agriculture 11 00079 g004
Table 1. Characteristic of the soils.
ParameterUnitStagnic LuvisolHaplic Cambisol
pH (KCl)-6.045.31
Total organic Cg kg−17.346.67
Total Ng kg−10.8580.61
Pmg kg−1423.0337.5
Kmg kg−1148.2178.3
Table 2. Characteristics of oats’ cultivars.
FeaturesOats Cultivar
‘Celer’‘Grajcar’‘Kasztan’‘Furman’
Grain coloryellowyellowyellowyellow
Grain yieldgoodgoodmediumquite good
Husk share in grain28.8% (high)29.5% (very high)29.4% (very high)29.0% (high)
Tolerance to soil acidificationaverageaverageaveragequite small
Lodging resistanceaverageaverageaveragebig
Recommended sowing rate of seeds (seeds m−2)550–600550–600500400–450
Plant highquite smallquite smallquite smallmedium
No. of days to ripening (since January 1)198199201206
Thousand grains weight (g)40.135.336.937.3
Protein contentmediummediummediumsmall to very small
Fat contentmediummediumvery bigsmall to very small
Areas intended for cultivationmountainousmountainouslowland and mountainouslowland
BreederMałopolska Hodowla Roślin, Sp. z o. o., PolandMałopolska Hodowla Roślin, Sp. z o. o., PolandMałopolska Hodowla Roślin, Sp. z o. o., PolandHodowla Roślin, Danko, Sp. z o. o., Poland
Table 3. Mean squares from three-way analysis of variance for observed traits.
Source of Variationd.f.o. Proteinv. ProteinGrain No.Yieldv. SharePanicle No.Tiller no.TWGTSWPanicle g.w.o. Plant No.v. Plant No.o. Height
Replication30.0460.17011.6930.03118.112,0290.00032.1352.3080.000722.2610.194.83
ST1598.8 ***148.9 ***567.3 ***35.02 ***10,372 ***198,586 **0.01139.388 *972.8 **0.534 ***168.01 ***177.85 *2889 ***
Residual 130.0440.0310.3660.05842.4538020.00230.6526.6380.0030.217.053.258
Cultivar3741.4 ***421.4 ***65.76 ***0.281 ***234.43 ***77,537 ***0.115 ***203.9 ***83.8 ***0.048 ***4623.3 ***166.4 ***135.2 ***
ST × Cultivar3160.5 ***132.4 ***92.08 ***0.607 ***189.93 ***112,019 ***0.0087.271 **30.5 **0.071 ***2717.5 ***32.3 *117.9 ***
Residual 2180.9130.592.4580.023814.5832670.0031.0025.820.00436.578.824.35
Year220,446.5 ***446.5 ***134.6 ***13.43 ***19,292 ***2,113,463 ***0.140 ***137.1 ***931.4 ***0.199 ***131,550 ***682.6 ***335.4 ***
Year x S.T.220.79 ***883.3 ***87.60 ***1.057 ***342.1 ***41,734 ***0.131 ***42.69 ***344.2 ***0.064 ***10,784 ***1438.1 ***183.8 ***
Year × Cultivar6308.7 ***92.9 ***46.5 ***0.219 ***272.67 ***58,217 ***0.075 ***4.169 ***25.56 *0.022 ***45,497 ***287.3 ***44.13 ***
Year × ST × Cultivar6526.9 ***255.6 ***29.87 ***0.322 ***208.25 ***84410.038 ***12.59 ***52.41 ***0.025 ***5523 ***126.7 ***42.55 ***
Residual 3481.020.4681.790.033618.2143820.00290.538.7880.00324.447.3386.19
Abbreviations: ST—soil type; d.f.—degrees of freedom; o. Protein—protein content in oats grain (g·kg−1); v. Protein—protein content in vetch seeds (g·kg−1); Grain No.—number of oats grains (pcs.) per panicle; Yield—mixtures yield; v. Share—the share of vetch in the mixture’s yield (%); Panicle No.—number of oats panicles per m2; Tiller no.—number of oats’ tillers; TWG—thousand grain mass of oats; TSW—thousand grain mass of vetch; Panicle g.w.—mass grains (g) per oats panicle; o. Plant No.—density of oats after spring emergence (pcs m2); v. Plant No.—density of common vetch (pcs m2) spring; o. Height—the height of oats canopy (cm). * p < 0.05; ** p < 0.01; *** p < 0.001; d.f.–the number of degrees of freedom.
Table 4. Oats’ density in spring (pieces m−2) in mixture depending on the soil type (factor I), oat cultivar (factor II), and study years (factor III).
Soil TypeYearsOat CultivarMean 1 ± SD 3
‘Celer’‘Furman’‘Grajcar’‘Kasztan’
Stagnic Luvisol2012500460483497485 ± 18.5
2013364493460474448 ± 57.8
2014409405452447428 ± 25.0
Mean 2 ± SD 3424 ± 69.6452 ± 44.8465 ± 16.0473 ± 25.0454 ns
Haplic Cambisol2012490439441488464 ± 28.4
2013452500498485484 ± 22.2
2014417443399390412 ± 23.4
Mean 2 ± SD 3453 ± 36.3461 ± 34.3446 ± 49.7454 ± 55.6453 ns
Mean2012495449462493475 ± 22.7 x
2013408497479479466 ± 39.5 y
2014413424426419420 ± 5.8 z
Mean 2 ± SD 3438 ± 48.9 b456 ± 37.0 a456 ± 27.3 a463 ± 39.5 a453
LSD 0.05 soil typens 4
LSD 0.05 cultivar8.03
LSD 0.05 years5.14
LSD 0.05 soil type × cultivar11.2
LSD 0.05 soil type × years7.27
LSD 0.05 cultivar × years10.3
1 Mean for the soil type, regardless of the oat cultivar; 2 Mean for the year 2012–2014; 3 S.D.—standard deviation; 4 ns—non-significant. Homogeneous groups were created for the main factors. According to Tukey’s test, mean values marked with the same letters do not differ significantly (p ≤ 0.05). Small letters (a, b, c) for mean values of the second-factor levels—oats cultivars and x, y and z letters for the third-factor levels—study years were chosen. The three-factor ANOVA—first-factor, soil type: Stagnic Luvisol and Haplic Cambisol; second-factor, oat cultivar: ‘Celer’, ‘Furman’, ‘Grajcar’, ‘Kasztan’; third-factor, years: 2012, 2013, 2014.
Table 5. Number of oats’ tillers in mixtures depending on the soil type (factor I), oat cultivar (factor II), and study years (factor III).
Soil TypeYearsOat CultivarMean 1 ± SD 3
‘Celer’‘Furman’‘Grajcar’‘Kasztan’
Stagnic Luvisol20121.221.111.211.091.16 ± 0.07
20131.681.341.171.161.34 ± 0.24
20141.031.201.101.081.10 ± 0.07
Mean 2 ± SD 31.31 ± 0.331.22 ± 0.111.16 ± 0.061.11 ± 0.051.20 ns
Haplic Cambisol20121.281.331.321.151.27 ± 0.08
20131.341.211.121.181.21 ± 0.09
20141.251.181.101.201.18 ± 0.06
Mean 2 ± SD 31.29 ± 0.051.24 ± 0.081.18 ± 0.121.18 ± 0.021.22 ns
Mean20121.251.221.261.121.21 ± 0.06 y
20131.511.281.141.171.27 ± 0.17 x
20141.141.191.101.141.14 ± 0.04 z
Mean 2 ± SD 31.30 ± 0.19 a1.23 ± 0.04 b1.17 ± 0.09 c1.14 ± 0.02 c1.21
LSD 0.05 soil typens 4
LSD 0.05 cultivar0.045
LSD 0.05 years0.033
LSD 0.05 soil type × cultivarns
LSD 0.05 soil type × years0.046
LSD 0.05 cultivar × years0.065
1 Mean for the soil type, regardless of the oat cultivar; 2 Mean for the year 2012–2014; 3 S.D.—standard deviation; 4 ns—non-significant. Homogeneous groups were created for the main factors. According to Tukey’s test, mean values marked with the same letters do not differ significantly (p ≤ 0.05). Small letters (a, b, c) for mean values of the second-factor levels—oats cultivars and x, y and z letters for the third-factor levels—study years were chosen. The three-factor ANOVA—first-factor, soil type: Stagnic Luvisol and Haplic Cambisol; second-factor, oat cultivar: ‘Celer’, ‘Furman’, ‘Grajcar’, ‘Kasztan’; third-factor, years: 2012, 2013, 2014.
Table 6. Vetch density in spring (pieces m−2) in mixture depending on the soil type (factor I), oat cultivar (factor II), and study years (factor III).
Soil TypeYearsOat CultivarMean 1 ± SD 3
‘Celer’‘Furman’‘Grajcar’‘Kasztan’
Stagnic Luvisol201252.064.056.552.056.1 ± 5.66
201355.042.540.051.047.1 ± 7.05
201451.041.061.049.350.6 ± 8.21
Mean 2 ± SD 352.7 ± 2.0849.2 ± 12.952.5 ± 11.150.8 ± 1.3751.3 B
Haplic Cambisol201258.051.055.046.052.5 ± 5.20
201369.064.063.065.065.3 ± 2.63
201447.032.046.052.044.3 ± 8.58
Mean 2 ± SD 358.0 ± 11.049.0 ± 16.154.7 ± 8.5054.3 ± 9.7154.0 A
Mean201255.057.555.849.054.3 ± 3.70 y
201362.053.351.558.056.2 ± 4.74 x
201449.036.553.550.747.4 ± 7.52 z
Mean 2 ± SD 355.3 ± 6.51 a49.1 ± 11.1 b53.6 ± 2.15 ab52.6 ± 4.78 ab52.6
LSD 0.05 soil type2.68
LSD 0.05 cultivar2.42
LSD 0.05 years1.68
LSD 0.05 soil type × cultivar3.43
LSD 0.05 soil type × years2.32
LSD 0.05 cultivar × years3.27
1 Mean for the soil type, regardless of the oat cultivar; 2 Mean for the year 2012–2014; 3 S.D.—standard deviation; Homogeneous groups were created for the main factors. According to Tukey’s test, mean values marked with the same letters do not differ significantly (p ≤ 0.05). Capital letters (A and B) for mean values of the first factor levels—soil types, small letters (a, b, c) for mean values of the second-factor levels—oats cultivars and x, y and z letters for the third-factor levels—study years were chosen. The three-factor ANOVA—first-factor, soil type: Stagnic Luvisol and Haplic Cambisol; second-factor, oat cultivar: ‘Celer’, ‘Furman’, ‘Grajcar’, ‘Kasztan’; third-factor, years: 2012, 2013, 2014.
Table 7. Seed yield (t ha−1) of the mixture depending on the soil type (factor I), oat cultivar (factor II), and study years (factor III).
Soil TypeYearsOat CultivarMean 1 ± SD 3
‘Celer’‘Furman’‘Grajcar’‘Kasztan’
Stagnic Luvisol20124.153.843.613.793.84 ± 0.23
20132.532.432.392.222.39 ± 0.13
20142.693.302.313.172.87 ± 0.46
Mean 2 ± SD 33.12 ± 0.893.19 ± 0.712.77 ± 0.733.06 ± 0.793.03 A
Haplic Cambisol20121.782.092.472.812.29 ± 0.45
20131.071.121.181.241.15 ± 0.07
20142.001.991.992.182.04 ± 0.09
Mean 2 ± SD 31.62 ± 0.491.73 ± 0.531.88 ± 0.652.08 ± 0.791.83 B
Mean20122.962.963.043.303.07 ± 0.16 x
20131.801.781.781.731.77 ± 0.03 z
20142.352.642.152.682.45 ± 0.25 y
Mean 2 ± SD 32.37 ± 0.58 bc2.46 ± 0.61 ab2.32 ± 0.65 c2.57 ± 0.79 a2.43
LSD 0.05 soil type0.157
LSD 0.05 cultivar0.126
LSD 0.05 years0.111
LSD 0.05 soil type × cultivar0.178
LSD 0.05 soil type × years0.157
LSD 0.05 cultivar × years0.220
1 Mean for the soil type, regardless of the oat cultivar; 2 Mean for the year 2012–2014; 3 S.D.—standard deviation. Homogeneous groups were created for the main factors. According to Tukey’s test, mean values marked with the same letters do not differ significantly (p ≤ 0.05). Capital letters (A and B) for mean values of the first factor levels—soil types, small letters (a, b, c) for mean values of the second-factor levels—oats cultivars and x, y and z letters for the third-factor levels—study years were chosen. The three-factor ANOVA—first-factor, soil type: Stagnic Luvisol and Haplic Cambisol; second-factor, oat cultivar: ‘Celer’, ‘Furman’, ‘Grajcar’, ‘Kasztan’; third-factor, years: 2012, 2013, 2014.
Table 8. Share (%) of common vetch seeds in the mixture depending on the soil type (factor I), oat cultivar (factor II), and study years (factor III).
Soil TypeYearsOats CultivarMean 1 ± SD 3
‘Celer’‘Furman’‘Grajcar’‘Kasztan’
Stagnic Luvisol201222.335.129.720.827.0 ± 6.67
201375.475.076.476.075.7 ± 0.65
201478.169.765.970.771.1 ± 5.13
Mean 2 ± SD 358.6 ± 31.559.9 ± 21.757.3 ± 24.555.8 ± 30.557.9 A
Haplic Cambisol20124.823.012.78.512.2 ± 7.86
201361.655.161.744.755.8 ± 8.00
201441.931.060.240.443.4 ± 12.2
Mean 2 ± SD 336.1 ± 28.836.4 ± 16.744.9 ± 27.931.2 ± 19.837.1 B
Mean201213.629.121.214.619.6 ± 7.14 z
201368.565.069.160.465.7 ± 4.00 x
201460.050.463.055.657.2 ± 5.52 y
Mean 2 ± SD 347.4 ± 29.6 b48.2 ± 18.1 ab51.1 ± 26.1 a43.5 ± 25.1 c47.5
LSD 0.05 soil type4.23
LSD 0.05 cultivar3.12
LSD 0.05 years2.58
LSD 0.05 soil type × cultivar4.41
LSD 0.05 soil type × years3.65
LSD 0.05 cultivar × years5.16
1 Mean for the soil type, regardless of the oat cultivar; 2 Mean for the year 2012–2014; 3 S.D.—standard deviation. Homogeneous groups were created for the main factors. According to Tukey’s test, mean values marked with the same letters do not differ significantly (p ≤ 0.05). Capital letters (A and B) for mean values of the first factor levels—soil types, small letters (a, b, c) for mean values of the second-factor levels—oats cultivars and x, y and z letters for the third-factor levels—study years were chosen. The three-factor ANOVA—first-factor, soil type: Stagnic Luvisol and Haplic Cambisol; second-factor, oat cultivar: ‘Celer’, ‘Furman’, ‘Grajcar’, ‘Kasztan’; third-factor, years: 2012, 2013, 2014.
Table 9. Straw yield (t ha−1) for oats-vetch mixtures depending on the soil type (factor I), oat cultivar (factor II), and study years (factor III).
Soil TypeYearsOat CultivarMean 1 ± SD 3
‘Celer’‘Furman’‘Grajcar’‘Kasztan’
Stagnic Luvisol20123.993.803.793.303.72 ± 0.29
20135.825.144.714.595.06 ± 0.56
20145.475.994.595.535.39 ± 0.59
Mean 2 ± SD 35.09 ± 0.974.98 ± 1.114.36 ± 0.504.47 ± 1.124.72 A
Haplic Cambisol20123.002.732.272.172.54 ± 0.39
20132.693.102.822.842.86 ± 0.17
20145.736.485.625.205.76 ± 0.53
Mean 2 ± SD 33.81 ± 1.674.10 ± 2.073.57 ± 1.803.41 ± 1.593.72 B
Mean20123.493.263.032.743.13 ± 0.32 z
20134.264.123.763.713.96 ± 0.27 y
20145.606.245.105.365.58 ± 0.49 x
Mean 2 ± SD 34.45 ± 1.07 a4.54 ± 1.53 a3.96 ± 1.05 b3.94 ± 1.33 b4.22
LSD 0.05 soil type0.166
LSD 0.05 cultivar0.278
LSD 0.05 years0.240
LSD 0.05 soil type × cultivarns 4
LSD 0.05 soil type × years0.321
LSD 0.05 cultivar × years0.479
1 Mean for the soil type, regardless of the oat cultivar; 2 Mean for the year 2012–2014; 3 S.D.—standard deviation; 4 ns—non-significant. Homogeneous groups were created for the main factors. According to Tukey’s test, mean values marked with the same letters do not differ significantly (p ≤ 0.05). Capital letters (A and B) for mean values of the first factor levels—soil types, small letters (a, b, c) for mean values of the second-factor levels—oats cultivars and x, y and z letters for the third-factor levels—study years were chosen. The three-factor ANOVA—first-factor, soil type: Stagnic Luvisol and Haplic Cambisol; second-factor, oat cultivar: ‘Celer’, ‘Furman’, ‘Grajcar’, ‘Kasztan’; third-factor, years: 2012, 2013, 2014.
Table 10. Number of oat panicles (pieces m−2) in the mixtures depending on the soil type (factor I), oat cultivar (factor II), and study years (factor III).
Soil TypeYearsOat CultivarMean 1 ± SD 3
‘Celer’‘Furman’‘Grajcar’‘Kasztan’
Stagnic Luvisol2012511388455453452 ± 50.3
2013203262219180216 ± 34.6
2014151227201170187 ± 33.7
Mean 2 ± SD 3288 ± 194.6292 ± 84.7292 ± 141.8268 ± 160.6285 B
Haplic Cambisol2012559350415516460 ± 95.0
2013316223225291264 ± 47.0
2014325283176286268 ± 63.9
Mean 2 ± SD 3400 ± 137.7285 ± 63.5272 ± 126.2364 ± 131.3330 A
Mean2012535369435485456 ± 70.9 x
2013260243222236240 ± 15.7 y
2014238255189228227 ± 28.2 y
Mean 2 ± SD 3344 ± 165.6 a289 ± 69.7 c282 ± 133.7 c316 ± 146.0 b308
LSD 0.05 soil type20.0
LSD 0.05 cultivar23.3
LSD 0.05 years20.0
LSD 0.05 soil type × cultivar32.9
LSD 0.05 soil type × years28.3
LSD 0.05 cultivar × years40.0
1 Mean for the soil type, regardless of the oat cultivar; 2 Mean for the year 2012–2014; 3 S.D.—standard deviation. Homogeneous groups were created for the main factors. According to Tukey’s test, mean values marked with the same letters do not differ significantly (p ≤ 0.05). Capital letters (A and B) for mean values of the first factor levels—soil types, small letters (a, b, c) for mean values of the second-factor levels—oats cultivars and x, y and z letters for the third-factor levels—study years were chosen. The three-factor ANOVA—first-factor, soil type: Stagnic Luvisol and Haplic Cambisol; second-factor, oat cultivar: ‘Celer’, ‘Furman’, ‘Grajcar’, ‘Kasztan’; third-factor, years: 2012, 2013, 2014.
Table 11. Number of grains (pieces) per oat panicle in the mixtures depending on the soil type (factor I), oat cultivar (factor II), and study years (factor III).
Soil TypeYearsOats CultivarMean 1 ± SD 3
‘Celer’‘Furman’‘Grajcar’‘Kasztan’
Stagnic Luvisol201211.920.513.619.716.4 ± 4.31
201317.717.87.710.913.5 ± 5.08
201418.616.012.313.815.2 ± 2.75
Mean 2 ± SD 316.1 ± 3.6318.1 ± 2.2811.2 ± 3.1014.8 ± 4.4615.0 A
Haplic Cambisol20124.68.112.211.19.0 ± 3.43
20136.76.47.09.97.5 ± 1.60
201412.614.710.518.414.0 ± 3.37
Mean 2 ± SD 38.0 ± 4.159.7 ± 4.409.9 ± 2.6713.1 ± 4.6010.2 B
Mean20128.214.312.915.412.7 ± 3.15 y
201312.212.17.310.410.5 ± 2.28 z
201415.615.411.416.114.6 ± 2.18 x
Mean 2 ± SD 312.0 ±3.68 b13.9 ±1.65 a10.5 ±2.88 c14.0 ±3.12 a12.6
LSD 0.05 soil type0.393
LSD 0.05 cultivar1.28
LSD 0.05 years0.809
LSD 0.05 soil type × cultivar1.62
LSD 0.05 soil type × years1.01
LSD 0.05 cultivar × years1.62
1 Mean for the soil type, regardless of the oat cultivar; 2 Mean for the year 2012–2014; 3 S.D.—standard deviation. Homogeneous groups were created for the main factors. According to Tukey’s test, mean values marked with the same letters do not differ significantly (p ≤ 0.05). Capital letters (A and B) for mean values of the first factor levels—soil types, small letters (a, b, c) for mean values of the second-factor levels—oats cultivars and x, y and z letters for the third-factor levels—study years were chosen. The three-factor ANOVA—first-factor, soil type: Stagnic Luvisol and Haplic Cambisol; second-factor, oat cultivar: ‘Celer’, ‘Furman’, ‘Grajcar’, ‘Kasztan’; third-factor, years: 2012, 2013, 2014.
Table 12. 1000-grain mass (g) of oat in the mixture with vetch depending on the soil type (factor I), oat cultivar (factor II), and study years (factor III).
Soil TypeYearsOat CultivarMean 1 ± SD 3
‘Celer’‘Furman’‘Grajcar’‘Kasztan’
Stagnic Luvisol201236.432.428.233.432.6 ± 3.39
201341.237.036.437.838.1 ± 2.16
201436.933.429.732.633.1 ± 2.96
Mean 2 ± SD 338.2 ± 2.6634.2 ± 2.4031.4 ± 4.3834.6 ± 2.7834.6 B
Haplic Cambisol201236.830.133.134.333.6 ± 2.75
201340.834.731.138.536.3 ± 4.27
201440.035.332.136.135.9 ± 3.24
Mean 2 ± SD 339.2 ± 2.1233.3 ± 2.8032.1 ± 1.0136.3 ± 2.1135.2 A
Mean201236.631.330.733.933.1 ± 2.71 z
201341.035.833.838.137.2 ± 3.11 x
201438.434.330.934.334.5 ± 3.08 y
Mean 2 ± SD 338.7 ± 2.21 a33.8 ± 2.32 c31.8 ± 1.72 d35.4 ± 2.34 b34.9
LSD 0.05 soil type0.525
LSD 0.05 cultivar0.816
LSD 0.05 years0.441
LSD 0.05 soil type × cultivar1.13
LSD 0.05 soil type × years0.624
LSD 0.05 cultivar × years0.883
1 Mean for the soil type, regardless of the oat cultivar; 2 Mean for the year 2012–2014; 3 S.D.—standard deviation. Homogeneous groups were created for the main factors. According to Tukey’s test, mean values marked with the same letters do not differ significantly (p ≤ 0.05). Capital letters (A and B) for mean values of the first factor levels—soil types, small letters (a, b, c) for mean values of the second-factor levels—oats cultivars and x, y and z letters for the third-factor levels—study years were chosen. The three-factor ANOVA—first-factor, soil type: Stagnic Luvisol and Haplic Cambisol; second-factor, oat cultivar: ‘Celer’, ‘Furman’, ‘Grajcar’, ‘Kasztan’; third-factor, years: 2012, 2013, 2014.
Table 13. Mass grains (g) per oat panicle in the oat–vetch mixture depending on the soil type (factor I), oat cultivar (factor II), and study years (factor III).
Soil TypeYearsOat CultivarMean 1 ± SD 3
‘Celer’‘Furman’‘Grajcar’‘Kasztan’
Stagnic Luvisol20120.430.660.410.650.54 ± 0.14
20130.430.470.250.280.36 ± 0.11
20140.480.470.420.420.45 ± 0.03
Mean 2 ± SD 30.45 ± 0.030.53 ± 0.110.36 ± 0.090.45 ± 0.180.45 A
Haplic Cambisol20120.170.240.400.390.30 ± 0.12
20130.170.180.220.250.21 ± 0.04
20140.310.420.320.500.39 ± 0.09
Mean 2 ± SD 30.22 ± 0.080.28 ± 0.120.32 ± 0.090.38 ± 0.130.30 B
Mean20120.300.450.410.520.42 ±0.09 x
20130.300.330.240.270.28 ±0.04 y
20140.400.440.370.460.42 ±0.04 x
Mean 2 ± SD 30.33 ± 0.06 b0.41 ± 0.07 a0.34 ± 0.09 b0.42 ± 0.13 a0.37
LSD 0.05 soil type0.034
LSD 0.05 cultivar0.048
LSD 0.05 years0.035
LSD 0.05 soil type × cultivar0.068
LSD 0.05 soil type × years0.050
LSD 0.05 cultivar × years0.070
1 Mean for the soil type, regardless of the oat cultivar; 2 Mean for the year 2012–2014; 3 S.D.—standard deviation. Homogeneous groups were created for the main factors. According to Tukey’s test, mean values marked with the same letters do not differ significantly (p ≤ 0.05). Capital letters (A and B) for mean values of the first factor levels—soil types, small letters (a, b, c) for mean values of the second-factor levels—oats cultivars and x, y and z letters for the third-factor levels—study years were chosen. The three-factor ANOVA—first-factor, soil type: Stagnic Luvisol and Haplic Cambisol; second-factor, oat cultivar: ‘Celer’, ‘Furman’, ‘Grajcar’, ‘Kasztan’; third-factor, years: 2012, 2013, 2014.
Table 14. 1000-seed mass (g) of vetch cv. ‘Hanka’ of the mixture depending on the soil type (factor I), oat cultivar (factor II), and study years (factor III).
Soil TypeYearsOat CultivarMean 1 ± SD 3
‘Celer’‘Furman’‘Grajcar’‘Kasztan’
Stagnic Luvisol201248.047.351.549.549.1 ± 1.85
201355.650.958.549.253.5 ± 4.29
201451.054.852.852.952.9 ± 1.55
Mean 2 ± SD 351.5 ± 3.8451.0 ± 3.7354.3 ± 3.7450.5 ± 2.0351.8 A
Haplic Cambisol201238.138.840.027.536.1 ± 5.80
201351.345.945.246.647.3 ± 2.75
201454.052.254.651.453.0 ± 1.50
Mean 2 ± SD 347.8 ± 8.4645.6 ± 6.7146.6 ± 7.3941.8 ± 12.645.5 B
Mean201243.143.145.838.542.6 ± 3.00 z
201353.448.451.947.950.4 ± 2.69 y
201452.553.553.752.153.0 ± 0.77 x
Mean 2 ± SD 349.7 ± 5.74 ab48.3 ± 5.22 bc50.4 ± 4.17 a46.2 ± 6.97 c48.6
LSD 0.05 soil type1.67
LSD 0.05 cultivar1.97
LSD 0.05 years1.97
LSD 0.05 soil type × cultivar2.78
LSD 0.05 soil type × years2.54
LSD 0.05 cultivar × years3.52
1 Mean for the soil type, regardless of the oat cultivar; 2 Mean for the year 2012–2014; 3 S.D.—standard deviation. Homogeneous groups were created for the main factors. According to Tukey’s test, mean values marked with the same letters do not differ significantly (p ≤ 0.05). Capital letters (A and B) for mean values of the first factor levels—soil types, small letters (a, b, c) for mean values of the second-factor levels—oats cultivars and x, y and z letters for the third-factor levels—study years were chosen. The three-factor ANOVA—first-factor, soil type: Stagnic Luvisol and Haplic Cambisol; second-factor, oat cultivar: ‘Celer’, ‘Furman’, ‘Grajcar’, ‘Kasztan’; third-factor, years: 2012, 2013, 2014.
Table 15. Total protein content in oat grain (g kg−1) grown in the mixtures, depending on the soil type (factor I), oat cultivar (factor II), and study years (factor III).
Soil TypeYearsOat CultivarMean 1 ± SD 3
‘Celer’‘Furman’‘Grajcar’‘Kasztan’
Stagnic Luvisol201286.770.370.073.075.0 ± 7.95
2013120141135106125 ± 15.8
201487.610411390.598.5 ± 11.6
Mean 2 ± SD 397.9 ± 18.7105 ± 35.1106 ± 33.289.8 ± 16.499.6 B
Haplic Cambisol201271.488.080.283.680.8 ± 7.04
2013144130130121131 ± 9.69
201410311110193.0102 ± 7.18
Mean 2 ± SD 3106 ± 36.4110 ± 21.1104 ± 25.299.1 ± 19.2105.0 A
Mean201279.179.175.178.377.9 ± 1.92 z
2013132135133113128.0 ± 10.2 x
201495.010710791.8100.0 ± 7.86 y
Mean 2 ± SD 3102 ± 27.0 c107 ± 28.1 a105 ± 28.9 b94.4 ± 17.5 d102.0
LSD 0.05 soil type0.942
LSD 0.05 cultivar1.65
LSD 0.05 years1.13
LSD 0.05 soil type × cultivar2.13
LSD 0.05 soil type × years1.43
LSD 0.05 cultivar × years2.26
1 Mean for the soil type, regardless of the oat cultivar; 2 Mean for the year 2012–2014; 3 S.D.—standard deviation. Homogeneous groups were created for the main factors. According to Tukey’s test, mean values marked with the same letters do not differ significantly (p ≤ 0.05). Capital letters (A and B) for mean values of the first factor levels—soil types, small letters (a, b, c) for mean values of the second-factor levels—oats cultivars and x, y and z letters for the third-factor levels—study years were chosen. The three-factor ANOVA—first-factor, soil type: Stagnic Luvisol and Haplic Cambisol; second-factor, oat cultivar: ‘Celer’, ‘Furman’, ‘Grajcar’, ‘Kasztan’; third-factor, years: 2012, 2013, 2014.
Table 16. Total protein content in vetch seeds (g kg−1) grown in the mixtures, depending on the soil type (factor I), oat cultivar (factor II), and study years (factor III).
Soil TypeYearsOat CultivarMean 1 ± SD 3
‘Celer’‘Furman’‘Grajcar’‘Kasztan’
Stagnic Luvisol2012273272268274272 ± 2.50
2013292293285274286 ± 8.80
2014286264273272273 ± 9.12
Mean 2 ± SD 3284 ± 9.59276 ± 15.4275 ± 8.89273 ± 1.37277 A
Haplic Cambisol2012287290276267280 ± 10.5
2013271273276272273 ± 2.40
2014273275275263271 ± 5.50
Mean 2 ± SD 3277 ± 8.90279 ± 9.07276 ± 0.95267 ± 4.76275 B
Mean2012280281272270276 ± 5.40 y
2013281283281273280 ± 4.39 x
2014279269274267272 ± 5.24 z
Mean 2 ± SD 3280 ± 1.15 a278 ± 7.65 b275 ± 4.66 c270 ± 2.99 d276
LSD 0.05 soil type0.794
LSD 0.05 cultivar1.33
LSD 0.05 years0.764
LSD 0.05 soil type × cultivar1.72
LSD 0.05 soil type × years1.01
LSD 0.05 cultivar × years1.53
1 Mean for the soil type, regardless of the oat cultivar; 2 Mean for the year 2012–2014; 3 S.D.—standard deviation. Homogeneous groups were created for the main factors. According to Tukey’s test, mean values marked with the same letters do not differ significantly (p ≤ 0.05). Capital letters (A and B) for mean values of the first factor levels—soil types, small letters (a, b, c) for mean values of the second-factor levels—oats cultivars and x, y and z letters for the third-factor levels—study years were chosen. The three-factor ANOVA—first-factor, soil type: Stagnic Luvisol and Haplic Cambisol; second-factor, oat cultivar: ‘Celer’, ‘Furman’, ‘Grajcar’, ‘Kasztan’; third-factor, years: 2012, 2013, 2014.
Table 17. Mahalanobis distances between pairs of combinations of three studied factors.
123456789101112131415161718192021222324
S.L. C. 121
S.L. F. 12262.07
S.L. G. 12352.5215.57
S.L. K. 12451.5512.5213.09
S.L. C. 13574.7358.2961.5657.87
S.L. F. 13664.9284.7881.6579.0447.67
S.L. G. 13765.6579.3475.1774.8443.5519.67
S.L. K. 13854.4449.0245.1246.5235.2445.7634.66
S.L. C. 14967.7828.5936.6830.6339.3272.1668.2242.72
S.L. F. 141068.7154.8650.7255.0949.3859.1845.3824.2455.55
S.L. G. 141159.3957.1952.1955.1244.3544.5731.6817.3654.5419.64
S.L. K. 141255.7630.5127.9730.2841.7361.6152.5221.1130.3728.5629.55
H.C. C. 121345.7853.4149.6944.5876.3387.7388.7669.5355.7187.4780.5663.36
H.C. F. 121461.6632.1235.0130.0344.7672.969.544721.9661.7157.6637.0243.84
H.C. G. 121558.9418.1819.318.5548.8776.4169.8540.2526.4349.349.9926.2449.8622.08
H.C. K. 121628.2345.0234.0136.4765.0965.6260.938.9755.2348.6343.6937.0650.1850.2639.95
H.C. C. 131785.57101.89698.6272.0851.2640.0756.4897.2956.1248.1175.27114.7398.6992.2777.35
H.C. F. 131861.3388.7180.9683.2967.6439.7731.8345.5385.4252.3338.5163.493.6784.379.6657.228.28
H.C. G. 131962.981.7675.0977.3358.7334.7323.6837.67743.6828.3455.2891.6676.7272.6655.429.3413.33
H.C. K. 132061.5369.163.6465.7848.7441.8828.8225.565.8631.2920.0343.5884.9467.1659.5148.0933.626.9520.51
H.C. C. 142161.1145.0942.1743.935.8755.9244.215.8841.7324.1125.2722.4170.7244.7934.0241.6661.254.3446.6930.15
H.C. F. 142258.9153.8849.1150.6940.1846.8734.8217.1149.5623.0218.4828.4974.8950.4142.9941.0754.2645.0536.3224.6716.51
H.C. G. 142366.9741.0739.8142.1935.9559.9148.1620.2135.4424.0526.4316.4973.2341.0732.1447.1869.0261.7952.0838.8415.5422.13
H.C. K. 142470.2643.7641.1145.9150.7570.8558.4829.3448.5720.4531.5825.9680.3453.8137.1746.3168.4763.8856.1539.8219.6627.6620.89
Abbreviations: S.L.—Stagnic Luvisol, H.C.—Haplic Cambisol; C.—‘Celer’, F.—‘Furman’, G.—‘Grajcar’, K.—‘Kasztan’; 12–14—years 2012–2014.
Publisher’s Note: MDPI stays neutral with regard to jurisdictional claims in published maps and institutional affiliations.

