
Effect of Body Weight and Growth in Early Life on the Reproductive Performances of Holstein Heifers


1
Department of Agronomy, Food, Natural resources, Animals and Environment, University of Padova, Viale dell’Università 16, 35020 Legnaro, Italy
2
Experimental Zooprophylactic Institute of Lazio and Toscana “Mariano Aleandri”, Via Appia Nuova 1411, 00178 Rome, Italy
*
Author to whom correspondence should be addressed.
Agriculture 2021, 11(2), 159; https://0-doi-org.brum.beds.ac.uk/10.3390/agriculture11020159
Submission received: 22 January 2021
/
Revised: 5 February 2021
/
Accepted: 13 February 2021
/
Published: 16 February 2021
(This article belongs to the Special Issue Reproduction of Ruminant Livestock)
Abstract
:In Italy most dairy cows produce milk for cheese manufacture and are farmed in intensive systems, with free stall barns, milking parlor or robotic milking, total mixed ration and no (or limited) access to pasture. The main objective for farmers is to maximize farm income and minimize farm costs by adopting strategies and ‘best practices’ in the early life of heifers. Monitoring body weight (BW) and fertility of young stock is fundamental to ensure good performances in future dairy cows and to enhance farm profit. In this study BW (kg) and average daily gain (ADG, kg/d) recorded at different stages in early life of 382 Holstein calves were used to estimate associations with fertility traits. Data consisted of BW at birth (BW0), three BWs (BW1, BW2, and BW3) recorded in three phases of calf’s early life, ADG in the three phases (ADGI, ADGII, and ADGIII), ADG of the entire period (ADGI-III), number of services per pregnancy (NS), and age at first calving (AFC). As expected, the four BWs were positively correlated to each. In general, heavier calves were characterized by better fertility compared to lighter calves. Monitoring BW and ADG in replacement heifers starting from the early age is recommended to improve NS and AFC at farm level and could be useful to set up genetic improvement programs. Future studies will benefit from the addition of milk-related traits and the increase of sample size (number of farms).

1. Introduction
Bovine milk in Italy is mostly intended for cheese manufacture and mostly comes from intensive Holstein farms. Intensive farming systems are characterized by the use of specialized dairy breeds, free stall barns, milking parlor or robotic milking, use of total mixed ration and no access to pasture. More than in extensive low-input production systems, female calves for replacement are an essential resource for intensive commercial dairy farms; however, the management in early stage of life of future cows is often suboptimal and there is room to improve care given to the young stock. Calves reared under suboptimal conditions may face several issues, which may regard growth performance, welfare, and health. For example, an impaired feed intake at the early age of calves could affect productive and reproductive aspects of the future lactating cows. Moreover, some aspects of cows’ performance are primarily related to the age at first calving, which in turn is influenced by body weight (BW) and growth rate [1].
Appropriate feeding strategies and plans adopted in the early life of replacement calves can be translated into a reduction of the age at first insemination, ideally around 15 months of age, and age at first calving, ideally around 24 months of age [1,2,3,4,5,6]. The availability of repeated measurements of the individual BW and growth rate is informative and useful to farmers in order to make informed decisions. Monitoring the BW of future dairy cows is useful for the optimization of insemination plans, for a better herd fertility in the long term, for the improvement of herd productivity in terms of milk yield, and for the reduction of metabolic diseases at the onset of first lactation [7].
In a recent study, the effects of BW at birth, BW at weaning, and average daily gain on reproductive performance of Holstein heifers have been evaluated in a commercial herd [8]. The number of services required for a positive diagnosis of pregnancy were greater (n = 2.42) in animals with low BW at birth than those with medium (n = 2.13) or high BW at birth (n = 2.05), where low and high indicated BW at birth <36 and >39 kg, respectively. The percentage of heifers diagnosed as pregnant after first insemination was lower in animals with low BW at birth than those with high BW at birth. Therefore, it has been demonstrated that calves heavier at birth and at weaning calved earlier than lighter calves [8]. Another study has reported a positive correlation between lifetime milk yield and BW of Holstein cows [9]. According to literature, the genetic selection pursued for decades has led to a progressive deterioration of fertility in Holsteins worldwide [10]; in fact productivity and overall fertility are genetically divergent traits. The correlation between the index for milk yield at 305 days of lactation and the index for fertility was −0.56 in a recent study on Holstein cattle [11]. Nevertheless, very limited information is usually available from commercial farms due to practical difficulties in recording repeated information on calves. The aim of the present study was to evaluate the effect of BW and average daily gain (ADG, kg/d) in the early life of female Holstein calves on age at first calving and number of inseminations per pregnancy.
2. Materials and Methods
2.1. Data Collection
Data of 1020 Holstein cows were originally available for this study. Animals were born between 2014 and 2018 and farmed under intensive system. The farm involved in the study was characterized by free stall barns with twice-a-day total mixed ration and twice-a-day milking. The herd size during the observed period was 280 lactating cows on average, with a replacement rate around 20%.
As regards the calves management routine, immediately after calving the calf was separated from the dam and 2 L of colostrum was administered within 2 h from birth; then 1 L of colostrum was given at the second meal. Subsequently, the diet of calves consisted of 2 L of reconstituted milk in the first 5 days of age, then the volume of milk administered was progressively increased up to 3.5–4 L until 60 days of age. A starter feed was available for calves already from the first week after birth. From the third month of age the volume of milk, ranging from 5 to 6 L per calf, tended to be progressively reduced. In this phase, milk was coupled with gradually higher amounts of feed. After weaning, from the fourth month of age the calves’ diet consisted of the total mixed ration and high-protein feed.
From birth all female calves were periodically weighed by the farm personnel through a specific cattle scale in the early morning. Individual weights were recorded and stored in a management software. For the purpose of this study, only data from 382 cows were considered, as they had complete information (date of birth, age at each BW measurement, first calving date, and fertility records) and were all weighed four times:
- Within 24 h from calving (BW0, kg);
- Between 1 and 3 months of age (BW1, kg);
- Between 2.5 and 5 months of age (BW2, kg);
- Between 4 and 8 months of age (BW3, kg).
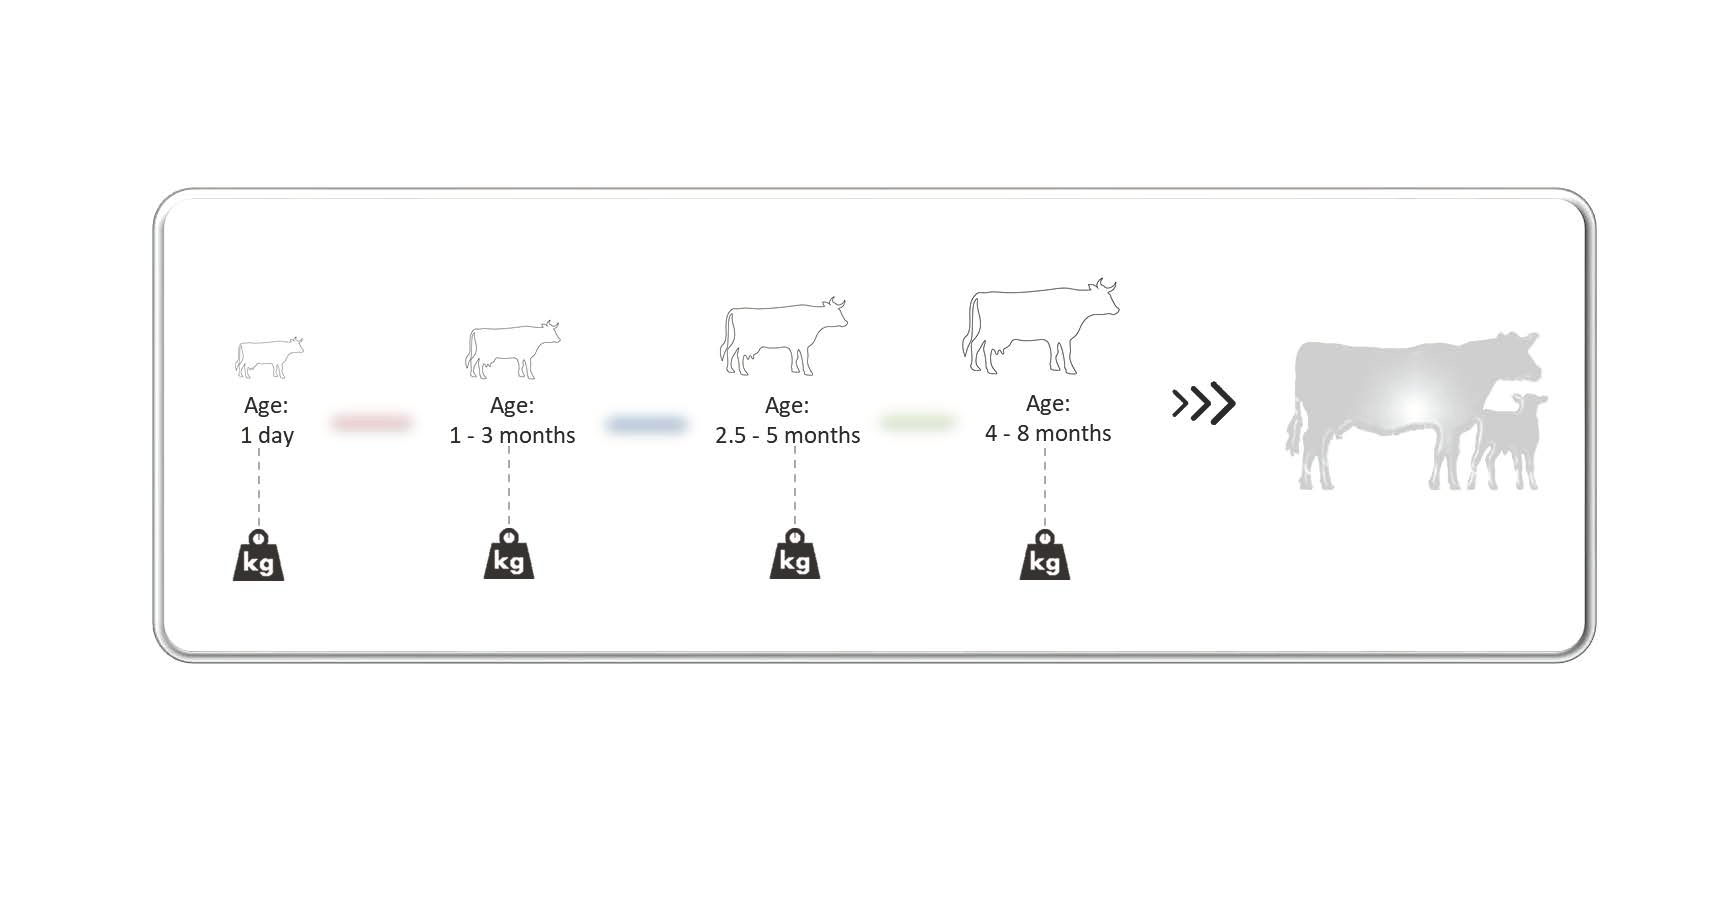
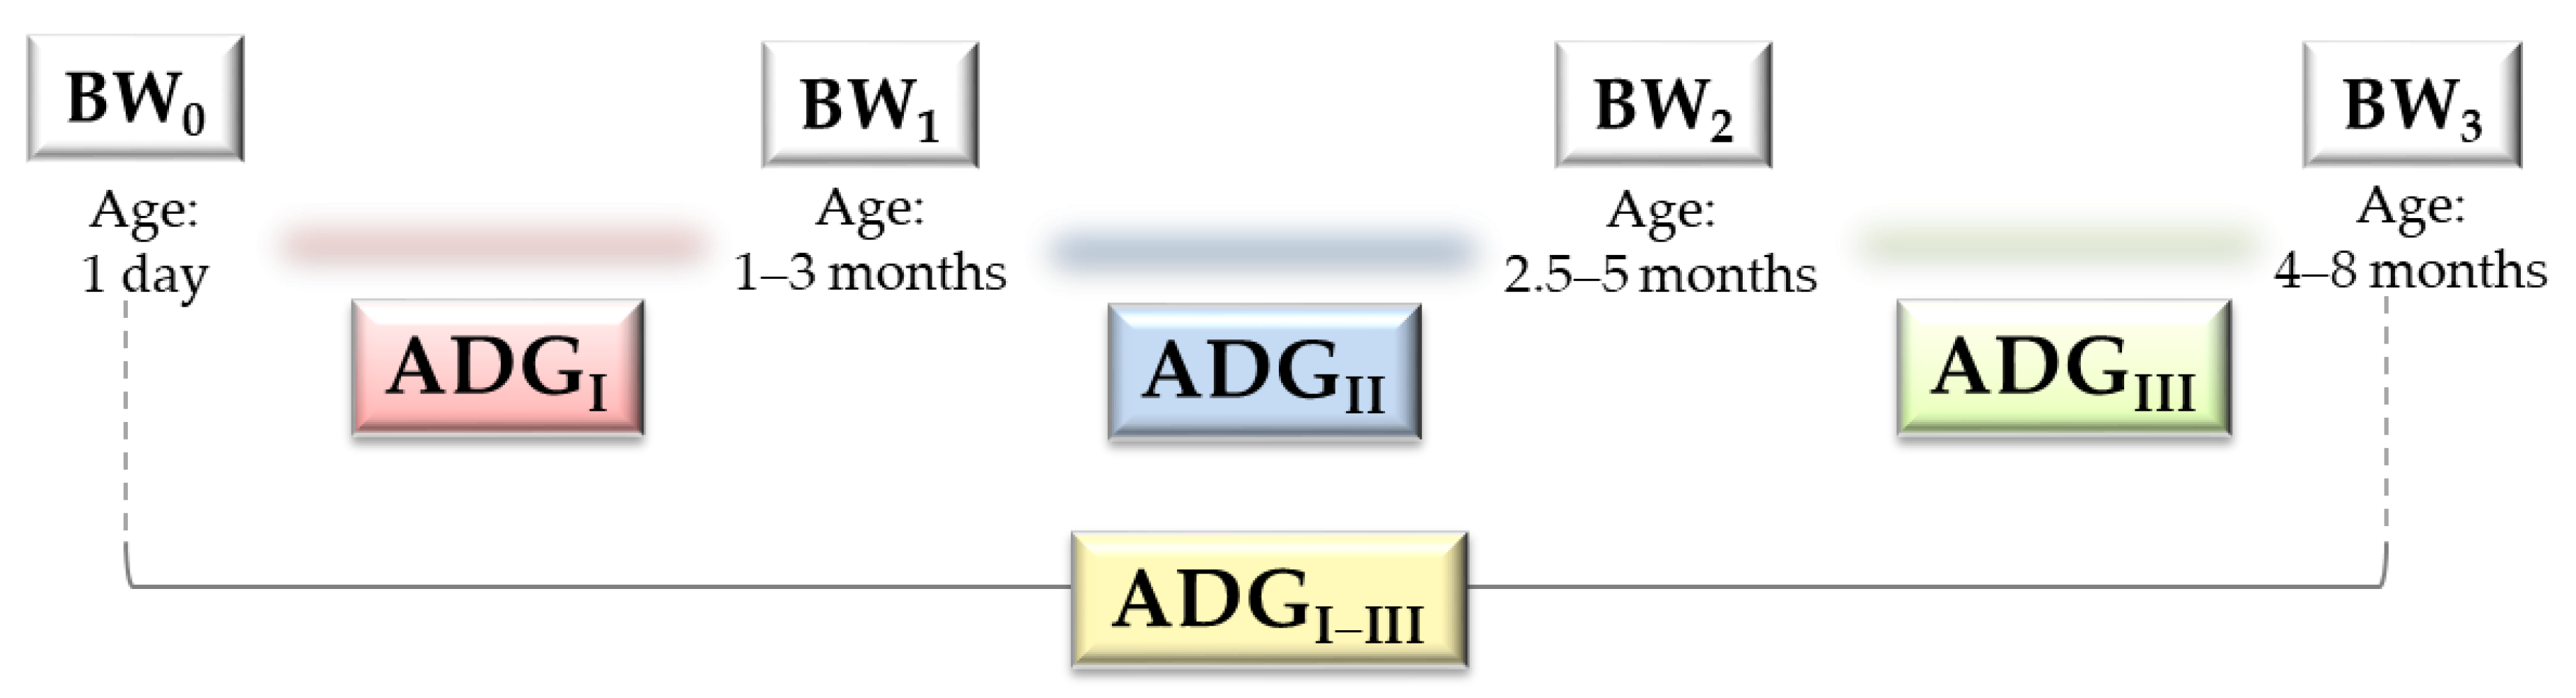
From the four BWs available, the ADG was calculated within different time windows as reported in Figure 1. Animals with one or more ADG outside the range mean ± 3 standard deviations were excluded. Fertility data consisted of the number of services per pregnancy (NS, n) and age at first calving (AFC, mo).
2.2. Statistical Analysis
The PROC CORR of SAS software v. 9.4 (SAS Institute Inc., Cary, NC, USA) was adopted to estimate Pearson correlations between BW traits, and between AFC and BW traits, whereas Spearman correlations were used to estimate associations between NS and BW traits.
For the analysis of variance, BW0, BW1, BW2, BW3, ADGI, ADGII, ADGIII, and ADGI-III were fitted separately in the PROC GLM (SAS software v. 9.4; SAS Institute Inc., Cary, NC, USA) to avoid multicollinearity, as done by other authors [6]. Thus, least squares means of fertility traits were estimated through the following linear model:
where yij is the vector of phenotypic observations of NS or AFC, YS is the fixed effect of the ith year-season of birth (16 levels), Z is the fixed effect of BW or ADG, and eij is the residual term. Each BW and ADG was included as a categorical fixed effect (three classes); in particular, classes were identified by using the mean and the standard deviation of the trait, as:
yij = YSi + Zj + eij,
- Class 1: observation ≤ (mean − 1 standard deviation).
- Class 2: (mean − 1 standard deviation) < observation < (mean + 1 standard deviation).
- Class 3: observation ≥ (mean + 1 standard deviation).
Frequencies for all classes of the fixed effects are reported in Table 1. The Bonferroni post-hoc test was referred to for comparison of least squares means.
3. Results and Discussion
Descriptive statistics of the investigated traits are in Table 2 and agree with results of published studies. In fact, according to the age, BW of Holstein calves should range from 59 to 61 kg (1 months of age), 80 to 86 kg (2 months of age), 102 to 111 kg (3 months of age), 125 to 136 kg (4 months of age), 147 to 161 kg (5 months of age), 169 to 185 kg (6 months of age), 191 to 210 kg (7 months of age) and 213 to 235 kg (8 months of age) [12].
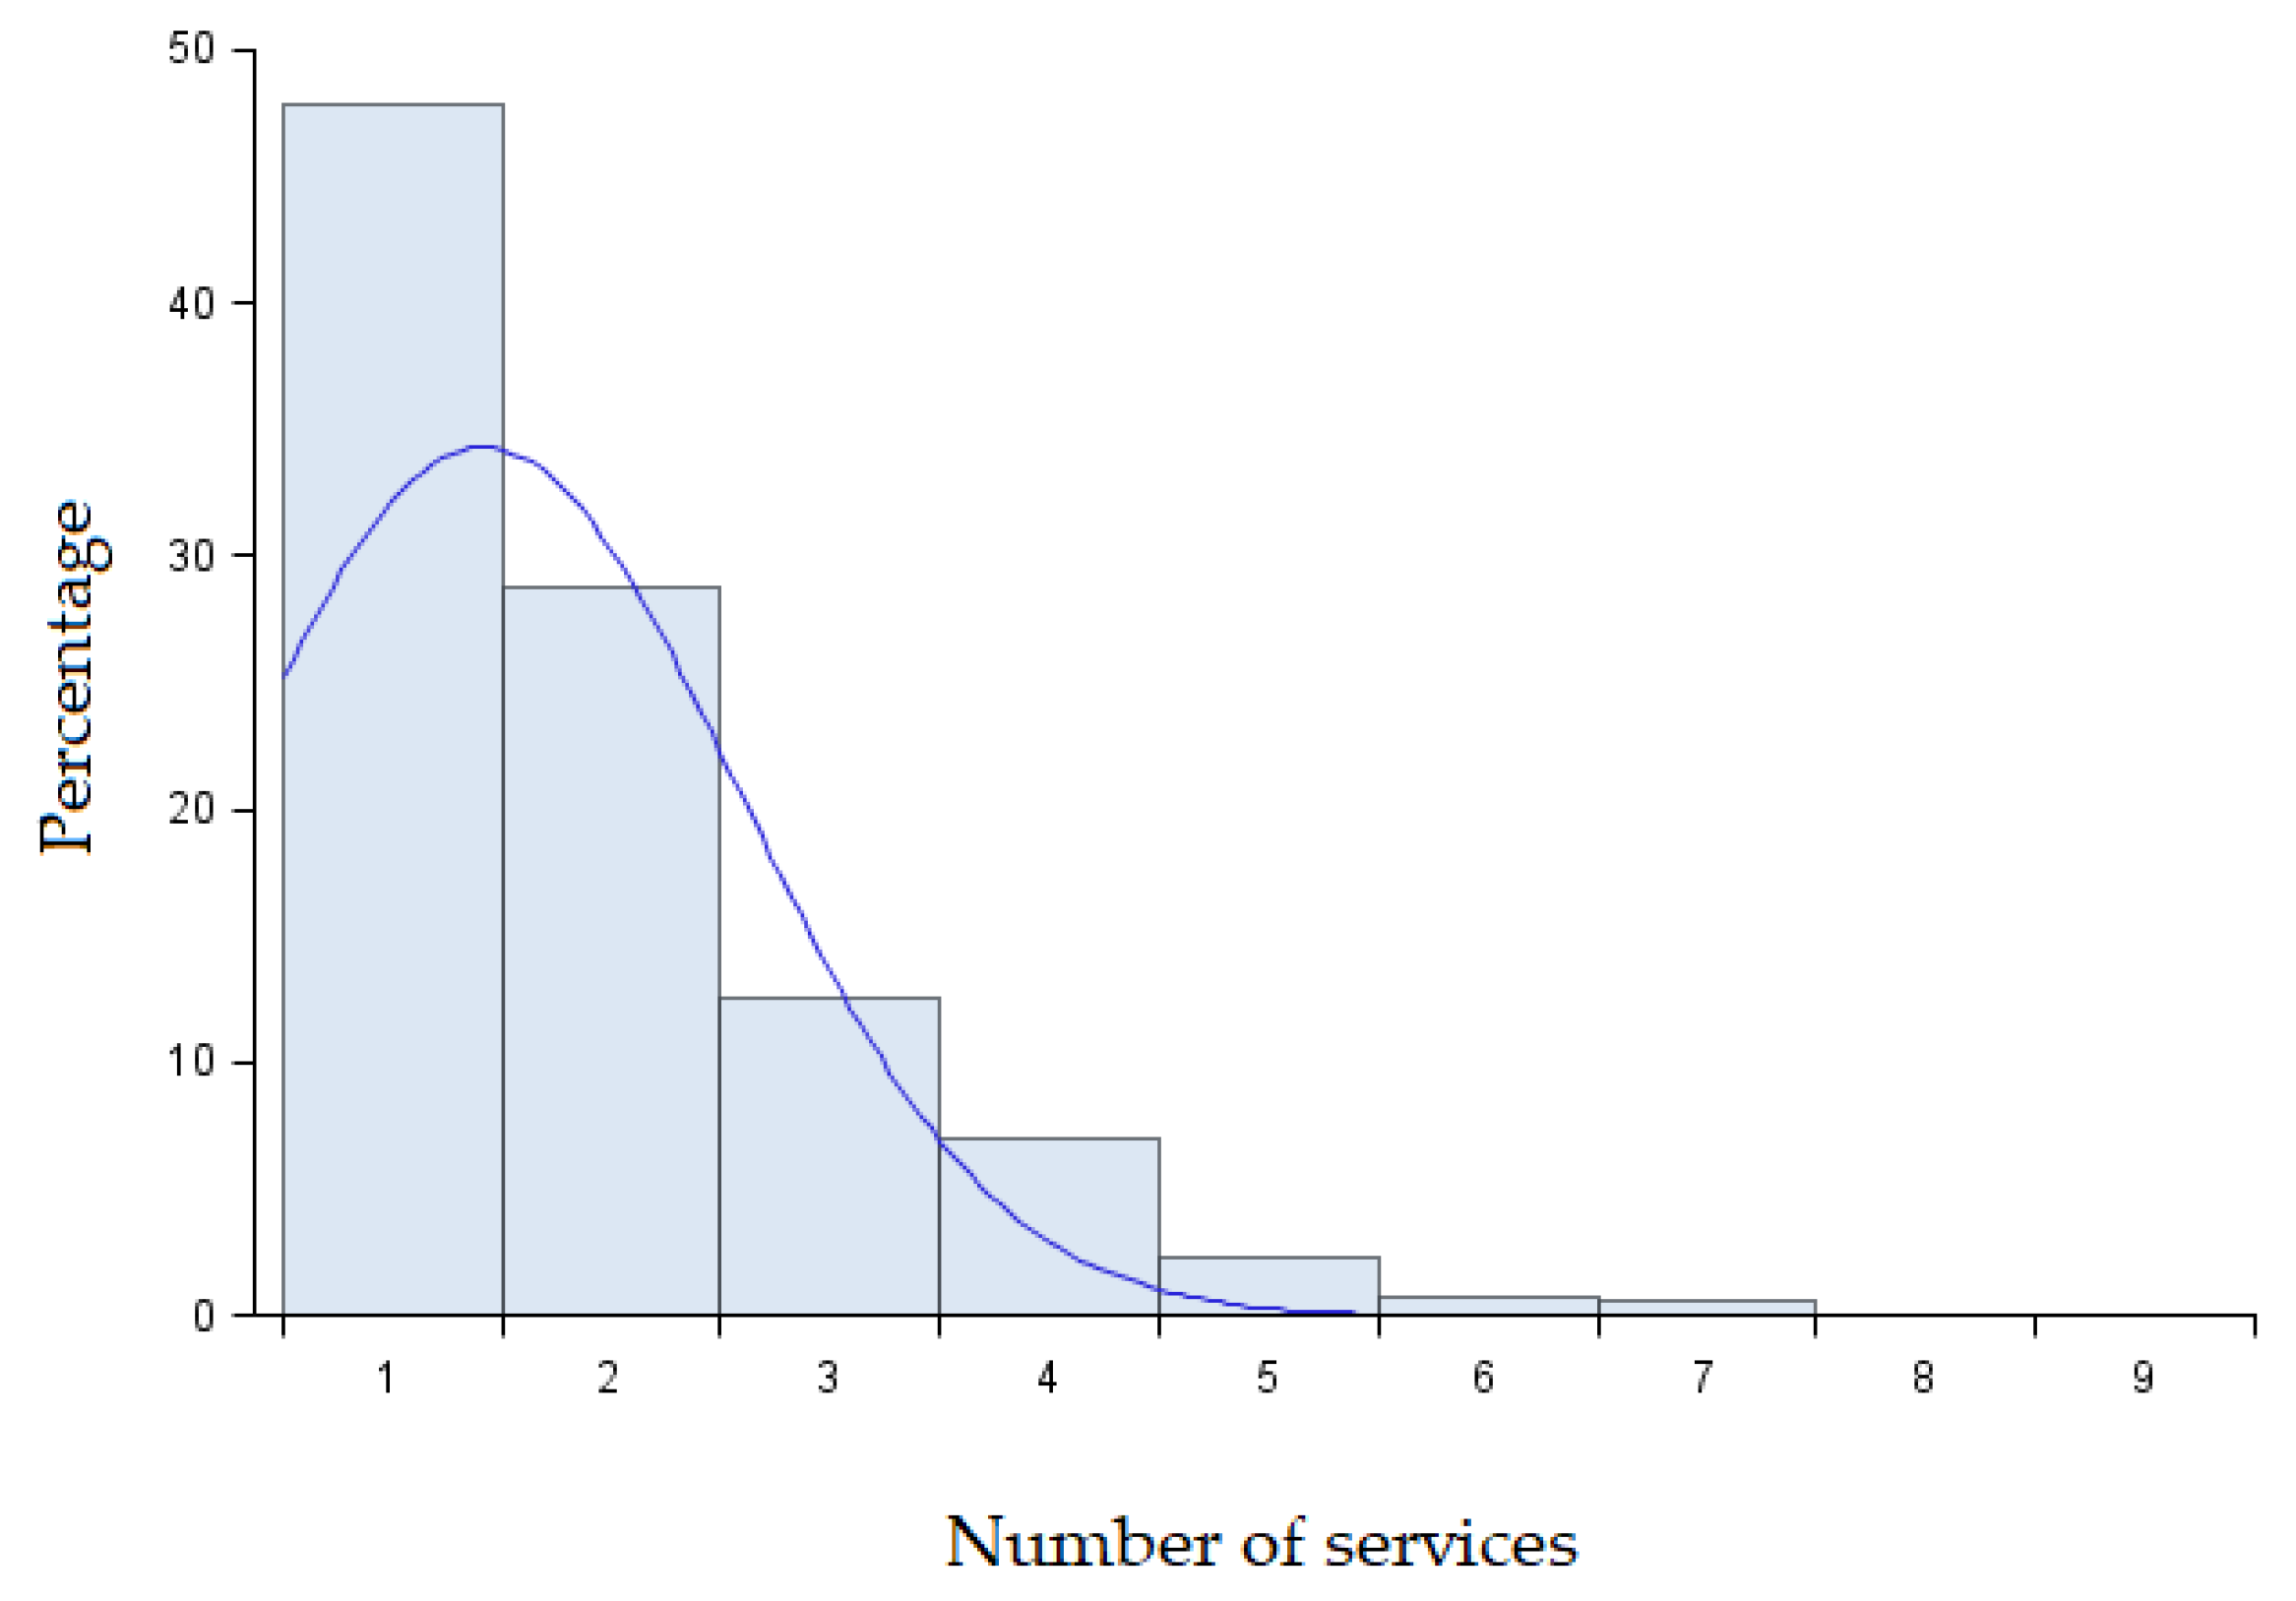
In a recent study on 57,868 data of Holstein calves, mean and standard deviation of BW0 were 41.48 and 4.82 kg, and minimum and maximum values were 20 and 60 kg, respectively [13]. Mean ADG observed in each phase (Table 2) is comparable to findings available in the literature; in particular, the recommended ADG in dairy cattle in the first 30 days of life should vary from 0.68 to 0.82 kg/d in order to reach an optimal BW and body conformation at first calving [14]. The average age at BW1, BW2 and BW3 was 1.99 ± 0.29, 3.25 ± 0.38 and 5.77 ± 0.73 mo, respectively, and the observed minimum and maximum age were 1.19 and 2.83 months for BW1, 2.53 and 4.54 months for BW2, and 4.10 and 7.94 months for BW3. All the investigated traits were normally distributed, except for NS (Figure 2), which showed a positive skewness, as also reported by [15].
The correlations of fertility with BW and ADG traits are summarized in Table 3, and those between BW and ADG traits are presented in Table 4. The NS and AFC were significantly correlated (0.68), suggesting that heifers that needed less inseminations to get pregnant tended to calve earlier compared to cows that needed more inseminations. Despite being weak, the negative correlations (p < 0.01) of AFC with BW0 and BW1 highlighted that heavier animals tended to calve earlier than those with lower BW0 and BW1. In addition, the NS was weakly negatively related to BW3 (p < 0.05), suggesting that heavier animals need less inseminations to get pregnant than lighter animals. Findings are supported by [16], who found negative genetic (−0.34) and phenotypic (−0.21) correlation between AFC and yearling weight in Brown Swiss cattle. All the BW traits were significantly positively correlated to each other (p < 0.001), except for the association between BW0 and BW3 (Table 4). The strongest association was estimated between BW1 and BW2 (0.52). Overall, correlations between the four ADG traits were significant (p < 0.001) and moderate (Table 4), with the strongest calculated between ADGII and ADGI-III (0.51).
The negative association of ADGIII with ADGI and ADGII suggested that animals with higher growth rate in the first weeks of age tended to show a slower growth rate afterwards. Despite this, ADGI-III showed a positive correlation with the other three ADG (p < 0.001), and it was negatively correlated (p < 0.001) with BW0. The BW3 was significantly positively correlated with ADGII, ADGIII, and ADGI-III. These findings agree with previous research in Holstein cattle; in fact, a favorable positive genetic correlation between fertility traits and BW0 has been observed in this specialized dairy breed [13]. In particular, BW0 was favorably genetically correlated with days open (−0.11), weaning weight (0.79), and weight at calving (0.50) [13]. Potentially, it would be possible to work on low-heritable fertility traits by selection on the heifer BW, a phenotype available in the very early life of the future lactating cow and with exploitable heritability.
Results of the analysis of variance are summarized in Table 5. The fixed effect of year-season of birth was significant for both AFC and NS in all models (p < 0.01). By definition, fertility is a complex trait affected by several factors (e.g., feeding, season, genetics, and management) and their interactions; therefore, we expected a low coefficient of determination of the models (Table 5). The least squares means of NS and AFC are presented in Table 6. Significantly lower NS was detected in Class 3 of BW3 compared to Classes 1 and 2, meaning that heavier calves were those with more favorable (lower) NS (n = 1.32) compared to the others (Table 6). Also, significantly greater (i.e., worse) AFC was estimated in Class 1 of BW0 compared to Class 2, and in Class 1 of BW1 compared to Classes 2 and 3 (Table 6), meaning that lighter calves at birth had greater AFC compared to calves that were born heavier, and animals with low BW1 had worse AFC (around +6 mo) compared to animals with medium or high BW1.
A straightforward comparison of such findings with the literature was difficult due to a different definition of the phenotypes and to different observing periods considered. Despite this, results of the present study are generally in agreement with previous research. For instance, [15] investigated fertility and growth performances in Holstein heifers and reported that greater BW was associated with lower (favorable) AFC. Similarly, it has been observed that animals that failed to conceive at 15 months of age were the lightest at 9 months of age [17]. One could argue that lower AFC may lead to lower milk yield, because the development of the mammary gland is not yet completed and part of the energy available is still intended for cow growth [1]; this explains why it is important to find the optimum between fertility and growth of the animals in order to identify the best compromise and the best economic return. For example, different specific nutritional strategies can be adopted to speed up cow growth and anticipate puberty, age at first insemination, and AFC. Obviously, increasing the nutritional input/energy content to overcome the requirement needed for maintenance in early life is translated into a greater ADG. Delayed puberty is observed in presence of ADG < 0.75 kg/d, the optimal for dairy heifers. On the contrary, nutritional deficiency and/or severe health issues in early life of calves are responsible for undesired consequences in the medium to long term [18]. In cattle, puberty depends mostly on age and BW and usually takes place 6 weeks before the target breeding age; farmers should go for an AFC between 23 and 25 mo, i.e., the point that minimizes losses due to the non-productive period and that maximizes the cow fertility. In fact, according to [18], the conception rate of Holstein cows is maximum (57%) between 15 and 16 months of age with a decline afterwards.
4. Conclusions
In this study repeated measurements of BW recorded in early life of 382 female Holstein calves were available to investigate the relationship between growth traits and fertility performances. As expected, heifers that required lower NS were those that calved earlier compared to cows that required repeated NS. The different BW traits available were positively correlated to each other, in particular in the first 5 months of age (BW1 and BW2). Results highlight that heavier animals were characterized by more favorable fertility compared to lighter animals, confirming findings of the literature. Suboptimal NS and AFC could be improved by monitoring both growth and BW of replacement heifers starting from the early age. However, only one herd provided data used for this preliminary study and thus results should be interpreted in the light of this aspect; moreover, kinship was not accounted for in this study due to lack of pedigree information. The analysis will be improved by adding milk-related traits and by including information provided by other farms in order to increase both phenotypic and genetic variability of the traits, estimate the effect of farm management on cows’ fertility traits, and evaluate the association between heifers growth traits (BW and ADG) and milk yield and quality.
Author Contributions
Data curation, A.C.; formal analysis, A.C.; investigation, A.C., M.D.M.; methodology, A.C., M.D.M.; project administration, M.D.M.; supervision, A.C.; validation, A.C., C.B.; visualization, A.C., M.D.M.; writing—original draft, A.C.; writing—review and editing, A.C., C.B., M.D.M. All authors have read and agreed to the published version of the manuscript.
Funding
This research received no external funding.
Institutional Review Board Statement
Not applicable.
Informed Consent Statement
Not applicable.
Data Availability Statement
The data that support the findings of this study are available on request from the corresponding author.
Acknowledgments
The authors would like to thank Alessandro De Rocco, Azienda Agricola La Francescana (Belluno, Italy), and Martina Gazzola (University of Padova, Italy) for support during data collection.
Conflicts of Interest
The authors report no potential conflict of interest. The funders had no role in the design of the study, in the collection, analyses, or interpretation of data, in the writing of the manuscript, or in the decision to publish the results.
References
- Wathes, D.C.; Brickell, J.S.; Bourne, N.E.; Swali, A.; Cheng, Z. Factors influencing heifer survival and fertility on commercial dairy farms. Animal 2008, 2, 1135–1143. [Google Scholar] [CrossRef] [PubMed] [Green Version]
- Place, N.; Heinrichs, A.; Erb, H. The Effects of Disease, Management, and Nutrition on Average Daily Gain of Dairy Heifers from Birth to Four Months. J. Dairy Sci. 1998, 81, 1004–1009. [Google Scholar] [CrossRef]
- Sales, B. L’Importanza di Valutare Pesi e Misure Nelle Vitelle e Manze. Gazz. Semex 2012, 9, 2–5. Available online: https://docplayer.it/6345151-L-importanza-di-valutare-pesi-e-misure-nelle-vitelle-e-manze.html (accessed on 4 January 2021).
- Ettema, J.; Santos, J. Impact of Age at Calving on Lactation, Reproduction, Health, and Income in First-Parity Holsteins on Commercial Farms. J. Dairy Sci. 2004, 87, 2730–2742. [Google Scholar] [CrossRef]
- Hutchison, J.; VanRaden, P.; Null, D.; Cole, J.; Bickhart, D. Genomic evaluation of age at first calving. J. Dairy Sci. 2017, 100, 6853–6861. [Google Scholar] [CrossRef] [PubMed]
- Cooke, J.S.; Cheng, Z.; Bourne, N.E.; Wathes, D.C. Association between growth rates, age at first calving and subsequent fertility, milk production and survival in Holstein-Friesian heifers. Open J. Anim. Sci. 2013, 3, 1–12. [Google Scholar] [CrossRef] [Green Version]
- Campiotti, M.; Bergamini, L. Manze: Allevarle, comprarle o farle allevare? Inf. Agrar. 2011, 20, 11–16. [Google Scholar]
- López, E.; Véliz, F.G.; Carrillo, E.; De Santiago, Á.; García, J.E.; Mellado, M. Effect of birth weight, weaning weight and preweaning weight gain on fertility of holstein heifers under hot mexican conditions. Slov. Vet. Res. 2018, 55, 35–42. [Google Scholar] [CrossRef] [Green Version]
- Handcock, R.; Lopez-Villalobos, N.; McNaughton, L.; Back, P.; Edwards, G.; Hickson, R. Positive relationships between body weight of dairy heifers and their first-lactation and accumulated three-parity lactation production. J. Dairy Sci. 2019, 102, 4577–4589. [Google Scholar] [CrossRef] [PubMed] [Green Version]
- Butler, W. Energy balance relationships with follicular development, ovulation and fertility in postpartum dairy cows. Livest. Prod. Sci. 2003, 83, 211–218. [Google Scholar] [CrossRef]
- Gutiérrez-Reinoso, M.A.; Aponte, P.M.; Cabezas, J.; Rodriguez-Alvarez, L.; Garcia-Herreros, M. Genomic Evaluation of Primiparous High-Producing Dairy Cows: Inbreeding Effects on Genotypic and Phenotypic Production–Reproductive Traits. Animal 2020, 10, 1704. [Google Scholar] [CrossRef]
- Looper, M.; Bethard, G. Management considerations in Holstein heifer development. Guide B-118. Cooperative Extension Service College of Agriculture and Home Economics, New Mexico State University. Available online: https://aces.nmsu.edu/pubs/_b/B118/ (accessed on 4 January 2021).
- Yin, T.; Kȍnig, S. Genetic parameters for body weight from birth to calving and associations between weights with test-day, health, and female fertility traits. J. Dairy Sci. 2018, 101, 2158–2170. [Google Scholar] [CrossRef] [Green Version]
- Chang, Y.; Andersen-Ranberg, I.; Heringstad, B.; Gianola, D.; Klemetsdal, G. Bivariate Analysis of Number of Services to Conception and Days Open in Norwegian Red Using a Censored Threshold-Linear Model. J. Dairy Sci. 2006, 89, 772–778. [Google Scholar] [CrossRef]
- Brickell, J.; Bourne, N.; McGowan, M.; Wathes, D. Effect of growth and development during the rearing period on the subsequent fertility of nulliparous Holstein-Friesian heifers. Theriogenology 2009, 72, 408–416. [Google Scholar] [CrossRef] [PubMed]
- Del Carmen Chin-Colli, R.; Estrada-León, R.; Magaña-Monforte, J.; Segura-Correa, J.; Núñez-Domínguez, R. Genetic parameters for growth and reproductive traits of Brown Swiss cattle from Mexico. Ecosistemas Recur. Agropecu. 2016, 3, 11–20. [Google Scholar]
- Bourne, N.; Swali, A.; Jones, A.K.; Potterton, S.; Wathes, D.C. The effects of size and age at first calving on subsequent fertility in dairy cows. In Reproduction in Domestic Ruminants V.; Juengel, J.L., Murray, J.F., Smith, M.F., Eds.; Nottingham University Press: Nottingham, UK, 2007; p. 526. [Google Scholar]
- Wathes, D.; Pollott, G.; Johnson, K.; Richardson, H.; Cooke, J. Heifer fertility and carry over consequences for life time production in dairy and beef cattle. Animal 2014, 8, 91–104. [Google Scholar] [CrossRef] [PubMed] [Green Version]
Figure 1.
Calves’ body weight (BW) recorded at birth (BW0) and in subsequent moments (BW1, BW2, and BW3) and average daily gain (ADG) calculated in different periods (ADGI, ADGII, ADGIII, and ADGI-III).
Figure 1.
Calves’ body weight (BW) recorded at birth (BW0) and in subsequent moments (BW1, BW2, and BW3) and average daily gain (ADG) calculated in different periods (ADGI, ADGII, ADGIII, and ADGI-III).

Figure 2.
Distribution of the number of services per pregnancy.


Table 1.
Frequency (%) of cows (n = 382) in the different classes of traits.
| Trait 1 | Class | ||
|---|---|---|---|
| 1 | 2 | 3 | |
| BW0 | 13.09 | 72.77 | 14.14 |
| BW1 | 17.01 | 64.40 | 18.59 |
| BW2 | 14.66 | 67.54 | 17.80 |
| BW3 | 17.28 | 68.06 | 14.66 |
| ADGI | 15.71 | 69.63 | 14.66 |
| ADGII | 15.45 | 69.63 | 14.92 |
| ADGIII | 13.09 | 75.65 | 11.26 |
| ADGI-III | 14.92 | 69.63 | 15.45 |
1 BW0, body weight at birth; BW1, body weight recorded between 1 and 3 months of age; BW2, body weight recorded between 2.5 and 5 months of age; BW3, body weight recorded between 4 and 8 months of age; ADGI, average daily gain calculated between BW0 and BW1; ADGII, average daily gain calculated between BW1 and BW2; ADGIII, average daily gain calculated between BW2 and BW3; ADGI-III, average daily gain of the whole period, i.e., calculated between BW0 and BW3.
Table 2.
Descriptive statistics of the traits available for the 382 cows involved in the study.
| Trait 1 | Mean | Standard Deviation | Minimum | Maximum |
|---|---|---|---|---|
| BW0, kg | 39.62 | 4.85 | 23.00 | 54.00 |
| BW1, kg | 76.72 | 9.80 | 53.00 | 99.00 |
| BW2, kg | 121.20 | 16.49 | 83.00 | 199.00 |
| BW3, kg | 191.14 | 22.96 | 127.60 | 263.30 |
| ADGI, kg/d | 0.61 | 0.10 | 0.31 | 0.84 |
| ADGII, kg/d | 1.17 | 0.19 | 0.64 | 1.76 |
| ADGIII, kg/d | 0.90 | 0.18 | 0.06 | 1.38 |
| ADGI-III, kg/d | 0.86 | 0.07 | 0.70 | 0.95 |
| NS, n | 1.92 | 1.16 | 1.00 | 7.00 |
| AFC, months | 23.22 | 1.21 | 20.49 | 27.44 |
1 BW0, body weight at birth; BW1, body weight recorded between 1 and 3 months of age; BW2, body weight recorded between 2.5 and 5 months of age; BW3, body weight recorded between 4 and 8 months of age; ADGI, average daily gain calculated between BW0 and BW1; ADGII, average daily gain calculated between BW1 and BW2; ADGIII, average daily gain calculated between BW2 and BW3; ADGI-III, average daily gain of the whole period, i.e., calculated between BW0 and BW3; NS, number of services; AFC, age at first calving.
Table 3.
Pearson correlations between age at first calving (AFC) and growth traits, and Spearman ranking correlations between number of services per pregnancy (NS) and growth traits.
Table 3.
Pearson correlations between age at first calving (AFC) and growth traits, and Spearman ranking correlations between number of services per pregnancy (NS) and growth traits.
| Trait 1 | AFC, mo | NS, n |
|---|---|---|
| BW0, kg | −0.12 ** | −0.01 |
| BW1, kg | −0.14 ** | −0.04 |
| BW2, kg | −0.07 | 0.04 |
| BW3, kg | 0.05 | −0.10 * |
| ADGI, kg/d | −0.09 ⴕ | −0.00 |
| ADGII, kg/d | −0.04 | 0.02 |
| ADGIII, kg/d | 0.09 ** | −0.03 |
| ADGI-III, kg/d | 0.01 | −0.01 |
1 BW0, body weight at birth; BW1, body weight recorded between 1 and 3 months of age; BW2, body weight recorded between 2.5 and 5 months of age; BW3, body weight recorded between 4 and 8 months of age; ADGI, average daily gain calculated between BW0 and BW1; ADGII, average daily gain calculated between BW1 and BW2; ADGIII, average daily gain calculated between BW2 and BW3; ADGI-III, average daily gain of the whole period, i.e., calculated between BW0 and BW3. ⴕ p < 0.10, * p < 0.05, ** p < 0.01
Table 4.
Pearson correlations between body weight (BW) and average daily gain (ADG) traits.
| Trait 1 | BW0, kg | BW1, kg | BW2, kg | BW3, kg | ADGI, kg/d | ADGII, kg/d | ADGIII, kg/d |
|---|---|---|---|---|---|---|---|
| BW1, kg | 0.34 *** | . | . | . | . | . | . |
| BW2, kg | 0.22 *** | 0.52 *** | . | . | . | . | . |
| BW3, kg | −0.02 | 0.09 ⴕ | 0.02 | . | . | . | . |
| ADGI, kg/d | −0.15 *** | 0.70 *** | 0.48 *** | 0.01 | . | . | . |
| ADGII, kg/d | 0.07 | 0.23 *** | 0.43 *** | 0.10 * | 0.19 *** | . | . |
| ADGIII, kg/d | −0.12 ** | −0.27 *** | −0.43 *** | 0.44 *** | −0.32 *** | −0.27 *** | . |
| ADGI-III, kg/d | −0.18 *** | 0.03 | 0.23 *** | 0.59 *** | 0.24 *** | 0.39 *** | 0.51 *** |
1 BW0, body weight at birth; BW1, body weight recorded between 1 and 3 months of age; BW2, body weight recorded between 2.5 and 5 months of age; BW3, body weight recorded between 4 and 8 months of age; ADGI, average daily gain calculated between BW0 and BW1; ADGII, average daily gain calculated between BW1 and BW2; ADGIII, average daily gain calculated between BW2 and BW3; ADGI-III, average daily gain of the whole period, i.e., calculated between BW0 and BW3. ⴕ p < 0.10, * p < 0.05, ** p < 0.01, *** p < 0.001
Table 5.
Significance (p-value) of fixed effects included in the analysis of variance for age at first calving (AFC) and number of services per pregnancy (NS), and coefficient of determination of the models (R2).
Table 5.
Significance (p-value) of fixed effects included in the analysis of variance for age at first calving (AFC) and number of services per pregnancy (NS), and coefficient of determination of the models (R2).
| Fixed Effect 1 | AFC, Months | NS, n | ||
|---|---|---|---|---|
| p-Value | R2 | p-Value | R2 | |
| BW0 | 0.043 | 0.134 | 0.958 | 0.082 |
| BW1 | 0.021 | 0.137 | 0.361 | 0.087 |
| BW2 | 0.485 | 0.122 | 0.201 | 0.900 |
| BW3 | 0.930 | 0.118 | 0.005 | 0.108 |
| ADGI | 0.182 | 0.127 | 0.886 | 0.082 |
| ADGII | 0.079 | 0.131 | 0.863 | 0.082 |
| ADGIII | 0.256 | 0.125 | 0.714 | 0.083 |
| ADGI-III | 0.710 | 0.120 | 0.147 | 0.091 |
1 BW0, body weight at birth; BW1, body weight recorded between 1 and 3 months of age; BW2, body weight recorded between 2.5 and 5 months of age; BW3, body weight recorded between 4 and 8 months of age; ADGI, average daily gain calculated between BW0 and BW1; ADGII, average daily gain calculated between BW1 and BW2; ADGIII, average daily gain calculated between BW2 and BW3; ADGI-III, average daily gain of the whole period, i.e., calculated between BW0 and BW3.
Table 6.
Least squares means 1 (standard error) of fixed effects for age at first calving (AFC) and number of services per pregnancy (NS).
Table 6.
Least squares means 1 (standard error) of fixed effects for age at first calving (AFC) and number of services per pregnancy (NS).
| Fixed Effect 2 | Class | AFC, Months | NS, n |
|---|---|---|---|
| BW0 | 1 | 23.45 (0.18) a | 1.84 (0.18) |
| 2 | 22.99 (0.10) b | 1.80 (0.11) | |
| 3 | 23.13 (0.18) ab | 1.77 (0.18) | |
| BW1 | 1 | 23.48 (0.17) a | 2.00 (0.17) |
| 2 | 23.06 (0.11) b | 1.76 (0.11) | |
| 3 | 22.96 (0.16) b | 1.79 (0.16) | |
| BW2 | 1 | 23.15 (0.18) | 1.57 (0.18) |
| 2 | 23.14 (0.11) | 1.87 (0.11) | |
| 3 | 22.94 (0.17) | 1.72 (0.16) | |
| BW3 | 1 | 23.13 (0.18) | 2.06 (0.17) a |
| 2 | 23.10 (0.11) | 1.80 (0.11) a | |
| 3 | 23.04 (0.19) | 1.32 (0.18) b | |
| ADGI | 1 | 23.35 (0.18) | 1.87 (0.18) |
| 2 | 23.10 (0.11) | 1.79 (0.11) | |
| 3 | 22.92 (0.17) | 1.79 (0.17) | |
| ADGII | 1 | 23.42 (0.18) | 1.75 (0.18) |
| 2 | 23.06 (0.11) | 1.82 (0.1) | |
| 3 | 22.92 (0.18) | 1.75 (0.18) | |
| ADGIII | 1 | 22.91 (0.19) | 1.89 (0.18) |
| 2 | 23.11 (0.11) | 1.77 (0.10) | |
| 3 | 23.32 (0.20) | 1.89 (0.20) | |
| ADGI-III | 1 | 23.18 (0.22) | 1.95 (0.22) |
| 2 | 23.12 (0.12) | 1.85 (0.11) | |
| 3 | 22.90 (0.27) | 1.32 (0.27) |
1 Means with different superscript letters within trait and fixed effect indicate significant differences (p < 0.05). 2 BW0, body weight at birth; BW1, body weight recorded between 1 and 3 months of age; BW2, body weight recorded between 2.5 and 5 months of age; BW3, body weight recorded between 4 and 8 months of age; ADGI, average daily gain calculated between BW0 and BW1; ADGII, average daily gain calculated between BW1 and BW2; ADGIII, average daily gain calculated between BW2 and BW3; ADGI-III, average daily gain of the whole period, i.e., calculated between BW0 and BW3.
Publisher’s Note: MDPI stays neutral with regard to jurisdictional claims in published maps and institutional affiliations. |
© 2021 by the authors. Licensee MDPI, Basel, Switzerland. This article is an open access article distributed under the terms and conditions of the Creative Commons Attribution (CC BY) license (http://creativecommons.org/licenses/by/4.0/).
Share and Cite
MDPI and ACS Style
Costa, A.; Boselli, C.; De Marchi, M. Effect of Body Weight and Growth in Early Life on the Reproductive Performances of Holstein Heifers. Agriculture 2021, 11, 159. https://0-doi-org.brum.beds.ac.uk/10.3390/agriculture11020159
AMA Style
Costa A, Boselli C, De Marchi M. Effect of Body Weight and Growth in Early Life on the Reproductive Performances of Holstein Heifers. Agriculture. 2021; 11(2):159. https://0-doi-org.brum.beds.ac.uk/10.3390/agriculture11020159
Chicago/Turabian StyleCosta, Angela, Carlo Boselli, and Massimo De Marchi. 2021. "Effect of Body Weight and Growth in Early Life on the Reproductive Performances of Holstein Heifers" Agriculture 11, no. 2: 159. https://0-doi-org.brum.beds.ac.uk/10.3390/agriculture11020159
Note that from the first issue of 2016, this journal uses article numbers instead of page numbers. See further details here.